Embed Size (px)
Citation preview

NASA and Exploring (Oceans)
Dr. Paula BontempiOcean Biology and Biogeochemistry ProgramNASA Headquarters
www.nasa.gov
National Aeronautics and Space Administration

EXPLORATION
DISCOVERY
RESEARCH
Science on the Living Earth or Another Planet
Exploration and NASA

5columns
• Astro• Helio• Planetary• Earth• SpaceResearch

4

NASA’s Earth Science Division Research Flight
Applied Sciences Technology

Landsat 9 PACE
NI-SAR SWOT
TEMPO JPSS-2 (NOAA) RBI, OMPS-Limb
GRACE-FO (2) ICESat-2
CYGNSS ISS
SORCE, TCTE (NOAA)
NISTAR, EPIC (NOAA’S DSCOVR)
QuikSCAT
EO-1 Landsat 7 (USGS) Terra
Aqua
CloudSat
CALIPSO
Aura
SMAP
Suomi NPP (NOAA)
Landsat 8 (USGS)
GPM
OCO-2
GRACE (2) OSTM/Jason 2 (NOAA)
Formulation Implementation Primary Ops Extended Ops
Earth Science Instruments on ISS: RapidScat, CATS, LIS, SAGE III (on ISS), TSIS-1, OCO-3, ECOSTRESS, GEDI, CLARREO-PF
Sentinel-6A/B

7 94th AMS Meeting, 5 February 2014, Atlanta, GA
SAGE III (CY2016) CATS (2015-)
HICO (2009-2014) GEDI (2020)
ECOSTRESS (2020) RapidSCAT (2014-)
ISERV (2012-2015)
LIS (2016)
Earth
CLARREO Pathfinders (CY2019)


10/16–5/17
FY17/21
FY18
FY18
FY19FY19
FY18/20FY17FY20/22
FY18/21FY19/21
FY20 FY22FY22 FY20/24
OCO-3FY17/18


Earth’s Circulatory System

Ocean Salinity and Daily Argo Coverage

SUSTAINABLE FISHERIES Fisheries depend on a healthy, balanced ocean. Earth-observations from NASA and its partners allow scientists to monitor and predict change in the ocean that influence ocean productivity (e.g., El Niño and La Niña) as well as the overall health of our planet. From the tiniest of organisms (e.g., phytoplankton) to global ocean temperatures, NASA keeps many “eyes” on our living planet.

SeaWiFS Biosphere Data Over the North Atlantic

MARINE PROTECTED AREAS A marine protected area is an area of sea especially dedicated to the protection and maintenance of biodiversity, and of natural and associated cultural resources, and managed through legal or other effective means. Marine parks, nature reserves and other marine protected areas can include: reefs, seagrass beds, shipwrecks, archaeological sites, tidal lagoons, mudflats, saltmarshes, mangroves, rock platforms, underwater areas on the coast and seabed in deep water. NASA satellite data can be used to understand and model ocean ecosystem health.

Monitoring Coral Reefs Hot Spots

Coastal Dead Zones

Phytoplankton in the World’s Oceans
19
Pre-Aerosol,Cloud,oceanEcosystem(PACE)Mission

The oceans are different.
Back in 1960 when people descended to the deepest part of the ocean for the very first (and last) time, they turned on the outside lights and
there, in front of the viewport at a depth of over seven miles (35,802 ft (10,912 m)), was a strange looking
little fish looking back at them.
This "flatfish at the very nadir of the earth" was living at a place where the water pressure was more than 8 tons per square inch, or the equivalent of
one person trying to support 50 jumbo jets.
You could cut Mount Everest off at sea level and put in on the ocean floor
at the bottom of the Marianas Trench, where that little fish was
swimming, and there would still be over a mile of water over the top of
it.

While we may think that the only mysteries left to discover await us on distant planets, there are still plenty of wondrous creatures to study and incredible places waiting to be
explored right here in our own backyard....especially in the ocean.
The blue whale, Balaenoptera musculus, is the largest known animal ever to have lived on sea or land and can reach more than 110 feet and weigh nearly 200 tons - more than
the weight of 50 adult elephants?
One recent study of a deep-sea community revealed 898 species from more than 100 families and a dozen phyla in an area about half the size of a tennis court. More than
half of these were new to science.
Consider the fact that there exists a creature in the oceans that we know to be the world's largest invertebrate, that can grow to at least 60 feet in length, has eyes as large as volleyballs but which has never been seen alive in its' natural habitat. Although the
Giant Squid may be the stuff of legend, it is very real indeed and is just one of the as yet unsolved mysteries of the ocean.

4/26/16
Drs. Eric Lindstrom (Physical Oceanography) & Paula Bontempi (Ocean Biology and Biogeochemistry) NASA Headquarters, Washington, DC
NASA Oceanography Program Overview

Where does NASA Oceanography fit into the overall NASA mission?
• Earth Science Division (ESD) Strategic Goal: – Advance knowledge of Earth as a system to meet the
challenges of environmental change and to improve life on our planet.
• ESD Science Questions: – How is the global Earth system changing? – What causes these changes in the Earth system? – How will the Earth system change in the future? – How can Earth system science provide societal benefit?

Physical Oceanography Program Manager: Eric Lindstrom
• Support Physical Oceanography Missions on Orbit – Jason-2 (Altimetry), QuikSCAT (Winds), Aquarius (Salinity), GRACE (Gravity),
RapidSCAT (Winds) • Support Physical Oceanography Missions in Development
– Surface Water and Ocean Topography (SWOT), Jason-3 (Altimetry), • Support Research Teams
– Ocean Surface Topography (OSTST), Ocean Vector Winds (OVWST), Ocean Salinity (OSST), Next Generation SST (GHRSST), Atlantic Meridional Overturning Circulation (AMOC), Sea Level Change
• Support Climate Focus Area/Ocean Observing – US CLIVAR, USGCRP, GOOS, GCOS, OOPC, GODAE OceanView, NOAA
COSC, IOOC, CEOS, ….
• Process Studies Related to NASA Physical Oceanography Missions – Salinity Processes in the Upper ocean Regional Study: SPURS-1 (2012-2015) – Salinity Processes in the Upper ocean Regional Study: SPURS-2 (2015-2018)
Mission&Architecture&
Oceanography: Characterize the ocean mesoscale and sub-mesoscale circulation at spatial resolutions of 15 km and greater.
Hydrology: To provide a global inventory of all terrestrial water bodies whose surface area exceeds (250m)2 (lakes, reservoirs, wetlands) and rivers whose width exceeds 100 m (rivers).
• To measure the global storage change in fresh water bodies at sub-monthly, seasonal, and annual time scales.
• To estimate the global change in river discharge at sub-monthly, seasonal, and annual time scales.
Mission Science
• Ka-band SAR interferometric (KaRIn) system with 2 swaths, 50 km each
• Produces heights and co-registered all-weather imagery
• Use conventional Jason-class altimeter for nadir coverage, radiometer for wet-tropospheric delay, and GPSP/DORIS/LRA for orbit determination.
• On-Board interferometric SAR processing over the ocean (1 km2 resolution) for data vol. reduction.
• Partnered mission with CNES & CSA & UKSA • Science mission duration of 3 years • Cal orbit: 857 km, 77.6º Incl., 1 day repeat • Science orbit: 891 km, 77.6º Incl., 21 day repeat • Flight System: ~2300kg, ~2000W • Launch Vehicle: NASA Medium class • Cat 2 Project, Risk Class: C • Target Launch Readiness: Oct 2020

Salinity Processes in the Upper ocean Regional Study (SPURS)
What is controlling the upper ocean salinity? This question is addressed with interagency/international collaboration of measurements from satellites, ships, drifting surface buoys & profiling floats, gliders, AUVs and theoretical & numerical model simulations.
Sea Surface Salinity
http://spurs.jpl.nasa.gov
Motivation Launch of the Aquarius/SAC-D satellite motivates plans for field campaigns in the salinity maximum and minimum region of the North Atlantic and Eastern Tropical Pacific.

Ocean Biology and Biogeochemistry Program Manager: Paula Bontempi
• Support Ocean Color Missions on Orbit – Aqua (MODIS), Suomi NPP (VIIRS)
• Support Ocean Color Missions in Development – PACE, GEO-CAPE, ACE, HyspIRI
• Support Research Teams – Ocean Color, MODIS, Suomi NPP, PACE ST
• Support Carbon Focus Area/Ocean Observing
• Process Studies Related to NASA Ocean Color Missions – Impacts of Climate on the Eco-Systems and Chemistry of the Arctic Pacific Environment (ICESCAPE)
(2010-2011) – Ship Aircraft Bio-Optical Research (SABOR) campaign (summer 2014) – EXport Processes in the Ocean from RemoTe Sensing (EXPORTS: 2017-2022) – Field Campaign Scoping Study: Arctic COastal Land Ocean inteRactions Scoping study (Arctic-
COLORS) (A. Mannino, NASA GSFC) – Field Campaign Scoping Study: Interdisciplinary Coordinated Experiment of the Southern Ocean
Carbon Cycle (ICESOCC) (G. Mitchell, Scripps/UCSD)

EXport Processes in the Ocean from RemoTe Sensing (EXPORTS)
What is the role and interaction between planktonic ecosystem characteristics and the functioning of the ocean’s biological pump?
Develop a predictive understanding of the export and fate of global ocean PP and its implications for the Earth’s Carbon Cycle in present and future climates - satellites, ships, profiling floats,
gliders, and model simulations.
http://cce.nasa.gov/obb/exports/index.html
Motivation Advances in remote sensing (e.g.,
PACE) and autonomous tools.
Station P
North Atlantic
First ICESCAPE results14 June 2012

Alaska
Arctic Ocean
ChukchiSea
Beaufort Sea


0
0.1
0.2
0.3
0.4
0.5
ICESCAPE
PHYTOPLANKTON ABUNDANCE GLOBALLY
Globalaverage
0 200 400 600 800 1000 1200 1400Total water column Chlorophyll (mg m-2)
Prob
abili
ty d
ensi
ty fu
nctio
n
Most Phytoplankton Anywhere?
Max
imum
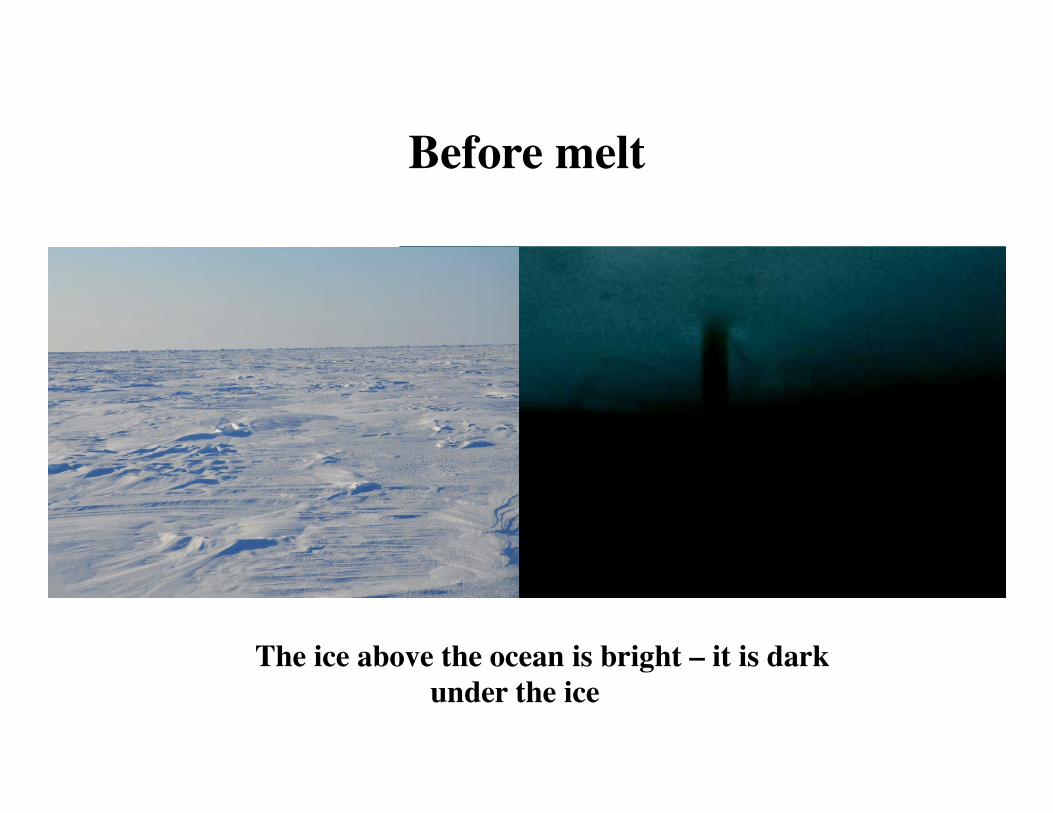
Before melt
The ice above the ocean is bright – it is dark under the ice

After melt
The above ice is darker – much more light is transmitted under the ice

Light and nutrients = phytoplankton bloom
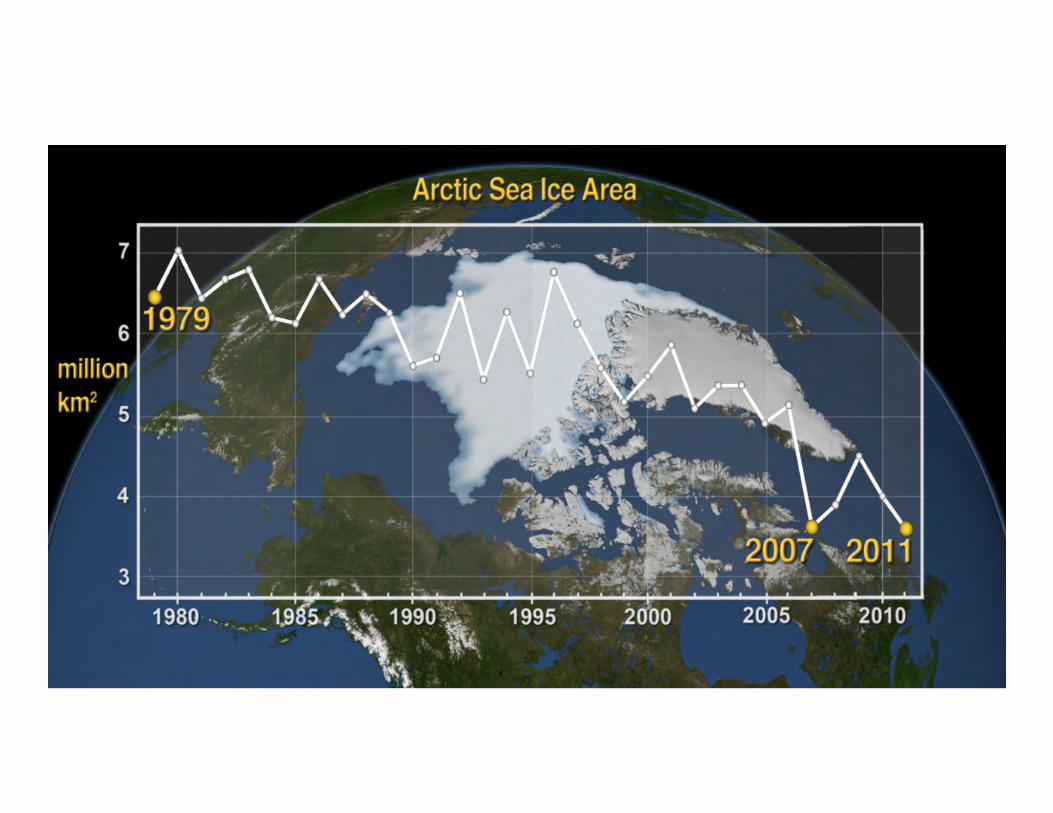

1979 2011
Arctic Ocean Greenland
Alaska
Greenland Arctic Ocean
Alaska


Backup

42

EarthVentureSuborbital–2:InvesTgaTons
O M G ( O c e a n s M e l t i n g Greenland): Investigate the role of warmer, saltier Atlantic subsurface waters in Greenland glacier melting; Josh Willis, JPL
NAAMES (Nor th A t l an t i c Aerosols and Marine Ecosystems Study): Improve predictions of how ocean ecosystems would change with ocean warming; Michael Behrenfeld, Oregon State Univ
ACT-Amer ica (Atmospher ic Carbon and Transport – America): Quantify the sources of regional carbon dioxide, methane, and other gases, and document how weather systems transport these gases; Ken Davis, Penn State Univ
ATom (Atmospheric Tomography Experiment): Study the impact of human-produced air pollution on certain greenhouse gases; Steven Wofsy, Harvard Univ
ORACLES (ObseRvations of Aerosols Above CLouds and Their IntEractionS): Probe how smoke particles from massive biomass burning in Africa influences cloud cover over the Atlantic; Jens Redemann, ARC
CORAL (Coral Reef Airborne Laboratory): Develop critical data and new models needed to analyze the status of coaral reefs and predict their future; Eric Hochberg, Bermuda Institute of Ocean Science