Embed Size (px)
Citation preview

This document is downloaded at: 2020-03-25T00:03:22Z
TitleElevated Levels of Systemic Pentraxin 3 Are Associated With Thin-CapFibroatheroma in Coronary Culprit Lesions : Assessment by OpticalCoherence Tomography and Intravascular Ultrasound
Author(s)Koga, Seiji; Ikeda, Satoshi; Yoshida, Takeo; Nakata, Tomoo; Takeno,Masayoshi; Masuda, Nobuhito; Koide, Yuji; Kawano, Hiroaki; Maemura,Koji
Citation JACC: Cardiovascular Interventions, 6(9), pp.945-954; 2013
Issue Date 2013-09
URL http://hdl.handle.net/10069/33936
Right
© 2013 by the American College of Cardiology Foundation.; NOTICE: thisis the author’s version of a work that was accepted for publication inJACC: Cardiovascular Interventions. Changes resulting from thepublishing process, such as peer review, editing, corrections, structuralformatting, and other quality control mechanisms may not be reflected inthis document. Changes may have been made to this work since it wassubmitted for publication. A definitive version was subsequently publishedin JACC: Cardiovascular Interventions, 6, 9(2013)
NAOSITE: Nagasaki University's Academic Output SITE
http://naosite.lb.nagasaki-u.ac.jp

- 1 -
Elevated Levels of Systemic Pentraxin 3 are Associated With
Thin-cap Fibroatheroma in Coronary Culprit Lesions
Assessment by Optical Coherence Tomography and Intravascular Ultrasound
Seiji Koga, MD*, Satoshi Ikeda, MD*, Takeo Yoshida, MD*, Tomoo Nakata, MD*,
Masayoshi Takeno, MD*, Nobuhito Masuda, PhD†, Yuji Koide, MD*,
Hiroaki Kawano, MD* and Koji Maemura, MD*
*Department of Cardiovascular Medicine, Nagasaki University Graduate School of
Biomedical Sciences, 1-7-1 Sakamoto, Nagasaki 852-8501, Japan
† Perseus Proteomics Inc., 4-7-6 Komaba, Meguro-ku, Tokyo, 153-0041, Japan
Total word count: 4352
Brief title: Prediction of TCFA by PTX3
Disclosure: There are no relationships relevant to the contents of this paper to disclose.
- 2 -
Address for correspondence: Satoshi Ikeda, MD
Department of Cardiovascular Medicine
Nagasaki University Graduate School of Biomedical Sciences
1-7-1 Sakamoto, Nagasaki 852-8501, Japan
Tel: +81-95-819-7288; Fax: +81-95-819-7290
Email: [email protected]

- 3 -
Abstract
Objectives: The present study aimed to determine whether or not systemic levels of
pentraxin 3 (PTX3), a novel inflammatory marker, are associated with thin-cap
fibroatheroma (TCFA).
Background: Biomarkers predicting the presence of TCFA in vivo have not been
established.
Methods: We evaluated 75 patients (stable angina pectoris (SAP), n = 47; acute
coronary syndrome (ACS), n = 28) with de novo culprit lesions that were examined by
optical coherence tomography (OCT) and intravascular ultrasound (IVUS). We defined
TCFA as lipid-rich plaque with a fibrous cap < 65 µm thick. Systemic levels of PTX3
were compared between patients with and without TCFA.
Results: Thirty-eight and 37 patients with and without TCFA, respectively, were
identified. Levels of PTX3 were significantly higher in patients with, than without
TCFA (p < 0.001) and correlated inversely with fibrous cap thickness (r = -0.71, p =

- 4 -
0.001) and positively with the remodeling index (r = 0.25, p = 0.037). Multivariate
logistic regression analysis showed that a higher PTX3 level was the most powerful
predictor of TCFA (odds ratio: 3.26, 95% confidence interval: 1.75 to 6.05, p < 0.001).
Receiver operator characteristic curve analysis showed that > 3.24 ng/ml of PTX3 could
predict TCFA with 84% sensitivity and 86% specificity.
Conclusions: Higher levels of systemic PTX3 are associated with TCFA. Systemic
PTX3 levels comprise a useful inflammatory marker that reflects coronary plaque
vulnerability.
Key words: vulnerable plaque, pentraxin 3, optical coherence tomography, thin-cap
fibroatheroma

- 5 -
Condensed abstract
The present study examines associations between systemic levels of pentraxin 3
(PTX3) and thin-cap fibroatheroma (TCFA) assessed by optical coherence tomography
and intravascular ultrasound in 75 patients with coronary artery diseases. Levels of
PTX3 were significantly higher in patients with than without TCFA. Multivariate
logistic regression analysis showed that a higher PTX3 level was the most powerful
predictor of TCFA. Receiver operator characteristic curve analysis showed that > 3.24
ng/ml of PTX3 predicted TCFA with 84% sensitivity and 86% specificity. In conclusion,
PTX3 levels might reflect coronary plaque vulnerability leading to the development of
acute coronary syndrome.

- 6 -
Abbreviations and acronyms
ACS = acute coronary syndrome
AMI = acute myocardial infarction
CSA = cross-sectional area
EEM = external elastic membrane
hsCRP = high-sensitivity C-reactive protein
IVUS = intravascular ultrasound
OCT = optical coherence tomography
PTX3 = pentraxin 3
SAP = stable angina pectoris
TCFA = thin-cap fibroatheroma

- 7 -
Introduction
Pathological studies of patients with sudden cardiac death suggest that acute
coronary syndromes (ACS) mostly arise as a result of thrombotic coronary occlusion
after rupture of a thin-cap fibroatheroma (TCFA) that is also referred to as vulnerable
plaque (1). Vascular inflammation is considered to play a key a role in plaque
vulnerability (2).
Although acute-phase C-reactive protein (CRP) is widely considered an indicator
of systemic inflammation, the response is not specific to vascular inflammation and it is
triggered by many disorders that are unrelated to cardiovascular disease. Pentraxin 3
(PTX3) is a member of the pentraxin superfamily that includes CRP and serum amyloid
P. High levels of PTX3 are locally expressed in vascular endothelial, smooth muscle and
vascular inflammatory cells in human atherosclerotic lesions (3,4). Plasma PTX3 is also
implicated as an acute indicator and as a predictor of adverse clinical outcomes of ACS
(5,6). However, the association between circulating PTX3 levels and vulnerable plaque

- 8 -
has not been directly explored.
Optical coherence tomography (OCT) is new intravascular imaging modality that
allows clear visualization of the various features of vulnerable plaques including TCFA
(7). When combined with intravascular ultrasound (IVUS), OCT is presently the
optimal approach to evaluating plaque characteristics. Therefore, we investigated
whether systemic PTX3 levels could reflect plaque characteristics including TCFA in
coronary culprit lesions assessed by OCT and IVUS.
Methods
Study population.
Between April 2009 and February 2012, 101 consecutive patients with coronary
artery disease who underwent both OCT and IVUS to de novo culprit lesions in the
native coronary artery at Nagasaki University Hospital were considered for inclusion in
this prospective study. The exclusion criteria comprised a left main lesion, ostial,

- 9 -
chronic total occlusion or severely calcified lesions, cardiogenic shock or renal
insufficiency (baseline serum creatinine > 2.0 mg/dl without maintenance hemodialysis).
Patients with a history of treatment for, or diagnosis of carotid artery stenosis,
thoracic/abdominal aortic aneurysm, peripheral artery, collagen, malignant, infectious
and other systemic inflammatory diseases were also excluded, because these conditions
might affect PTX3 or CRP levels (5,8). We excluded 22 patients according to these
criteria and four others with low-quality OCT or IVUS images. Thus, data from 75
patients with ACS (n = 28) and stable angina pectoris (SAP, n = 47) were included in
the final analysis. ACS included acute myocardial infarction (AMI, n = 17) and unstable
angina pectoris (n = 11). We defined AMI as chest pain that persisted for > 30 minutes,
arrival at hospital within 12 hours of the onset of chest pain, new ST-T changes or a new
left bundle-branch block on 12-lead electrocardiograms and elevated cardiac markers
(creatine kinase-MB or troponin T) (9). We defined unstable angina pectoris as angina at
rest, accelerated angina, or new-onset angina without elevation of cardiac markers. We
- 10 -
defined SAP as no change in the frequency, duration, or intensity of angina symptoms
within six weeks before admission. This study complied with the Declaration of
Helsinki with regard to investigations in humans, and the Ethics Committee of Nagasaki
University Hospital approved the protocol. All participants provided written, informed
consent before enrollment in the study.
Angiographic analysis
Patients were examined by quantitative coronary angiography using a CASS II
system (Pie Medical Imaging, Maastricht, The Netherlands). The minimum lumen
diameter, reference vessel diameter, and length of the culprit lesion were measured.
Culprit lesions were identified from a combination of left ventricular wall motion
abnormalities, electrocardiographic findings, scintigraphic defects and angiographic
lesion morphology.
OCT image acquisition and analysis
Patients with TIMI flow grade ≤ 2 underwent aspiration thrombectomy using a
- 11 -
Thrombuster III aspiration catheter (Kaneka Medics, Tokyo, Japan) before OCT
imaging. We performed OCT using the balloon occlusion method (10) and a 0.016-inch
guidewire-based OCT ImagingWire catheter (LightLab Imaging Inc., Westford, MA,
USA) and a Helios occlusion balloon catheter (Goodman Co. Ltd., Nagoya, Japan). An
imaging run proceeded using automated pullback at 1.0 mm/s. Acquired OCT images
were analyzed using proprietary offline software from LightLab Imaging.
Two independent experienced observers who were blinded to the angiographic and
clinical data analyzed the OCT images using validated criteria for plaque
characterization (10). Discordance between observers was resolved by taking a
consensus reading. Signal-poor lesions with unclearly delineated borders on OCT
images indicated a lipid core and signal-rich homogeneous lesions overlying a lipid core
indicated a fibrous cap. The thinnest part of a fibrous cap was measured three times, and
the average was defined as fibrous cap thickness. The arc of a lipid core on
cross-sectional OCT images was measured and semiquantified according to the number

- 12 -
of involved quadrants. When a lipid core comprised over two quadrants, it was deemed
to be lipid-rich plaque (Fig. 1A). We defined TCFA as a lipid-rich plaque with the
thinnest part of the fibrous cap measuring < 65 µm (Fig. 1B). Ruptured plaque was
defined as fibrous cap discontinuity and cavity formation in the plaque (Fig. 1C).
Intracoronary thrombus was identified as a mass protruding into the vessel lumen from
the surface of the vessel wall (Fig. 1D). Intra-and inter-observer variability yielded
acceptable concordance for the presence of TCFA (κ = 0.81 and 0.84, respectively). The
mean inter- and intra-observer differences in the fibrous-cap thickness were 5.9 ± 6.6
and 5.2 ± 5.7 µm, respectively. Intra- and inter-observer correlation coefficients for
measurements of the fibrous cap thickness were 0.85 and 0.82, respectively.
IVUS image acquisition and analysis
After OCT analysis, IVUS images were obtained using the iLab system (Boston
Scientific, Natick, MA, USA) and an Atlantis Pro Imaging catheter (40 MHz, Boston
Scientific) during automated motorized pullback at 0.5 mm/s. Images were digitally
- 13 -
stored for subsequent offline analysis.
The IVUS analysis proceeded using validated software (echoPlaque 3.0 INDEC
Medical Systems, Santa Clara, CA, USA) according to the American College of
Cardiology Clinical Expert Consensus Document (11). Cross-sectional images were
quantified for lumen cross-sectional area (CSA), external elastic membrane (EEM) CSA,
and plaque plus media CSA calculated as EEM minus lumen CSA. Plaque burden was
calculated as plaque plus media divided by EEM CSA. The IVUS parameters were
measured at the minimum lumen CSA sites and a reference site. The remodeling index
was defined as EEM CSA at the target lesion divided by EEM CSA at the average
reference (12).
Blood samples
Venous blood samples were withdrawn before coronary angiography from the
forearms of patients with ACS and with SAP who had fasted overnight. The mean
interval from symptom onset to blood sampling from patients with AMI was 6.4 hours.
- 14 -
Venous blood samples were collected into EDTA vacuum containers for PTX3,
centrifuged for 10 minutes and the plasma was stored at -80°C until assay. Levels of
PTX3 were measured using a high-sensitivity enzyme-linked immunosorbent assay
system for human plasma (Perseus Proteomics, Tokyo, Japan). The normal
physiological concentration of plasma PTX3 is about 2 ng/ml (13). High-sensitivity
CRP (hsCRP) was measured at SRL Co. Ltd, Tokyo, Japan. The estimated glomerular
filtration rate was calculated as: 194 × age-0.287 × serum creatinine-1.094 (if female, ×
0.739) (14).
Statistical analysis
Continuous values are expressed as means ± SD for normally distributed variables
or medians (interquartile ranges) for skewed variables, and analyzed by the paired t-test,
the Mann-Whitney U test, or the Kruskal-Wallis test. Categorical data are presented as
numbers (%) and analyzed using the chi-square test or Fisher’s exact test. Relationships
between biomarkers and plaque characteristics were evaluated using Spearman’s rank

- 15 -
correlation coefficient. Significant factors indicating the presence of TCFA were
determined using multivariate logistic regression analysis. Factors with p < 0.05 in the
univariate analysis were entered into multivariable models. Receiver-operating
characteristic curves were constructed to identify optimal biomarker cutoff points,
defined as the point closest to 100 in the top left corner. Inter- and intra-observer
agreement for TCFA identification was evaluated by Cohen’s κ test of concordance.
Intra- and inter-observer variability in measuring fibrous cap thickness values was
evaluated by linear regression. A probability of p < 0.05 was considered statistically
significant. All other data were statistically analyzed using IBM SPSS version 20 (IBM
Corp., Somers, NY, USA).
Results
Characteristics of patients
Among 75 culprit plaques in 75 patients, 38 (51%) of them were diagnosed as

- 16 -
TCFA based on OCT findings. Table 1 summarizes the baseline clinical characteristics.
The prevalence of ACS was higher, whereas both the frequency of statin usage and
hemoglobinA1c levels, were lower in patients with, than without TCFA. No other
characteristics significantly differed between patients with and without TCFA.
Angiographic, OCT and IVUS findings
Table 2 shows the angiographic, OCT and IVUS findings between patients with
and without TCFA. Reference vessel diameter, EEM CSA, plaque plus media CSA,
plaque burden, and remodeling index were significantly greater in patients with, than
without TCFA. As expected from the definition of TCFA, the arc of the lipid core was
greater and the fibrous cap was thinner in patients with TCFA.
Relationships between PTX3, hsCRP and lesion characteristics
Table 3 compares PTX3 or hsCRP levels among the lesion characteristics
determined by OCT. Levels of PTX3 were significantly higher in patients with than
without TCFA, but elevations in those of hsCRP did not reach significance. Levels of

- 17 -
PTX3 significantly and inversely correlated with fibrous cap thickness and tended to
increase with increasing lipid quadrants. Levels of both PTX3 and hsCRP were
significantly elevated in patients with ruptured plaque or thrombus.
Table 4 shows correlations between PTX3 or hsCRP levels and QCA and IVUS
data. Levels of PTX3 correlated significantly and positively with reference vessel
diameter and levels of both hsCRP and PTX3 correlated significantly and positively
with EEM CSA, lumen CSA, plaque plus media CSA and the remodeling index.
On the other hand, PTX3 levels significantly differed between patients with ACS
and those with SAP (4.90 (3.31 - 9.53) vs. 2.33 (1.68 - 3.58) ng/ml, respectively; p <
0.001). Similarly, hsCRP levels also differed between ACS and SAP (5.30 (1.16 - 14.15)
vs. 0.89 (0.40 - 3.04) mg/l, respectively; p < 0.001). Thus, we evaluated PTX3 or hsCRP
levels separately in patients with ACS and in those with SAP because these values
might be influenced by the presence of ACS (Fig. 2). Among patients with ACS, PTX3
levels were significantly higher in those with than without TCFA [6.22 (3.80 - 14.52) vs.

- 18 -
2.50 (2.00 - 3.31) ng/ml; p = 0.003, Fig. 2A]. Among patients with SAP, PTX3 levels
were higher in patients with than without TCFA [3.58 (3.03 - 5.15) vs. 1.94 (1.44 - 2.68)
ng/ml; p < 0.001, Fig. 2B]. However, both patients with and without TCFA had similar
levels of hsCRP in ACS [5.33 (1.12 - 20.00) vs. 1.31 (0.89 - 9.81) mg/l; p = 0.41] (Fig.
2C) and in SAP [0.89 (0.39 - 2.13) vs. 0.83 (0.41 - 3.26) mg/l; p = 0.85] (Fig. 2D).
The patients with ACS and SAP were categorized based on whether PTX3 or
hsCRP levels were in the lowest, middle, and highest tertiles, and the frequency of
TCFA was compared in each group (Fig. 3). The frequency of TCFA increased
significantly from the lowest to the highest tertiles of PTX3 levels both in patients with
SAP and in those with ACS (Figs. 3A and B), but this trend was not evident among
hsCRP tertiles (Figs. 3C and D).
Predictors of TCFA
We used both univariate and multivariate logistic regression analysis to identify
significant factors predicting the presence of TCFA. The univariate analysis identified

- 19 -
ACS, higher PTX3 levels and remodeling index, larger reference vessel diameter, EEM
CSA, plaque plus media CSA, and plaque burden were significant predictors for TCFA,
and complication of diabetes mellitus and statin use had lower probability of its
presence. Among these factors, higher PTX3 levels and larger plaque plus media CSA
values significantly correlated with TCFA with the multivariate analysis (Table 5). We
analyzed only patients with SAP to predict the presence of TCFA in patients who have
not yet developed ACS. We found that a higher PTX3 level and a greater reference
vessel diameter were significant factors associated with TCFA in SAP patients (Table 6).
Figure 4 shows the receiver-operating characteristic curves of PTX3 levels for
predicting TCFA in all patients and in those with SAP. The area under the curve of
PTX3 in all patients (Fig. 4A) was 0.89 (95% confidence interval [CI], 0.81 to 0.97; p <
0.001). A PTX3 cut-off value of 3.24 ng/ml distinguished TCFA from non-TCFA with
84% sensitivity and 86% specificity. In contrast, the area under the curve of PTX3 was
0.84 (95% CI, 0.71 to 0.98; p < 0.001) in patients with SAP (Fig. 4B). A PTX3 value of

- 20 -
2.88 ng/ml identified TCFA with 80% sensitivity and 78% specificity in these patients.
Discussion
The main findings of the present study are as follows: systemic PTX3 levels were
significantly higher in patients with than without TCFA; the frequency of TCFA
significantly increased according to elevations in PTX3 levels; and higher levels of
PTX3 were the most powerful predictor of TCFA in patients with SAP and the entire
study population.
The liver produces the short pentraxin, CRP, in response to interleukin-6. Elevated
CRP values correlate with increased risk of cardiovascular disease in both healthy and
high-risk individuals (15). However, the CRP response is not specific to vascular
inflammation and it can be triggered by various disorders that are unrelated to
cardiovascular disease. On the other hand, endothelial cells, monocytes/macrophages
and neutrophils locally produce long PTX3 at sites of inflammation, predominantly in

- 21 -
response to proinflammatory signals including tumor necrosis factor-α, interleukin-1β,
oxidized low-density lipoprotein and lipopolysaccharide (3,4,16). Blood levels of PTX3
can increase in response to subtle inflammation caused by coronary plaque. Circulating
plasma PTX3 is a predictor of adverse cardiac events in patient with ACS as well as in
those with SAP (5,6,17). Furthermore, plasma PTX3 is more closely associated with the
angiographic complexity and severity of coronary artery disease than hsCRP (18).
However, whether or not systemic PTX3 levels can reflect plaque characteristics
remains unclear. The present study therefore evaluated the relationship between
systemic PTX3 levels and coronary plaque vulnerability assessed by OCT and IVUS.
The typical morphology of TCFA is that of a large plaque burden, a large necrotic
core, a thin fibrous cap with infiltrating macrophages and positive remodeling (19). We
evaluated these features of TCFA using OCT and IVUS and found that patients with
TCFA had significantly higher levels of systemic PTX3. We also discovered that
systemic PTX3 levels correlated inversely with fibrous cap thickness and positively

- 22 -
with EEM CSA, plaque plus media CSA and the remodeling index. Furthermore, the
multivariate analysis identified higher PTX3 levels were the most powerful predictor of
TCFA. We separately evaluated PTX3 levels in patients with ACS and in those with
SAP to control for any influence the presence of ACS may have had on PTX3 levels.
Importantly, PTX3 levels comprised a significant predictor of TCFA even in patients
with SAP. These findings suggest that systemic PTX3 levels reflect the vulnerability of
coronary culprit plaque. In addition, systemic PTX3 levels might predict TCFA in
patients with SAP who have not yet developed ACS. This superior predictive value of
PTX3 might be associated with the higher specificity of PTX3 for localized
inflammation. Thus, routinely measuring systemic PTX3 levels in patients with SAP in
daily clinical practice can help to identify those who are likely to be at higher risk for
ACS. Iwata et al. (20) recently reported that statin therapy (atorvastatin 10 mg/day) for
six to eight months significantly decreases the plasma PTX3 levels in patients with SAP.
Further study is needed to determine whether reducing PTX3 levels with statin can lead

- 23 -
to the prevention of ACS.
Levels of systemic PTX3 were significantly higher in our ACS patients with than
without TCFA. Systemic levels of PTX3 in such patients should be carefully interpreted.
Firstly, the major sources of systemic PTX3 in these patients might be heart tissues with
severe ischemia or infarction rather than coronary vulnerable plaques. Nebuloni et al.
(21) found that PTX3 is produced by macrophages, the endothelium, and to a lesser
extent, myocardiocytes, and that it localizes in the interstitium of heart tissues from
patients with AMI at autopsy. Secondly, systemic PTX3 levels are influenced by
time-dependent changes from the onset of AMI. Peri et al. (6) showed that plasma
PTX3 levels peak at a median of 7.5 hours after AMI and return to normal after three
days. Our results might be biased by variation in intervals between symptom onset in
patients with AMI and blood sampling.
The present study identified a significant relationship between hsCRP and ruptured
plaque or thrombus. Our findings are consistent with those of previous IVUS and OCT

- 24 -
studies (22). In contrast, we did not discover a significant association between hsCRP
and the presence of TCFA. Tanaka et al. (23) reported that hsCRP levels inversely
correlate with fibrous cap thickness measured by OCT in patients with ACS. Matsuo et
al. (24) showed using OCT that hsCRP levels are significantly higher in patients with
ACS with, than without TCFA. Sawada et al. (25) found similar hsCRP levels in
patients who had SAP regardless of the presence or absence of TCFA. The most likely
explanation for these inconsistencies might be as follows. Since the inflammatory
responses of coronary plaque might be subtle, TCFA alone might not influence systemic
inflammatory markers such as hsCRP, especially in patients with SAP. Plaque rupture
leading to ACS might induce higher levels of systemic inflammation compared with
unruptured plaque and then increase hsCRP levels in the peripheral circulation.
However, the early detection of unruptured TCFA as opposed to ruptured plaque is more
important for the prediction and prevention of ACS. From this viewpoint, systemic
hsCRP might be less useful than PTX3.

- 25 -
In the present study, diabetes mellitus had a lower probability for predicting TCFA
by only a univariate analysis. In contrast, a previous OCT study demonstrated that
plaques in patients with diabetes frequently had vulnerable features including TCFA
(26). This disagreement might be caused by the finding that our patients with diabetes
had a significantly higher proportion of statin use than those without diabetes (63% vs.
35%, p = 0.027).
We could not ascertain a causal relationship between elevated PTX3 and coronary
plaque characteristics. Savchenko et al. (4) reported that PTX3 might play a causal role
in the progression of atherosclerotic lesions through soluble pattern recognition in
innate immunity. In contrast, PTX3 in apolipoprotein E-knockout mice was recently
implicated in an atheroprotective effect (27) and it plays a cardioprotective role in
mouse models of AMI (28). Elevated PTX3 might reflect a compensatory
cardioprotective response to an activated inflammatory response. However, the present
study found only that systemic PTX3 is a useful inflammatory marker of TCFA. The

- 26 -
pathogenic role of elevated PTX3 in coronary plaque vulnerability requires further
study.
Study limitations
Our study has several limitations. First, the small patient cohort from a single
center imposed inherent limitations. In addition, since we evaluated only limited
patients who did not meet many exclusion criteria and who underwent both OCT and
IVUS, our results could have been affected by selection bias and cannot be generalized
to all patients. Second, we assessed only culprit plaque morphology in culprit vessels.
Assessment of multiple plaques by OCT in three-vessel coronary trees is ethically
unacceptable, especially in patients with ACS because repeated balloon occlusion is
required along with a larger volume of flushing solution. Third, although we did not
enroll patients with carotid artery stenosis, thoracic/abdominal aortic aneurysms or
peripheral artery disease, we could not exclude the possibility that vulnerable plaques in

- 27 -
other vascular beds might affect PTX3 levels. To demonstrate local PTX3 production in
the coronary circulation, PTX3 levels should also be measured at the coronary sinus or
coronary artery. Fourth, several thrombi might reduce the ability of OCT to assess the
details of plaque morphology, because thrombus might shadow or obscure underlying
structures. Finally, we did not assess whether PTX3 levels can predict clinical outcomes
and whether TCFA would lead to ACS in the future. Future longitudinal and prospective
studies are needed to address these issues.
Conclusions
Levels of systemic PTX3 are higher in patients with than without TCFA assessed
by OCT. Higher PTX3 levels comprise a powerful indicator of TCFA, even in patients
with SAP. These findings suggest that systemic PTX3 can serve as a biomarker that
reflects plaque vulnerability.
Acknowledgments
This study was partly supported by a JSPS Grant-in-Aid for Young Scientists (B)

- 28 -
(24790767) (to S.K.).

- 29 -
References
1. Virmani R, Kolodgie FD, Burke AP, Farb A, Schwartz SM. Lessons from sudden
coronary death: a comprehensive morphological classification scheme for
atherosclerotic lesions. Arterioscler Thromb Vasc Biol 2000;20:1262-75.
2. Glass CK, Witztum JL. Atherosclerosis. the road ahead. Cell 2001;104:503-16.
3. Rolph MS. Production of the Long Pentraxin PTX3 in Advanced Atherosclerotic
Plaques. Arteriosclerosis, Thrombosis, and Vascular Biology 2002;22:10e-14.
4. Savchenko A, Imamura M, Ohashi R et al. Expression of pentraxin 3 (PTX3) in
human atherosclerotic lesions. J Pathol 2008;215:48-55.
5. Inoue K, Sugiyama A, Reid PC et al. Establishment of a high sensitivity plasma
assay for human pentraxin3 as a marker for unstable angina pectoris.
Arterioscler Thromb Vasc Biol 2007;27:161-7.
6. Peri G, Introna M, Corradi D et al. PTX3, A prototypical long pentraxin, is an
early indicator of acute myocardial infarction in humans. Circulation
2000;102:636-41.
7. Jang IK, Tearney GJ, MacNeill B et al. In vivo characterization of coronary
atherosclerotic plaque by use of optical coherence tomography. Circulation
2005;111:1551-5.

- 30 -
8. Inoue K, Kodama T, Daida H. Pentraxin 3: a novel biomarker for inflammatory
cardiovascular disease. Int J Vasc Med 2012;2012:657025.
9. Thygesen K, Alpert JS, White HD. Universal definition of myocardial infarction.
J Am Coll Cardiol 2007;50:2173-95.
10. Tearney GJ, Regar E, Akasaka T et al. Consensus standards for acquisition,
measurement, and reporting of intravascular optical coherence tomography
studies: a report from the International Working Group for Intravascular Optical
Coherence Tomography Standardization and Validation. J Am Coll Cardiol
2012;59:1058-72.
11. Mintz GS, Nissen SE, Anderson WD et al. American College of Cardiology
Clinical Expert Consensus Document on Standards for Acquisition,
Measurement and Reporting of Intravascular Ultrasound Studies (IVUS). A
report of the American College of Cardiology Task Force on Clinical Expert
Consensus Documents. J Am Coll Cardiol 2001;37:1478-92.
12. Garcia-Garcia HM, Costa MA, Serruys PW. Imaging of coronary
atherosclerosis: intravascular ultrasound. Eur Heart J 2010;31:2456-69.
13. Yamasaki K, Kurimura M, Kasai T, Sagara M, Kodama T, Inoue K.
Determination of physiological plasma pentraxin 3 (PTX3) levels in healthy

- 31 -
populations. Clin Chem Lab Med 2009;47:471-7.
14. Matsuo S, Imai E, Horio M et al. Revised equations for estimated GFR from
serum creatinine in Japan. Am J Kidney Dis 2009;53:982-92.
15. Albert MA, Ridker PM. The role of C-reactive protein in cardiovascular disease
risk. Curr Cardiol Rep 1999;1:99-104.
16. Garlanda C, Bottazzi B, Bastone A, Mantovani A. Pentraxins at the crossroads
between innate immunity, inflammation, matrix deposition, and female fertility.
Annu Rev Immunol 2005;23:337-66.
17. Dubin R, Li Y, Ix JH, Shlipak MG, Whooley M, Peralta CA. Associations of
pentraxin-3 with cardiovascular events, incident heart failure, and mortality
among persons with coronary heart disease: data from the Heart and Soul Study.
Am Heart J 2012;163:274-9.
18. Karakas MF, Buyukkaya E, Kurt M et al. Serum pentraxin 3 levels are
associated with the complexity and severity of coronary artery disease in
patients with stable angina pectoris. J Investig Med 2013;61:278-85.
19. Vancraeynest D, Pasquet A, Roelants V, Gerber BL, Vanoverschelde JL. Imaging
the vulnerable plaque. J Am Coll Cardiol 2011;57:1961-79.
20. Iwata A, Miura S, Tanaka T et al. Plasma pentraxin-3 levels are associated with

- 32 -
coronary plaque vulnerability and are decreased by statin. Coron Artery Dis
2012;23:315-21.
21. Nebuloni M, Pasqualini F, Zerbi P et al. PTX3 expression in the heart tissues of
patients with myocardial infarction and infectious myocarditis. Cardiovasc
Pathol 2011;20:e27-35.
22. Tanaka A, Shimada K, Sano T et al. Multiple plaque rupture and C-reactive
protein in acute myocardial infarction. J Am Coll Cardiol 2005;45:1594-9.
23. Tanaka A, Imanishi T, Kitabata H et al. Morphology of exertion-triggered plaque
rupture in patients with acute coronary syndrome: an optical coherence
tomography study. Circulation 2008;118:2368-73.
24. Matsuo Y, Kubo T, Okumoto Y et al. Circulating malondialdehyde-modified
low-density lipoprotein levels are associated with the presence of thin-cap
fibroatheromas determined by optical coherence tomography in coronary artery
disease. Eur Heart J Cardiovasc Imaging 2013;14:43-50.
25. Sawada T, Shite J, Shinke T et al. Low plasma adiponectin levels are associated
with presence of thin-cap fibroatheroma in men with stable coronary artery
disease. Int J Cardiol 2010;142:250-6.
26. Kato K, Yonetsu T, Kim SJ et al. Comparison of nonculprit coronary plaque

- 33 -
characteristics between patients with and without diabetes: a 3-vessel optical
coherence tomography study. J Am Coll Cardiol Intv 2012;5:1150-8.
27. Norata GD, Marchesi P, Pulakazhi Venu VK et al. Deficiency of the long
pentraxin PTX3 promotes vascular inflammation and atherosclerosis.
Circulation 2009;120:699-708.
28. Salio M, Chimenti S, De Angelis N et al. Cardioprotective function of the long
pentraxin PTX3 in acute myocardial infarction. Circulation 2008;117:1055-64.

- 34 -
Figure legends
Figure 1. Representative Optical Coherence Tomography Images
(A) Lipid-rich plaque. (B) Thin-cap fibroatheroma. Fibrous cap (arrows) is 60 µm thick.
(C) Ruptured plaque (arrow). (D) Intracoronary thrombus (arrow heads).
Figure 2. Comparisons of PTX3 and HsCRP Levels Based on Presence of TCFA in
Patients with ACS and SAP
Box and whisker plots show distribution of PTX3 (A and B) and hsCRP levels (C and
D). ACS = acute coronary syndrome; hsCRP = high-sensitivity C-reactive protein;
PTX3 = pentraxin 3; SAP = stable angina pectoris; TCFA = thin-cap fibroatheroma.
Figure 3. Frequency of TCFA According to PTX3 and HsCRP Levels
Comparison of TCFA frequency among PTX3 tertiles (A and B) or hsCRP levels (C and
D) in patients with ACS and SAP. P values indicate trends across tertiles. Abbreviations

- 35 -
are the same as those in Figure 2.
Figure 4. Receiver-operating Characteristic Curves of PTX3 Levels for Predicting
TCFA
Areas under curves (AUC) of PTX3 levels were obtained from all patients (A) and from
patients with SAP (B). Other abbreviations are the same as those in Figure 2.

- 36 -
Table 1. Patients’ Characteristics
Patients without
TCFA (n = 37)
Patients with
TCFA (n = 38)
p Value
Age, y 69 ± 10 66 ± 12 0.31
Male 30 (81) 30 (79) 0.82
ACS 5 (14) 23 (61) <0.001
AMI 0 17 (45)
UAP 5 (14) 6 (16)
Body mass index, kg/m2 23.8 ± 3.4 23.5 ± 3.6 0.66
Coronary risk factors
Hypertension 25 (68) 26 (68) 0.94
Hypercholesterolemia 18 (49) 16 (42) 0.57
Diabetes mellitus 16 (43) 8 (21) 0.050

- 37 -
Current smoker 7 (19) 15 (40) 0.075
Statin use 22 (60) 11 (29) 0.008
Lipid profiles, mg/dl
Total cholesterol 168 ± 28 177 ± 33 0.19
LDL cholesterol 98 ± 24 110 ± 34 0.10
HDL cholesterol 43 ± 12 47 ± 15 0.32
Triglyceride 110 (83-154) 92 (70-122) 0.058
Blood glucose profiles
Fasting blood glucose, mg/dl 95 (90-128) 100 (87-116) 0.92
HemoglobinA1c, % 5.5 (5.3-6.7) 5.3 (5.1-5.9) 0.021
eGFR, ml/min/1.73 m2 61.5 ± 20.8 65.9 ± 23.5 0.39
Data are means ± SD, n (%), or medians (interquartile range). ACS = acute coronary
syndrome; AMI = acute myocardial infarction; eGFR = estimated glomerular filtration
rate; HDL = high-density lipoprotein; LDL = low-density lipoprotein; TCFA = thin-cap

- 38 -
fibroatheroma; UAP = unstable angina pectoris.

- 39 -
Table 2. Lesion Characteristics Determined by Angiography, IVUS, and OCT
Patients without
TCFA (n = 37)
Patients with
TCFA (n = 38)
p Value
Angiographic analysis
Multivessel disease 12 (32) 11 (29) 0.74
Culprit vessel 0.33
LAD 19 (54) 17 (45)
LCX 7 (19) 4 (11)
RCA 11 (30) 17 (45)
Lesion location 0.33
Proximal 12 (32) 17 (45)
Mid 13 (35) 14 (37)
Distal 12 (32) 7 (18)

- 40 -
QCA data
Reference vessel diameter, mm 2.66 ± 0.46 3.03 ± 0.55 0.003
Minimum lumen diameter, mm 0.84 ± 0.33 0.88 ± 0.42 0.70
Diameter stenosis, % 68 ± 13 71 ± 12 0.26
Lesion length, mm 13.9 ± 7.2 16.7 ± 8.7 0.14
OCT analysis
Fibrous cap thickness, µm 167 (100-296) 57 (50-59) <0.001
Arc of lipid core,° 134 ± 47 198 ± 58 <0.001
IVUS analysis
EEM CSA, mm2 11.3 ± 4.8 16.8 ± 5.7 <0.001
Lumen CSA, mm2 2.4 ± 0.7 2.7 ± 0.9 0.072
Plaque plus media CSA, mm2 8.9 ± 4.5 14.1 ± 5.4 <0.001
Plaque burden, % 77 ± 8 83 ± 6 0.01
Remodeling index 1.04 ± 0.22 1.15 ± 0.14 0.018

- 41 -
Data are mean ± SD, n (%), or median (interquartile range). CSA = cross-sectional area;
EEM = external elastic membrane; IVUS = intravascular ultrasound; LAD = left
anterior descending coronary artery; LCX = left circumflex coronary artery; OCT =
optical coherence tomography; QCA = quantitative coronary angiography; RCA = right
coronary artery; other abbreviations as in Table 1.

- 42 -
Table 3. PTX3 and HsCRP Levels According to Lesion Characteristics Assessed by OCT
PTX3, ng/ml p Value hsCRP, mg/l p Value
Fibrous cap thickness (µm) r = -0.71 < 0.001 r = -0.24 0.050
Lipid core quadrants 0.002 0.21
One (n = 7) 1.87 (1.65-2.16) 0.62 (0.32-0.96)
Two (n = 39) 3.19 (1.68-4.00) 1.12 (0.45-5.26)
Three (n = 25) 4.07 (2.53-5.70) 1.45 (1.08-6.67)
Four (n = 4) 8.18 (3.60-22.50) 1.29 (0.78-15.38)
TCFA < 0.001 0.058
Yes (n = 38) 4.54 (3.38-6.99) 1.49 (0.79-8.48)
No (n = 37) 2.13 (1.55-2.64) 0.96 (0.47-3.93)
Ruptured plaque < 0.001 0.002
Yes (n = 20) 6.15 (3.82-13.53) 5.30 (1.17-18.70)

- 43 -
No (n = 55) 2.51 (1.75-3.60) 0.96 (0.45-3.29)
Thrombus < 0.001 0.031
Yes (n = 27) 5.15 (3.19-10.27) 1.63 (0.94-14.80)
No (n = 48) 2.34 (1.70-3.83) 1.03 (0.46-4.25)
Data are shown as medians (interquartile range) and r indicates Spearman’s rank correlation
coefficient. hsCRP = high-sensitivity C-reactive protein; PTX3 = pentraxin 3; other abbreviations as
in Table 1 and 2.

- 44 -
Table 4. Levels of PTX3 and HsCRP According to QCA and IVUS Data
PTX3, ng/ml p Value hsCRP, mg/l p Value
QCA analysis
Reference vessel diameter r = 0.27 0.021 r = 0.15 0.20
Minimum lumen diameter r = 0.02 0.88 r = 0.08 0.51
Lesion length r = 0.05 0.67 r = 0.03 0.79
IVUS analysis
EEM CSA r = 0.43 < 0.001 r = 0.27 0.018
Lumen CSA r = 0.25 0.033 r = 0.23 0.048
Plaque plus media CSA r = 0.40 < 0.001 r = 0.26 0.027
Plaque burden r = 0.22 0.057 r = 0.11 0.35
Remodeling index r = 0.25 0.037 r = 0.28 0.017
r, Spearman’s rank correlation coefficient. All other abbreviations are the same as those in Tables

- 45 -
1, 2 and 3.
- 46 -
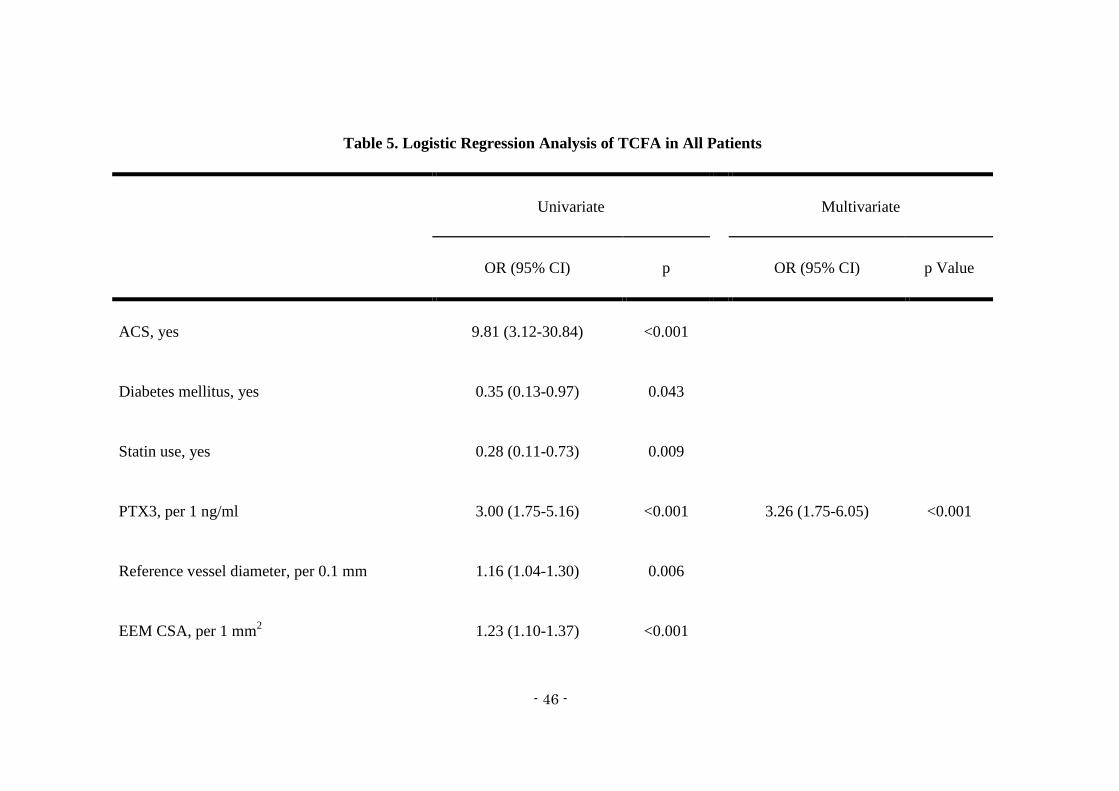
Table 5. Logistic Regression Analysis of TCFA in All Patients
Univariate Multivariate
OR (95% CI) p OR (95% CI) p Value
ACS, yes 9.81 (3.12-30.84) <0.001
Diabetes mellitus, yes 0.35 (0.13-0.97) 0.043
Statin use, yes 0.28 (0.11-0.73) 0.009
PTX3, per 1 ng/ml 3.00 (1.75-5.16) <0.001 3.26 (1.75-6.05) <0.001
Reference vessel diameter, per 0.1 mm 1.16 (1.04-1.30) 0.006
EEM CSA, per 1 mm2 1.23 (1.10-1.37) <0.001

- 47 -
Plaque plus media CSA, per 1 mm2 1.25 (1.11-1.40) <0.001 1.25 (1.07-1.46) 0.006
Plaque burden, per 1% 3.22 (1.52-6.84) 0.002
Remodeling index, per 0.1 1.39 (1.04-1.84) 0.024
CI = confidence interval; OR = odds ratio; other abbreviations as in Table 1 and 2.
- 48 -
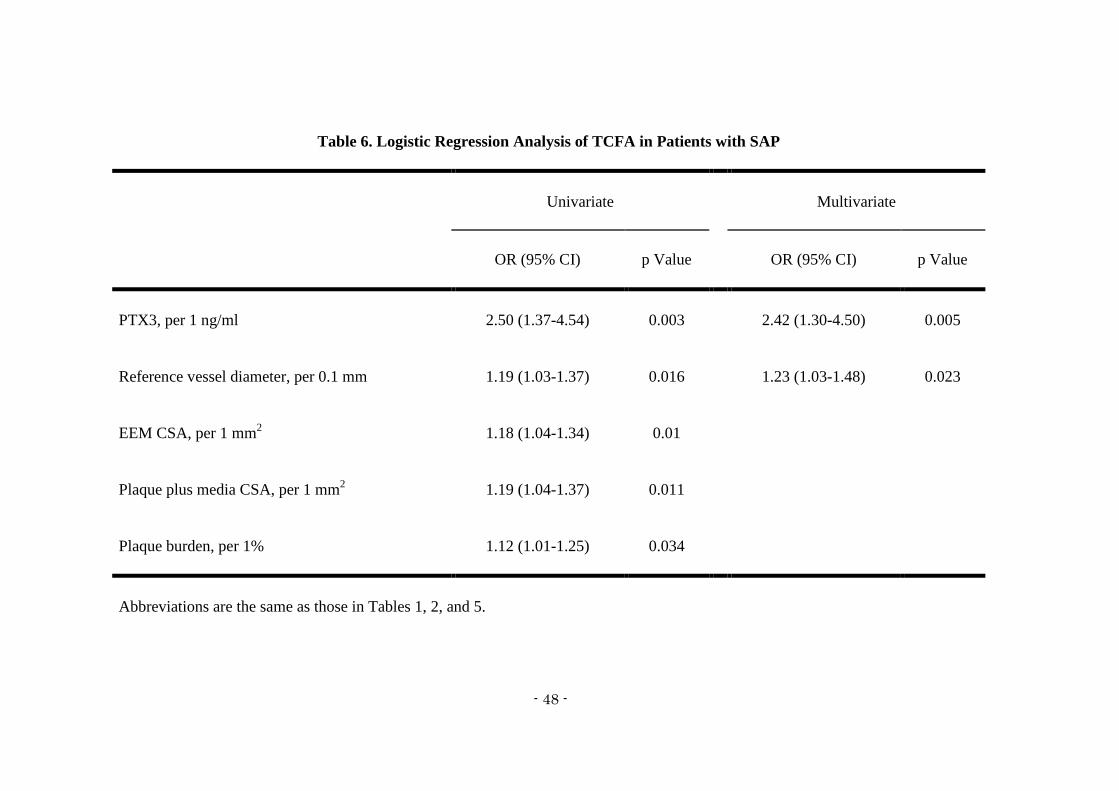
Table 6. Logistic Regression Analysis of TCFA in Patients with SAP
Univariate Multivariate
OR (95% CI) p Value OR (95% CI) p Value
PTX3, per 1 ng/ml 2.50 (1.37-4.54) 0.003 2.42 (1.30-4.50) 0.005
Reference vessel diameter, per 0.1 mm 1.19 (1.03-1.37) 0.016 1.23 (1.03-1.48) 0.023
EEM CSA, per 1 mm2 1.18 (1.04-1.34) 0.01
Plaque plus media CSA, per 1 mm2 1.19 (1.04-1.37) 0.011
Plaque burden, per 1% 1.12 (1.01-1.25) 0.034
Abbreviations are the same as those in Tables 1, 2, and 5.