Embed Size (px)
Citation preview

NanostructuredNanostructured CatalystsCatalysts
Abhaya K. DatyeAbhaya K. DatyeUniversity of New MexicoUniversity of New Mexico

IssuesIssues
• Control of surface composition• Facile synthesis via self assembly• Aggregation of nanoparticles

Control of Surface Composition Control of Surface Composition and Structure in and Structure in NanoparticlesNanoparticles
• Selective catalysts often involve more than one element
• Thermodynamics, preparation variables, often dictate the surface composition and structure
• How do we generate tailored surface structures

Restructuring of PdRestructuring of Pd--Ag Catalysts Ag Catalysts During Selective Hydrogenation During Selective Hydrogenation of Trace Acetylene in Ethyleneof Trace Acetylene in Ethylene
K. Lester, Y. Jin, H. K. Lester, Y. Jin, H. ZeaZea and A. K. Datye and A. K. Datye University of New Mexico, Center for Microengineered Materials aUniversity of New Mexico, Center for Microengineered Materials and nd
Department of Chemical & Nuclear Engineering, Albuquerque, NM 87Department of Chemical & Nuclear Engineering, Albuquerque, NM 87131, 131, USAUSA
E. G. RightorE. G. Rightor11, R. J. Gulotty, R. J. Gulotty11,, J. J. MajJ. J. Maj11, J. Blackson, J. Blackson11, , M. HolbrookM. Holbrook22 and and C. C. Michael SmithMichael Smith33 The Dow Chemical Company, The Dow Chemical Company, 11Midland, MI, 48674,Midland, MI, 48674,
22Plaquemine, LA 77565Plaquemine, LA 77565, , 33Freeport, TX 77541Freeport, TX 77541, USA., USA.
Financial support provided by the U. S. DOE, Office of Basic Energy Sciences, grant DE-FG03-
98ER14917 and by the Dow Chemical Company

• Industrial feedstock for the production of ethylene polymers must contain no more than 5-10 ppm of acetylene.
• Selective Hydrogenation of acetylene is used to remove trace acetylene
C2H2 + H2 C2H4 + H2 C2H6
• Ethylene selectivity is a key objective in this process.• Catalysts are subject to thermal runaway due to the exothermic
reaction
Restructuring of PdRestructuring of Pd--Ag Catalysts Ag Catalysts During Selective Hydrogenation During Selective Hydrogenation of Trace Acetylene in Ethyleneof Trace Acetylene in Ethylene

Operating ConditionsOperating Conditions
• Our reaction conditions correspond to the ‘front end’ hydrogenation, where acetylene is present with a large excess of ethylene and also an excess of hydrogen and some CO.
• Feed:30% C2H4, 0.4% C2H2, 0.1% CO, 16% H2 and balance N2.

Hydrocarbon byproduct formation is suppressed on Pd-Ag after HTR
Selectivity to Oligomers vs Delta Temperature
0
0.05
0.1
0.15
0.2
0.25
0.3
0.35
-25 -20 -15 -10 -5 0 5 10 15 20 25
Delta Temperature
Sele
ctiv
ity to
O
ligom
ers
Pd/Al2O3
Pd+Ag/Al2O3
No pretreatment
500 C Pretreatment
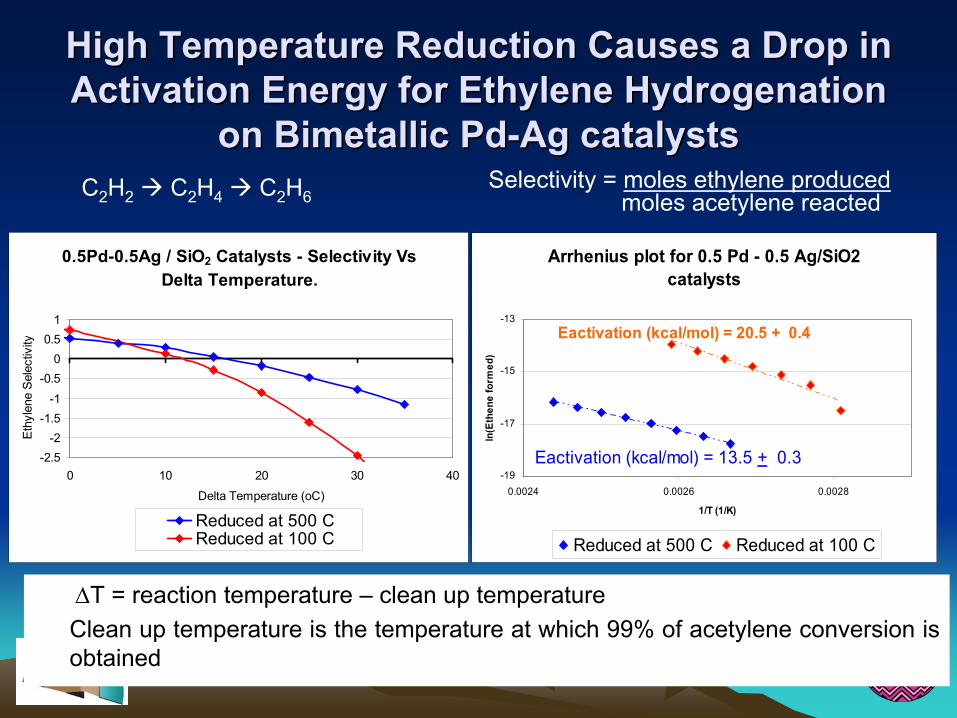
High Temperature Reduction Causes a Drop in High Temperature Reduction Causes a Drop in Activation Energy for Ethylene Hydrogenation Activation Energy for Ethylene Hydrogenation
on Bimetallic Pdon Bimetallic Pd--Ag catalystsAg catalysts
Arrhenius plot for 0.5 Pd - 0.5 Ag/SiO2 catalysts
Eactivation (kcal/mol) = 20.5 + 0.4
Eactivation (kcal/mol) = 13.5 + 0.3 -19
-17
-15
-13
0.0024 0.0026 0.0028
1/T (1/K)
ln(E
then
e fo
rmed
)
Reduced at 500 C Reduced at 100 C
0.5Pd-0.5Ag / SiO2 Catalysts - Selectivity Vs Delta Temperature.
-2.5-2
-1.5-1
-0.50
0.51
0 10 20 30 40
Delta Temperature (oC)
Eth
ylen
e S
elec
tivity
Reduced at 500 CReduced at 100 C
C2H2 C2H4 C2H6Selectivity = moles ethylene produced
moles acetylene reacted
∆T = reaction temperature – clean up temperatureClean up temperature is the temperature at which 99% of acetylene conversion is obtained

Ethylene Hydrogenation Is A Ethylene Hydrogenation Is A StructureStructure--Insensitive Insensitive
ReactionReactionWhy should the activation energy Why should the activation energy
for ethylene hydrogenation be for ethylene hydrogenation be affected by pretreatment?affected by pretreatment?

Effect of CO adsorption on Effect of CO adsorption on Activation Energy for Ethylene Activation Energy for Ethylene
HydrogenationHydrogenation
If the surface is covered by CO, the activation energy for ethylene reaction is simply the heat of desorption of CO
Therefore, changes in the heat of desorptionof CO can change the activation energy for ethylene hydrogenation

On Pd/SiOOn Pd/SiO22, CO is , CO is adsorbed mainly in a adsorbed mainly in a bridged mode bridged mode There is no effect of There is no effect of pretreatmentpretreatment
Linear
Bridge
Reduced at 70 C Reduced at 400 C
Bridge
Linear

On PdOn Pd--Ag/SiOAg/SiO22, we see more , we see more linearly bound CO than linearly bound CO than bridged. High temperature bridged. High temperature reduction further affects the reduction further affects the relative concentrations of linear relative concentrations of linear vsvs bridged CObridged CO
LinearLinear Bridge
Bridge
Reduced at 70 C Reduced at 400 C

Effect of Reduction Temperature
Low temperature reduction High Temperature reduction
Pd-Ag alloy, with some phase segregation
Ag redistributes causing a breakup of the Pd ensembles
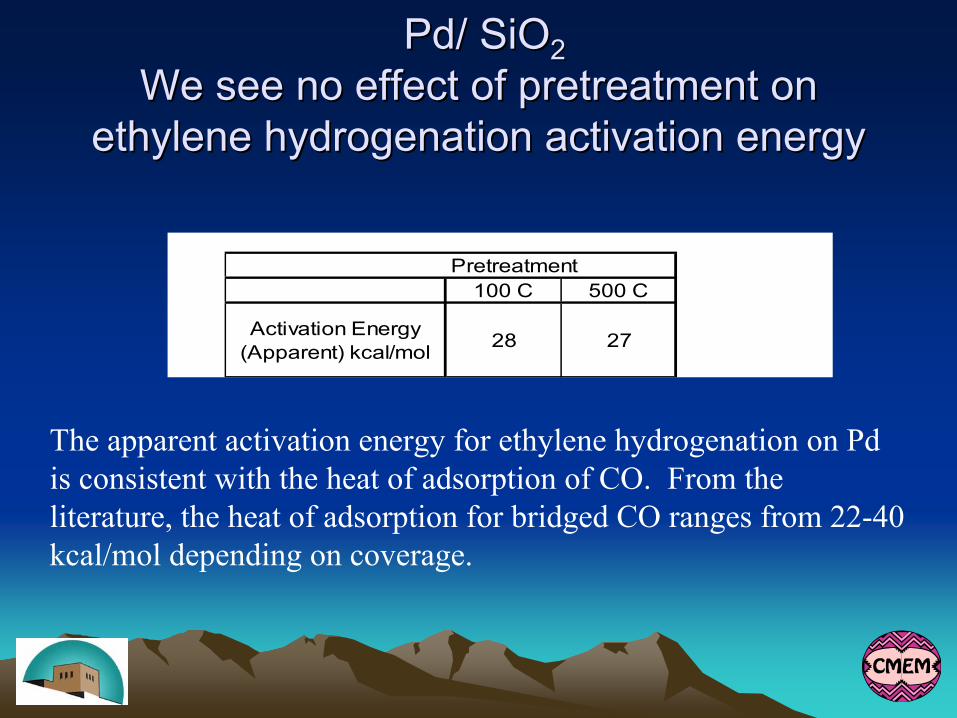
Pd/ SiOPd/ SiO22We see no effect of pretreatment on We see no effect of pretreatment on
ethylene hydrogenation activation energyethylene hydrogenation activation energy
Activation Energy as a function of PretreatmentPretreatment
100 C 500 C
Activation Energy (Apparent) kcal/mol 28 27
The apparent activation energy for ethylene hydrogenation on Pd is consistent with the heat of adsorption of CO. From the literature, the heat of adsorption for bridged CO ranges from 22-40 kcal/mol depending on coverage.

Bridged CO is more strongly Bridged CO is more strongly bound than linearly bonded CObound than linearly bonded CO
Sample E0 (kcal/mol) E1(kcal/mol) E0 (kcal/mol) E1(kcal/mol)Pd (Cl-free)/Al2O3 22 13 40 22Pd (Cl)/Al2O3 22 13 40 18Pd (Cl-f)/CeO2/Al2O3 22 13 40 22Pd (Cl)/CeO2/Al2O3 22 13 40 16Pd (Cl)/La2O3/CeO2/Al2O3 22 13 40 25
(Cl-f): Chlorine free solid (Cl): Chlorine containing solid
Linear CO species Bridged CO Species
Heats of Adsortion of the Adsorbed CO Species on the Various Pd-Cointaining Solids at Low (E0) and High (E1) Coverage [1]
[1] Dulaurent O, Chandes K, Bouly C and Bianchi D, Journal of Catalysis, v 192(#2), 2000

Arrhenius plot for Ethylene Hydrogenation on 0.5 Pd - 0.5 Ag/SiO2 catalysts
Eactivation (kcal/mol) = 20.5 + 0.4
Eactivation (kcal/mol) = 13.5 + 0.3 -19
-17
-15
-13
0.0024 0.0026 0.0028
1/T (1/K)
ln(E
than
e fo
rmed
)
Reduced at 500 C Reduced at 100 C

Schematic of Restructuring Schematic of Restructuring Phenomena in PdPhenomena in Pd--AgAg
Pd-Ag alloy
AgAgHigh Temperature Reduction
High Temp Oxidation
Low Temp Oxidation
Pd
Ag2O
PdO
Enrichment of Ag on Pd surface

SummarySummary• High temperature pretreatments cause
restructuring of Pd and Ag• Reducing the number of Pd nearest
neighbors affects selectivity to oligomerformation
• By modifying the adsorption of coadsorbedCO, we can control the activation energy for ethylene hydrogenation and modify the selectivity for the reaction

Mangesh Bore, Hien Pham, Timothy Ward,C. J. Brinker, Abhaya Datye
Aerosol Synthesis of Nanostructured Catalysts
Financial Support provided by NSF – NIRT, Center for Ceramic and Composite Materials and by the
Materials Corridor Council

Autoclave RouteAutoclave RouteAutoclave
150 oC48 hours
CalcinationReaction Mixture Filtration
• Liquid-Crystal Template Mechanism– Proposed by C. T. Kresge et al., Nature (1992)
J. S. Beck et al., J. A. C. S. (1992)

MCM-41
Irregular shapes

Aerosol RouteAerosol Route
Calcination
• Evaporation Induced Self Assembly (EISA)– Proposed by Jeffrey Brinker et. al., Nature (1999)– Evaporation of solvent leads to ordering of surfactant
structures– Condensation of silica follows the formation of templated
structures to lock in the structure

Control of Particle StructureControl of Particle StructureY. Lu, H. Fan, A. Stump, T.L. Ward, T. Rieker, C.J. Brinker,Nature 398 (1999) 223
Hexagonal nanostructure: interconnected hexagonally packed spherical pores, 1200 m2/g, d=3.2 nm (5 wt% CTAB)
cubic nanostructure: interconnected pores arranged in simple cubic lattice (4.2 wt% B56)
lamellar “onion-skin” structure: concentric shells of silica separated by pore volume, 478 m2/g, d=9.2 nm (5wt% P123)

ComparisonComparison
• Continuous process• Reaction time seconds• Spherical particles• 3-D interconnected pore
structure (local order is hexagonal)
• Batch process• Reaction time hours• Irregular shapes• Most common is the 2-D
structure
Aerosol Synthesis Autoclave Synthesis

Regular shapesParticle consists of small ordered domains of pores
TEM

Si/Al 20
After Hydrothermal Stability Test at 750°C 10% water vapor, 2 hours
Aluminum incorporation improves the hydrothermal stability of mesoporous silica particles.
SiO2

Hydrothermal Stability Test (batch vs. aerosol route) 10% water vapor, 2 hours
0
200
400
600
800
1000
1200
1400
1600
Initial 500 550 600 650 700 750
Temperature (C)
Surf
ace
Are
a (s
q m
/gm
)
Aerosol SilicaDavisil silica gel
Batch Silica
Aerosol Si-Al
Si/Al molar ratio 20
Batch Si-Al

The average Au nanoparticle diameter is small (~1 nm), and the nanoparticles are dispersed inside the pores.
TEM/STEM images of Au/NH2-MCM-41
3-aminopropyltrimethoxysilane is used as the amine source

TEM Images of Ordered Nanocrystal/Silica Nanostructures
B C
Sandia National Laboratories
20 nmA
[100]
Before calcination
Courtesy of Hongyou Fan, Jeff Brinker

Diffusion of ThreeDiffusion of Three--Dimensional Metal Particles Dimensional Metal Particles on an Oxide Substrate: Implications for the on an Oxide Substrate: Implications for the
Sintering of Heterogeneous Catalysts Sintering of Heterogeneous Catalysts
Lani Miyoshi SandersLani Miyoshi SandersAbhaya K. DatyeAbhaya K. Datye
Univ. of New Mexico, Albuquerque, NMUniv. of New Mexico, Albuquerque, NMBrian Brian SwartzentruberSwartzentruber
SandiaSandia National Labs, Albuquerque, NMNational Labs, Albuquerque, NM

Experimental Approach: Experimental Approach: AtomAtom--Tracking Scanning Tracking Scanning Tunneling Microscopy of Tunneling Microscopy of
Pd/TiOPd/TiO22(110)(110)

Atom Tracking Atom Tracking STMSTM g
Tip
x
y t1t2
Conventional STMConventional STM
Developed by Brian Swartzentruber, Sandia Labs
Each image takes several seconds, missing many rotation
events…
time resolution 1000x
Si-Ge Ad-Dimer on Si(001)

TiOTiO22(110) Surface(110) Surface
From: M.J.J.Jak, Ph.D. Dissertation, Nov. 2000.
3Åx6.5ÅUnit cell
100x100Å2

Depositing Depositing PdPd
300x300Å2
300x300Å2Fast deposit @ 4 W, 2 s
Slow deposit @ 3 W, 4 min

Diffusion Diffusion CharacteristicsCharacteristics
400x600Å2
Presence of small, mobile particles rapidly decays due to pinning and growth
Step decoration is prevalent only on steps perpendicular to [001]
Diffusion is essentially confined to the [001] direction
Diffusing particles hop discretely with length of underlying unit cell of substrate

AtomAtom--Tracking of Pd Tracking of Pd Particle Diffusion Particle Diffusion
130
135
140
145
150
155
160
165
145 155X (Angstrom)
Y (A
ngst
rom
)
130
135
140
145
150
155
160
165
0 10 20 30 40 50Time (s)
100x100Å2
[001]

1E-17
1E-16
1E-15
1E-14
1 10 100
Particle Size (# of Atoms)
Diff
usio
n C
oeffi
cien
t (cm
^2/s
)
42°C36°C25°C
Scaling Analysis for Pd Particle Scaling Analysis for Pd Particle DiffusionDiffusion
n=0.86±0.09
n=1.06±0.10n=1.07±0.10

33--D Monte Carlo model gives insights into D Monte Carlo model gives insights into decreased motion of larger particlesdecreased motion of larger particles
shift in diffusion
mechanismshift in
scaling law
faceting
very small particleshigh surface free energydisordered surfaces
hoppingd-1
grow
larger particles
300x300Å2
periphery diffusiond-7