Embed Size (px)
Citation preview

Nanoparticles and
Photosensitisers; their
Interactions and
Antibacterial Properties
Naima Narband
Supervised by Prof. Ivan Parkin
And Prof. Mike Wilson
University College London
2009

I Naima Narband confirm that the work presented in this thesis is my own. Where
information has been derived from other sources, I confirm that this has been indicated
in the thesis.

i
Acknowledgements
I am grateful and thankful to God who makes all things possible. All praise is due to
the Almighty. May he make our lives easier and grant us contentment.
I would like to thank a number of people who have helped and encouraged me to write
this thesis. I would like to acknowledge and extend my heartfelt gratitude to my
supervisor Prof. Ivan Parkin who has guided, taught and encouraged me through this
project. I would also like to thank my second supervisor Prof. Mike Wilson, along with
Dr. Sean Nair at the Eastman Dental Institute. Without their understanding and input
this thesis would not have been possible. Many thanks go to Cale Street and Ondine
Biopharma who provided the financial support for this project.
I would like to express my thanks to Dr Andrew Beeby from Durham University and Dr
Mark Green from Kings College London for their enthusiastic, expert advice and input
into the project. I will always be grateful to Linda Dekker and Sarah Tubby who have
worked with me on the microbiology experiments. I have learnt a great deal from those
who have worked with me over the years and gratefully acknowledge my debt to them,
especially Dr Steve Firth, Dr Jesus Gil Tomas, Dr Andrea Sella, Dr Ian Watts and Dr
Chris Balckman. I would also like to thank my first chemistry teacher Mr Gratrix who
contributed in a fundamental way to my understanding of chemistry.
I am grateful to Dr Russell Binions, Dr Clara Piccirrillo and Dr Charlie Dunnill for
conversations that clarified my thinking. Their friendship and professional
collaboration meant a great deal to me. I will always be grateful to Dr Geoff Hyett who
taught me something new almost every day with immense patience and understanding.
To all of the below individuals, and to several colleagues who have assisted me one way
or another, especially in challenging me with alternative views, I feel very much
indebted to you; Dr Rob Palgrave, Dr Niccochoco, Dr Uzma Quershi, Dr Jalpa Patel
and Dr Christina Bashkaran. To my friends I have moaned to on bad days and
celebrated with on good, I could not have accomplished this project without you; Kris
Page, Stephen Potts, Paolo Melgari and Luanne Thomas. Caroline Knapp, Dr Siama
ii
Basharat/Hussein and Asif Bhaiji have never been more than a phone call away and
nothing I write here would do justice for the help and support you guys have given me.
I would like to express my deep-felt thanks and gratitude to my family; Mum, Dad,
Anisa Wadi, Rabiah Tashkent, Sajeda Narband, Fahmeeda Narband, Hajra Narband,
Fatz, Maryam Wadi, Khadijah Wadi, Ayesha Tashkent, Ayesha Suleman, Younus
Masa, Rashida Masi and all other relatives in Zambia for their patience and forbearance
whilst I have spent hundreds of hours working on this thesis! I can reassure the reader
that as this may be my last direct work as such, at least for a while, I have put a bit of
"heart and soul" into it! Therefore, I hope that you will very much enjoy this work as
well as find it immensely educative!

iii
Abstract
This work reports on the coupling of light activated antimicrobial (LAA) agents with
gold nanoparticles to provide new materials that displayed enhanced antimicrobial
properties. A versatile and robust approach to the synthesis of
gold-thiol-photosensitiser light activated antimicrobials has been developed. In the
synthetic approach the thiols attached to the gold nanoparticles were tiopronin and
glutathione. The photosensitisers attached to the thiols were toluidine blue and tin
chlorin e6 respectively. It was found gold-tiopronin-toluidine blue nanoparticles at 1
µM concentration were efficient as light activated antimicrobials, that had a reduction of
colony forming units (cfu) of S. aureus by 4.5 log10 compared with, 0.5 log10 for
toluidine blue at the same concentration. The attachment of photosensitisers to thiol
protected gold nanoparticles enhanced the lethal photosensitisation of bacteria. The
second approach was mixing of charge stabilised gold nanoparticles with various
photosensitisers. When charge stabilised gold nanoparticles when mixed with toluidine
blue (20 µM), showed a reduction in colony forming units (cfu) for S. aureus of 2.5
log10 compared with 1.5 log10 for only toluidine blue at the same concentration. This
established that covalent attachment of the photosensitiser was not necessary for the
enhancement in the lethal photosensitisation of bacteria. Also, it was discovered that
certain dyes which have basic, cationic natures have different interactions with charge
stabilised gold nanoparticles.
A separate study focusing on semi-conductor quantum dots and the photosensitiser
toluidine blue was undertaken to investigate any relationship between nanoparticles and
photosensitisers. It was found that semi-conductor quantum dots enhance the effect of
toluidine blue in the lethal photosensitisation of bacteria. An excess of a 1.7 log10
enhancement in bacterial kill was observed with quantum dot concentration of 0.0075
µM and toluidine blue concentration of 20 µM. In summary, the efficacy of
photosensitisers can be enhanced by the presence of nanoparticles of gold and CdSe.

iv
List of Figures
Figure 1-1 The Lycurgus cup, appears red in transmitted light and green in
reflected light due to the presence of gold/silver colloids. ............................................. 4
Figure 1-2 Graph illustrating the relationship between the radius of the particle
and the surface to bulk ratio. As the particle becomes smaller the surface to bulk
ratio increases. Inset is a representation of face centred cubic structure of most
metals as small particles. A cuboctahedral cluster of 792 atoms has 50%
contributing to the surface, and a cluster of 10 atoms has 100% of the atoms
contributing to the surface.15......................................................................................... 6
Figure 1-3 Illustration of the excitation of a dipolar surface electron oscillation,
surface plasmon resonance by the electric field of incoming light on gold
nanoparticles. ............................................................................................................... 8
Figure 1-4 Crystalline core of elemental Au with adsorbed AuCl2- ions which
make up the inner layer of the ionic double layer on a gold nanoparticle,
synthesised by a citrate reduction. .............................................................................. 11
Figure 1-5 Schematic representation of the Brust-Schiffrin method of synthesis of
thiol capped gold nanoparticles using sodium borohydride as the reducing agent........ 14
Figure 1-6 Representation of reverse micelle, water – in – oil [w/o](left) and
normal micelle, oil – in – water [o/w](right) phases. The reverse micelle, water –
in – oil [w/o](left), can be used in the synthesis of gold nanoparticles. ........................ 16
Figure 1-7 LaMer diagram as a schematic explanation for the formation process
of monodisperse particles, where C∞ and Ccrit are the equilibrium concentration of
solute with the bulk solid and the critical concentration as the minimum
concentration for nucleation, respectively. The regions I, II, and III represent the
prenucleation, nucleation, and growth stages, respectively.......................................... 18
Figure 1-8 Schematic representation of Ostwald ripening of nanoparticles. This
is a dynamic process which occurs by evaporation, recombination of atoms from
one cluster to another.................................................................................................. 19
Figure 1-9 Schematic illustration of place exchange reactions where one thiol is
replaced by another on a gold nanoparticle surface. .................................................... 23

v
Figure 1-10 Simplified energy level diagram of a photosensitiser, displaying key
energy transitions in the formation of singlet oxygen and consequent Type I and
Type II processes........................................................................................................ 27
Figure 1-11 Schematic representation of ligand stabilised gold nanoparticles
synthesised, with attached photodynamic therapy agent.............................................. 32
Figure 2-1 The structure of tiopronin ......................................................................... 35
Figure 2-2 Synthesis of gold-tiopronin-toluidine blue nanoparticles in a two stage
synthesis. The first stage is the synthesis of gold-tiopronin nanoparticles from
auric acid and tiopronin in acidified methanol. The second stage is the attachment
of toluidine blue to the gold-tiopronin nanoparticles. .................................................. 40
Figure 2-3 Routes possible when coupling TBO to tiopronin–gold nanoparticles....... 42
Figure 2-4 UV-visible spectra (in phosphate buffer, pH 7.01) of: (Blue)
tiopronin–gold nanoparticles, 1.9 µM; (Green) TBO–tiopronin–gold
nanoparticles, 1.2 µM; (Pink) TBO, 20 µM ................................................................ 43
Figure 2-5 Thermal Gravimetric Analysis (TGA) of tiopronin–gold nanoparticles
synthesised by reaction of auric acid and tiopronin in acidified methanol. .................. 44
Figure 2-6 Thermal Gravimetric Analysis (TGA) of toluidine blue–tiopronin–
gold nanoparticles, synthesised by the coupling of toluidine blue to tiopronin-gold
nanoparticles. ............................................................................................................. 45
Figure 2-7 XRD of the residue left in the pan after TGA confirms presence of
elemental gold. The pattern is indexed and shows the expected stick pattern (red)
for gold metal. ............................................................................................................ 46
Figure 2-8 High Resolution Transmission Electron Microscopy (HRTEM) image
of TBO–tiopronin-gold nanoparticles ......................................................................... 46
Figure 2-9 Transmission Infra-red spectra of: (Blue) tiopronin, (Red) tiopronin–
gold nanoparticles, (Green) TBO and (Purple) TBO–tiopronin–gold nanoparticles.
All spectra were acquired in the form of KBr plates, and intensities of the bands
are uncorrected for sample quantity. ........................................................................... 47
Figure 2-10 Effect of TBO (Blue) and the TBO–tiopronin–gold nanoparticle
conjugate (Pink) on viability of S. aureus 6571 following exposure to white light
for 30 minutes, or incubation in the dark with TBO (Green) or the TBO–
tiopronin–gold nanoparticle conjugate (Red). The white bar denotes the viable

vi
count of the original bacterial suspension, and the purple bar represents the viable
count of the bacterial suspension after exposure to white light. ................................... 49
Figure 2-11 Effect of white light dose on the killing of S. aureus by the gold–
tiopronin–TBO conjugate (concentration = 4 µM). The exposure time was varied
from 15 to 45 minutes................................................................................................. 50
Figure 2-12 Effect of various concentrations of the gold–tiopronin conjugate on
the viability of S. aureus following exposure to white light for 35 minutes. The
white bar represents the viable count of the original bacterial suspension. .................. 51
Figure 2-13 Effect of mixtures of ratios of the gold–tiopronin conjugate and TBO
(TBO concentration = 1 µM) (Blue) and TBO alone (Purple) on the viability of S.
aureus following irradiation with white light for 35 minutes. The white bar
represents the viable count of the original bacterial suspension................................... 51
Figure 3-1 Structure of Glutathione ........................................................................... 58
Figure 3-2 Porphine, the simplest porphyrin .............................................................. 60
Figure 3-3 Structure of tin chlorin e6 ......................................................................... 60
Figure 3-4 Detailed scheme of the synthesis of gold–glutathione (Au-GS)
nanoparticles and the functionalisation of these particles to obtain gold–
glutathione–tin chlorin e6 (Au-GS-Snce6). ................................................................. 65
Figure 3-5 Routes possible when coupling tin chlorin e6 to glutathione-gold
nanoparticles using 1-[3-(dimethyl amino) propyl]-3-ethyl-carbodiimide
hydrochloride (EDC) and N-hydroxysulphosuccinimide (sulfo-NHS)......................... 66
Figure 3-6 Transmission Electron Microscopy images of glutathione-gold
(Au-GS) particles, samples NNG.1 (2.6 nm), NNG.4 (5.2 nm) and NNG.6 (6.07
and 1.97 nm), and their conjugated products (Au-GS-SnCe6), NNG.3 (2.3 nm),
NNG.5 (5.4 nm) and NNG.7 (6.24 and 1.73 nm) respectively..................................... 68
Figure 3-7 Thermal Gravimetric Analysis (TGA) of glutathione-gold (Au-GS)
particles, samples NNG.1 (2.6 nm), NNG.4 (5.2 nm) and NNG.6 (6.07 and 1.97
nm)............................................................................................................................. 71
Figure 3-8 Thermal Gravimetric Analysis (TGA) of gold-glutathione-SnCe6
nanoparticles (Au-GS-SnCe6), NNG.3 (2.3 nm), NNG.5 (5.4 nm) and NNG.7
(6.24 and 1.73 nm). .................................................................................................... 71
Figure 3-9 X-ray diffraction (XRD) pattern of the residue left in the pan after
thermal gravimetric analysis, confirms presence of elemental gold in sample

vii
NNG.4. The pattern is indexed and shows the expected stick pattern (red) for
gold metal. ................................................................................................................. 72
Figure 3-10 Transmission infra-red spectra of free glutathione, tin chlorin e6,
glutathione-gold (Au-GS) particles, samples NNG.1 (2.6 nm), NNG.4 (5.2 nm)
and NNG.6 (6.07 and 1.97 nm), and their conjugated products (Au-GS-SnCe6),
NNG.3 (2.3 nm), NNG.5 (5.4 nm) and NNG.7 (6.24 and 1.73 nm) respectively. ........ 73
Figure 3-11 UV-visible absorption spectra of glutathione-gold (Au-GS)
nanoparticles, samples NNG.1 (2.6 nm), NNG.4 (5.2 nm) and NNG.6 (6.07 and
1.97 nm) in water (top) and phosphate buffer solution (bottom).................................. 74
Figure 3-12 UV-visible absorption spectra of gold-glutathione-tin chlorin e6
(Au-GS-SnCe6) nanoparticles, NNG.3 (2.3 nm), NNG.5 (5.4 nm) and NNG.7
(6.24 and 1.73 nm) in water (top) and phosphate buffer solution (bottom). ................. 75
Figure 3-13 Lethal photosensitisation of S. aureus 8325-4 using a SnCe6-GS-Au
nanoparticle conjugate and 30 min white light exposure. L-= no light, S-=no
sensitiser .................................................................................................................... 76
Figure 4-1 Schematic diagram adapted from Sandroff and Herschbach44 which
represents colloidal gold in the citrate complex. The citrate is strongly bound at
sites where oxidation states of the gold +1.................................................................. 82
Figure 4-2 Normalized absorption spectra Aabs(λ) of gold spheres with diameters
of 10–100 nm in water144 (left). Surface plasmon bandwidth as a function of
particle diameter14 (right). .......................................................................................... 84
Figure 4-3 Structures of the thiazine family of dyes ................................................... 85
Figure 4-4 UV-visible absorption spectra showing the effect of increasing the
concentration of toluidine blue (TBO) in a gold nanoparticle solution. The total
toluidine blue concentration of 0.238 µM (yellow line) was obtained by the
addition of 1 mL of toluidine blue (5 µM) to 16 mL of gold nanoparticle solution. ..... 90
Figure 4-5 UV-visible absorption spectra showing the effect of increasing the
concentration of methylene blue (MB) on a gold nanoparticle solution. The total
methylene blue concentration of 0.29 µM (yellow line) was obtained by the
addition of 1 mL of methylene blue (5 µM) to 16 mL of gold nanoparticle
solution. ..................................................................................................................... 91
Figure 4-6 UV-visible absorption spectra showing the effect of increasing the
concentration of methylene blue (MB) an aqueous solution. The total methylene

viii
blue concentration of 0.29 µM (yellow line) was obtained by the addition of 1 mL
of methylene blue (5 µM) to 16 mL of deionised water. ............................................. 92
Figure 4-7 UV-visible absorption spectra of thionin (Th) in a gold nanoparticle
solution. The total thionin concentration of 0.588 µM (yellow line) was obtained
by the addition of 1 mL of thionin (10 µM) to 16 mL of gold nanoparticle
solution. The maximum absorption at 604 nm was observed after 6, 1 mL
additions of thionin (10 µM), where the final concentrations was 2.727 µM. .............. 93
Figure 4-8 UV-visible absorption spectra of azure A (Az A) in a gold
nanoparticle solution. The total azure A concentration of 0.588 µM (yellow line)
was obtained by the addition of 1 mL of azure A (10 µM) to 16 mL of gold
nanoparticle solution. The maximum absorption at 635 nm was observed after 15
additions of 1 mL azure A (10 µM) where the final concentration was 4.839 µM. ...... 93
Figure 4-9 UV-visible absorption spectra of azure B (Az B) in a gold
nanoparticle solution. The total azure B concentration of 0.588 µM (yellow line)
was obtained by the addition of 1 mL of azure B (10 µM) to 16 mL of gold
nanoparticle solution. The maximum absorption at 656 nm was observed after 4
additions of 1 mL azure B (10 µM) where the final concentration was 2.381 µM. ...... 94
Figure 4-10 UV-visible absorption spectra of azure C (Az C) in a gold
nanoparticle solution. The total azure C concentration of 0.588 µM (yellow line)
was obtained by the addition of 1 mL of azure C (10 µM) to 16 mL of gold
nanoparticle solution. The maximum absorption at 620 nm was observed after 17
additions of 1 mL Azure C (10 µM) where the final concentration was 2.381 µM. ..... 94
Figure 4-11 UV-visible absorption spectra of gold nanoparticles with increasing
concentrations of methylene blue in the presence of KCl (1×10⁻³ M). The total
methylene blue concentration of 0.29 µM (yellow line) was obtained by the
addition of 1 mL of methylene blue (5 µM) to 16 mL of gold nanoparticle
solution with KCl (1×10⁻³M). An enhanced absorption peak is observed at ca.
680 nm and an aggregation peak is observed at just below 800 nm. ............................ 97
Figure 4-12 The results from photon correlation spectroscopy (PCS) with a
Zetasizer 3000 to measure the size distribution of (a) gold nanoparticle solution,
(b) gold nanoparticle solution with methylene blue (0.79 µM) and (c) gold
nanoparticle solution with methylene blue (2.1 µM). .................................................. 98

ix
Figure 4-13 UV-visible absorption spectra tin chlorin e6 (SnCe6) in a gold
nanoparticle solution. The total tin chlorin e6 concentration of 22.22 µM
(turquoise line) was obtained by the addition of 2 mL of tin chlorin e6 (200 µM)
to 16 mL of gold nanoparticle solution. The structure of structure of tin (IV)
chlorine e6 is displayed at the top right of the figure. The four isosbestic points
are indicated with the black arrows............................................................................. 99
Figure 4-14 UV-visible absorption spectra of rose bengal (RB) in a gold
nanoparticle solution. The total rose bengal concentration of 5.556 µM (yellow
line) was obtained by the addition of 2 mL of rose bengal (50 µM) to 16 mL of
gold nanoparticle solution. The structure of rose bengal is displayed at the top
right of the figure. The three isosbestic points are indicated with the black arrows... 100
Figure 4-15 UV-visible absorption spectra of rhodamine B (Rho B) in a gold
nanoparticle solution. The total rhodamine B concentration of 5.556 µM (yellow
line) was obtained by the addition of 2 mL of rhodamine B (50 µM) to 16 mL of
gold nanoparticle solution. The structure of structure of rhodamine B is displayed
at the top right of the figure. The three isosbestic points are indicated with the
arrows. ..................................................................................................................... 101
Figure 4-16 Lethal photosensitisation of S. aureus by TBO (1 µM, 5 µ, 10 µM
and 20 µM) in the absence (green, G-) and presence (pink, G+) of gold
nanoparticles. ........................................................................................................... 102
Figure 4-17 Lethal photosensitisation of S. aureus by TBO (10 µM, 20 µM, 50
µM and 100 µM) in the absence (green, G-) and presence (pink, G+) of gold
nanoparticles. ........................................................................................................... 103
Figure 4-18 UV-visible absorption spectra of toluidine blue (TBO) (20 µM),
TBO (20 µM) + gold nanoparticle solution and only gold nanoparticle solution.
An enhanced absorption is observed for the TBO when gold nanoparticles and
TBO are mixed......................................................................................................... 103
Figure 4-19 Emission against time plot at 1260 nm after photoirradiation (532
nm) of a sample of gold nanoparticles and TBO (4.7 µM). The plot shows the
fluorescence emitted by singlet-triplet oxygen conversion, the area under the
curve is proportional to the amount of singlet oxygen generated. .............................. 104
Figure 4-20 Relative amounts of singlet oxygen produced for TBO and TBO +
gold nanoparticle solutions at different TBO concentrations. The concentration

x
of singlet oxygen produced is dependant on the concentration of toluidine blue
present...................................................................................................................... 105
Figure 4-21 Fluorescence spectra of toluidine blue (TBO) (5.5 µM) and TBO-Au
nanoparticle mixture, where the final concentration of toluidine blue is 5.5 µM.
The fluorescence of TBO is quenched in the presence of gold nanoparticles. ............ 105
Figure 4-22 Transmission electron microscopy images of citrate stabilised gold
nanoparticles (Sample NN1.2) at various magnifications. ......................................... 106
Figure 4-23 UV-visible absorption spectra of samples that have been found to
enhance the kill of bacteria (NN 1.2, NN 06.03.06) and samples that were
predicted to enhance the kill of bacteria (NN5 04. 05.06, NN 15.05.06).................... 108
Figure 4-24 Viable counts of S. aureus, when 20 µM toluidine blue and sample
NN06.03.06 are present. When the sample NN06.03.06 is diluted (1 in 10),
toluidine blue added then irradiated with white light for 30 secs there is a
statistically significant enhance of kill of bacteria of approximately 2 log10. ............. 108
Figure 4-25 Types of aggregates formed by dyes in solution.................................... 112
Figure 5-1 (a) Size-dependent photoluminescence colour and (b) schematic
presentation of size, colour, and photoluminescence wavelength of CdSe–ZnS
QDs. (c) Absorption (solid lines) and photoluminescence (broken lines) spectra of
CdSe QDs with various sizes taken from reference 161. ............................................. 122
Figure 5-2 Lethal photosensitization of Staph. aureus by TBO in the absence and
presence of various concentrations of 25 nm diameter CdSe/ZnS quantum dots. L
= light; QD = quantum dots; TBO = toluidine blue. .................................................. 129
Figure 5-3 Lethal photosensitization of Strep. pyogenes by TBO in the absence
and presence of various concentrations of 25 nm diameter CdSe/ZnS quantum
dots. ......................................................................................................................... 129
Figure 5-4 UV-visible absorption experiments at various concentrations of
quantum dots with and without toluidine blue (20 µM)............................................. 131
Figure 5-5 (a) Plot of intensity against time of the singlet oxygen decay produced
from quantum dots at 0.015 µM and toluidine blue at 20 µM (area under the curve
is proportional to singlet oxygen concentration). (b) Plot of ln[I]/[I]0
transformation of the first order exponential decay of singlet oxygen. (c) Graph
of the relative proportion of singlet oxygen produced as a function of the

xi
concentration of quantum dots whilst a constant concentration of toluidine blue
(20 µM) was maintained........................................................................................... 132
Figure 5-6 (a) Fluorescence spectra of quantum dots at 0.075 µM concentration
(blue ) and a mixture of quantum dots (0.075 µM)with toluidine blue, 20 µM
(pink). (b) Fluorescence spectra of quantum dots at 0.0375 µM concentration
(blue) and a mixture of quantum dots (0.0375 µM) with toluidine blue, 20 µM
(pink). (c) Fluorescence spectra of quantum dots at 0.015 µM concentration
(blue) and quantum dots (0.015 µM) with toluidine blue, 20 µM (pink). (d)
Fluorescence spectra of quantum dots at 0.0075 µM concentration (blue) and a
mixture of quantum dots (0.0075 µM) with toluidine blue, 20 µM (pink). The
fluorescence emission decreases as the concentration of quantum dots decreases.
The fluorescence emission of the quantum dots is reduced when TBO (20 µM) is
present. (e) The percentage fluorescence emission (expressed as fluorescence in
the presence of TBO/ fluorescence without TBO × 100) as a function of quantum
dot concentration in the presence of TBO 20 µM. The peaks between 700 and
750 nm in (a), (b), (c) and (d) are second order excitation peaks from the 365 nm
excitation.................................................................................................................. 133
Figure 5-7 Quenched fluorescence of quantum dots (0.0125 µM) in the presence
of various concentrations of TBO – the separation distance was in excess of
100,000 nm. ............................................................................................................. 134
Figure 5-8 Absorption of white light by quantum dots and emission at 627, which
is absorbed by toluidine blue. Toluidine blue is essential for the formation of
singlet oxygen and cytotoxic species which are lethal to bacteria.............................. 138

xii
List of Equations
1-1.................................................................................................................................3
1-2.................................................................................................................................9
1-3...............................................................................................................................10
1-4...............................................................................................................................12
1-5...............................................................................................................................23
3-1...............................................................................................................................69
3-2...............................................................................................................................70
3-3...............................................................................................................................70
4-1...............................................................................................................................82

xiii
List of Tables
Table 3-1 Ratios and masses used in the synthesis of gold–glutathione
nanoparticles. ..............................................................................................................63
Table 3-2 Summary of elemental analysis and calculated mass of tin chlorin e6
(SnCe6) per 100 mg of gold-glutathione-tin chlorin e6 of nanoparticles (Au-GS-
SnCe6). .......................................................................................................................69
Table 4-1 Dyes and concentrations used for the titration experiments. ........................87
Table 4-2 Summary of extinction coefficients and absorption data for thiazine
dyes in solution and adsorbed on to gold nanoparticles in solution...............................95
Table 4-3 The rates of addition of sodium citrate, to a solution of auric acid for
the synthesis of gold nanoparticles.............................................................................107
Table 4-4 Maximum absorbance wavelengths in UV-visible absorption spectra of
samples which enhance the kill of bacteria (NN 1.2, NN 06.03.06) and samples
that were predicted to enhance the kill of bacteria (NN5 04. 05.06, NN 15.05.06) .....109

xiv
List of Abbreviations
AMD Age Related Macular Degeneration
AZ A Azure A
AZ B Azure B
AZ C Azure C
CFU Colony Forming Units
CTAB Cetyl Trimethyl Ammonium Bromide
DNA Deoxyribonucleic acid
EDC 1-[3-(dimethylamino)propyl]-3-ethylcarbodiimide hydrochloride
G+ Gold Present
G- Gold not Present
GS Glutathione (bound)
GSH Glutathione
HOMO Highest Occupied Molecular Orbital
HRTEM High Resolution Transmission Electron Microscopy
IR Infra-Red
L+ Light
L- No Light
LAA Light Activated Antimicrobial
LAAA Light Activated Antimicrobial Agent
LUMO Lowest unoccupied Molecular Orbital
MB Methylene Blue
MBC Minimum Bacterial Concentration
MRSA Methicillin-Resistant Staphylococcus aureus
MWCO Molecular Weight Cut Off
P. Psuedomonas
PBS Phosphate Buffer Solution
PCS Photon Correlation Spectroscopy
PDT Photodynamic Therapy
QD Quantum Dots
RB Rose Bengal
Rho B Rhodamine B

xv
S+ Sensitiser
S- No Sensitiser
SnCe6 Tin Chlorin e6
S. / Staph. Staphylococcus
Strep. Streptococcus
Sulfo-NHS N-hydroxysulfosuccinimide sodium salt
TBO Toluidine Blue
TNBPPT 5,10,15,20-tetra(N-benzyl-4-pyridyl)porphyrin tetrachloride
TOAB Tetraoctylammonium Bromide
TGA Thermal Gravimetric Analysis
Th Thionin
UV-vis UV-visible absorption
XRD X-ray Diffraction

xvi
Contents Page
Chapter 1 Introduction...................................................................................................1
1.1 Overview............................................................................................................1
1.2 Gold ...................................................................................................................2
1.3 Colloidal Gold ....................................................................................................3
1.4 Clusters vs. Nanoparticles vs. Bulk .....................................................................4
1.5 Surface Plasmon Resonance................................................................................7
1.6 Theoretical Approaches to the Surface Plasmon Resonance ................................8
1.7 Synthesis of Colloidal Gold Nanoparticles ........................................................10
1.8 Biocompatible Nanoparticles ............................................................................21
1.9 Ligand Protected and Functionalised Gold Nanoparticles..................................22
1.10 Photodynamic Therapy ...................................................................................24
1.11 Thesis Structure ..............................................................................................31
Chapter 2 Toluidine blue–Tiopronin–Gold Nanoparticles............................................33
2.1 Introduction ......................................................................................................33
2.2 Experimental ....................................................................................................36
2.3 Results..............................................................................................................40
2.4 Discussion ........................................................................................................52
2.5 Conclusion........................................................................................................55
Chapter 3 Tin Chlorin e6-Glutathione-Gold Nanoparticles ..........................................57
3.1 Introduction ......................................................................................................57
3.2 Experimental ....................................................................................................62
3.3 Results..............................................................................................................64
3.4 Discussion ........................................................................................................76
3.5 Conclusion........................................................................................................80
Chapter 4 Charge Stabilised Gold Nanoparticles and Photosensitisers .........................81
4.1 Introduction ......................................................................................................81
4.2 Experimental ....................................................................................................86
4.3 Results..............................................................................................................90
4.4 Discussion ......................................................................................................109
4.5 Conclusion......................................................................................................118
Chapter 5 Quantum Dots and Toluidine Blue ............................................................120

xvii
5.1 Introduction ....................................................................................................120
5.2 Experimental ..................................................................................................125
5.3 Results............................................................................................................128
5.4 Discussion ......................................................................................................134
5.5 Conclusion......................................................................................................139
Chapter 6 Conclusion ................................................................................................140
6.1 Summary of Results........................................................................................140
6.2 Future perspectives .........................................................................................143
References.................................................................................................................144

Chapter 1 Introduction
1
Chapter 1 Introduction
This thesis presents the results of an investigation into the interactions between Light
Activated Antimicrobial Agents (LAAA) and nanoparticles. Light Activated
Antimicrobial Agents utilise incident radiation to produce reactive oxygen species
which are toxic to bacteria. Charge stabilised gold nanoparticles mixed with LAAAs’
were investigated, along with monolayer protected gold nanoparticles with LAAAs’
covalently attached. The nature of the protecting monolayer and LAAAs’ were
modified and their effect on the lethal photosensitisation of bacteria assessed.
Additionally the size of the gold core was modified in an attempt to find an optimum
size at which lethal photosensitisation of bacteria would be at its most efficient.
Finally, in order to uncover details of the mechanism by which this enhanced kill
operates, the composition of the core was changed from gold to a cadmium selenide.
These semiconductor quantum dots were used in conjunction with LAAAs’ in singlet
oxygen detection experiments to quantify the production of toxic oxygen species.
1.1 Overview
Lethal photosensitisation of bacteria is an emerging and promising treatment, which
utilises light in combating microbial infections. Its main advantage is the reduced
possibility of resistance. This thesis focuses on established photosensitisers such as
methylene blue, toluidine blue and tin chlorine e6, all of which have been widely
recognised as effective light activated antimicrobials.
Two different types of ligand stabilised nanoparticles have been synthesised: tiopronin
and glutathione, each attached to a different photosensitiser (toluidine blue and tin
chlorine e6). Additionally, charge stabilised gold nanoparticles have been investigated
with a wide variety of photosensitisers. Lastly, to understand the mechanisms observed
for the enhanced microbial kill, the core metal was changed to CdSe semi-conductor
quantum dots and singlet oxygen detection experiments were performed.

Chapter 1 Introduction
2
This introduction focuses on the properties and synthesis of gold nanoparticles. A brief
overview on the historical aspects of colloidal gold is presented, followed by a detailed
description of surface plasmon resonance (SPR). Various syntheses of gold
nanoparticles are discussed along with nucleation and growth mechanisms. Finally, the
lethal photosensitisation of bacteria is reviewed.
1.2 Gold
Gold has been the subject of investigation since ancient times. Its recent renaissance
has lead to an exponentially increasing number of publications, especially in the field
of nanoscience and nanotechnology.1,2 The extraction of gold started in the 5th
millennium B.C. near Bulgaria and reached 10 tons per year in Egypt (around 1200 -
1300 B.C).3 Known and highly valued since ancient times, gold is found in nature as
the free metal and in tellurides. It occurs naturally in veins and alluvial deposits, and is
often separated from rocks and other minerals by sluicing and panning operations. The
metal is recovered from its ores by cyaniding, amalgamating and smelting processes,
while refining is carried out by electrolysis.4
Gold in its pure state is considered to be beautiful and rare, hence a valuable metal. It
has a yellow colour when in bulk, though when finely divided it may be black, red, blue
or purple. In the bulk form gold is a soft yellow metal, which has a face centred cubic
crystal structure, and a melting point of 1064 °C. Gold is soft, ductile and malleable
and is usually alloyed to improve strength and durability. Gold’s reflectivity at
ultraviolet and visible light wavelengths is low; however it has high reflectivity at red
and infrared wavelengths.
Gold is a good conductor of heat and electricity, and is mostly unaffected by air, nitric,
hydrochloric, or sulphuric acid. However, a solution of aqua regia (3:1 of hydrochloric
acid:nitric acid) dissolves gold. Common gold compounds are auric chloride (AuCl3)
and chloroauric acid (HAuCl4).

Chapter 1 Introduction
3
1.3 Colloidal Gold
A colloidal dispersion is a system of particles which are dispersed in a continuous
phase of a different composition or state.5 Suspensions in liquids form the basis of a
wide variety of systems of scientific and technological importance, including paints,
ceramics, cosmetics, agricultural sprays, detergents, soils, biological cells, and in many
food preparations.5 A colloidal system is composed of two separate phases: a dispersed
phase (or internal phase) and a continuous phase (or dispersion medium). The
dispersions can have the appearance of a solution when dispersion is homogeneous.
Colloidal gold was used to colour glass and ceramics. A famous example of this is the
Lycurgus Cup (Figure 1-1) which is currently on display at the British Museum. This
is an extraordinary item, assumed to be made in Rome around the 4th century AD,6 and
is an example of dichroic glass. Dichroic glass changes colour when held up to light.
The Lycurgus cup appears green in daylight or reflected light, changing to red when
illuminated from the inside or in transmitted light. These unusual optical properties are
attributed to the presence of tiny amounts of colloidal gold – silver alloy present in the
glass. Although this colouring of glass was described in Roman times, the production
of gold – ruby glass was not rediscovered in Europe until the 17th century, when
sizeable red glass vessels were manufactured by adding ‘Purple of Cassius’. Purple of
Cassius is a colloid resulting from the heterocoagulation of gold particles and tin
dioxide and was named after Andreas Cassius who described it in his treatise De auro
in 1685.3
In the manufacture of Purple of Cassius, a solution of auric chloride (AuCl3) was
treated with tin chloride (SnCl2). AuCl3 is reduced to colloidal gold and SnCl2 is
oxidised to SnCl4. The SnCl4 formed undergoes hydrolysis to form SnO2.2H2O. The
overall reaction can be thought of as:
2 AuCl3 + 3 SnCl2 + 6 H2O 2 Au + 3 SnO2 + 12 HCl
1-1
Purple of Cassius is colloidal SnO2 with absorbed colloidal Au.

Chapter 1 Introduction
4
Figure 1-1 The Lycurgus cup, appears red in transmitted light (right) and green in reflected light
(left) due to the presence of gold/silver colloids.
An early book on finely divided gold which has been preserved, was published in 1618
by Francisco Antonii.7 This book contained considerable information on the formation
of colloidal gold, the medical uses of colloidal gold sols and successful cases where
these gold sols had been used for treatment. The synthesis involved the use of plant
extracts which, unbeknown to the alchemists stabilised the sols. The sols were
supposedly infused with medicinal virtues, which could cure disease and improve
strength. Johann Kunckels, a German chemist published a book in 1676 describing
“drinkable gold that contains metallic gold in a neutral, slightly pink solution that exert
curative properties for several diseases”. These diseases included heart and venereal
problems, dysentery, epilepsy, and tumours. Colloidal gold was used for the diagnosis
of syphilis. By the mid eighteenth century it became apparent to alchemists that
‘aurum potable’- drinkable gold was just finely divided gold in a liquid, and was devoid
of any magical, medicinal or at that point therapeutic qualities.7
1.4 Clusters vs. Nanoparticles vs. Bulk
The properties of materials change as their size approaches the nanoscale, and as the
percentage of atoms at the surface of a material becomes more significant. Bulk
materials possess relatively constant physical properties regardless of their size, but at
the nanoscale this is often not the case. As the material becomes smaller the percentage

Chapter 1 Introduction
5
of atoms at the surface increases relative to the total number of atoms of the material
bulk (Figure 1-2). This can lead to unexpected properties of nanoparticles which are
partly due to the surface of the material dominating over the bulk properties. Size-
dependent properties are observed such as quantum confinement in semi-conductor
particles,8 surface plasmon resonance in noble metal particles2 and superparamagnetism
in magnetic materials.9
In 1981 Schmid et al.10 reported the synthesis of the cluster [Au55(PPh3)12Cl6], which
was unique with its low size distribution (4.0 ± 0.4 nm). The synthesis of this cluster is
difficult, and it was not until 1993 that the stabilisation of nanoparticles with
alkanethiols was first reported by Mulvaney and Giersig.11 The particles synthesised
by Schmid et al.10 displayed quantum confinement properties, where the band gap is
sufficiently increased and there is quantisation of discrete electronic energy levels.
These well defined phosphine stabilised particles were less than 10-9 m in diameter.
Particles this small are better thought of as clusters of metal atoms.12 Schmid’s group
reported that the [Au55(PPh3)12Cl6] cluster had discrete energy level spacings of 170
meV which was attributed to the Au55 gold core.13
If the diameter of a gold clusters is above 3 × 10⁻⁹ m the electronic structure of the
particles shifts towards the band structure of bulk gold. The number of atoms in each
particle increases and so they are not easily countable. The crystal structure becomes
cubic closed packed as in bulk gold and each particle can be made up from more than
one crystallite.3 Gold particles between the size interval of 3 × 10⁻⁹ m and 5 × 10⁻⁷ m
have interesting optical properties, the most dominant being surface plasmon
resonance.14 The surface plasmon resonance is a strong absorbance at a specific
frequency, which induces the collective oscillation of electrons at the surface of the
gold particle that gives gold colloids their characteristic colour. Particles above 5 × 10-
7 m no longer display the surface plasmon resonance in the visible part of the
electromagnetic spectrum and gradually move towards the properties of bulk gold.6

Chapter 1 Introduction
6
Figure 1-2 Graph illustrating the relationship between the radius of the particle and the surface to
bulk ratio. As the particle becomes smaller the surface to bulk ratio increases. Inset is a
representation of face centred cubic structure of most metals as small particles. A cuboctahedral
cluster of 792 atoms has 50% contributing to the surface, and a cluster of 10 atoms has 100% of the
atoms contributing to the surface.15
Gold particles between the size interval of 3 × 10⁻⁹ m and 5 × 10⁻⁷ m have a large
surface to volume ratio. A significant proportion of atoms in this structure are surface
atoms (Figure 1-2). Therefore any reactions that occur at the surface are amplified due
to the large expanse of exposed surface. A detailed review of small gold nanoparticles
and their reactions has been presented by Daniel and Astruc.3
Nanoparticles are often described as structures with a diameter in the range of 10 – 100
nm.6 This description is often arbitrary as some nanoparticles with larger diameters
display behaviour exclusively associated with nanoparticles. Gold particles about 100
nm in diameter still display the surface plasmon, albeit with the Tyndall effect.16 The
Tyndall effect results from the scattering of light waves from the surface of a particle.
When the wavelength of incident light is the same size or smaller than the particle a
haze is observed from the suspensions of these particles in air or liquids.17,18 Shorter
wavelengths of light (blue) are reflected or scattered whereas longer wavelengths (red)
pass straight through. In the work reported in this thesis, the gold nanoparticles
synthesised typically have a diameter less than 30 nm. These particles are not large
0
0.5
1
1.5
2
2.5
3
0 5 10 15 20 25 30
Radius (nm)
Su
rface
to B
ulk
Rati
o

Chapter 1 Introduction
7
enough to display the Tyndall effect, but did have a surface plasmon resonance in the
visible part of the spectrum.
1.5 Surface Plasmon Resonance
At the nanometer scale, particles display properties that are not inherent in individual
atoms or to those in the bulk macroscopic material. The optical properties of gold
nanoparticles are decidedly dependant on19:-
• Particle size
• Interparticle distance
• Type of surfactant
• Shape of the nanoparticle
• Dielectric constant of the dispersion medium
In a nanoparticle many of the atoms are located on the surface, hence unusual
properties are observed which are not present in the bulk or in individual atoms. One
of these optical phenomena is surface plasmon resonance. The deep coloured nature
from orange through to deep purple, of colloidal gold is a result of the surface
plasmon.2 At this nanometer scale the ‘quantum size effect’ becomes significant as the
de Broglie wavelength of the valence electrons is in the same size range as the particle
itself. The particles are then considered to be zero-dimensional quantum dots or
quantum boxes, and are subject to quantum mechanical rules. Freely mobile electrons
are trapped effectively in quantum boxes and hence exhibit a collective oscillation
frequency associated with the plasmon resonance in the presence of light. In gold
nanoparticles there is a gap between the valence and the conduction bands. Hence
there is a size induced metal-insulator transition where size dependent quantisation
effects occur. This leads to standing electron waves with discrete energy levels.3
Surface plasmon resonance manifests itself when the electric field of the incoming
radiation induces a dipole on the nanoparticle. There is a restoring force that tries to
compensate for this dipole, so that a unique resonance frequency is formed which
matches the electron oscillation frequencies within the particle (Figure 1-3). This

Chapter 1 Introduction
8
frequency of oscillation is equal to the frequency of resonant light, and as the particle is
much smaller than the wavelength of incoming light it is homogeneously polarised.
The plasmon resonance band is observed at approximately 530 nm for gold
nanoparticles of diameter 5-20 nm.6
Figure 1-3 Illustration of the excitation of a dipolar surface electron oscillation, surface plasmon
resonance by the electric field of incoming light on gold nanoparticles.
As mentioned above, a result of the surface plasmon effects is that the sols appear
coloured. When particles are small (~10 nm) they appear ruby red due to the
absorption of green light at around 520 nm. If these particles are allowed to coalesce in
a controlled fashion by the addition of electrolytes, a colour change is observed. The
red goes through pink and violet to blue as the nanoparticles grow. This is due to a
change in the absorption spectrum upon aggregation, causing the increased absorption
of red light.1
1.6 Theoretical Approaches to the Surface Plasmon Resonance
Existing theories that describe the interaction of light and matter have been applied to
spherical and non-spherical gold particles. Mie described the surface plasmon
resonance quantitatively by solving Maxwell’s equations.20 Mie theory relates the
Direction of light
propagation
Electric field Spherical metal particle
Surface electron density (e- cloud)
+
+ –
–

Chapter 1 Introduction
9
surface plasmon resonance to the complex dielectric constant of the metal. The total
extinction cross section (σext) composed of absorption and scattering is given as a
summation over all electric and magnetic multiple oscillations. Mie theory is
conceptually simple and has been applied in explaining experimental results.21
In particles where the wavelength of incident radiation is much smaller than the particle
itself, the polarisation of the particle is such that only dipolar surface plasmons are
excited. In these cases the wavelength (λ) of incident light is ( λ >> 2R) where R is the
radius. In the case of gold where 2R < 25 nm only the dipole absorption of the Mie
equation contributes to the extinction cross section of the nanoparticles (σext). Mie
theory is then reduced to a dipole or quasi–static approximation where the surface
plasmon resonance frequency is largely size independent:
1-2
where V is the volume of a spherical particle, c is the speed of light, ω the angular
frequency of the exciting frequency, and εm is the dielectric constant of the surrounding
medium (assumed to be frequency independent). ε1(ω) and ε2(ω) are the real and
imaginary parts respectively of the frequency dependant dielectric function of gold.14
The imaginary part of the dielectric function of the surrounding medium is assumed to
be zero. This is a reasonable approximation for most non metals at visible frequencies.
From equation (1-2) it is deduced that resonance occurs when ε1(ω) ≈ – 2 εm if ε2 is
small. With this dipole quasi–static approximation, the size of the particle is not
explicitly included in the equation, but inferred through the volume (V) which is solely
dependant on the radius (R).14 Nonetheless, experimentally it has been found that there
is a strong size dependence of the surface plasmon band width and position. The
position of the absorption maximum is affected through a blue shift as the particles get
smaller and a red shift as the particle grows.20 Modifications of Mie theory can be
made, to take into account the size dependence using the Drude model.6 The dielectric
function of the gold nanoparticle is assumed to become size dependant [ε = ε (ω, R)].
This results in a size absorption cross section even within the dipole approximation.6
( )
( )[ ] ( )22
21
2/3
2
9
ωεεωε
ωωεεσ
++×=
m
mmetx
c
V

Chapter 1 Introduction
10
Equation (1-2) can be used to describe the lifetime of the surface plasmon resonance.
The decay of surface plasmon oscillations mostly occurs through non–radiative
pathways, such as scattering from the metal surface, electron–phonon and electron–
electron scattering or transfer of energy from the collective electron oscillations to
individual electron excited states. Additionally, radiative decay through electron–
photon decay also occurs.22
1.7 Synthesis of Colloidal Gold Nanoparticles
Gold nanoparticles were largely overlooked by research chemists before the 1850’s;
however they were used to decorate ceramics and glass. In 1857, Michael Faraday
performed the first reliable systematic investigation of gold colloids.23 The methods of
producing colloidal gold solutions involved using single phase and two phase systems
with different solvents and reducing agents, some of which were extremely hazardous.
Faraday synthesised gold nanoparticles by the reduction of AuCl3 by phosphorous. The
paper was innovative because it contained the first mention of the sensitivity of gold
nanoparticles to electrolytes. Another important feature in this paper was the account
of using macromolecules as ‘protective agents’ or surfactants to stabilise these
nanoparticles against aggregation. As a testimony to the accuracy of his paper, several
of Faraday’s original nanoparticle solutions still exist today, and are kept at the Royal
Institution where he worked. Subsequently, the solution phase synthesis of gold
nanoparticles has been almost exclusively achieved by the reduction of hydrogen
tetrachloroaurate.
[HAuCl4] + 3e- Au0 + H+ + 4Cl-
1-3
Hydrogen tetrachloroaurate is a fairly strong oxidising agent (E° = +1.002 V),24
therefore mild reducing agents can be used to reduce the gold to Au(0). When
synthesising gold nanoparticles, the main emphasis has been placed on keeping the
reaction simple to produce uniform particles that are of controllable diameter. A
variety of methodologies have been reported using different reducing agents, stabilising
agents and solvating media.3 All methods vary considerably but have in common the

Chapter 1 Introduction
11
use of hydrogen tetrachloroaurate (HAuCl4). Hydrogen tetrachloroaurate can be
prepared by dissolving gold in aqua regia and evaporating the acid by heating. A few
cycles of HCl addition followed by evaporation are required. Afterwards, some cycles
of water addition followed by evaporation are needed to remove the excess acid. The
final product is a hygroscopic yellow/orange solid which has a pH of ca. 1 when
dissolved in water.25 A solution of hydrogen tetrachloroaurate in methanol or water is
usually used to synthesise gold nanoparticles. Typical reducing agents used to form
gold nanoparticles include citrate, tannic acid, amino acids and sodium borohydride.
Improvements in analytical techniques throughout the 19th and 20th century have
stimulated interest in nanoparticular science. In the late nineteenth century
breakthroughs in the synthesis of colloidal gold were made by Zigsmondy, as colloidal
gold was the main experimental subject used when developing the ultramicroscope.7
He described methods for the synthesis of colloidal gold with different particle sizes,
using hydrogen peroxide, phosphorus and amines as reducing agents. In 1925
Zigsmondy was awarded the Nobel Prize in Chemistry ‘for his demonstration of the
heterogeneous nature of colloid solutions and for the methods he used, which have
since become fundamental in modern colloid chemistry’.7 In 1924 Ostwald26
synthesised gold nanoparticles using an electrical arc. Around this time the
composition of colloidal gold was determined to be an elemental gold core with an
anionic protective double layer of charges (Figure 1-4).27
Figure 1-4 Crystalline core of elemental Au with adsorbed AuCl2- ions which make up the inner layer
of the ionic double layer on a gold nanoparticle, synthesised by a citrate reduction.
H+
H+ H+
H+
H+
H+
H+
H+
H+
H+
H+
H+
H+
H+
AuCl2-
H+ H+

Chapter 1 Introduction
12
A straight forward synthesis of gold nanoparticles was reported by Turkevich et al. in
1951.28 Their study focused on the process of nucleation and growth in the synthesis of
nanoparticles. The synthesis required the use of inexpensive sodium citrate as the
reducing agent, in a solution of chloroauric acid. This method produced gold
nanoparticles of about 20 nm with 12.5% standard deviation in particle size. The
synthesis involved dissolving gold chloride in water and boiling the solution. Another
solution of trisodium citrate in water was prepared and added to the boiling water and
dissolved gold chloride. The gold ions were reduced by the citrate and gold particles
are stabilised against aggregation by the citrate:
NaOOC COONaHO COONa
2 AuCl3(aq) 2 Au(S) 3 CO2(g)9 NaCl HOOC COOHO
+ + + +3 33 HCl + 1-4
Turkevich’s paper would have gone largely unnoticed without Fren’s landmark paper
in 1973.18 Fren found that by controlling the amount of citrate added to the chloroauric
acid solution, the size of nanoparticles obtained could be varied. Although
monodispersity over 30 nm was poor, this was the first reliable attempt to regulate the
size of gold nanoparticles. Fren’s paper has been cited 2273 times (as of 19th
November 2008), and is among the most cited paper in colloidal science; noted for is
simplicity in synthesis of colloidal gold and its potential applications, from other areas
of particle science to cell biology.
Slot and Gueze29 used tannic acid in conjunction with sodium citrate in a modified
Turkevich synthesis of gold nanoparticles. The concentration of tannic acid was found
to be responsible for the final diameter of the nanoparticles, which can be as small as 3
nm. If the concentration in the final volume of tannic acid was very high, K2CO3 was
used to neutralise the solution. Tannic acid is a rapid reductant and sodium citrate is a
slower reductant. Therefore by modifying the ratio of these two components the
desired diameter was obtained.29 In 1981 they used ascorbic acid as a reducing agent.30
Whilst using ascorbic acid as a reducing agent, K2CO3 was again used to neutralise the
solution. This method yielded nanoparticles with a diameter of approximately 12 nm.

Chapter 1 Introduction
13
Mulvaney and Giersig11 further developed the Turkevich synthesis by stabilising the
gold nanoparticles against aggregation with alkanethiols. They found that the gold sols
crystallise in a hexagonal close packed lattice and that the mean particle spacing
depends on the thickness of the stabilising layer – the chain length of the stabilising
alkanethiol.
The syntheses described so far have all been in aqueous media. The popularity of
Turkevich’s and related syntheses has been due to their simplicity. The gold ions and
stabilising citrate are both soluble in water; therefore reduction can be done in one
simple step, usually without the need for additional reagents. Bio-conjugation of gold
nanoparticles and DNA or enzymes can be achieved through aurophilic sulphur
containing biological compounds such as cystine.
There are some disadvantages to the syntheses of gold nanoparticles carried out in
aqueous media. Control over particle size and monodispersity is more difficult in
water. The ionic interactions of the particles in water limit the concentration of gold
nanoparticles in solution to very dilute levels. Consequently, the nanoparticles can not
be removed from aqueous media to form a re-dispersable powder.
Synthesis of gold nanoparticles in organic media has overcome some of the
disadvantages presented by aqueous methods. Highly monodisperse gold nanoparticles
have been synthesised, with control over particle size. Higher concentrations of gold
nanoparticles can be prepared and they can be removed from the solvent and stored in
air without aggregation. This was achieved by Brust in 1994.31
The Brust-Schiffrin method31 for gold nanoparticle synthesis takes inspiration from
Faraday’s original paper.23 The two phase system they developed uses thiol ligands
that strongly bind to gold due to their mutual soft character (Figure 1-5). In Pearson’s
terms, a gold ion is a soft acid. In general, soft acids have low positive charge and have
unshared pairs of electrons in their valence shells. They have high polarisability and
low electronegativity (low LUMO). Accordingly thiols (RSH) are soft bases; they have
low electronegativity (high HOMO), hence hold their valence electrons loosely and are

Chapter 1 Introduction
14
easy to polarise. Soft acid (low LUMO) and soft base (high HOMO) interactions
results in the orbitals being closer in energy which in turn gives a covalent bond.32
Figure 1-5 Schematic representation of the Brust-Schiffrin method of synthesis of thiol capped gold
nanoparticles using sodium borohydride as the reducing agent.
In the Brust-Schiffrin method for the synthesis of thiol capped gold nanoparticles,
AuCl4- ions were dissolved in an aqueous phase. These were transferred to the organic
phase with the aid of a phase transfer reagent, tetraoctylammonium bromide (TOAB).
The gold ions were then reduced by sodium borohydride in the presence of
dodecanethiol, which capped the nanoparticle. The gold nanoparticles remained in the
organic phase, which was indicated by the colour change of the organic phase from
colourless through orange to deep brown.
The Brust-Schiffrin synthesis allowed the facile synthesis of thermally stable and air
stable gold nanoparticles which had a narrow size distribution. These nanoparticles
could be repeatedly isolated and re-dispersed in common organic solvents without
irreversible aggregation and decomposition, a highly desirable property which could
allow further manipulation.
Brust et al.33 in 1995 used sodium borohydride to reduce a solution of HAuCl4 in a
single phase reaction. This reaction was carried out in methanol and the capping thiol
S
S
SS
SS
SS
SS
SS
NaBH4
HSHAuCl4 Au

Chapter 1 Introduction
15
was p-mercaptophenol. Acetic acid was added to prevent the de-protonation of p-
mercaptophenol. Sodium borohydride is a very potent reducing agent, hence the
reaction was extremely rapid and the particles obtained had a diameter of ca. 2 nm.
The nanoparticles synthesised by the Brust method could be handled and modified just
as stable organic and molecular compounds. This instigated the investigation into
various surfactants and incorporated the use of more bulky ligands.3 The development
of thiol stabilised gold nanoparticles allowed the fuctionalisation of the organic chains
of the surfactants. Murray et al.34 described ‘place exchange’ reactions, where a
controlled proportion of thiol molecules around the gold core were exchanged with
functionalised thiols, and the subsequent reaction of the functionalised gold
nanoparticles.
In addition to the two main synthetic approaches of Turkevich and Brust, many other
methods have developed to produce gold nanoparticles. These methods include seeded
growth of gold nanoparticles and the use of microemulsions.
Seed mediated synthesis approaches were introduced by Nikoobakht and El-Sayed35 to
grow gold nanorods. Spherical gold nanoparticles have also been grown using this
method. Studies have shown that successful control of size can be achieved by
modifying the ratio of seed to metal salt.36 A step–by–step particle enlargement is
more successful than a one step seeding method as this avoids secondary nucleation.
Brown et al.36 described a synthesis where gold seeds were prepared by borohydride
reduction. They improved on this synthetic protocol, by developing a room
temperature seeding method of using NH2OH / Au3+ to grow nanoparticles up to 100
nm.37 This iterative seeding method is consistent and reproducible and can be used to
rapidly produce large colloidal gold nanoparticle solutions that exhibit excellent
monodispersity. Spherical nanoparticles of 50 nm can be synthesised from 12 nm
seeds.36
A non-iterative seeding method of producing gold nanoparticles was reported by Sau et
al.38 They used photochemically prepared seeds to grow monodisperse highly
spherical gold nanoparticles. Seeds were synthesised from chloroauric acid in water by

Chapter 1 Introduction
16
irradiation by UV light from a germicidal lamp in air. Reduction of gold ions was
carried out in the presence of a poly(oxyethylene)iso-octylphenyl ether (Triton X-100)
which acted as a capping agent and reductant. These seeds could be prepared with
average diameters ranging between 5 to 20 nm. The seeds were then grown to
diameters of 25-110 nm by varying the ratio of seed to Au3+ in the solution and using
ascorbic acid as the reductant.
Figure 1-6 Representation of reverse micelle, water – in – oil [w/o](left) and normal micelle, oil – in –
water [o/w](right) phases. The reverse micelle, water – in – oil [w/o](left), can be used in the synthesis
of gold nanoparticles.
The use of microemulsions, co-polymer micelles and reversed micelles has also been
used in the synthesis of gold nanoparticles. Microemulsions are transparent, isotropic,
thermodynamically stable dispersions of two immiscible liquids. These liquids are
commonly an oil and water, which are stabilised by surfactants. These systems can
form normal micellar oil – in – water [o/w] or reverse micellar water – in – oil [w/o]
phases (Figure 1-6). An important feature of water – in – oil microemulsions is their
ability to solubilise guest molecules such as inorganic precursor salts. In one synthesis
of gold nanoparticles, HAuCl4 is dissolved in the aqueous droplets stabilised by cetyl
trimethyl ammonium bromide (CTAB), reduced with sodium borohydride, and then
Hydrophilic head Organic Media
Hydrophobic tail Aqueous Media
Micelle [o / w] Reverse micelle [w / o]

Chapter 1 Introduction
17
removed from the solvent. The water droplets act as microreactors for the nucleation
and growth of the particles. The size of the aqueous core of the micelle controls the
size of the resulting nanoparticles.39
As described above many methods of gold nanoparticle synthesis have been developed
using different reducing agents, stabilising agents and solvents. The reducing agent
reduces Au(III) to Au(0), and since HAuCl4 is a strong oxidising agent many reducing
agents can, and have been used.
One of the main reasons why so many synthetic approaches to the synthesis of gold
nanoparticles have been developed is to achieve particles of specific sizes with narrow
particle size distributions, and low standard deviations. Narrow size distributions are
highly desirable because, the application of mathematical models on physical and
optical properties of gold on nanoparticles assumes monodispersity. These models are
more accurate if the sizes of the nanoparticles in the sample are identical.
Monodispersity, where all particles are identical in shape and size, is extremely
advantageous but rarely achieved. Therefore, monodisperse is a term applied to
samples where particles have size distributions with standard deviations less than
15%,40 and samples with standard deviations less than this are termed highly
monodisperse. Particle size distributions are commonly measured using high resolution
Transmission Electron Microscopy (TEM) or Scanning Electron Microscopy (SEM)
images. More recently, dynamic light scattering equipment has been used to measure
particle size distributions in solutions. A major advantage of this technique is the speed
at which results and particle size distributions are obtained. However, the results need
to be interpreted with caution as the size obtained is often a hydrodynamic radius and
not the nanoparticle core size. Therefore, if large organic groups with many charges on
the outside are used to coat the gold particles, or due to the nature of the coating many
particles are attracted to each other in solution, the total hydrodynamic radius is
observed and not the core size.
In order to achieve monodisperse particles the nucleation and growth mechanisms need
to be understood and controlled. It is commonly believed that in order to achieve

Chapter 1 Introduction
18
monodisperse particles in the liquid phase, homogeneous precipitation and the
separation of nucleation and growth phases is required. In homogeneous precipitation a
single burst of nucleation occurs when the concentration of the constituent species
reaches a critical supersaturation. The nuclei obtained are allowed to grow by the
diffusion of solutes from the solution to the surface until a stable final size is achieved.
This is heterogeneous growth of surface reactions which leads to the addition of atoms
to the nucleated particle, increasing its size. When this heterogeneous step is slower
and uniform the resultant particles are monodisperse. This model was first proposed by
LaMer et al.41 deduced from their work on particles of sulphur. Their conclusions have
since been applied to the nucleation and growth of any solid particles from the liquid
phase.
Figure 1-7 LaMer diagram as a schematic explanation for the formation process of monodisperse
particles, where C∞ and Ccrit are the equilibrium concentration of solute with the bulk solid and the
critical concentration as the minimum concentration for nucleation, respectively. The regions I, II,
and III represent the prenucleation, nucleation, and growth stages, respectively
LaMer’s model is shown in Figure 1-7, where the concentration of the precursor solute,
C, increases to the critical level for nucleation (I), Ccrit. At this concentration there is a
balance between the supply rate of the precursor solute, and the consumption rate for
the nucleation and the growth of the generated nuclei (II). There is an increase in the
consumption of the solute needed for the growth of the generated nuclei the nucleation
ends (II) as solute concentration reaches Ccrit again. The concentration of the solute
continues to decrease resulting from the growth of the generated stable nuclei, under
the supersaturation level, which is below the critical level for nucleation with out re-
Ccrit
Time
Con
cent
ratio
n of
Sol
ute
I II III
C∞

Chapter 1 Introduction
19
nucleation (III). The final number of the monodisperse particles are determined by the
nucleation stage and kept constant through the growth stage.
A problem with LaMer’s model when applied to the formation of gold sols using
Turkevitch’s method is that the particles growing homogeneously and spontaneously
from solution need to achieve a critical size before growth is energetically favourable.
Below this size the particles spontaneously dissolve. Different materials at various
reaction conditions predictably have different critical sizes and for gold it is thought to
be a cluster of 20 atoms.28 LaMer explained the spontaneous formation of particles
greater than its critical size by statistical fluctuations.41 However, Turkevitch believed
the formation of colloidal gold was through a mechanism of chelation of multidente
agents that produced clusters of un-reacted gold.28 These loosely bound clusters of
polymeric gold / reducing agent grows to a critical size which results in the rapid
reduction to form an Au(0) nucleus.
Monodisperse uniform particles have also been obtained from multiple nucleation
events. The uniformity of the final particles can be explained by self-sharpening or
Ostwald ripening (Figure 1-8). Ostwald ripening involves atoms from one particle
dissolving and transferring to another. This is a dynamic process where both particles
exchange atoms, but the rate of loss from smaller particles is higher. This is because
atoms in smaller particles have lower average coordination numbers at the surface
which facilitates ease of removal. The process is driven by a reduction in surface
energy. This results in the larger particles growing at the expense of the smaller
particles, which shrink and eventually disappear.42
Figure 1-8 Schematic representation of Ostwald ripening of nanoparticles. This is a dynamic process
which occurs by evaporation, recombination of atoms from one cluster to another.

Chapter 1 Introduction
20
Nucleation and growth of Turkevitch’s particles may be the result of a multifaceted
mechanism where more than one process is involved. It was found by Chow and
Zukoski that the number of nuclei continues to increase even at the very final stages of
the precipitation reaction.43 They postulated two mechanisms for the increasing
concentration of nuclei over the course of the reaction.
1. Nuclei continuously form and grow over the course of the reaction
2. Particles nucleate in small bursts and agglomerate weakly. They continue to
grow within agglomerates, and as the reaction proceeds the agglomerates fall apart,
giving rise to the continual increase in the number density of nuclei.
Their investigation concluded that the synthesis of gold nanoparticles in Turkevitch
inspired reactions proceed through a mechanism which involves the formation of large
particles that shrink with time over the course of the reaction. This conclusion was
arrived at by monitoring the shift in wavelength of the maximum absorption λmax which
is associated with the surface plasmon. The λmax initially lies near 590 nm giving a
purple appearance to the solution. Over the course of the reaction, λmax shifts towards
525 nm where it remains constant and corresponds to a red colour. They correlated this
to the loss of Au(III) in solution, indicating that the large particles must contain Au(0),
in the reaction medium.43
In essence, modification of LaMer’s model is needed, which allows the inclusion of
nuclei particles being able to reversibly aggregate. These larger particles then fall apart
as the reaction proceeds resulting in uniform sols. Aggregation of particles is an
energetically favourable process, as the surface of a material is a region of high energy.
Since nanoparticles have a high surface–to–bulk ratio, aggregation of these particles
becomes highly energetically favourable. Aggregation can continue after the
exhaustion of the solution phase constituents of the particles, by the particles
themselves coalescing. When the particles collide they can merge and form a larger
particle, increasing stability. Smaller particles are more likely to be consumed by
larger particles because of their extremely high surface to bulk ratio. This process can
lead to the loss of all of the small particles, resulting in the loss of properties associated

Chapter 1 Introduction
21
with the nanoscale, with a fine metallic powder being deposited. Therefore a key
aspect of the synthesis is the role of stabilising agents to prevent agglomeration.
For gold nanoparticles there are two main types of stabilising agents, ionic and non-
ionic. Ionic stabilising agents include the citrate anion, which stabilise Turkevitch’s
sols. Citrate anions are attracted electrostatically to the gold particle surface.44 Here
the reducing agent is also the stabilising agent. These particles are said to be charge
stabilised. Non-ionic stabilising agents include amines45 and thiols.31 These can form
chemical bonds to the surface of the gold particles. This is certainly the case for thiols,
sulphur is extremely aurophilic in nature due to their soft character. Additionally, gold
and sulphur have electronegativity values (χ) of 2.54 and 2.58 Pauling units
respectively,46 which confirm their mutually strong covalent character. These particles
are said to be ligand stabilised. Both charge stabilised and ligand stabilised particles
prevent agglomeration by providing a physical barrier between particles.
Ligand stabilised nanoparticles can undergo further surface modification.47 This can
aid solubility in whichever polar or non-polar solvent is desired. Surfactants having
hydrophilic and lipophilic natures are chosen for this purpose. For example, long chain
thiols have been chosen so the particles could be dispersed in organic solvents33 where
as shorter thiols containing polar groups have been chosen for re-dispersion in aqueous
media.48 Dispersion in aqueous media is necessary for the use of gold nanoparticles in
biological systems.
1.8 Biocompatible Nanoparticles
Biocompatibility of gold nanoparticles has become highly desirable for application of
nanoparticles in biology.7 The term biocompatibility refers to the materials ability to
perform its function, usually medical, without exertion of undesired local or systemic
effects. Nanoparticles are now extensively studied because of their size dependant
chemical and physical properties; these properties have been commercially explored.
Gold nanoparticles have found applications in a number of biological fields including;
• Fluorescent biological labels49

Chapter 1 Introduction
22
• Drug and Gene delivery50,51
• Bio-detection 52,53
• Detections of Proteins48,54
• Probing DNA structures55
• Tissue engineering56
• Tumour destruction by heating (photothermal therapy, hyperthermia)57,58
• Separation and purification of biological molecules and cells59,60
• MRI contrast agents61,62
Nanoparticles exist in the same size domain as proteins which make them perfect for
tagging and labelling. Individual DNA strains are 2.5 nm wide and proteins are 1-20
nm in diameter.63 However, the size is just one of the many characteristics that
nanoparticles need to possess in order for them to be successful biological moieties. In
order for gold nanoparticles to effectively interact with a biological target, a biological
molecular coating or a layer which can act as a bio-inorganic interface needs to be
attached. This bio-inorganic interface could be composed of antibodies,64 biopolymers
(collagen56), or a monolayer of small peptide based molecules to make the nanoparticle
biocompatible (thiols,31 amines45). There are two strategic approaches to making gold
nanoparticles biocompatible; functionalisation of the ligand before assembly onto the
nanoparticle, and functionalisation of assembled nanoparticles.
1.9 Ligand Protected and Functionalised Gold Nanoparticles
Faraday reported the first comprehensive study on gold nanoparticles.23 The gold
nanoparticles synthesised by him were all synthesised in aqueous media. The synthesis
of gold nanoparticles in non-polar organic media is relatively recent, which was
sparked by Brust et al.31 with a synthesis previously described in this chapter. The
synthesis involved the transfer of chloroaurate ions in to the organic phase using a
phase transfer reagent such as tetraoctylammonium bromide (TOAB). The gold ions
are then reduced using sodium borohydride to yield monodisperse thiol capped gold
nanoparticles. Usually this renders the gold nanoparticles hydrophobic, and only
soluble in organic media. These surfactant stabilised gold nanoparticles behave like

Chapter 1 Introduction
23
new compounds which can be easily separated out of solution in the form of a
microfine powder and re-dissolved in a different organic media without significant
variation in particle size distribution.31
The Brust method has since inspired a plethora of gold nanoparticle syntheses using
alkane thiols,65 dialkylsulphides,66,67 alkylamines45 and thiolated cyclodextrins68 as
stabilising ligands. Adding functionality to the protecting ligand, for example a
carboxylic acid group to the terminal end of a thiol, results in the modification of the
chemical and physical properties of the gold nanoparticles. This dramatically increases
the potential applications of these nanoparticles especially in the biological field.
Another method of adding functionality to gold nanoparticles is by using a simple place
exchange strategy (Figure 1-9) described by Murray et al.34 Alkanethiolate protected
gold nanoparticles could be functionalised with another thiolate according to equation
1-5, where x and m are the numbers of new and original ligands, respectively.
x(R'SH) + (RS)mAu x(RSH) + (R'S)x(RS)m-xAu
1-5
Figure 1-9 Schematic illustration of place exchange reactions where one thiol is replaced by another
on a gold nanoparticle surface.
There are a number of interactions that are involved in place exchange reactions, which
include gold-thiol interactions; incoming thiol bound thiolate interactions, and
incoming thiol-surface monolayer interactions. A complete understanding of place
exchange reactions is still to be achieved, although it is generally thought to follow an
associative mechanism, where the incoming thiol attaches to the surface and the bound
thiol leaves the gold in a simultaneous process. A gold nanoparticle is rarely a perfect

Chapter 1 Introduction
24
sphere and is usually in-homogeneous. Place exchange reactions are thought to initiate
on the surface where the monolayer packing is less dense, such as edges and vertices of
gold nanoparticles and diffuse into the rest of the particle until an equilibrium is
reached.69
Hong et al.70 demonstrated that a primary thiol is more active than its corresponding
secondary and tertiary thiols for place exchange reactions. This implies that steric
hindrance near the thiol group significantly reduced its reactivity in place exchange
reactions. Conversely, it was found that bulky groups exhibited higher activity to place
exchange than linear thiols of the same molecular weight. This enhanced reactivity
was rationalised by considering that place exchange reactions are thought to start
predominantly at the vertices of the nanoparticle, where the monolayer is least dense.
These sites can therefore open–up enough to accommodate branched bulky ligands.
Once these bulkier ligands are attached they may pack better, and therefore aid the
exchange. The branched thiol occupies additional space on the particle surface and
therefore destabilises the surrounding thiols more efficiently.70
Place exchange reactions can be used to introduce polar terminal functional groups
such as carboxylic acid, ammonium ions, sulphonic acid etc. to the unbound end of a
ligand on the nanoparticle surface. One way to exploit this added functionality to the
unbound end of a ligand is to perform further chemistry and attach a light activated
antimicrobial agent (LAAA), for use in antibacterial photodynamic therapy.
1.10 Photodynamic Therapy
This thesis reports on the coupling light activated antimicrobial (LAA) agents with gold
nanoparticles to provide new materials that display enhanced antimicrobial properties.
Light activated antimicrobial (LAA) agents can be used in photodynamic therapy.
Photodynamic therapy (PDT) combines light and light sensitive agents (such as
porphyrins) in an oxygen-rich environment. These absorb photons of energy from light
and transfer this energy to surrounding oxygen molecules. Toxic oxygen species, such

Chapter 1 Introduction
25
as singlet oxygen and free radicals are formed. These species are very reactive and can
damage bacteria proteins, lipids, nucleic acids and other cellular components.71
The history of PDT goes back to the attempts of ancient Egyptians to treat skin diseases
with light-absorbing compounds.72 Ancient Egyptians applied vegetable substances to
produce photoreactions in tissues for the treatment of de-pigmented skin lesions
(vitiligo). These lesions used to be regarded as manifestations of leprosy. Egyptians
utilised natural photosensitisers such as psoralens, which were in many plants such as
parsnip, parsley, and Saint-John's-wort. Egyptians made a powder of these plants and
applied it to de-pigmented skin lesions and then exposed the skin to bright sunlight.
The sun activated the applied photosensitisers, resulting in the lesions becoming less
pigmented.73 The Hindus of India in ca. 1400 BC also treated the skin psoriasis using
dyes in combination with sunlight.72
PDT has been applied to skin cancer patients and the results obtained have opened up
new prospects for PDT.71 In Europe the potential of photosensitisers was first realised
by Raab in 1898.73 He was studying the effects of light and dyes such as acrydine on
paramecia, unicellular ciliate protozoa. He noted that an acrydine solution killed
paramecia when irradiated with light, and no such effect was observed in the absence of
light. Raab and Tappeiner hypothesised that fluorescing dyes convert the energy of
light into an active chemical energy which kill paramecia.72
At around the same time as Raab’s observations the French neurologist Prime, was
treating epileptic patients with the dye eosin.73 He reported on photosensitive reactions
occurring in sun-exposed areas in a patient who had been administered eosin for
epilepsy. On the basis of this new knowledge about photodynamic effects, H.
Tappeiner and H. Jesionek, performed the first PDT session on a patient with skin
carcinoma, where a topical application of eosin was used as a photosensitiser and white
light to treat the tumour. This was the first application of PDT to treat cancer. In 1904
Tappeiner and Jodlbauer demonstrated that oxygen was integral to photosensitisation
reactions.72-74 From these origins photodynamic therapy has been increasingly adopted
through-out the clinical world.

Chapter 1 Introduction
26
Currently photodynamic therapy has successfully been used to treat cancer of the
bladder using the photosensitiser Photofrin®.75 Other cancers approved to be treated
by PDT include bronchial,76 and skin cancers.77 Clinical trials are currently being
conducted on the treatment of prostate cancer.78 PDT in the past decade has been used
for the treatment of age-related macular degeneration (AMD). This is the leading cause
of blindness in the elderly in the Western world. Treatment involves the intravenous
injection of the photosensitiser Visudyne® and has been used in over two million cases
to date.79
Work on the lethal photosensitisation of bacteria began in the early 1960’s. Macmillan
et al.80 used toluidine blue as a photosensitiser to kill bacteria, algae and yeast. They
found 99% kills were obtained for most of the bacteria tested, after 30 min of exposure
to a gas laser (21-30 mW). A few years later Bellin et al.81 suggested that the
photosensitiser, toluidine blue acts on the cell membrane. Additionally, they studied
the effects of other thiazine dyes such a methylene blue. A range of dyes were
investigated, including rose bengal, erythrosine B, eosine Y, neutral red, acridine
orange, crystal violet, pyrorine Y, and rhodamine 6G. They concluded that cationic
dyes act as photosensitisers at an alkaline pH, and anionic dyes act as photosensitisers
at a pH slightly lower than their pKa. Furthermore, they demonstrated the presence of
oxygen was required for the successful kill of bacteria.
Antimicrobial PDT produces bactericidal and bacteriostatic effects on bacteria due to
the generation of singlet oxygen and peroxide radicals. These substances are generated
by extracellular and intracellular photosensitisers. Their action brings about a chain of
phototoxic reactions. Schneider et al.82 investigated antimicrobial PDT with
methylene-blue dye. Irradiation was performed using a wideband white light source,
which produced radiation at wavelengths of 400 to 700 nm. It was found that such
antimicrobial PDT inactivated bacteria RNA in vitro. The RNA was cross-linked to
plasmatic proteins. In some cases, oxidant stress inhibited the growth of bacterial
cultures in vitro.
Antimicrobial PDT usually requires the involvement of an external photosensitiser.
After absorbing light of certain energy, the photosensitiser may undergo electronic

Chapter 1 Introduction
27
transition from its ground state to an excited singlet state (electron spins paired).
Depending on the molecular structure of the photosensitiser and its environment the
molecule may lose energy by being quenched by other surrounding molecules, thus
returning to the ground state (Type I). The other pathway available is to undergo
intersystem crossing, to a triplet excited state, where the electron spins are unpaired
(Type II). At this point the photosensitiser can lose its energy: by quenching from
surrounding molecules and electronic decay back to the ground state, from undergoing
redox reactions with the surrounding environment, or the excitational energy maybe
transferred to molecular oxygen where singlet oxygen is generated (Figure 1-10).83
Figure 1-10 Simplified energy level diagram of a photosensitiser, displaying key energy transitions in
the formation of singlet oxygen and consequent Type I and Type II processes.
Type I reactions can cause photo-damage by hydrogen or electron abstraction by the
photosensitiser. Subsequent redox reactions and oxygenation products depend on the
proximity of the photosensitiser and the bacteria. In aqueous media type I reactions can
produce hydroxyl radicals which can also react with biomolecules on the surface of the
bacteria, or combine together to give hydrogen peroxide that subsequently has
cytotoxic effects. On the bacterial cytoplasmic membrane, abstraction of allylic
hydrogens from unsaturated molecules such as phospholipids also occurs.84 The
3O2
1O2
Internal Conversion
Absorbance
Fluorescence
Intersystem Crossing
Singlet Oxygen Generation
Phosphorescence Photosensitiser Oxygen
S0
*S1
Photosensitiser singlet state
Photosensitiser triplet state
Type I Electron/hydrogen abstraction, redox reactions
Type II Singlet oxygen mediated oxidations/peroxidations
*T1

Chapter 1 Introduction
28
radical species which is produced reacts with oxygen to yield lipid hydroperoxide,
which is detrimental to membrane integrity. This leads to the loss of fluidity and
increased ion permeability. Other targets of type I reactions include aminolipids and
peptides, hence inactivation of membrane enzymes and receptors is also possible.85
Type II reactions involve the formation of singlet oxygen. The short half-life of singlet
oxygen ensures that there is a localised response. This singlet oxygen formed reacts
rapidly with the environment; cell wall, nucleic acids, peptides etc. General belief is
that the singlet oxygen produced in a Type II process is the major pathway which is
responsible for the photo-oxidative microbial cell damage.86 Analogous to type I
reactions singlet oxygen also reacts with the cell wall and the cell wall components.84
In particular, type II reaction pathways are thought to interfere with the amino acids
histidine, tryptophan, and methionine, and to DNA bases (largely guanine). It has been
difficult to obtain direct spectroscopic evidence for the involvement of singlet oxygen
in photodynamic therapy.83 Experiments have shown the emission of singlet oxygen
from porphyrins adsorbed onto cell surfaces,87 but these experiments have proved
difficult to reproduce, because of the rapid reaction of singlet oxygen. Additionally
some protection from photodynamic therapy has been displayed in the presence of
singlet oxygen scavengers.86,88,89
Photosensitisers are usually aromatic molecules which are efficient in the formation of
long lived triplet excited states. Long lived triplet states increase the probability of
efficient singlet–oxygen production. Photosensitisers with an affinity for microbial
cells and a broad spectrum of action, as well as being able to damage to the host tissue
and prevent re-growth of the pathogens after the treatment, are also required.
Membrane photosensitisation can lead to a decrease in plasma membrane potential,
inhibition of molecular transport across the membrane and the inhibition and activation
of membrane associated enzymes. Cellular response to membrane photosensitisation
includes apoptosis.74
The sites of photosensitiser action and the effects of lethal photosensitisation are
dependant on the photosensitiser used and the target bacteria. For example, toluidine
blue when used against Escherichia coli (gram negative bacteria) is known to be

Chapter 1 Introduction
29
membrane active and increase permeability.84 Methylene blue, which belongs to the
same family of thiazine dyes, affects the same organism’s nucleic acid and causes
strand breaks.84 However, methylene blue affects Proteus mirabilis in a different way
and causes photodamage to the cell envelope and enhanced cell lysis, as well as DNA
photo-damage.84
The field of antimicrobial photodynamic therapy is rapidly expanding and benefiting
from new technology and research. More effective photosensitisers are being
developed, and unusual materials such as fullerenes are now being considered.90
Research is being conducted on the targeting of photosensitisers which exhibit higher
selectivity of microbial cells, reducing the collateral damage.91
Current applications of antimicrobial photodynamic therapy include the treatment of
periodontal diseases.92 Periodontal diseases are characterised by the severe
inflammation of the gums and are a result of chronic infections caused by a mixture of
Gram-positive and Gram-negative biofilm infections. These infections can eventually
lead to tooth loss. Current treatment involves the removal of the biofilm mechanically,
often in laborious and unpleasant procedures. Wilson et al.93 have made pioneering
advances in the treatment of periodontal disease using PDT. In vitro studies have
shown that several pathogens were successfully eradicated by photodynamic therapy,
both in aqueous suspensions and in biofilms. In vivo studies have displayed toluidine
blue photosensitiser mediated photodynamic therapy, selective killing of P. gingivalis
in the oral cavity with significant decrease in the level of bone loss in rats affected by
periodontitis.92 Early commercial application of their work is currently being tested out
in Canada. Treatment method entails the deposition of photosensitiser in the
appropriate place and irradiation by laser delivered by a fibre optic dentist tool. The
treatment is over in a few minutes and has considerable advantages over treatment with
antibiotics and antiseptics, which have problems associated with selectivity and
resistance.
Antibacterial photodynamic therapy has been used in the treatment of Acne Vulgaris.
The condition is caused by the proliferation of bacteria such as P. acnes and P.
granulosum. These bacteria are known to produce large amounts of porphyrins, and

Chapter 1 Introduction
30
can be inactivated when irradiated with high intensity light. It has been shown that
efficient inactivation can be achieved with blue light irradiation, and that blue light
therapy results in a significant decrease in the progression of acne lesions.94
Wounds can often be infected by bacteria, and such contamination normally leads to
extended healing times and prolonged hospitalisation. Usually the bacterial infection in
wounds is treated with antibiotics, and would therefore be subject to resistance and
selectivity. In such cases photodynamic therapy would be an ideal treatment with its
broad spectrum of action against bacterial infection by the appropriate choice of
photosensitiser. Hamblin et al. have performed clinical experiment and have shown
eradication of S. aureus in burn wound infections.95
Oral Candidiasis (oral thrush) is caused by a fungal infection, which is also susceptible
to photodynamic inactivation. Topical application of methylene blue on the tongues of
rats has shown the complete eradication of these microbes when irradiated by red light.
Applying photosensitiser directly on infected areas minimises collateral damage.96
This is particularly beneficial for patients with deficient immune responses such as HIV
sufferers as less burden is placed on the immune system.
The expansion of applications of antimicrobial photodynamic therapy is a relatively
recent development considering photodynamic therapy has been used to treat cancer
since 1900. There are two main factors which have contributed to this. The first of
these factors are that some prolific pathogens, especially specific kinds of gram
negative bacteria and protozoa are poorly responsive to traditional photosensitisers
such as acridine which have been used to treat carcinomas.74 However, new research
has developed photosensitisers which are specific in the killing of such microbes.91,97
The second factor has been the development of antibiotics. The discovery of effective
antibiotics gave the impression that microbe infection would be gradually reduced to a
level which would not harm human health. The widespread use and the rapid
emergence of microbes resistant to antibiotics have raised the interest in light activated
antimicrobial therapy. Antibiotic abuse, with excessive prescription, inclusion in feed
for live stock, frequent transmission of microbes by global travelling, poverty leading
to depressed immune systems and microbes having their own internal mechanisms for

Chapter 1 Introduction
31
development have all contributed to bacterial antibiotic resistance. Photodynamic
therapy is becoming an increasingly important tool to help combat these problems and
provide an alternative treatment method.74
There are many advantages that light activated antimicrobial therapy can provide. One
photosensitiser can have a broad spectrum of action and can act on multiple bacteria
strains.84 The efficacy of the photosensitiser is independent of antibiotic resistance
developed by any particular microbial strain and the probability of the onset of
mutagenicity, and resistance is low.98 Photosensitisers can be topically applied which
can lead to extensive reduction in pathogen population with limited damage to the host
tissue, and this has been improved upon by targeting with biological recognition
peptides which increases specificity.8,83,88
1.11 Thesis Structure
This thesis reports on coupling LAA agents with gold nanoparticles to provide new
nano bio-materials that displayed enhanced antimicrobial properties. The gold
nanoparticle forms the central core of the nano-biomaterial. Organic molecules can be
adsorbed onto the surface or they can be chemically attached. In this thesis both
approaches have been investigated. Charge stabilised gold nanoparticles have been
investigated with a wide variety of photosensitisers. The charge stabilised
nanoparticles were synthesised by a modified Turkevich synthesis and it was found that
association of some photosensitisers to gold nanoparticles enhanced the lethal
photosensitisation of bacteria. Additionally alkane thiol protected nanoparticles have
been synthesised, where light activated antimicrobial agents have been chemically
attached to the monolayer (Figure 1-11).
The monolayer protected nanoparticles that were synthesised in this project had some
strict regulations which needed to be adhered to. The central material needed to be
gold based on some evidence which suggested that gold enhanced the antibacterial
effect of photodynamic therapy agents.99 The monolayer performed two functions;
providing stability against aggregation in solvents and air and allowing solubility in

Chapter 1 Introduction
32
aqueous media by having polar groups in the alkane chain. All microbiology
experiments were carried out in aqueous media as potential final applications in
biological systems would also require aqueous solubility.
Figure 1-11 Schematic representation of ligand stabilised gold nanoparticles synthesised, with
attached photodynamic therapy agent
The next two chapters describe the synthesis and antibacterial properties of two novel
light activated antimicrobials with motifs gold-thiol-photosensitiser. The first of these
are gold nanoparticles with a tiopronin monolayer that has the photosensitiser toluidine
blue attached (gold-tiopronin-toluidine blue), and the second are gold nanoparticles
with a gluthathione monolayer that has the photosensitiser tin chlorin e6 attached (gold-
glutathione-tin chlorin e6).
Gold nanoparticle core
Photodynamic therapy agent
Protecting thiol monolayer
Aqueous media

Chapter 2 Toluidine blue–Tiopronin–Gold Nanoparticles
33
Chapter 2 Toluidine blue–Tiopronin–Gold Nanoparticles
This chapter describes the functionalisation of tiopronin monolayer coated
nanoparticles in aqueous media with toluidine blue.100
The tiopronin coated
nanoparticles were prepared in organic media, isolated and purified. The terminal
carboxylic acid group on the tiopronin was utilised as a handle to tether a toluidine
blue molecule via a condensation reaction forming an amide bond in aqueous media.
This is the first application of a covalently linked photodynamic therapy agent to a gold
nanoparticle, to function as a light activated antimicrobial (LAAA).84,93,101,102
Unexpectedly, the gold–tiopronin–toluidine blue conjugate displayed, significantly
enhanced antimicrobial activity, the minimum bacterial concentration (MBC) being at
least 4 fold lower than that of free TBO.
2.1 Introduction
Gold nanoparticles have well characterised physical properties, which have
subsequently been exploited, such as coatings on glass to produce a desired hue.103 An
unusual property of gold nanoparticles is that they can act as an anchor for light
activated antimicrobial agents (LAAA), which consequently increases its potency. This
increase in potency is a result of the close proximity between the gold nanoparticle and
LAAA molecule.
Organothiolate monolayer protected nanoparticles have attracted a lot of interest
recently because there is greater synthetic control over particle size, dispersity, and
surface functionality. Concequently, size dependant optical, catalytic and capacitance
properties are easily tuned. Additionally, the stability of the thioalkane protected
nanoparticles to air, allows long term storage and their solubility in solvents with
temperature and concentration extremes increases.
A typical thiol, HS(CH2)nX, where n denotes chain length and X denotes a functional
group allows the versatility needed for bio-application of organothiolate protected gold

Chapter 2 Toluidine blue–Tiopronin–Gold Nanoparticles
34
nanoparticles. Chain length and chemical identity of the terminal functional group can
be modified by changing n and X respectively. This can be achieved by appropriate
choice of thiol, ligand exchange and chemical modification by reaction with an
appropriate terminal group on the thiol.
There are many attributes of organothiolate protected nanoparticles. They are relatively
simple to prepare, handle and functionalise, just like stable organic and molecular
species.31 Additionally, depending on and the nature of HS(CH2)nX, the capped
nanoparticles can be isolated and re-suspended in a variety of polar and non polar
solvents. These properties of organothiolate protected gold nanoparticles make them
attractive moieties in biological chemistry. Applications include; biosensors for binding
reactions with cluster functionalised receptors,104 and biolistics105 where DNA is
attached to the organothiolate protected gold nanoparticles and accelerated through
plant cells leaving the DNA behind in the cell.
Nanoparticles for use in biological systems need to adhere to some requirements which
result from the physiological environment they would be used in. The surface layer of
these nanoparticles can be modified for increased aqueous stability, biocompatibility,
and biorecognition.106
The standard synthetic method for the production of organothiolate protected gold
nanoparticles involves extraction of tetrachloroaurate (III), [AuCl4]-, from aqueous
media to organic media followed by the addition of a thiol, HS(CH2)nX. This
mechanism is thought to follow a saturation – nucleation – growth process.31 The first
step produces gold (I) thiolate polymer or oligomer (-AuS(CH2)nX-)m through sacrificial
reduction of the thiol. This polymer is then reduced by the addition of aqueous NaBH4,
yielding gold nanoparticles coated in organothiolates.107 Factors which affect the size
of the gold nanoparticles obtained include the HS(CH2)nX: [AuCl4]- ratio, temperature
and rate of reductant addition.108 In general smaller particles are favoured by low
temperatures, increased rates of reductant addition and high thiol:gold ratios.31
Templeton et al.109 developed a single phase synthesis to produce tiopronin coated
nanoparticles which were soluble in water.
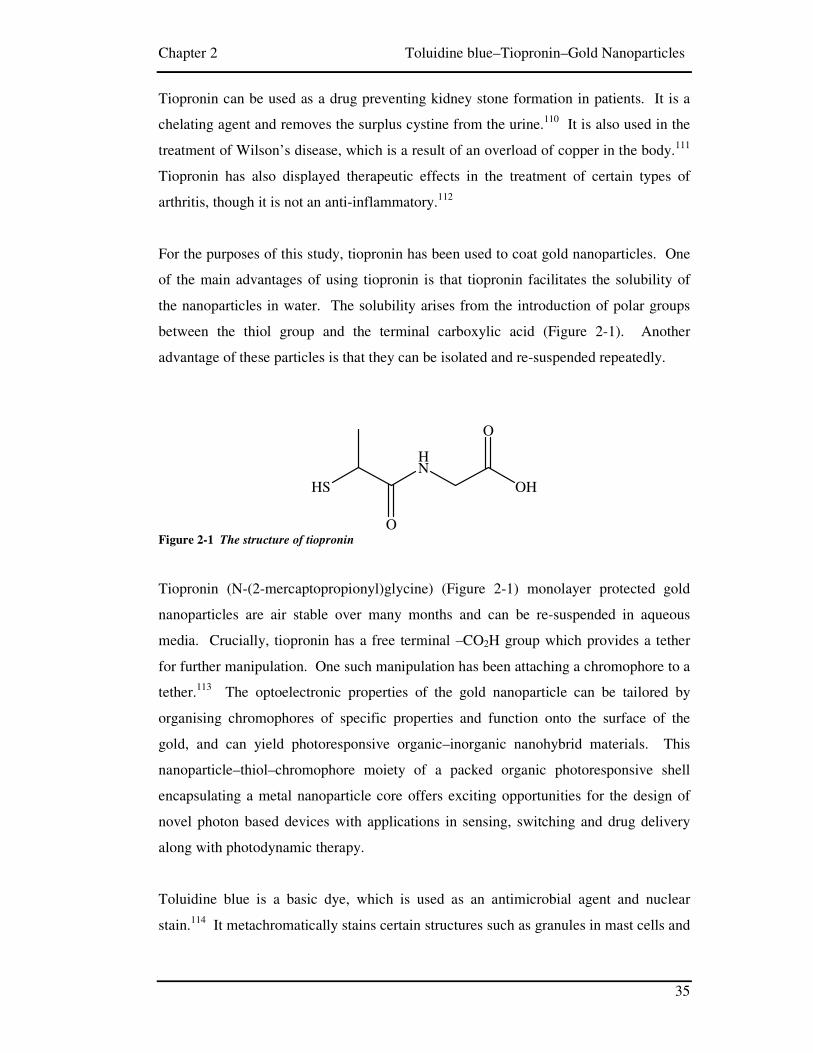
Chapter 2 Toluidine blue–Tiopronin–Gold Nanoparticles
35
Tiopronin can be used as a drug preventing kidney stone formation in patients. It is a
chelating agent and removes the surplus cystine from the urine.110 It is also used in the
treatment of Wilson’s disease, which is a result of an overload of copper in the body.111
Tiopronin has also displayed therapeutic effects in the treatment of certain types of
arthritis, though it is not an anti-inflammatory.112
For the purposes of this study, tiopronin has been used to coat gold nanoparticles. One
of the main advantages of using tiopronin is that tiopronin facilitates the solubility of
the nanoparticles in water. The solubility arises from the introduction of polar groups
between the thiol group and the terminal carboxylic acid (Figure 2-1). Another
advantage of these particles is that they can be isolated and re-suspended repeatedly.
Figure 2-1 The structure of tiopronin
Tiopronin (N-(2-mercaptopropionyl)glycine) (Figure 2-1) monolayer protected gold
nanoparticles are air stable over many months and can be re-suspended in aqueous
media. Crucially, tiopronin has a free terminal –CO2H group which provides a tether
for further manipulation. One such manipulation has been attaching a chromophore to a
tether.113 The optoelectronic properties of the gold nanoparticle can be tailored by
organising chromophores of specific properties and function onto the surface of the
gold, and can yield photoresponsive organic–inorganic nanohybrid materials. This
nanoparticle–thiol–chromophore moiety of a packed organic photoresponsive shell
encapsulating a metal nanoparticle core offers exciting opportunities for the design of
novel photon based devices with applications in sensing, switching and drug delivery
along with photodynamic therapy.
Toluidine blue is a basic dye, which is used as an antimicrobial agent and nuclear
stain.114 It metachromatically stains certain structures such as granules in mast cells and
HS
HN
OH
O
O

Chapter 2 Toluidine blue–Tiopronin–Gold Nanoparticles
36
RNA in electrophoresis. It also antagonises the anticoagulant action of heparin.114
Light activated antimicrobials such as toluidine blue (TBO) have the ability to kill a
wide range of bacteria including methicillin-resistant Staphylococcus aureus (MRSA).90
These light activated antimicrobial agents operate by producing free radicals and
reactive oxygen species when irradiated by white light or a laser of the appropriate
wavelength. Toluidine blue is membrane active as it increases permeability, resulting in
nucleic acid photo damage.115 Unlike antibiotics which usually have a single target to
operate, LAAA are indiscriminate in their mode of action, and have many targets. This
minimises the development of resistance to LAAA therapy. Additionally it has been
shown that increasing the proximity of the surface of gold nanoparticles to the
photodynamic therapy agent results in increased cell death.99
The rest of this chapter describes the synthesis of tiopronin-gold nanoparticles, and the
further functionalisation of these particles to form TBO-tiopronin-gold nanoparticles.
These particles were characterised and their efficacy tested as light activated
antimicrobials.
2.2 Experimental
Chemicals: HAuCl4·3H2O (99.99%), N-(2-mercaptopropionyl)glycine (tiopronin,
99%) and sodium borohydride (99%) were purchased from Aldrich. TBO (90%) was
purchased from Acros Organics. Buffers were prepared according to standard
laboratory procedure. All other chemicals were reagent grade and used as received.
Synthesis of tiopronin–gold nanoparticles: Tiopronin–gold nanoparticles were
prepared by modification of previously reported methodology.109 Tetrachloroauric acid
(0.62 g, 1.57 mmol) and of N-(2-mercaptopropionyl)glycine (tiopronin, 0.77 g, 4.72
mmol) were dissolved in of ethanol (60 mL) with acetic acid (10 mL). This resulted in
a ruby red solution. NaBH4 (1.21 g, 32 mmol) in distilled water (30 ml) was added
dropwise with rapid stirring. The temperature of the solution immediately increased
from (room temperature) to 44 °C and turned black. The solution returned to room
temperature after approximately 15 min. The pH of the solution increased from 1.2 to

Chapter 2 Toluidine blue–Tiopronin–Gold Nanoparticles
37
5.1. After cooling to room temperature the black suspension was stirred for an
additional 30 minutes, and the solvent then removed under vacuum at ≤ 40 °C.
The reaction crude was completely insoluble in methanol but relatively soluble in water.
It was purified by dialysis. The crude product was dissolved in 80 ml of water and the
pH was adjusted to 1 by addition of concentrated HCl. This solution was loaded into a
20 cm segment of cellulose ester dialysis membrane (Spectra/Por CE, molecular weight
cut-off (MWCO) = 12000), and placed in a 4 L beaker distilled water. This was stirred
slowly, recharging with fresh water every 12 h over the course of 72 h. The dark
tiopronin–gold nanoparticles solution was collected from the dialysis tube, and the
solvent was removed by freeze-drying. Elemental analysis of the dialysed
tiopronin-gold nanoparticles gave the following. Anal. found: C, 10.70; H, 1.65; N,
2.55; S, 5.73. Calcd. for C425H680O255N85S85Au201: C, 9.56; H, 1.28; N, 2.23; O, 7.65; S,
5.11; Au, 74.17%.
Preparation of TBO–tiopronin–gold nanoparticles: In a typical reaction, tiopronin–
gold nanoparticles (MW = 53376.38 g mol−1, 100 mg, 1.87 mmol) were dissolved in 30
mL of 50 mM 2-(N-morpholino)ethanesulfonic acid (MES) buffer (pH 6.5) and the
solution then made up to 0.1 M in 1-[3-(dimethylamino)propyl]-3-ethylcarbodiimide
hydrochloride (EDC) and 5.31 mM in N-hydroxysulfosuccinimide sodium salt. TBO
(61 mg, 0.2 mmol) was added, and the solution was stirred for 24 h. Then, the reaction
mixture was dialyzed as described above for 144 h. The dark purple TBO–tiopronin–
gold nanoparticle solution was collected from the dialysis tube, and the solvent was
removed by freeze-drying. Elemental Analysis found: C, 14.45; H, 1.91; Cl, 0.86; N,
3.35; S, 5.58. Calcd for C656H895.6Cl15.4O239.6N131.2S100.4Au201: C, 13.63; H, 1.56; Cl,
0.94; N, 3.18; O, 6.63; S, 5.57; Au, 68.49%. The number of molecules of TBO coupled
to each nanoparticle was 15.4. This value was verified by elemental analysis and TGA.
The gold nanoparticles were water-soluble. This is accounted for on the basis of the
high cationic character of the TBO group.
Thermogravimetric analysis (TGA): Thermogravimetric analysis (TGA) was
performed on the NETZSCH STA 449C TGA, equipment. Dry, purified sample (ca. 7
mg ) was placed in an alumina crucible under a nitrogen flow, with a flow rate of 50 ml

Chapter 2 Toluidine blue–Tiopronin–Gold Nanoparticles
38
min−1. The data was recorded from 25 to 1000 °C at a heating rate of 10 °C min−1. X-
Ray diffraction (experiments were measured with a Bruker discover diffractometer
using Cu Kα radiation), was used to analyse the residue left in the pan from the TGA
experiment.
UV-visible absorption spectra: Spectra were taken between 200–1100 nm, 1 nm
resolution of aqueous ca. 3.5 mg per 50 ml solutions in 1 cm quartz cells were recorded
with a ThermoSpectronic, Heλios-λ UV-visible absorption spectrometer.
Infra-Red spectra: Data were collected for solid tiopronin and TBO–tiopronin–gold
nanoparticle samples pressed into a KBr plate. These were recorded from 3800 to 500
cm−1 with a Shimadzu 8700 FT-IR spectrometer.
High resolution transmission electron microscopy (HRTEM): Samples were
prepared by evaporating the required specimen on a carbon coated copper grid. Bright
field TEM images were acquired using with an electron microscope operated at 100 kV
(Joel 100CX). Typical magnification of the images was 100 000. Analysis of the
images was performed using the software program Image J.116
Bactericidal assays: The bacterial assays were carried out at the Eastman Dental
Centre by Miss Sarah Tubby. An overnight culture of Staphylococcus aureus NCTC
6571 (1 mL, grown aerobically at 37 °C, with shaking, in Nutrient Broth) was
centrifuged and the pellet re-suspended in 1 mL phosphate buffered saline (PBS). The
optical density at 600 nm was adjusted to 0.05 in PBS, in order to give an inoculum of
approximately 107–108 colony-forming units (cfu) mL−1. The TBO–tiopronin–gold
nanoparticle conjugate was suspended in PBS at a concentration of 4.6 mg mL−1 (final
TBO content approximately 1 mM). The conjugate solution was then diluted in PBS to
give final concentrations of 2 µM, 1.0 µM, 0.5 µM and 0.25 µM respectively.
In a 96-well micro-titre plate, 50 µL aliquots of the conjugate were added to 50 µL of
the bacterial suspension and a 4 mm diameter magnetic stirrer bar was added to each
well. The plate was placed on a magnetic stirrer and triplicate wells were then exposed
to either white light or laser light (see below) for various periods of time during which

Chapter 2 Toluidine blue–Tiopronin–Gold Nanoparticles
39
the contents of the wells were stirred to ensure irradiation of all bacteria in each well.
Three control wells were not exposed to light to determine the effect on bacterial
viability of the conjugate alone. Six additional wells containing the bacterial suspension
plus PBS instead of conjugate solution were prepared, three of these were exposed to
light to determine the effect of light alone on bacterial viability, while the remaining
three were kept in the dark as an overall control and to determine the initial
concentration of bacteria in the suspensions. After irradiation or incubation in the dark,
samples were serially diluted 1 in 10 to a dilution factor of 10−4 and spread in duplicate
onto 5% horse blood agar plates. The plates were then incubated aerobically at 37 °C
for approximately 48 hours. After incubation, the number of bacteria surviving each
treatment was determined and the concentration of survivors expressed as cfu mL−1.
The white light source used in the study was a General Electric 28 W Biax 2D compact
fluorescent lamp that emits light across the visible spectrum. Prominent peaks were
present at 435, 495, 545, 588 and 610 nm. The light intensity at the surface of the
microtitre plates was measured using a digital luxmeter (Hagner Photometric
Instruments Ltd., Bosham, United Kingdom) and was found to be 3600 ± 20 lux . The
exposure time was varied in different experiments. The laser used was a 35 mW helium
neon (HeNe) gas laser (Model 05-LHP-928, Melles Griot, Carlsbad, CA, USA). This
delivers light with a wavelength of 632.8 nm in a collimated beam with a diameter of
2.5 mm. A convex lens was used to increase the beam diameter to 6.6 mm so that it
matched that of a well of the microtitre plate. A one minute exposure time delivered an
energy dose of 2.1 J at an energy density of 6.14 J cm−2.
Experiments were also carried out to determine the effect of a TBO-free gold–tiopronin
conjugate on the viability of S. aureus in the presence and absence of TBO. Using a
similar experimental protocol to that described above, various concentrations of the
gold–tiopronin conjugate were exposed to white light (35 minutes) or 633 nm laser light
(1, 2 or 5 minutes) in the absence or presence of TBO. The survivors were enumerated
by viable counting as described above. All of the experiments described above were
carried out on two separate occasions using different overnight cultures of S. aureus.

Chapter 2 Toluidine blue–Tiopronin–Gold Nanoparticles
40
2.3 Results
The tiopronin-gold nanoparticles were synthesised by a previously reported
reaction.109,117 Hydrogen tetrachloroaurate was dissolved in acidified methanol and
reduced by an aqueous solution of sodium borohydride, at room temperature (Figure
2-2).
S
S
SS
SS
SS
S
S
SS
RR
R
R
R
RR
R
R
R
R
R
HS
HN
OH
O
O
HN
OH
O
O
S
S
SS
SS
SS
S
S
SS
R'R'
R'
R'
R'
R'R'
R'
R'
R'
R'
R'
HN
O-activated
O
O
N
S NH2NCl
S
S
SS
SS
SS
S
S
SS
RR
R
R''
R
RR
R''
R
R
R
R''
HAuCl4.3H2O(1 equiv)
Tiopronin(3 equiv)
1. Methanol : Acetic acid, 6:1
2. NaBH4 / H2O
R =
Water soluble tiopronin-gold nanoparticles
Carbocylic acid activation MES, EDC, HCl, Sulfo-NHS / water
Toluidine blue- (TBO) amide forming coupling reaction
R'' =
R' =
HN
O
O
Gold-tiopronin-TBO nanoparticles
TBO
TBO
TBO
Figure 2-2 Synthesis of gold-tiopronin-toluidine blue nanoparticles in a two stage synthesis. The first
stage is the synthesis of gold-tiopronin nanoparticles from auric acid and tiopronin in acidified
methanol. The second stage is the attachment of toluidine blue to the gold-tiopronin nanoparticles.

Chapter 2 Toluidine blue–Tiopronin–Gold Nanoparticles
41
The tetrachloroaurate (III), [AuCl4]- ions were soluble in acidified methanol and
therefore did not require extraction from aqueous to organic media by a phase transfer
agent. The acidity is essential for the reaction to yield stable monodisperse
nanoparticles. This suggests that the emerging nanoparticles coated in tiopronin are
unstable when the tiopronin is de-protonated in methanol. The gold–tiopronin
nanoparticles formed are insoluble in methanol, but soluble in water. Once isolated and
purified they have the consistency of a finely divided black powder which can be re-
dissolved in water and stored indefinitely in air. The first step in the reaction also
yielded undesired, water soluble by-products (NaCl, disulfide, NaOAc, HOAC), which
were removed by dialysis, along with un-reacted starting reagents. Dialysis has proven
to be an excellent method of removing by-products and un-reacted reagents.
The next step in the reaction involves the coupling of a toluidine blue molecule to the
carboxylic acid end of the tiopronin, by forming an amide linkage via a condensation
reaction. This process was done in the presence of the sodium salt of N-hydroxy
sulfossuccinimide (sulfo-NHS) and 1-[3-(dimethyl amino)propyl]-3-ethyl-carbodiimide
hydrochloride (EDC). Sulfo-NHS was used to convert the carboxylic acid group on the
tiopronin to an amine reactive sulfo-NHS ester. This process is catalysed by EDC
which behaves as a dehydrating carbodiimide. EDC is not an effective dehydrating and
crosslinking molecule by itself, because failure to react quickly with the amine will
result in the hydrolysis and regeneration of the carboxylic acid (Figure 2-3).
EDC reacted with the carboxylic acid group of the tiopronin, forming an amine reactive
O-acylisourea intermediate. This intermediate may react with the amine on toluidine
blue yielding a conjugate of the two molecules joined by a stable amide bond.
However, this conjugate is also susceptible to hydrolysis making it unstable and short
lived in aqueous solutions. The addition of sulfo-NHS stabilises the amine reactive
intermediate by converting it to an amine reactive sulfo-NHS-ester. This increases the
efficiency of EDC mediated coupling reactions. The amine reactive sulfo-NHS ester
intermediate has sufficient stability to permit a two step crosslinking reaction.100,118

Chapter 2 Toluidine blue–Tiopronin–Gold Nanoparticles
42
Figure 2-3 Routes possible when coupling TBO to tiopronin–gold nanoparticles
The coupling reaction between tiopronin and toluidine blue required a ratio of 1.1 : 1
(mole ratio of amines on TBO to tiopronin–gold nanoparticle carboxylic acid groups)
and produced clusters that contained on average 11 TBO sites per gold nanoparticle.
Varying this procedure by modifying the TBO concentration so that the ratio between
TBO and tiopronin gold nanoparticles was 1.5 : 1, conjugates with an average of 15.4
TBO molecules per gold nanoparticle were synthesised. TBO–tiopronin–gold
nanoparticles with an average of 15.4 TBO per nanoparticle were insoluble in water, but
soluble in phosphate buffer (pH = 7.01), whereas the particles with 11 TBO sites per
OH
O
N
C
HN
NH
Cl
O
O
N
C
N
NH Cl
H2N
N
O
O
O
S OO
O
O
NHO
O
O
O
S OO
NH
O
NH
O
Gold - tiopronin nanoparticle
Toluidine blue
Stable amide bond
EDC
Sulfo - NHS
Unstable reactive O-acylisourea ester
OH
O
Regenerated carboxyl group on tiopronin
Semi - stable amine reactive NHS ester
Stable amide bond
H2N
H2O

Chapter 2 Toluidine blue–Tiopronin–Gold Nanoparticles
43
gold nanoparticle were water-soluble. This is accounted for on the basis of the high
cationic character of the TBO group.
The TBO–tiopronin–gold nanoparticle conjugate produces an intense black colour when
isolated as a solid. However a blue-violet colour was observed when crushed with KBr
for the IR experiments. The conjugated TBO–tiopronin–gold nanoparticles are air stable
as a solid. They can be easily re-suspended and showed the same characteristics and
functional properties after 9 months. In solution, the conjugated nanoparticles were
stable for at least six months in water or PBS solution.
In general the UV-visible absorption spectra of gold nanoparticles are dependant on the
particle size. Particles less than 2-3 nm in diameter do not exhibit surface plasmon
resonance absorption. The UV-visible absorption spectrum of the tiopronin–gold
nanoparticles was also dependent on the core size (Figure 2-4). The UV absorbance
profile of the nanoparticles decayed almost exponentially into the visible. There was no
detectable surface plasmon band in the visible region which indicates that the diameter
of the gold nanoparticles was less than ca. 3 nm across. There were no identifiable
features in the UV-visible absorbance profile of the tiopronin–gold nanoparticles.
Figure 2-4 UV-visible spectra (in phosphate buffer, pH 7.01) of: (Blue) tiopronin–gold nanoparticles,
1.9 µM; (Green) TBO–tiopronin–gold nanoparticles, 1.2 µM; (Pink) TBO, 20 µM

Chapter 2 Toluidine blue–Tiopronin–Gold Nanoparticles
44
The absorbance profile of free toluidine blue and tiopronin-gold bound toluidine blue
are very similar (Figure 2-4). Both exhibit a maximum absorbance at 633 nm. A band
at 245 nm is significantly weaker in the bound toluidine blue spectrum. This may be
due to that particular wavelength of lights absorption being reduced by being bound.
Additionally the molar extinction coefficient in phosphate buffer for TBO–tiopronin–
gold nanoparticles is significantly higher (ε = 5.2×10⁵ l mol−1 cm−1; λ = 633 nm) than of
the corresponding one for TBO (ε = 2.8×10⁴ l mol−1 cm−1; λ = 633 nm).
The thermal decomposition of tiopronin–gold nanoparticles occurred in two steps; a
well-defined step that began at approximately 90 °C and was completed by 450 °C, and
a second step from 600 °C to 1000 °C (Figure 2-5). The percentage weight losses for
the organic fragments were 23.49% for tiopronin–gold nanoparticles. These values
combined with the C, H, N, S and Cl microanalytical results for the clusters give
molecular formulae of C425H680O255N85S85Au201 for the tiopronin–gold nanoparticles.
These formulae indicate that each gold nanoparticle has coordinated on average 85
tiopronin molecules.
Figure 2-5 Thermal Gravimetric Analysis (TGA) of tiopronin–gold nanoparticles synthesised by
reaction of auric acid and tiopronin in acidified methanol.

Chapter 2 Toluidine blue–Tiopronin–Gold Nanoparticles
45
Thermal gravimetric analysis of the TBO–tiopronin–gold nanoparticles occurred in two
steps; a well-defined step that began at ~200 °C and was completed by 450 °C, and a
second step from 600 °C to 1000 °C (Figure 2-6). The percentage weight losses for the
organic fragments were 24.21% for the TBO–tiopronin–gold nanoparticles. These
values combined with the C, H, N, S and Cl microanalytical results for the clusters give
molecular formulae C656H895.6Cl15.4O239.6N131.2S100.4Au201 for the TBO–tiopronin–gold
nanoparticles (15.4 TBO per cluster unit). On reaction with TBO either 15.4 or 11 TBO
molecules (depending on the two concentrations of the TBO used) are covalently
bonded to the tiopronin and hence directly connected to the gold nanoparticle.
Figure 2-6 Thermal Gravimetric Analysis (TGA) of toluidine blue–tiopronin–gold nanoparticles,
synthesised by the coupling of toluidine blue to tiopronin-gold nanoparticles.
The residue from the TGA experiments was shown by X-ray powder diffraction to be
highly crystalline gold metal (Figure 2-7). In both TBO–tiopronin–gold and tiopronin–
gold nanoparticles, this residue was found to be elemental gold, which is consistent with
previous TGA work on alkanethiolate–gold nanoparticles.119

Chapter 2 Toluidine blue–Tiopronin–Gold Nanoparticles
46
Figure 2-7 XRD of the residue left in the pan after TGA confirms presence of elemental gold. The
pattern is indexed and shows the expected stick pattern (red) for gold metal.
High-resolution transmission electron microscopy of the TBO–tiopronin-gold
nanoparticles showed particles that are spherical in shape and of uniform size with
average core dimensions of 1.8–2.0 nm (Figure 2-8).
Figure 2-8 High Resolution Transmission Electron Microscopy (HRTEM) image of TBO–
tiopronin-gold nanoparticles
(1 1
1)
(2 0
0)
(2 2
0)
(3 1
1)
(2 2
2)

Chapter 2 Toluidine blue–Tiopronin–Gold Nanoparticles
47
The HRTEM image illustrates the highly crystalline nature of the gold core.
Additionally, the distance between the lattice fringes was measured to be 2.42 Å from
the HRTEM image. The interplanar distances measured on the HRTEM images are in
good agreement with that of bulk gold (111) plane, which is 2.355 Å. Furthermore,
each nanoparticle has a single gold domain. The gold particles are seen to be separated
on the TEM and this is further evidence of the presence of coordinating tiopronin and
TBO–tiopronin groups.
Figure 2-9 Transmission Infra-red spectra of: (Blue) tiopronin, (Red) tiopronin–gold nanoparticles,
(Green) TBO and (Purple) TBO–tiopronin–gold nanoparticles. All spectra were acquired in the form
of KBr plates, and intensities of the bands are uncorrected for sample quantity.
Chapter 2 Toluidine blue–Tiopronin–Gold Nanoparticles
48
Infra-red spectroscopy of the gold–tiopronin nanoparticle showed that the bands for the
tiopronin group are readily seen (Figure 2-9). The S–H vibration band of free tiopronin
is observed at 2565 cm-1. This band is absent in the infra red spectrum of gold–
tiopronin and gold–tiopronin–toluidine blue nanoparticles indicating that the sulphur
has been de-protonated and coordinated to the gold nanoparticle surface. The N–H
vibration has moved to a slightly lower frequency indicating a change in hydrogen
bonding.
The bands due to the aromatic rings at ~1600 cm−1 from the TBO monomer, is present
on the TBO–tiopronin–gold nanoparticles infra-red spectra. Additionally the N–H
stretching band of the TBO monomer attributed to the primary amine at ~3440 cm−1 is
absent from the TBO–tiopronin–gold nanoparticles IR spectrum. This is evidence for
the conversion of the primary amine to amide. Analysis of the IR spectra provides
some evidence for interparticle hydrogen bonding for both the gold–tiopronin and gold–
tiopronin–TBO nanoparticles.
The characterisation data confirm the successful formation of both gold–tiopronin and
covalently linked gold–tiopronin–TBO nanoparticles. Taking into account all the
characterisation data, a calculated number of TBO molecules per gold nanoparticle was
obtained. This has been crucial in the microbiology because a direct comparison of the
antimicrobial properties of the gold–tiopronin–TBO nanoparticles with free TBO could
be made.
The antimicrobial activity of the TBO–tiopronin–gold conjugate when exposed to white
light or to 632.8 nm light from a HeNe laser was assessed using S. aureus in aqueous
suspension. An extensive series of controls was used to determine the antimicrobial
activity of TBO, TBO-tiopronin-gold and tiopronin-gold nanoparticles.
To ensure that the bacterial suspension of S. aureus NCTC 6571 did not have any
endogenous photosensitisers activated by either 632.8 nm laser light or white light, 50
µl of the bacterial suspension was added to 50 µl of PBS, and irradiated with 632.8 nm
laser light for one minute or with white light for 30 minutes (Figure 2-10 & Figure

Chapter 2 Toluidine blue–Tiopronin–Gold Nanoparticles
49
2-11). In neither case was the viability of the S. aureus suspension affected and it was
ascertained that the organism could not be killed at these light energy doses in the
absence of an exogenous photosensitiser. In order to have successfully synthesised a
light activated antimicrobial, controls on the tiopronin–gold and TBO–tiopronin–gold
nanoparticles in the dark were also performed.
In the absence of white light, the TBO–tiopronin–gold nanoparticles exhibited no
antibacterial activity at any of the concentrations tested. However, the viable count of S.
aureus on irradiation with white light for 30 min reduced depending on the
concentration. The highest kill of approximately 5.5 log10 was observed at a
concentration of 2.0 µM. Substantial kills were also observed at concentrations as low
as 0.5 µM. The TBO–tiopronin–gold nanoparticles killed more effectively at a
concentration of 1.0 µM than free TBO, which only had significant kills at double the
concentration of 2.0 µM (Figure 2-10).
Figure 2-10 Effect of TBO (Blue) and the TBO–tiopronin–gold nanoparticle conjugate (Pink) on
viability of S. aureus 6571 following exposure to white light for 30 minutes, or incubation in the dark
with TBO (Green) or the TBO–tiopronin–gold nanoparticle conjugate (Red). The white bar denotes the
viable count of the original bacterial suspension, and the purple bar represents the viable count of the
bacterial suspension after exposure to white light.

Chapter 2 Toluidine blue–Tiopronin–Gold Nanoparticles
50
Additionally it was observed that the kills achieved by the TBO–tiopronin–gold
nanoparticles were light dose dependent. As exposure time was increased from 15 to 45
minutes, lethal photosensitisation of the bacteria was more effective (Figure 2-11).
To ensure that the action of light on the toluidine blue was the mechanism of killing the
bacteria, experiments were carried out using either (TBO free) tiopronin–gold
nanoparticles (Figure 2-12) or a mixture of tiopronin–gold nanoparticles with un-
conjugated TBO (Figure 2-13). Positively, no significant reduction of S. aureus at any
of the concentrations tested (0.4–40.5 µM), were observed on exposure to white light
for the tiopronin–gold nanoparticles. Additionally mixtures of various ratios of the
tiopronin–gold nanoparticles and a sub-optimal concentration of TBO did not result in
killing of the S. aureus on irradiation with white light.
Figure 2-11 Effect of white light dose on the killing of S. aureus by the gold–tiopronin–TBO
conjugate (concentration = 4 µM). The exposure time was varied from 15 to 45 minutes.

Chapter 2 Toluidine blue–Tiopronin–Gold Nanoparticles
51
Figure 2-12 Effect of various concentrations of the gold–tiopronin conjugate on the viability of S.
aureus following exposure to white light for 35 minutes. The white bar represents the viable count of
the original bacterial suspension.
Figure 2-13 Effect of mixtures of ratios of the gold–tiopronin conjugate and TBO (TBO concentration
= 1 µM) (Blue) and TBO alone (Purple) on the viability of S. aureus following irradiation with white
light for 35 minutes. The white bar represents the viable count of the original bacterial suspension

Chapter 2 Toluidine blue–Tiopronin–Gold Nanoparticles
52
These results provide strong evidence that TBO–tiopronin–gold nanoparticles enhance
antimicrobial response using both a laser and a white light source. The most striking
result in the kills was observed at 1 µM concentration whilst using white light for 30
minutes. The conjugate showed a reduction in cfu of 4.5 log10 that is a 99.995% kill
compared with a 0.5 log10 or 50% kill for TBO of the same concentration. Regardless of
the light source used, the kills achieved by the TBO–tiopronin–gold conjugate were two
log10 units greater than those found using TBO when each LAAA was used at a
concentration of 2.0 µM, the lowest concentration at which TBO displayed any activity.
2.4 Discussion
Gold–tiopronin nanoparticles were synthesised in methanol purified and isolated as a
solid. This solid was then further utilised in the second step of the reaction. Gold–
tiopronin–TBO nanoparticles were successfully achieved in aqueous solution, purified
and isolated as a blue black solid, by attachment of the TBO molecules to gold–
tiopronin nanoparticles. The number of TBO molecules groups attached to the gold–
tiopronin nanoparticles, could be controlled by the concentration of TBO used. Some
control was achieved in the number of TBO groups attached to the gold–tiopronin
nanoparticles. In this study 11 and 15.4 toluidine blue molecules per gold nanoparticle
were synthesised by using tiopronin-gold : TBO ratios of 1 : 1.1 and 1 : 1.5. The
molecular formula of the nanoparticles was obtained from the characterisation data.
The TGA and elemental analysis data were in excellent agreement with each other.
However these molecular formulae should be used as a weighted average as the TEM
size analysis indicated that the gold cores of the nanoparticles were not monodispersed.
Although, ca. 90% of the gold cores had diameters in the region of 1.8–2 nm,
(determined by TEM image analysis) which results in the molecular formula being
fairly accurate.
The plasmon resonance band in the UV-visible spectrum, which is usually an excellent
indicator for the presence of gold nanoparticles, was not observed for the gold–tiopronin
nanoparticles–TBO and gold–tiopronin nanoparticles. This is because there were no

Chapter 2 Toluidine blue–Tiopronin–Gold Nanoparticles
53
gold cores larger than 4 nm, providing additional evidence that synthetic control over
particle size was achieved.
Nanoparticles often agglomerate and precipitate when in solution over periods of time.
This is thought to be due to the fact that Au(I) atoms with a d10 closed shell electronic
configuration tend to form aggregates through aurophillic interactions. This relatively
strong non covalent Au(I)–Au(I) interactions is attributed to hybridisation between
empty 6s/6p shells and filled 5d10 shells which are stabilised and destabilised,
respectively, due to the relativistic effect. Conversely the gold–tiopronin–TBO
nanoparticles were stable indefinitely, when suspended in water and phosphate buffer
solution, and when kept as a solid in air. The TBO–tiopronin–gold nanoparticles are
unusual in having both ligand stabilisation of the gold core, via the tiopronin groups,
together with charge stabilisation, as the TBO is a cationic dye with one chloride
counter ion per molecule. Therefore the TBO–tiopronin–gold nanoparticles are both
ligand stabilised and charge stabilised.
This study has shown that covalently linked TBO–tiopronin–gold nanoparticles are very
effective LAAAs. They are more active than free TBO, when compared on molar basis.
Furthermore, the attachment of TBO molecules to tiopronin–gold nanoparticles is
essential for it to function as an antimicrobial. There was no observed enhanced killing
for the tiopronin–gold nanoparticles presence of free TBO. This is the first reported
instance of covalently linking a photodynamic therapy agent to a gold nanoparticle
enhancing the effectiveness of the LAAA.
There is a four fold reduction in inhibitory MBC of the TBO–tiopronin–gold
nanoparticles compared to free TBO. Part of the mechanism of this enhanced kill can
be explained by the increased extinction coefficient of the TBO–tiopronin–gold
nanoparticles (ε = 520371 l mol−1 cm−1) compared to free TBO (ε = 28225 l mol−1
cm−1). Enhanced extinction coefficients for dyes absorbed on nanoparticulate surfaces
have been reported previously. Malicka et al.120 showed that indocyanine green had a
20-fold increase in extinction coefficient when directly bound to nanoscale metallic
islands of silver. This was explained in terms of the excited fluorophore interacting with
the freely mobile electrons on the metal resulting in increased rates of radiative decay.

Chapter 2 Toluidine blue–Tiopronin–Gold Nanoparticles
54
Additionally this conjugation procedure results in a directional binding of the dye to the
gold nanoparticle, providing a fixed distance for energy transfer.
A comparison of the antimicrobial effectiveness of the TBO–tiopronin–gold conjugate
with other photosensitisers is difficult, because of the different types of bacteria and
protocols adopted. However the MBC of LAAAs is typically in the range of 1–50 µM.
The most effective LAAA against S. aureus in terms of the MBC published was
5,10,15,20-tetra(N-benzyl-4-pyridyl)porphyrin tetrachloride (TNBPPT) which was
effective at 0.63 µM after 1 h of irradiation with a 500 W halogen–tungsten lamp.121
Notably, no kill was observed after 30 minutes of irradiation. This is unlike these
experiments with the TBO–tiopronin–gold nanoparticles MBC was 0.5 µM using 30
minutes of irradiation with a much less powerful lamp (28 W). The energy density
necessary to achieve significant kills in the above experiments (6 J cm−2 with the HeNe
laser) was considerably lower than that required with TNBPPT (133 J cm−2). Therefore
the TBO–tiopronin–gold nanoparticle has the lowest MBC necessary to kill S. aureus of
any LAAA and, taking into account light intensity, it is significantly more effective than
TNBPPT.
Close vicinity of chromophores to the gold core alters the excited deactivation pathways
of the surface bound molecules. For example, Dulkeith et al.122 observed a distance
dependant quenching of the excited states of chromophores on the metal surface. Other
studies have shown significant suppression in the quenching of the singlet excited of
chromophores when they are densely packed onto a gold surface.123 There are four
possible deactivation pathways of the excited chromophore bound to the gold
nanoparticle:
1. Intermolecular interactions
2. Energy transfer
3. Electron transfer
4. Emission from the chromophore
It is possible, by binding a TBO molecule, in manner which results in its close
proximity to the gold core surface, there in an enhanced energy transfer. This would
give an increased yield in singlet oxygen when light of the appropriate wavelength is

Chapter 2 Toluidine blue–Tiopronin–Gold Nanoparticles
55
applied. The enhanced kill of bacteria which was observed could therefore be
explained.
It is thought that the sulphur atom in the aromatic system of the toluidine blue molecule
on the TBO–tiopronin–gold nanoparticle could chelate back, and attach itself onto the
gold nanoparticle surface. Although this is possible as the sulphur atom would be
expected to be exceptionally aurophilic, it was not possible to prove.
It is important that for clinical use, a light-activated, or indeed any, antimicrobial agent
is effective at low concentrations. TBO is a potent photodynamic therapy agent, which
is effective at killing a wide range of microbes at low light energy doses both in vitro
and in vivo. The TBO–tiopronin–gold nanoparticles increase this antimicrobial efficacy
by association to the gold surface. This was the first time that a moiety of
gold-thiol-photosensitiser had been applied to the lethal photosensitisation of bacteria.
An LAAA of such potency could be useful as a rapidly acting photosensitiser, in the
photodynamic therapy of a wide range of topical infections such as wound and burn
infections, caries and periodontitis.
2.5 Conclusion
A novel highly effective and potent light activated antimicrobial was synthesised. The
conjugation of toluidine blue to tiopronin–gold nanoparticles moiety has proved to be
exceptionally effective at killing Staphylococcus aureus. TBO–tiopronin–gold
nanoparticles killed bacteria using both a 632.8 nm laser light and white light. It was
found that these novel LAAAs killed significantly better than free TBO. For example at
1 µM concentration and using white light for 30 minutes, the conjugate showed a
reduction in cfu of 4.5 log10 compared with 0.5 log10 for TBO at the same concentration.
Regardless of whether white light or laser light was used, the MBC of the conjugate was
0.5 µM compared to 2 µM for TBO. The superior performance of the conjugate was
attributed to the enhanced extinction coefficient of TBO–tiopronin–gold nanoparticles, a
result of the association to the gold core surface, when compared to free TBO. In terms

Chapter 2 Toluidine blue–Tiopronin–Gold Nanoparticles
56
of their MBCs, the covalently linked TBO–tiopronin–gold nanoparticle conjugates are
the most potent light-activated antimicrobial agents reported to date.

Chapter 3 Tin Chlorin e6–Glutathione–Gold Nanoparticles
57
Chapter 3 Tin Chlorin e6-Glutathione-Gold Nanoparticles
This chapter describes the synthesis and antimicrobial activity of tin chlorin e6–
glutathione-gold (Au-GS-Snce6) nanoparticles. The gold glutathione protected gold
(Au-GS) nanoparticles were synthesised in a one step reaction in acidified methanol.
These nanoparticles were further functionalised by the attachment of a light activated
antimicrobial reagent (tin chlorin e6). These Au-GS-SnCe6 nanoparticles were tested
for anti-microbial activity by lethal photosensitisation of bacteria experiments, at the
Eastman Dental Institute. The introduction describes key components of this novel
moiety and its overall application in combating microbial infections.
3.1 Introduction
Glutathione (GSH) is a bulky tripeptide composed of cystine, glutamic acid, and glycine
(Figure 3-1). The active thiol group which binds to gold nanoparticles is located on the
cystine residue. Glutathione is a ubiquitous molecule that is synthesised in all organs of
the human body, particularly the liver. The intracellular concentration of glutathione
can be between 1 – 10 mM.124 Free glutathione is present mainly in its reduced form,
which can be oxidised and reduced by the action of the enzyme glutathione reductase.125
Glutathione is important in the function of the central nervous system and protects cell
membranes from oxidative damage.125 It has been shown that glutathione can serve as a
trigger for drug release from gold nanoparticle carriers.126
Glutathione is an attractive ligand for making water soluble gold nanoparticles. It has
favourable properties such as the presence of thiol, carboxylic acid, and amino groups,
which provide water solubility at relevant biological pH, biological compatibility, and
ease of functionalisation. In 1998 Whetten et al.127,128 first synthesised glutathione
protected gold clusters by a sodium borohydride reduction of a mixture of
tetrachloroauric acid and glutathione in methanol–water at a ratio of 2:3. They obtained
gold clusters with the dominant core size of 0.9 nm. Tsukuda et al.129,130 made
significant progress using similar synthetic procedures to Whetten et al., by introducing

Chapter 3 Tin Chlorin e6–Glutathione–Gold Nanoparticles
58
extensive electrophoretic separation techniques and high resolution mass spectrometry
in the purification and characterisation of glutathione protected gold clusters. The study
by Tsukuda et al. revealed that by varying the reaction temperature, the size of the
clusters could be varied. Au10, Au15 and Au18 were obtained as the major product by
increasing the temperature respectively. In both studies, the size of the clusters formed
was between 0.8 and 1.1 nm. Although the preparation of the glutathione protected
gold nanoparticles were well-established and their composition was extensively
characterized, the issues of further functionalisation of the nanoparticles to suit
particular applications, such as biomolecular labelling, were not addressed in these
studies. These issues are very important for the utility of the nanoparticles in
applications that require functionality and size control. Aziwa et al.131 have shown that
glutathione forms a compact monolayer on polycrystalline gold surfaces retaining its
non-sulph-hydryl biological activity.
Figure 3-1 Structure of Glutathione
In 1995 Brust et al.33 reduced tetrachloroauric acid using sodium borohydride in the
presence of organothiols in a single phase reaction to obtain thiol protected gold
nanoparticles 5 nm in diameter. It is thought that the first step in the reaction, where the
pale yellow colour disappears and goes clear is the result of the formation of polymeric
structures with –Au–S(R)– repeating bonds units.132,133 The thiolate polymer is formed
through sacrificial reduction of the thiol. Gold(I) has a d10 closed shell electronic
configuration which tends to form aggregates thorough aurophillic interactions. The
relatively strong non covalent Au(I)–Au(I) interaction is attributed to the hybridisation
SH
HN
NH2
HO
O
O
NH
HO
O
O

Chapter 3 Tin Chlorin e6–Glutathione–Gold Nanoparticles
59
between empty 6s/6p shells and filled 5d10 shells which are stabilised and destabilised
respectively.129 The second step in the reaction is where the polymer is then reduced by
the addition of aqueous NaBH4, yielding gold nanoparticles coated in a thiol such as
glutathione. The net result is a quantitative conversion of the –Au–S(R)– polymer into
intensely coloured, highly water soluble Au:S(R) cluster compounds whose stability is
indicated by their resistance to excess strong reducing agents.127 Since the preparation
methods are based on nucleation of gold cores in the presence of thiols, the sizes of the
resulting cores are inevitably distributed, due to the statistical fluctuations in the
nucleation process.
The presence of carboxylic acid and amino groups on glutathione, when complexed
with Au(I) have the potential advantage of creating pH-sensitive compounds. This
compound can adopt different conformational states and sizes depending on the pH of
the solution.107 Hainfeld et al.107controlled the final diameter of the gold core by
varying the size of the nanoparticle precursor [Au(I)SG] through pH manipulation. The
size of the final nanoparticles was varied from 2 to 6 nm. Furthermore, the
functionalisation of glutathione gold nanoparticles was demonstrated by the
introduction of a nitrilotriacetic acid (NTA) moiety.
The glutathione is tethered to the surface of a gold nanoparticle through the sulphur
atom. There are a number of functional groups on the rest of the glutathione molecule
where further chemistry of the gold nanoparticle is possible. One possibility is the
attachment of a light activated antimicrobial such as the metalloporphyrin tin chlorin e6.
The structure of tin chlorine e6 is based on 16 atom rings containing four nitrogen
atoms (porphyrins).
Porphyrins (Figure 3-2) are of perfect size to bind many metal ions. Metalloporphyrins
are found in heme proteins which are ubiquitous in nature. They serve many roles
including oxygen storage and transport. Related macrocycles include chlorophylls,
which have a central magnesium ion. By varying the metal centre, the bonding and
characteristics of the metalloporphyrin may be dramatically affected. This diversity is
one of the reasons why metalloporphyrins have been widely used in the production of
dyes, semiconductors and catalysts.134

Chapter 3 Tin Chlorin e6–Glutathione–Gold Nanoparticles
60
Figure 3-2 Porphine, the simplest porphyrin
Tin(IV) chlorin e6 (SnCe6) is a metalloporphyrin photosensitiser, that is known to be
lethal to bacteria when exposed to a HeNe laser, which emits red light at a wavelength
of 632.8 nm.91 Tin (IV) chlorin e6 (SnCe6) absorbs light at 632 nm and has an improved
yield of singlet oxygen over related chlorins.135 In addition, tin chlorin e6 possesses
reactive carboxyl groups on side chains outside the polycyclic core enabling conjugation
to targeting molecules,97 and nanoparticles (Figure 3-3).
Figure 3-3 Structure of tin chlorin e6
HN
NNH
N
NN
N N
Sn
HO
O
HO
O
HO
O
Chapter 3 Tin Chlorin e6–Glutathione–Gold Nanoparticles
61
Tin chlorin e6 has been used in photodynamic therapy (PDT) as a light-activated
antimicrobial agent to achieve lethal photosensitisation of infecting microbes.91 This
involves treating the microbe with a light-activated chemical, a photosensitiser such as
tin chlorin e6. Generally a photosensitiser has no, or negligible, bactericidal activity
alone. However, upon exposure to light of a wavelength absorbed by the
photosensitiser, the photosensitiser undergoes a transition from a lower-energy ‘ground
state’ to a higher-energy ‘triplet state’. The triplet state photosensitiser can react with
solvent and substrate molecules to produce free radicals and radical ions, or with
molecular oxygen resulting in the generation of singlet oxygen. These toxic species in
particular singlet oxygen, can damage plasma membranes leading to cell death.
There are major advantages to using photodynamic action in the treatment of microbial
infections, especially methicillin resistant Staphylococcus aureus (MRSA) bacteria,
over conventional antiseptics and antimicrobials. Neither the light nor sensitiser is
inherently bactericidal, so the antibacterial effect is limited to light irradiated regions of
the sensitiser treated area. This avoids the disruption of the normal microflora at sites
away from those being targeted. Also, the development of resistance to
photochemically induced killing would be unlikely, because the radicals formed attack
bacteria by a number of pathways.
While excellent clinical results are obtained using current photosensitisers,92,102,115
improvements could be made which enhance the efficiency of lethal photosensitisation
of bacteria. These improvements include developing photosensitisers which absorb
wavelengths of light in the far infrared region of the electromagnetic spectrum. These
wavelengths of light are able to access infections deeper in the body as they are
preferentially transmitted by human tissues.136 Another approach is to enhance the
efficiency of singlet oxygen production, reducing the concentration of photosensitiser
required to treat the infection. This was achieved by Wieder et al.99 who attached
phthalocyanine photosensitisers to the surfaces of gold nanoparticles. They found that
the surface bound photosensitiser exhibits a remarkable enhancement of the singlet
oxygen quantum yield. This was attributed to the presence of the phase transfer reagent
tetraoctylammonium bromide (TOAB) used in the synthesis of gold nanoparticles. It is
thought that the TOAB increases the triplet energy transfer to molecular oxygen.

Chapter 3 Tin Chlorin e6–Glutathione–Gold Nanoparticles
62
In this study gold nanoparticles protected by glutathione were synthesised, isolated and
purified. These nanoparticles were further functionalised by conjugation of the
photosensitiser tin chlorin e6 to the amino terminal of glutathione via a condensation
reaction. The light activated antimicrobial moiety synthesised was a three component
system, consisting of a gold core, protecting coating and photosensitiser. Attempts were
made to modify the diameter of the gold core, by varying the gold : thiol ratio.
3.2 Experimental
Chemicals: HAuCl4·3H2O (99.99%), glutathione (99%) and sodium borohydride
(99%) were purchased from Aldrich. Tin chlorin e6 (SnCle6) was purchased from
Frontier Scientific. Buffers were prepared according to standard laboratory procedure.
All other chemicals were reagent grade and used as received.
The synthesis of SnCle6-glutathione-gold nanoparticles were carried out in two steps:
(1) Synthesis of glutathione-gold nanoparticles; and (2) Preparation of SnCle6-
glutathione-gold nanoparticles.
Synthesis of glutathione-gold nanoparticles: Glutathione-gold nanoparticles were
prepared by adaption of previously reported methodologies.117,118,127 In a typical
reaction methanol (120 mL ) acetic acid (20 mL) were mixed in an Erlenmeyer flask
with stirring for 2-5 min. Tetrachloroauric acid (0.788 g, 2 mmol) and glutathione
(GSH, 0.307 g, 1 mmol) were added to the above mixed solvents and dissolved by
stirring for 5 min, resulting in a clear yellow solution. A sodium borohydride solution
was prepared by dissolving NaBH4 (1.211 g, 32 mmol) in water (60 mL). The NaBH4
solution was added dropwise into the tetrachloroauric acid and glutathione solution with
rapid stirring. The particle solution was transferred into filter tubes (50K MW cut-off,
Millipore) and purified by centrifuging at 3500 rpm and washed with water 4 times, and
then freeze dried. The particles were obtained as a dark blue / black powder. The
glutathione monolayer protected gold nanoparticles were soluble in water, and when
diluted the solution became clear purple. The ratios and masses used were:

Chapter 3 Tin Chlorin e6–Glutathione–Gold Nanoparticles
63
Au Glutathione NNG.1 Mass (g) 0.394 0.2117 Ratio 1 0.344 NNG.4 Mass (g) 0.394 0.1829 Ratio 1 0.3 NNG.7 Mass (g) 0.394 0.1535 Ratio 1 0.25
Table 3-1 Ratios and masses used in the synthesis of gold–glutathione nanoparticles.
Preparation of SnCle6-glutathione-gold nanoparticles: SnCle6-glutathione-gold
nanoparticles were prepared by modification of previously reported methodologies for
making glutathione-gold nanoparticles.100,118 In a typical reaction, tin chlorin e6
(SnCle6, 29 mg, 34.1 µmol) was dissolved in 20 mL of 50 mM 2-(N-
morpholino)ethanesulfonic acid (MES) buffer (pH 6.5) and the solution then made up to
5.1 mM in 1-[3-(dimethylamino)-propyl]-3-ethylcarbodiimide hydrochloride (EDC) and
5.1 mM in N-hydroxysulfosuccinimide sodium salt. After stirring for 40 min,
glutathione-gold nanoparticles (110 mg) were added, and the solution was stirred for 24
h. Then, the reaction crude was purified by dialysis, in which the pH of the crude
product was adjusted to 1 by dropwise addition of concentrated HCl. This solution was
loaded into a 20 cm segment of cellulose ester dialysis membrane (Spectra/Por CE,
MWCO = 12000), placed in a 4 L beaker of water, and stirred slowly, recharging with
fresh water ca. every 12 h over the course of 168 h. The dark SnCle6-glutathione-gold
nanoparticle solution was collected from the dialysis tube, and the solvent was removed
by freeze-drying. An NMR spectrum that could be resolved was not obtained.
Thermogravimetric Analysis (TGA): Thermogravimetric analysis (TGA) was
performed with a NETZSCH STA 449C TGA system, on 8.84 mg of dry, purified
glutathione-gold nanoparticles, under He (flow rate of 50 mL min-1), recording data
from 25 to 1000ºC at a heating rate of 10 ºC min-1.
X-Ray diffraction: These experiments were measured with a Bruker discover
diffractometer using Cu Kα radiation. These were used to analyse the residue left in the

Chapter 3 Tin Chlorin e6–Glutathione–Gold Nanoparticles
64
pan after the TGA experiment. In both, TBO-tiopronin- and tiopronin-gold
nanoparticles, this residue resulted to be elemental gold, which is consistent with
previous TGA work on alkanethiolate-gold nanoparticles.6,7
High resolution transmission electron microscopy (HRTEM): Samples were
prepared by evaporating the required specimen on a carbon coated copper. Bright field
TEM images were acquired using with an electron microscope operated at 100 kV (Joel
100CX). Typical magnification of the images was 100 000. Analysis of the images
was performed using the software program Image J.116
Infra-Red Spectroscopy: Spectra were recorded on a Perkin Elmer Spectrum RX1
spectrometer. Samples were made in the form of dispersed pellets. Spectra were
collected at a resolution of 1 cm-1.
UV-visible absorption spectroscopy: Spectra were recorded using a Perkin Elmer
Lambda 25 Spectrometer. Samples were dissolved in phosphate buffer solution or
deionised water and placed in plastic cuvettes. Data were collected between the range
of 300 and 1000 nm.
3.3 Results
The gold–glutathione (Au-GS) nanoparticles were synthesised by a previously reported
reaction.117,129 Tetrachloroauric acid was dissolved in acidified methanol, under rapid
stirring. This was reduced by a freshly prepared sodium borohydride solution under
rapid stirring, at room temperature. The tetrachloroaurate (III), [AuCl4]- ions were
soluble in acidified methanol and therefore did not require extraction from aqueous to
organic media by a phase transfer agent, which is the conventional Brust31 method for
preparing thiol protected gold nanoparticles. The acidity is essential for the reaction to
yield stable monodisperse nanoparticles. This suggests that the emerging nanoparticles
coated in glutathione are unstable when the glutathione is de-protonated in methanol.
The gold–glutathione nanoparticles formed are insoluble in methanol, but soluble in
water (Figure 3-4). Once isolated and purified they have the consistency of a finely

Chapter 3 Tin Chlorin e6–Glutathione–Gold Nanoparticles
65
divided black / blue powder which can be dissolved in water and stored in air. The first
step in the reaction also yielded undesired, water soluble by-products (NaCl, disulfide,
NaOAc, HOAC), which were removed by dialysis, along with any un-reacted starting
reagents.
Figure 3-4 Detailed scheme of the synthesis of gold–glutathione (Au-GS) nanoparticles and the
functionalisation of these particles to obtain gold–glutathione–tin chlorin e6 (Au-GS-Snce6).
HS
HN
NH2
OH
OO
HN
OH
O
O
HAuCl4 S
S
SS
SS
SS
S
S
SS
GG
G
G
G
GG
G
G
G
G
G
Glutathione (GSH) =
HN
NH2
OH
OO
HN
OH
O
OG =
N
NN
N
Sn
HOO
HO
O HO
O
Amide forming coupling reaction
Synthesis of glutathione protected gold nanoparticles
1. Acidified Methanol2. NaBH4/H2O
+
S
S
SS
SS
SS
S
S
SS
GG
G
G
G
GG
G
G
G
G
G
SnCe6
Ce6Sn
Ce6Sn
SnCe6
Tin Chlorin e6 (SnCe6) =
MES BufferEDC SaltNHS Sodium Salt
Au - GS - Snce6 nanoparticles

Chapter 3 Tin Chlorin e6–Glutathione–Gold Nanoparticles
66
The next step in the reaction involved the coupling of a tin chlorin e6 molecule to the
amino end of a glutathione on the surface of the gold nanoparticles (Figure 3-5). This is
achieved by the formation of an amide linkage via a condensation reaction. This
reaction takes place in the presence of the sodium salt of N-hydroxysulphosuccinimide
(sulfo-NHS) and 1-[3-(dimethyl amino) propyl]-3-ethyl-carbodiimide hydrochloride
(EDC). Sulfo-NHS is used to convert a carboxylic acid group on the tin chlorin e6 to an
amine reactive sulfo-NHS ester. This process is catalysed by EDC which behaves as a
dehydrating carbodiimide. EDC is not an effective dehydrating and crosslinking entity
by itself, because failure to react quickly with the amine results in the hydrolysis and
regeneration of the carboxylic acid (Figure 3-5).
Figure 3-5 Routes possible when coupling tin chlorin e6 to glutathione-gold nanoparticles using 1-[3-
(dimethyl amino) propyl]-3-ethyl-carbodiimide hydrochloride (EDC) and N-hydroxysulphosuccinimide
(sulfo-NHS)
OH
O
N
C
HN
NH
Cl
O
O
N
C
N
NH Cl
H2N
N
O
O
O
S OO
O
O
NHO
O
O
O
S OO
NH
O
NH
O
Stable amide bond
EDC
Sulfo - NHS
Unstable reactive O-acylisourea ester
OH
O
Regenerated carboxyl group on tin chlorin e6
Semi - stable amine reactive NHS ester
Stable amide bond
H2N
H2O
Glutathione (GSH) protected gold nanoparticle
Tin Chlorin e6 (SnCe6)

Chapter 3 Tin Chlorin e6–Glutathione–Gold Nanoparticles
67
EDC reacts with the carboxylic acid group of the tin chlorin e6, forming an amine
reactive O-acylisourea intermediate. This intermediate then can be reacted with the
amine on the glutathione of the Au-GS nanoparticles. This yields a conjugate of the
two entities joined by a stable amide bond. However this conjugate is also susceptible
to hydrolysis making it unstable and short lived in aqueous solutions. The addition of
sulfo-NHS stabilizes the amine reactive intermediate by converting it to an amine
reactive sulfo-NHS-ester. This increases the efficiency of EDC mediated coupling
reactions. The amine reactive sulfo-NHS ester intermediate has sufficient stability to
permit a two step coupling reaction.
There are three carboxylic acid groups on each tin chlorin e6 molecule. Therefore the
ratio of tin chlorin e6 to EDC was kept 1:1, in order to activate only one acidic group on
each molecule. The tin chlorin e6-glutathione-gold (Au-GS-SnCe6) nanoparticles
produced an intense green / black colour when isolated as a solid. However, a faint
green colour was observed when crushed with KBr for IR experiments. The conjugate
was air stable for at least 4 months and could be dissolved in water or phosphate buffer
(PBS) solution.
In order to change the core size of the nanoparticles three different Au:thiol ratios were
used. Sample NNG.1 (Au-GS) had gold:thiol ratio of 1:0.344. This gave an average
particle size of 2.6 ± 0.6 nm in the first step of the reaction. This sample was further
functionalised with the coupling reaction and the addition of tin chlorin e6. The product
of this reaction (Au-GS-SnCe6, NNG.3) had an average particle size of 2.3 ± 0.5 nm.
Sample NNG.4 (Au-GS) had gold:thiol ratio of 1:0.3. This gave an average particle
size of 5.2 ± 1.2 nm in the first step of the reaction. This sample was further
functionalised by a coupling reaction and the addition of tin chlorin e6. The product of
this reaction (Au-GS-SnCe6, NNG.5) had an average particle size of 5.4 ± 1.3 nm.
Sample NNG.6 (Au-GS) had gold:thiol ratio of 1:0.25. This gave an unusual result and
two particle size distributions were observed, 6.07 ± 1.4 nm and 1.97 ± 0.8. This
sample was further functionalised with the coupling reaction and the addition of tin
chlorin e6. The product of this reaction (Au-GS-SnCe6, NNG.7) also produced two
average particle size distributions of 6.24 ± 1.2 nm and 1.73 ± 0.6. Particle size
distributions were calculated from high resolution TEM images with sampling sizes of

Chapter 3 Tin Chlorin e6–Glutathione–Gold Nanoparticles
68
approximately 100 particles. It can clearly be seen in (Figure 3-6) that NNG.6 and
NNG.7 have two distinct particle size distributions.
Figure 3-6 Transmission Electron Microscopy images of glutathione-gold (Au-GS) particles, samples
NNG.1 (2.6 nm), NNG.4 (5.2 nm) and NNG.6 (6.07 and 1.97 nm), and their conjugated products
(Au-GS-SnCe6), NNG.3 (2.3 nm), NNG.5 (5.4 nm) and NNG.7 (6.24 and 1.73 nm) respectively.
NNG.1 NNG.3
NNG.4 NNG.5
NNG.6 NNG.7

Chapter 3 Tin Chlorin e6–Glutathione–Gold Nanoparticles
69
Elemental analysis was performed on all samples, and using these data the mass of tin
chlorin e6 per 100 mg of samples NNG.3, NNG.5, NNG.7 was calculated. The resulted
are presented in (Table 3-2).
Sample %C %H %N %S %Cl Mass of SnCe6/100
mg NNG.1 8.88 1.21 2.82 2.33 - - NNG.3 9.56 1.26 2.85 2.04 2.56 4.53 NNG.4 7.64 1.01 2.46 1.76 - - NNG.5 9.88 1.18 2.59 I/S 3.54 7.68 NNG.6 8.65 1.22 2.83 2.18 - - NNG.7 9.97 1.27 2.95 1.53 1.91 4.73
Table 3-2 Summary of elemental analysis and calculated mass of tin chlorin e6 (SnCe6) per 100 mg of
gold-glutathione-tin chlorin e6 of nanoparticles (Au-GS-SnCe6). I/S =Insufficient Sample
The mass of tin chlorin e6 per 100 g of sample for samples (NNG.3, NNG.5 and
NNG.7) was calculated using only the elemental analysis results. The method used was
as follows:
Number of carbon atoms in SnCe6 = 34
Mass of SnCe6 = 850
Number of carbon atoms in Glutathione = 10
Total mass of Carbon = MC
Mass on SnCe6 = 8503412
C
3410
34×
××
++
× M
x
x
3-1
Fraction of Carbon
that is in SnCe6
x = Number of SnCe6 molecules per glutathione
Number of carbon atoms in glutathione = 10
Total mass of carbon in 1 glutathione = 120
Number of nitrogen atoms in glutathione = 3

Chapter 3 Tin Chlorin e6–Glutathione–Gold Nanoparticles
70
Total mass of nitrogen in glutathione = 42
Number of nitrogen atoms in SnCe6 = 4
Total mass of nitrogen in SnCe6 = 56
Therefore the carbon to nitrogen ratio is:
5642
408120
×+
×+=
x
x
N
C
3-2
The N
C was calculated from the elemental analysis data for samples (NNG.3, NNG.5
and NNG.7) and the equation was rearranged for x .
3-3
The thermal decomposition of Au-GS nanoparticles (samples NNG.1, NNG.4 and
NNG.6) are shown in Figure 3-7. The thermal decomposition of the smallest particles
(NNG.1), with an average diameter of 2.6 nm occurred in two steps; a well-defined step
that began at approximately 190 °C and was completed by 420 °C, and a second step
from 420 °C to 650 °C. The percentage weight losses for the organic fragments were
31.6% for sample NNG.1. The thermal decomposition mass loss of samples NNG.4
and NNG.6 occurred in one step, which began at 190 °C and was completed by 1000
°C. The total mass loss was 20.9% and 18.2% respectively.
The thermal decomposition of gold-glutathione-tin chlorin e6 nanoparticles (samples
NNG.3, NNG.5 and NNG.7) are shown in Figure 3-8. The thermal decomposition of
the smallest particles (NNG.3), with an average diameter of 2.3 nm occurred in two
steps; a well-defined step that began at approximately 190 °C and was completed by
500 °C, and a second step from 500 °C to 1100 °C. The percentage weight losses of the
organic fragments was 23.7% for sample NNG.3 consisting of Au-GS-SnCe6 particles.
The thermal decomposition mass loss of samples NNG.5 and NNG.7 occurred in one
step, which began at 190 °C and was completed by 1000 °C. The total mass loss was
18.4% and 21.0% respectively.
−×
×−
=
40856
42120
N
CN
C
x

Chapter 3 Tin Chlorin e6–Glutathione–Gold Nanoparticles
71
Figure 3-7 Thermal Gravimetric Analysis (TGA) of glutathione-gold (Au-GS) particles, samples
NNG.1 (2.6 nm), NNG.4 (5.2 nm) and NNG.6 (6.07 and 1.97 nm).
Figure 3-8 Thermal Gravimetric Analysis (TGA) of gold-glutathione-SnCe6 nanoparticles
(Au-GS-SnCe6), NNG.3 (2.3 nm), NNG.5 (5.4 nm) and NNG.7 (6.24 and 1.73 nm).
The residue from the TGA experiments from both the Au-GS and the Au-GS-SnCe6
sets of nanoparticles was shown by X-ray diffraction to be highly crystalline gold metal.
40
50
60
70
80
90
100
0 200 400 600 800 1000
Temperature (°C)
TG
(%
)
NNG.1 NNG.4 NNG.6
Mass Change NNG.1 = -31.6% NNG.4 = -20.9% NNG.6 = -18.2
60
70
80
90
100
0 200 400 600 800 1000
Temperature °C
TG
%
NNG.3 NNG.5 NNG.7
Mass Change NNG.3 = -23.7% NNG.5 = -18.4% NNG.7 = -21.0

Chapter 3 Tin Chlorin e6–Glutathione–Gold Nanoparticles
72
This is consistent with previous TGA work on alkanethiolate–gold nanoparticles.137 An
example of which (NNG.4) is shown in Figure 3-9.
Figure 3-9 X-ray diffraction (XRD) pattern of the residue left in the pan after thermal gravimetric
analysis, confirms presence of elemental gold in sample NNG.4. The pattern is indexed and shows the
expected stick pattern (red) for gold metal.
Infra-red spectroscopy of the Au-GS nanoparticles (NNG.1, NNG.4 and NNG.6)
showed that the bands for glutathione were readily observed (Figure 3-10). However,
the S-H vibration observed at 2524 cm-1 of the free glutathione ligand, was not observed
for any of the subsequent samples. This is a clear indication that the glutathione was
de-protonated and coordinated to the surface of the gold nanoparticle through the
sulphur. The N–H vibration at 3250 cm-1 of free glutathione was not clearly observed
on all samples, although a shoulder at a lower frequency was observed indicating a
change in hydrogen bonding.
The aromatic rings band at ~1600 cm−1 of the tin chlorin e6 was not observed in the
Au–GS–SnCe6 nanoparticles (NNG.3, NNG.5 and NNG.7) spectra. This was because
there was an overlap of peaks from the glutathione in this region. Analysis of the IR
spectra provides some evidence for the formation of Au-GS particles. However, the
(1 1
1)
(2 0
0)
(2 2
0)
(3 1
1)
(2 2
2)

Chapter 3 Tin Chlorin e6–Glutathione–Gold Nanoparticles
73
coupling of SnCe6 to these particles could not be clearly observed, as there was
significant overlap of peaks.
Figure 3-10 Transmission infra-red spectra of free glutathione, tin chlorin e6, glutathione-gold
(Au-GS) particles, samples NNG.1 (2.6 nm), NNG.4 (5.2 nm) and NNG.6 (6.07 and 1.97 nm), and their
conjugated products (Au-GS-SnCe6), NNG.3 (2.3 nm), NNG.5 (5.4 nm) and NNG.7 (6.24 and 1.73
nm) respectively.
Glutathione
Tin chlorin e6
NNG.1
NNG.4
NNG.6
NNG.3
NNG.5
NNG.7
Wavenumber cm-1
2524 3250 1713
1718
3290

Chapter 3 Tin Chlorin e6–Glutathione–Gold Nanoparticles
74
UV-visible absorption spectra were taken of all samples in deionised water and
phosphate buffer solution. Particles in general dissolved more readily in phosphate
buffer. For the Au-GS particles, only a slight surface plasmon was observed for NNG.1
and NNG.4 at around 550 nm in water (Figure 3-11). NNG.6 did not display any
surface plasmon when dissolved in water. When the Au-GS nanoparticles (NNG.1,
NNG.4 and NNG.6) were dissolved in phosphate buffer solution, surface plasmons
were observed for all the samples around 525 nm.
Figure 3-11 UV-visible absorption spectra of glutathione-gold (Au-GS) nanoparticles, samples NNG.1
(2.6 nm), NNG.4 (5.2 nm) and NNG.6 (6.07 and 1.97 nm) in water (top) and phosphate buffer solution
(bottom).
0
0.2
0.4
0.6
0.8
1
1.2
1.4
1.6
1.8
2
400 450 500 550 600 650 700 750 800
Wavelength (nm)
Ab
sorp
tio
n (
A. U
.)
NNG.1 (W) NNG.4 (W) NNG.6 (W)
0
0.2
0.4
0.6
0.8
1
1.2
1.4
300 350 400 450 500 550 600 650 700 750 800
Wavelength (nm)
Ab
sorp
tio
n (
A. U
.)
NNG.1 (PBS) NNG.4 (PBS) NNG.6 (PBS)

Chapter 3 Tin Chlorin e6–Glutathione–Gold Nanoparticles
75
Figure 3-12 UV-visible absorption spectra of gold-glutathione-tin chlorin e6 (Au-GS-SnCe6)
nanoparticles, NNG.3 (2.3 nm), NNG.5 (5.4 nm) and NNG.7 (6.24 and 1.73 nm) in water (top) and
phosphate buffer solution (bottom).
The presence of tin chlorin e6 was observed in the UV-visible absorption spectra
(Figure 3-12) of Au-GS-SnCe6 particles (NNG.3, NNG.5, NNG.7) in water, indicating
some solubility in water of these particles. The UV-visible absorption spectra of the
same particles when taken in phosphate buffer are clearer. The Soret peak138 at
approximately 400 nm is clearly visible and can not be any other entity other than tin
chlorin e6. The other dominant peak at approximately 630 nm is also observed in
water, but is more pronounced in the UV-visible absorption spectra in phosphate buffer.
0
0.5
1
1.5
2
2.5
3
300 350 400 450 500 550 600 650 700 750 800
Wavelength (nm)
Ab
sorp
tio
n (
A. U
.)
SnCe6 (W) NNG.3 (W) NNG.5 (W) NNG.7 (W)
0
0.5
1
1.5
2
2.5
300 350 400 450 500 550 600 650 700 750 800
Wavelength (nm)
Ab
sorp
tio
n (
A. U
.)
SnCe6 (PBS) NNG.3 (PBS) NNG.5 (PBS) NNG.7 (PBS)

Chapter 3 Tin Chlorin e6–Glutathione–Gold Nanoparticles
76
As the presence of the photosensitiser tin chlorin e6 was confirmed in samples NNG.3
NNG.5 and NNG.7, lethal photosensitisation microbiology experiments were carried
out at the Eastman Dental Institute in collaboration with Linda Dekker. Figure 3-13
displays the antimicrobial kills achieved by the Au-GS-SnCe6 nanoparticles (samples
NNG.5 and NNG.7). NNG.5 had the highest antibacterial kill at a 16 µM concentration.
The antibacterial kill was concentration dependant.
Figure 3-13 Lethal photosensitisation of S. aureus 8325-4 using a SnCe6-GS-Au nanoparticle
conjugate and 30 min white light exposure. L-= no light, S-=no sensitiser
3.4 Discussion
Gold-glutathione (Au-GS) nanoparticles were synthesised in acidified methanol,
purified, and isolated as a solid. These nanoparticles were further functionalised in the
second step of the reaction. The synthesis of Gold-glutathione-tin chlorin e6
(Au-GS-SnCe6) nanoparticles was successfully achieved in aqueous solution, purified,
and isolated as a green / black solid. The coupling of tin chlorin e6 to the amino end of
glutathione via a condensation reaction has proved to be a very reliable method for the
functionalisation of applicable thiol coated gold nanoparticles.
1.00E+00
1.00E+01
1.00E+02
1.00E+03
1.00E+04
1.00E+05
1.00E+06
1.00E+07
L-S- SnCe6 NNG5 NNG7
Concentration of Tin Chlorin e6
0uM 0.06uM 2uM 4uM 8uM 16uM

Chapter 3 Tin Chlorin e6–Glutathione–Gold Nanoparticles
77
In this study the core size of the gold nanoparticles were modified.137,139 Murray et
al.137 found that by increasing the Au:thiol ratio larger particles are obtained. This is
plausible as smaller particles have a larger total surface area, hence require more
coverage. Therefore by increasing the amount of thiol in the reaction mixture smaller
particles should be obtained. This was mostly in agreement with the results obtained in
the study. In the synthesis experiments the total gold concentration was kept constant
and thiol concentration was lowered for samples through samples NNG.1, NNG.4 and
NNG.6 respectively. This did increase the average particle size from 2.6 ± 0.6 nm to
6.07 ± 1.4 nm. However, in sample NNG.6 where the gold thiol ratio was 1:0.25 two
distinct size distributions were observed, 6.07 ± 1.4 nm and 1.97 ± 0.8. Since the
preparation methods are based on nucleation of gold cores, the sizes of the resulting
nanoparticles are inevitably distributed to statistical fluctuations in the nucleation
process. Additionally, Whetten et al.127 found one dominant size of Au-GS clusters
when using a very similar approach. They separated their Au clusters by
polyacrylamide gel electrophoresis (PAGE) and found the most abundant species as
Au28(GS)16 by mass spectrometry.
Recently Pradeep et al.140 found that small clusters (0.7 nm) of Au25(GS)18 prepared in a
similar method are susceptible to electron beam damage in a TEM microscope. Upon
exposure to the electron beam the cores coalesce to form larger particles. In this study,
during TEM sessions this was also observed, as particles became more evident the
longer a section of a TEM grid was studied. Therefore it is possible that the second size
smaller size distribution observed in sample NNG.6 is an artefact of the coalescence of
much smaller, more stable clusters of Au(GS). Unfortunately the image resolution on
the TEM used is not high enough to detect any clusters before they coalesce.
In this study, the second step in the procedure to make gold-glutathione-tin chlorin e6
(Au-GS-SnCe6) nanoparticles was the coupling of a photosensitiser to the amine end of
the glutathione on Au(GS) nanoparticles. This was achieved via a condensation
reaction between a carboxylic acid group on the photosensitiser (tin chlorin e6) and
amine group on the protecting thiol (glutathione). This was in contrast to the protocol
used in the previous chapter where the carboxylic acid group was on the protecting thiol

Chapter 3 Tin Chlorin e6–Glutathione–Gold Nanoparticles
78
(tiopronin) and amine was on the photosensitiser (toluidine blue). This coupling
method has been successful in using both approaches, and is versatile enough to allow
many more synthetic combinations.
The elemental analysis data was primarily used to calculate the concentration of tin
chlorin e6 on each of the samples. Ideally, a similar approach to Murray et al.137 would
have been adopted, where the TGA data was employed. However, the TGA data were
inconsistent. For example sample NNG.1 which has motif Au-GS had a total mass loss
of 31.64% for the organic fragments. Upon addition of the tin chlorin e6 to obtain
NNG.3 (Au-GS-SnCe6) the total mass loss from the organic fragment was only 23.72%.
The residue left in the pan for each of the samples was consistently found to be
elemental, crystalline gold by X-ray diffraction. The peaks observed correspond to the
(111), (200), (220), (311) and (222) facets of the fcc crystal structure of elemental gold.
The infra red (IR) spectroscopy suggested the presence of glutathione on the gold
nanoparticles. The absence of the characteristic SH vibration at 2524 cm-1 is absent
from the samples synthesised with both motifs of Au-GS and Au-GS-SnCe6. This
implies that the glutathione was successfully de-protonated and that the sulphur formed
a covalent bond with the gold on the surface of the nanoparticle, however the IR
resolution was too poor to detect this directly. Studies by Basu et al.119 found that
glutathione binds to gold surfaces through the sulphur, along with further stabilisation
by the amine groups which anchor the glutathione to the surface of the gold
nanoparticle. They found that this was dependant on the pH of the reaction medium.
Lower pH values favour the thiol of the cystine and the primary amine of glutamic acid
of the tripeptide glutathione, to bind effectively to gold surfaces. As the synthesis
conditions of Au-GS nanoparticles used in this study require low pH it can be assumed
that fewer amine groups were available for further functionalisation, such as the
attachment of the photosensitiser tin chlorin e6. This is evident from the IR spectra of
the samples with the motif Au-GS-SnCe6 (NNG.3, NNG.5 and NNG.7) where the
detection of tin chlorin e6 was not possible. This maybe because the concentration of
tin chlorin e6 in the KBr pellets was below the detection threshold limit. Additionally,
the glutathione which is present in higher concentrations would help mask any tin
chlorin e6 peaks as they have many common functional groups.
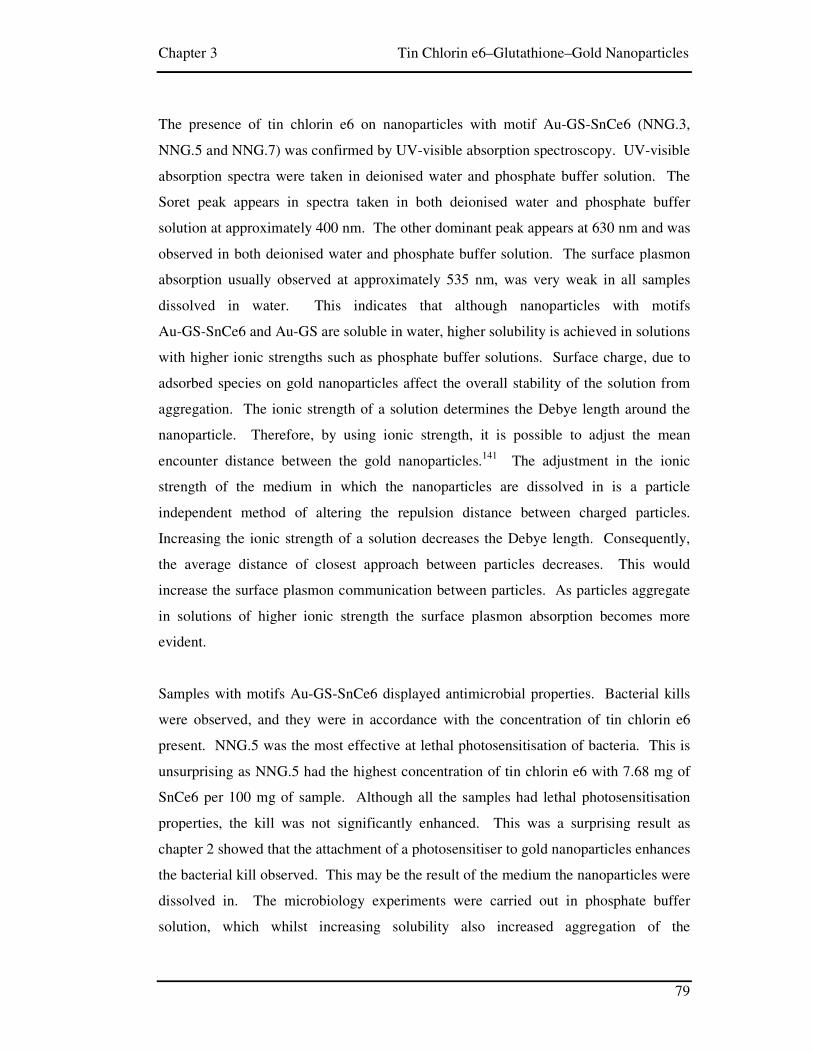
Chapter 3 Tin Chlorin e6–Glutathione–Gold Nanoparticles
79
The presence of tin chlorin e6 on nanoparticles with motif Au-GS-SnCe6 (NNG.3,
NNG.5 and NNG.7) was confirmed by UV-visible absorption spectroscopy. UV-visible
absorption spectra were taken in deionised water and phosphate buffer solution. The
Soret peak appears in spectra taken in both deionised water and phosphate buffer
solution at approximately 400 nm. The other dominant peak appears at 630 nm and was
observed in both deionised water and phosphate buffer solution. The surface plasmon
absorption usually observed at approximately 535 nm, was very weak in all samples
dissolved in water. This indicates that although nanoparticles with motifs
Au-GS-SnCe6 and Au-GS are soluble in water, higher solubility is achieved in solutions
with higher ionic strengths such as phosphate buffer solutions. Surface charge, due to
adsorbed species on gold nanoparticles affect the overall stability of the solution from
aggregation. The ionic strength of a solution determines the Debye length around the
nanoparticle. Therefore, by using ionic strength, it is possible to adjust the mean
encounter distance between the gold nanoparticles.141 The adjustment in the ionic
strength of the medium in which the nanoparticles are dissolved in is a particle
independent method of altering the repulsion distance between charged particles.
Increasing the ionic strength of a solution decreases the Debye length. Consequently,
the average distance of closest approach between particles decreases. This would
increase the surface plasmon communication between particles. As particles aggregate
in solutions of higher ionic strength the surface plasmon absorption becomes more
evident.
Samples with motifs Au-GS-SnCe6 displayed antimicrobial properties. Bacterial kills
were observed, and they were in accordance with the concentration of tin chlorin e6
present. NNG.5 was the most effective at lethal photosensitisation of bacteria. This is
unsurprising as NNG.5 had the highest concentration of tin chlorin e6 with 7.68 mg of
SnCe6 per 100 mg of sample. Although all the samples had lethal photosensitisation
properties, the kill was not significantly enhanced. This was a surprising result as
chapter 2 showed that the attachment of a photosensitiser to gold nanoparticles enhances
the bacterial kill observed. This may be the result of the medium the nanoparticles were
dissolved in. The microbiology experiments were carried out in phosphate buffer
solution, which whilst increasing solubility also increased aggregation of the

Chapter 3 Tin Chlorin e6–Glutathione–Gold Nanoparticles
80
nanoparticles, that may have hindered singlet oxygen production by the photosensitiser.
Additionally, if there was more of the sample left after the microbiology experiments,
the TGA and elemental analysis would have been repeated in order to obtain a more
accurate values so that the Murray et al.137 analysis of calculating the amount of ligand
per nanoparticle could be performed. Another method of confirming the amount of tin
chlorin e6 per nanoparticle would have been to use UV-visible spectroscopy. This
could not be performed due to insufficient mass of sample.
3.5 Conclusion
Nanoparticles with motifs of Au-GS-SnCe6, in different diameters ranging from 1.73 to
6.24 nm were synthesised in a two step reaction. The attachment of the photosensitiser
tin chlorin e6 to glutathione protected gold nanoparticles was confirmed by UV-visible
absorption spectroscopy. The expected enhanced bacterial kill for nanoparticles with
such motifs was not observed. However, this study has established that the synthetic
route is robust enough for many different combinations of Gold-thiol-photosensitiser to
be explored.
The next chapter describes experiments conducted with charge stabilised nanoparticles
and photosensitisers. These experiments investigated the mechanism by which
enhanced kill by lethal photosensitisation of bacteria was achieved when
photosensitisers are brought in close proximity to gold nanoparticles.

Chapter 4 Charge Stabilised Gold Nanoparticles and Photosensitisers
81
Chapter 4 Charge Stabilised Gold Nanoparticles and
Photosensitisers
This chapter describes the synthesis and chemical interactions of charge stabilised gold
nanoparticles with dyes. The nanoparticles were synthesised by the citrate reduction
method.28
Factors which affect the synthesis of the nanoparticles and their interaction
with various light activated antimicrobial dyes have been examined. It was found that
when a solution of thiazine dye is titrated against gold hydrosol, at a critical
concentration (ca. 3×10⁻⁶
M) there is an enhanced maximum absorption in the dye. The
extinction coefficient is increased by a factor of 1log10. This was observed for all the
family of thiazine dyes, of which methylene blue and toluidine blue are established light
activated antimicrobial agents. The same enhancement was not observed for anionic,
acidic dyes such as rose bengal. It was found that mixing these charge stabilised gold
nanoparticles with thiazine dyes enhanced the kill of bacteria.
4.1 Introduction
In this study, charge stabilised gold nanoparticles synthesised by a modified Turkevich
synthesis28 were mixed with light activated antimicrobial agents, for experiments in
determining the lethal photosensitisation of bacteria. In this introduction key aspects of
the synthesis are reviewed. Furthermore, the application of thiazine dyes in lethal
photosensitisation of bacteria is discussed.
Turkevich’s citrate reduction remains popular for the synthesis of gold nanoparticles.
The reaction is rapid and results in very stable sols. Ferns17 reported, by varying the
amount of citrate added the size of nanoparticles obtained can be modified. Colloids
obtained are typically 12 – 70 nm in diameter. The gold nanoparticle solutions used for
these experiments were synthesised using a modified Turkevitch synthesis28 and the
colloids produced are discussed in further detail.

Chapter 4 Charge Stabilised Gold Nanoparticles and Photosensitisers
82
The Turkevich synthesis28,142 is a redox reaction where the oxidation of citrate produces
acetone dicarboxylic acid, which in turn reduces Au(III) to Au(0). The formation of
acetone dicarboxylic acid creates an induction period in the reaction. This induction
period decreased with temperature, the required activation energy was ca. 15 kcal/mol.
This was then followed by a nucleation step, resulting in rapid formation of a solution,
super saturated with nuclei. The nuclei had a diameter of 1-2 nm and occurred
approximately 5 seconds after the addition of the citrate. This was indicated by the
colourless solution and absence of plasmon absorbance in the range of 500-900 nm.
The synthesis of acetone dicarboxylic acid is the limiting factor for the reaction:
4-1
Figure 4-1 Schematic diagram adapted from Sandroff and Herschbach44
which represents colloidal
gold in the citrate complex. The citrate is strongly bound at sites where oxidation states of the gold +1.
Sandroff and Herschbach44 expanded on Turkevich’s work. They concluded that the
citrate ion remained strongly bound to the surface of the gold nanoparticle, providing a
Citrate
Au (III)
Au (I)
Gold Colloid
Gold / Citrate Complex
x
Polymeric Gold / Citrate
Complex
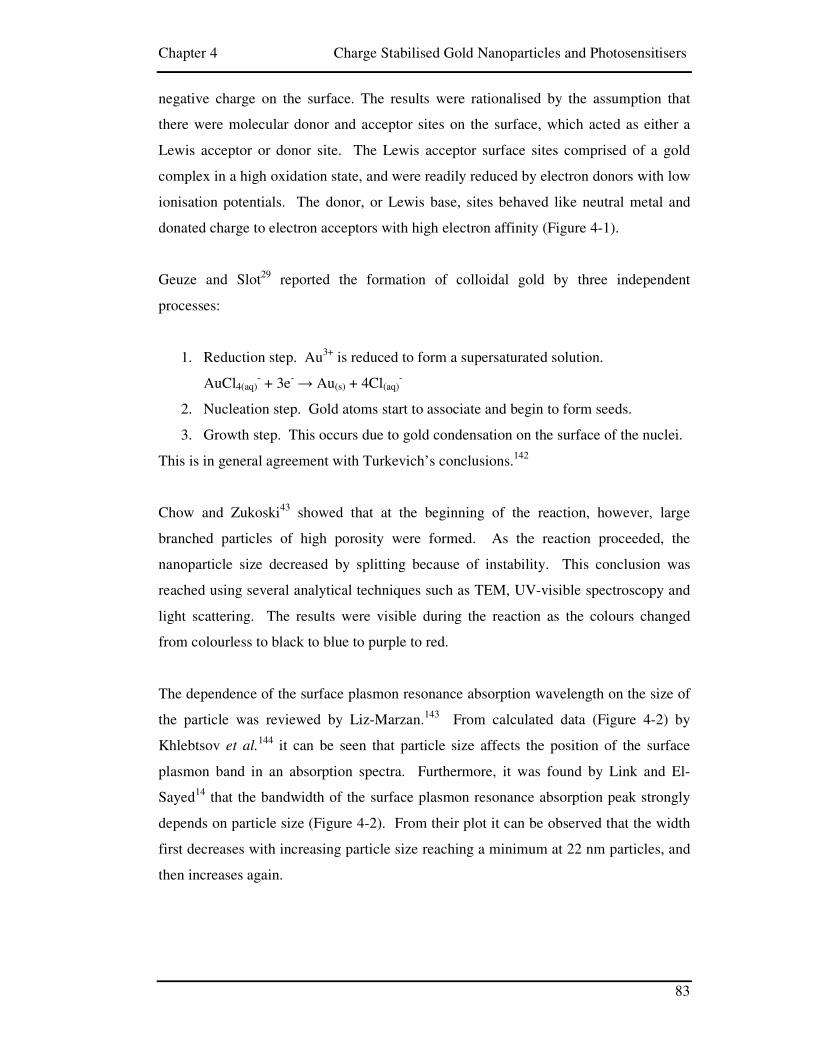
Chapter 4 Charge Stabilised Gold Nanoparticles and Photosensitisers
83
negative charge on the surface. The results were rationalised by the assumption that
there were molecular donor and acceptor sites on the surface, which acted as either a
Lewis acceptor or donor site. The Lewis acceptor surface sites comprised of a gold
complex in a high oxidation state, and were readily reduced by electron donors with low
ionisation potentials. The donor, or Lewis base, sites behaved like neutral metal and
donated charge to electron acceptors with high electron affinity (Figure 4-1).
Geuze and Slot29 reported the formation of colloidal gold by three independent
processes:
1. Reduction step. Au3+ is reduced to form a supersaturated solution.
AuCl4(aq)- + 3e- → Au(s) + 4Cl(aq)
-
2. Nucleation step. Gold atoms start to associate and begin to form seeds.
3. Growth step. This occurs due to gold condensation on the surface of the nuclei.
This is in general agreement with Turkevich’s conclusions.142
Chow and Zukoski43 showed that at the beginning of the reaction, however, large
branched particles of high porosity were formed. As the reaction proceeded, the
nanoparticle size decreased by splitting because of instability. This conclusion was
reached using several analytical techniques such as TEM, UV-visible spectroscopy and
light scattering. The results were visible during the reaction as the colours changed
from colourless to black to blue to purple to red.
The dependence of the surface plasmon resonance absorption wavelength on the size of
the particle was reviewed by Liz-Marzan.143 From calculated data (Figure 4-2) by
Khlebtsov et al.144 it can be seen that particle size affects the position of the surface
plasmon band in an absorption spectra. Furthermore, it was found by Link and El-
Sayed14 that the bandwidth of the surface plasmon resonance absorption peak strongly
depends on particle size (Figure 4-2). From their plot it can be observed that the width
first decreases with increasing particle size reaching a minimum at 22 nm particles, and
then increases again.
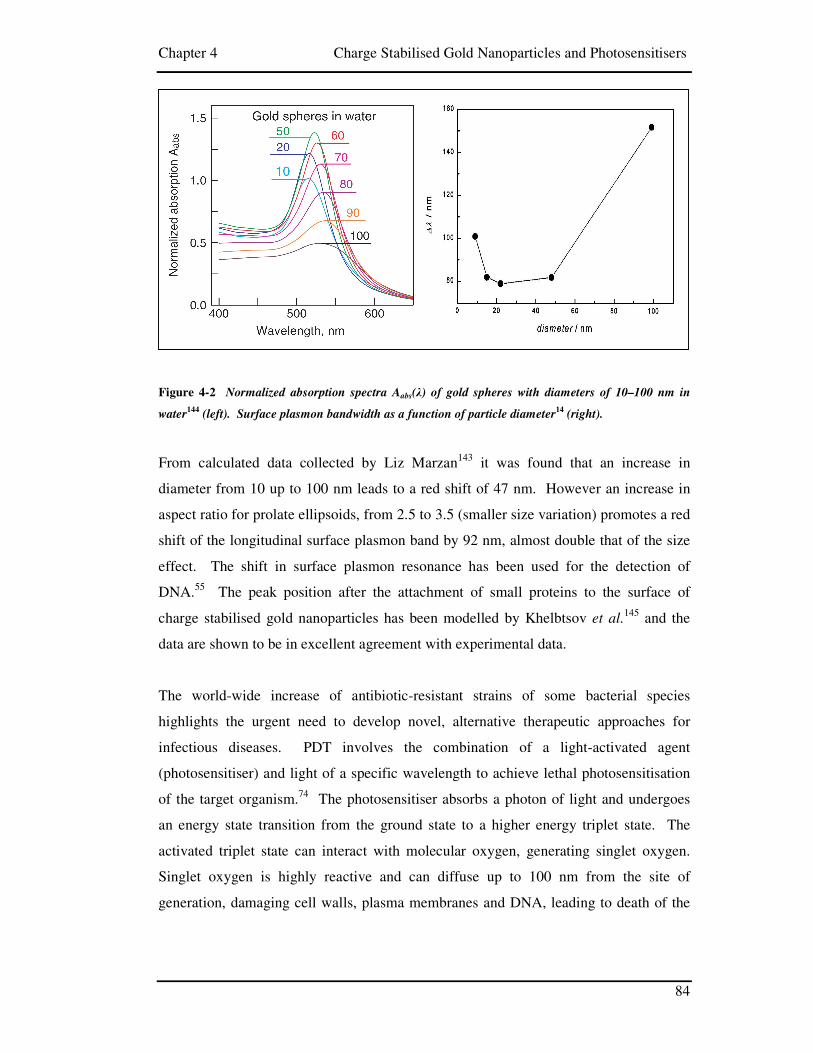
Chapter 4 Charge Stabilised Gold Nanoparticles and Photosensitisers
84
Figure 4-2 Normalized absorption spectra Aabs(λ) of gold spheres with diameters of 10–100 nm in
water144
(left). Surface plasmon bandwidth as a function of particle diameter14
(right).
From calculated data collected by Liz Marzan143 it was found that an increase in
diameter from 10 up to 100 nm leads to a red shift of 47 nm. However an increase in
aspect ratio for prolate ellipsoids, from 2.5 to 3.5 (smaller size variation) promotes a red
shift of the longitudinal surface plasmon band by 92 nm, almost double that of the size
effect. The shift in surface plasmon resonance has been used for the detection of
DNA.55 The peak position after the attachment of small proteins to the surface of
charge stabilised gold nanoparticles has been modelled by Khelbtsov et al.145 and the
data are shown to be in excellent agreement with experimental data.
The world-wide increase of antibiotic-resistant strains of some bacterial species
highlights the urgent need to develop novel, alternative therapeutic approaches for
infectious diseases. PDT involves the combination of a light-activated agent
(photosensitiser) and light of a specific wavelength to achieve lethal photosensitisation
of the target organism.74 The photosensitiser absorbs a photon of light and undergoes
an energy state transition from the ground state to a higher energy triplet state. The
activated triplet state can interact with molecular oxygen, generating singlet oxygen.
Singlet oxygen is highly reactive and can diffuse up to 100 nm from the site of
generation, damaging cell walls, plasma membranes and DNA, leading to death of the
Chapter 4 Charge Stabilised Gold Nanoparticles and Photosensitisers
85
microbial cells.146 The singlet oxygen generated can also interact with solvent and
substrate molecules producing free radicals and radical ions.
Thiazine dyes absorb between 550-700 nm, and have a characteristic blue colour.
Toluidine blue is used in staining of various cells, and in conjunction with malachite
green for the staining of lipids. Both toluidine blue and methylene blue are used in the
diagnosis of cancerous tissue. It was found by Bellin et al.81 that tumour cells were
susceptible to killing by light, when treated with methylene blue. These light activated
antimicrobial agents are promising alternatives for the treatment of topical infections.
The use of these antimicrobial agents in conjunction with nanoparticles and a bacterial
recognition moiety is advantageous. They are more effective at killing bacteria since
the oxygen produced is concentrated at the bacterial cell wall. Also, there is selective
killing, since binding of the photosensitiser is in close proximity to the target organism,
and this reduces the collateral damage to neighbouring healthy cells.92
Figure 4-3 Structures of the thiazine family of dyes
Some of the emerging light activated antimicrobial agents are dyes, more frequently
used in bacterial staining. Methylene blue is a metachromatic dye commonly used in
the staining of nuclei. Oxidation of methylene blue produces Azure A, B and C. Other
S
N
N(CH3)2(CH3)2N S
N
NH2(CH3)2N
S
N
NH2H2N S
N
NH2(CH3)2N
S
N
N(CH3)H(CH3)2N S
N
NH2(CH3)HN
Cl- Cl-
Cl- Cl-
Cl- Cl-
Methylene Blue Toluidine Blue
Thionin Azure A
Azure B Azure C

Chapter 4 Charge Stabilised Gold Nanoparticles and Photosensitisers
86
closely related dyes are toluidine blue and thionin which all comprise the group of
thiazine dyes (Figure 4-3).
Gold nanoparticles have nonspecific adsorption properties, which have allowed their
use as tracers for proteins. However, full characteristics at a molecular level of the gold
particle suspension and the adsorption of proteins have not yet been subject to a full
study.147 Factors affecting adsorption of dyes onto gold nanoparticles include: particle
size, relative molecular weight of the dye and the pH.
When proteins, such as bovine serum albumin, are adsorbed onto the surface of gold
nanoparticles, the maximum number of molecules that can be associated with a single
particle is linearly related to the average projection area of the particle. The size of the
particle would therefore affect the adsorption of dyes onto a surface. If it is assumed
that the area occupied by the dye will be equal to its projection onto the gold particle
surface, a monomolecular shell of dye covering the nanoparticle would result.
Therefore, large dye molecules, have a lower number of molecules in contact with the
gold nanoparticle surface. The effect of pH has not been investigated thoroughly in
protein adsorption. However, since charge stabilised nanoparticles aggregate when
electrolytes are added, the small increase in ionic strength causes aggregation of the
particles.
Antimicrobial PDT has great potential as a therapeutic approach to eradicating
microbial infections. Therefore enhancing the efficacy of known photosensitising
agents of this therapeutic approach is highly desirable. The work presented here shows
that gold nanoparticles enhance the effectiveness of an established photosensitiser:
toluidine blue (TBO), against the important human pathogen Staphylococcus aureus.
4.2 Experimental
Synthesis of charge stabilised gold nanoparticles: All glassware was washed with
aqua regia (3HCl:1HNO3), followed by rinsing with copious amounts of water. All
water used in the experiments is double distilled water (except where stated).

Chapter 4 Charge Stabilised Gold Nanoparticles and Photosensitisers
87
Stock Solutions: HAuCl4.3H2O (42 mg, 0.11 mmol) was dissolved in deionised water
(25 mL) to form solution A (~5 mM). Na3C6H5O7.2H2O (125 mg, 0.43 mmol) was
dissolved in deionised water (25 mL) to give solution B (~20 mM).
Solution A (1 mL) was stirred with deionised water (18 mL) and boiled for 2 min. Then
solution B (1 mL) was added drop wise over a period of approximately 50 sec. causing
the colour change from clear to blue to pink/purple. After a further 1 min. of heating,
the solution was left to cool to room temperature.
Titration experiments: dye solution (1 mL) was added to the nanoparticle solution (16
mL). This was stirred and a cuvette was filled to take a UV-visible absorption
spectrum. The solution was not discarded but added back to the original mixture.
Another 1 mL of dye solution was added etc. This was repeated 10, 15 or 20 times
depending on the experiment.
Concentrations of Dyes:
Dye Concentration (µM) Toluidine Blue 5 Methylene Blue 5 Thionin 10 Azure A 10 Azure B 10 Azure C 10 Tin Chlorin E6 200 Rose Bengal 50 Rhodamine B 50
Table 4-1 Dyes and concentrations used for the titration experiments.
Bactericidal assays: The bacterial assays were carried out at the Eastman Institute in
collaboration with Sarah Tubby.
S. aureus (NCTC 6571) was maintained by weekly sub-culture on blood agar base
(Oxoid Ltd, Basingstoke, UK) supplemented with 5% (v/v) horse blood. For
experimental purposes, a few colonies of the organism were inoculated into nutrient

Chapter 4 Charge Stabilised Gold Nanoparticles and Photosensitisers
88
broth No. 2 (Oxoid) and grown aerobically for 16 h at 37 °C. Cells were then harvested
by centrifugation and re-suspended in sterile phosphate buffered saline (PBS) to an OD-
600 of 0.05 which corresponded to approximately 107 – 108 colony-forming units
(cfu)/mL.
The light source used in this study was a General Electric® 28W Biax 2D compact
fluorescent lamp which emits light across the visible spectrum. Prominent peaks were
present at 435, 495, 545, 588 and 610 nm. The lamp was fitted into a refrigerated
incubator (LTE Scientific Ltd, Oldham, UK) which maintained the temperature at a
constant 22°C. The light intensity was measured using a digital luxmeter (Hagner
Photometric Instruments Ltd, Bosham, UK) and was 3500-3700 lux. The
photosensitiser, TBO, was purchased from Sigma-Aldrich (Dorset, UK).
Aqueous suspensions of gold nanoparticles were mixed with an equal volume of
aqueous TBO and left at room temperature for 15 minutes. TBO was used at a final
concentration of 1, 5, 10, 20 or 50 µM. The TBO-nanoparticle mixture (100 µL) was
added to a suspension of S. aureus NCTC 6571 in phosphate buffered saline (PBS) (100
µL) and samples were irradiated with white light for 10 minutes (L+S+G+). S. aureus +
PBS without photosensitiser or gold nanoparticles and which was not irradiated (L-S-G-
) and irradiated samples of S. aureus + TBO only (L+S+G-) and S. aureus + PBS,
without photosensitiser or gold nanoparticles (L+S-G-) were used as controls. The final
concentration of nanoparticles used was 1 × 10¹⁵ particles/mL. The light intensity at the
surface of the microtitre plate was 3,700 ± 20 lux. After irradiation, the number of
surviving bacteria were determined by viable counting. The experiments were carried
out in duplicate and on two separate occasions.
Singlet oxygen measurements: Singlet oxygen measurements employed the second
harmonic (lex = 532 nm) of a Q-switched Spectra Physics GCR-150.10 Nd:YAG laser as
the excitation source (~1 mJ per pulse, ~5 ns full-width at half-maximum); a tungsten-
halogen lamp was used as the probe source. Detection was achieved using a
monochromator (instruments SA Triax 320) coupled to a photomultiplier tube (Hamatsu
R928). The phosphorescence from the sample was collected at 90º, was centred at 1270
nm (Infra Red Engineering Ltd., Essex UK) and then focused onto the active area of a

Chapter 4 Charge Stabilised Gold Nanoparticles and Photosensitisers
89
liquid nitrogen-cooled germanium photodiode (North Coast EO-817P). The output
from this device was AC coupled to a digital oscilloscope (Tektronix TDS-320), which
digitized and averaged transients. Typically 20 laser shots were used for each sample.
The transmitted light was monitored by a tektronix TDS-320 digital oscilloscope and
the transferred to a personal computer (PC) for storage and analysis. The emission was
measured for the toluidine blue/ gold nanoparticles solutions in D2O.
Particle size measurements: Photon correlation spectroscopy (PCS), using a Zetasizer
3000 (Malvern, UK) was used to measure the hydrodynamic diameter of the gold
nanoparticles in different concentrations of methylene blue. The measurements were
conducted in plastic cuvette in distilled water at 25°C, and a z-average diameter of the
particles was reported.
Fluorescence measurements: The measurement of fluorescence from the TBO and
gold nanoparticle mixtures was determined on a Perkin Elmer LS50B spectrometer,
with an excitation wavelength of 600 nm. The emission spectra were measured in 1 cm
quartz luminescence cuvettes containing the TBO and gold nanoparticle solutions.
UV-visible absorption measurements: UV-visible absorption spectra (200–1100 nm,
1 nm resolution) of aqueous solutions in 1 cm quartz cells were recorded with a
ThermoSpectronic, Heλios-λ UV-visible absorption spectrometer.
High resolution transmission electron microscopy (HRTEM): Samples were
prepared by evaporating the required specimen on a carbon coated copper grid. Bright
field TEM images were acquired using with an electron microscope operated at 100 kV
(Joel 100CX). Typical magnification of the images was 100 000×. Analysis of the
images was performed using the software program Image J.116

Chapter 4 Charge Stabilised Gold Nanoparticles and Photosensitisers
90
4.3 Results
Titration Experiments with Thiazine Dyes:
Thiazine dyes of specific concentrations (Table 4-1) were added in 1 mL aliquots to 16
mL of gold nanoparticle solution, which had been synthesised by a citrate reduction of
aqueous hydrogen tetrachloroaurate. Immediately, after each addition a UV-visible
absorption spectrum was taken. The same procedure was carried out for the anionic
dyes tested.
Figure 4-4 UV-visible absorption spectra showing the effect of increasing the concentration of
toluidine blue (TBO) in a gold nanoparticle solution. The total toluidine blue concentration of 0.238
µM (yellow line) was obtained by the addition of 1 mL of toluidine blue (5 µM) to 16 mL of gold
nanoparticle solution.
A maximum enhancement of the dye absorption was observed after 2 additions of
toluidine blue (5 µM), where there was a total toluidine blue concentration of 0.455 µM
in the reaction mixture. The maximum enhanced absorption was observed at 652 nm to
655 nm. A gradual decrease in the nanoparticle surface plasmon resonance absorption
was observed at 530 nm, which can be attributed to the increase in total volume; hence
0
0.2
0.4
0.6
0.8
1
1.2
270 370 470 570 670 770
Wavelength (nm)
Ab
sorp
tio
n (
A. U
.)
TBO (5 µM)
Au
Au + TBO (0.238 µM)
Au + TBO (0.455 µM)
Au + TBO (0.652 µM)
Au + TBO (0.833 µM)
Au + TBO (1.000 µM)
Au + TBO (1.154 µM)
Au + TBO (1.296 µM)

Chapter 4 Charge Stabilised Gold Nanoparticles and Photosensitisers
91
decrease in gold nanoparticle concentration. After the initial 2 additions of toluidine
blue there was a gradual decrease in the maximum absorption of the gold nanoparticles
and dye (Figure 4-4).
Figure 4-5 UV-visible absorption spectra showing the effect of increasing the concentration of
methylene blue (MB) on a gold nanoparticle solution. The total methylene blue concentration of 0.29
µM (yellow line) was obtained by the addition of 1 mL of methylene blue (5 µM) to 16 mL of gold
nanoparticle solution.
After the third 1 mL addition of methylene blue (5 µM) to a gold nanoparticle solution
(16 mL), a total methylene blue concentration of 0.79 µM was obtained. At this
concentration an enhancement of the dye absorption in the gold nanoparticle solution
was observed. The maximum enhanced absorption was observed at 667 nm. There was
a gradual decrease in the nanoparticle surface plasmon resonance absorption at around
530 nm, which can be attributed to the increase in total volume, hence decrease in gold
nanoparticle concentration. After the initial 3 additions of methylene blue there was a
gradual decrease in the maximum absorption of the gold nanoparticles and dye (Figure
4-5).
0
0.2
0.4
0.6
0.8
1
1.2
1.4
1.6
250 350 450 550 650 750 850
Wavelength (nm)
Ab
sorp
tio
n (
A.U
.)
Methylene Blue (5 µM)
Au (16 mL)
Au + MB (0.29 µM)
Au + MB (0.55 µM)
Au + MB (0.79 µM)
Au + MB (1 µM)
Au + MB (1.2 µM)
Au + MB (1.4 µM)
Au + MB (1.5 µM)

Chapter 4 Charge Stabilised Gold Nanoparticles and Photosensitisers
92
Figure 4-6 UV-visible absorption spectra showing the effect of increasing the concentration of
methylene blue (MB) an aqueous solution. The total methylene blue concentration of 0.29 µM (yellow
line) was obtained by the addition of 1 mL of methylene blue (5 µM) to 16 mL of deionised water.
As predicted by the Beer-Lambert law46 the effect of increasing the concentration of a
dye increases its absorption. The effect of increasing concentration of methylene blue
in aqueous solution is shown in Figure 4-6. At a methylene blue concentration of 0.79
µM in a gold nanoparticle solution the absorbance is greater than 1 (Figure 4-5).
However, at the same methylene blue concentration in water the absorbance is around
0.2. The same trend was observed for all thiazine dyes. The thiazine dyes tested were
Thionin (Figure 4-7), Azure A (Figure 4-8), Azure B (Figure 4-9), and Azure C (Figure
4-10). The enhanced absorptions in gold nanoparticle solutions for thionin, azure A,
azure B and azure C were not as significant as methylene blue and toluidine blue.
Additionally, a much higher concentration was required for this enhanced absorption to
be observed.
0
0.2
0.4
0.6
0.8
1
1.2
1.4
1.6
200 300 400 500 600 700 800
Wavelength (nm)
Ab
sorp
tio
n (
A. U
.)
Methylene Blue (5 µM)
MB (0.29 µM)
MB (0.55 µM)
MB (0.79 µM)
MB (1 µM)
MB (1.2 µM)
MB (1.4 µM)
MB (1.5 µM)

Chapter 4 Charge Stabilised Gold Nanoparticles and Photosensitisers
93
Figure 4-7 UV-visible absorption spectra of thionin (Th) in a gold nanoparticle solution. The total
thionin concentration of 0.588 µM (yellow line) was obtained by the addition of 1 mL of thionin (10
µM) to 16 mL of gold nanoparticle solution. The maximum absorption at 604 nm was observed after
6, 1 mL additions of thionin (10 µM), where the final concentrations was 2.727 µM.
Figure 4-8 UV-visible absorption spectra of azure A (Az A) in a gold nanoparticle solution. The total
azure A concentration of 0.588 µM (yellow line) was obtained by the addition of 1 mL of azure A (10
µM) to 16 mL of gold nanoparticle solution. The maximum absorption at 635 nm was observed after
15 additions of 1 mL azure A (10 µM) where the final concentration was 4.839 µM.
0
0.2
0.4
0.6
0.8
1
1.2
200 300 400 500 600 700 800 900 1000
Wavelength (nm)
Ab
sorp
tio
n (
A.
U.)
Thionin (10 µM)
Au
Au + Th (0.588 µM)
Au + Th (1.111 µM)
Au + Th (1.579 µM)
Au + Th (2.000 µM)
Au + Th (2.381 µM)
Au + Th (2.727 µM)
Au + Th (3.043 µM)
0
0.2
0.4
0.6
0.8
1
200 300 400 500 600 700 800 900 1000
Wavelength (nm)
Ab
sorp
tio
n (
A.
U.)
Azure A (10 µM)
Au
Au + AZ A (0.588 µM)
Au + AZ A (1.579 µM)
Au + AZ A (2.381 µM)
Au + AZ A (3.043 µM)
Au + AZ A (3.600 µM)
Au + AZ A (4.074 µM)
Au + AZ A (4.483 µM)
Au + AZ A (4.839 µM)
Au + AZ A (5.151 µM)
Au + AZ A (5.429 µM)

Chapter 4 Charge Stabilised Gold Nanoparticles and Photosensitisers
94
Figure 4-9 UV-visible absorption spectra of azure B (Az B) in a gold nanoparticle solution. The total
azure B concentration of 0.588 µM (yellow line) was obtained by the addition of 1 mL of azure B (10
µM) to 16 mL of gold nanoparticle solution. The maximum absorption at 656 nm was observed after 4
additions of 1 mL azure B (10 µM) where the final concentration was 2.381 µM.
Figure 4-10 UV-visible absorption spectra of azure C (Az C) in a gold nanoparticle solution. The total
azure C concentration of 0.588 µM (yellow line) was obtained by the addition of 1 mL of azure C (10
µM) to 16 mL of gold nanoparticle solution. The maximum absorption at 620 nm was observed after
17 additions of 1 mL Azure C (10 µM) where the final concentration was 2.381 µM.
0
0.2
0.4
0.6
0.8
1
200 300 400 500 600 700 800 900 1000
Wavelength (nm)
Ab
sorp
tio
n (
A.
U.)
Azure C (10 µM)
Au
Au + AZ C (0.588 µM)
Au + AZ C (1.579 µM)
Au + AZ C (2.381 µM)
Au + AZ C (3.043 µM)
Au + AZ C (3.600 µM)
Au + AZ C (4.074 µM)
Au + AZ C (4.483 µM)
Au + AZ C (4.839 µM)
Au + AZ C (5.151 µM)
Au + AZ C (5.429 µM)
0
0.2
0.4
0.6
0.8
1
1.2
1.4
200 300 400 500 600 700 800 900 1000
Wavelength (nm)
Ab
sorp
tio
n (
A.
U.)
Azure B (10 µM)
Au
Au + AZ B (0.588 µM)
Au + AZ B (1.111 µM)
Au + AZ B (2.000 µM)
Au + AZ B (2.381 µM)
Au + AZ B (2.727 µM)
Au + AZ B (3.043 µM)
Au + AZ B (3.333 µM)

Chapter 4 Charge Stabilised Gold Nanoparticles and Photosensitisers
95
Table 4-2 Summary of extinction coefficients and absorption data for thiazine dyes in solution and
adsorbed on to gold nanoparticles in solution.
Table 4-2 summarises the extinction coefficients along with the enhanced extinction
coefficients for all of the thiazine dyes. There was an average of around 1 log
maximum enhancement when these dyes were titrated against gold nanoparticles
compared to when they were titrated against water. By evaluating the various
absorbance values of the thiazine dyes in the presence and absence of gold nanoparticle
solution, there was an obvious increased absorption when the gold nanoparticles were
present at specific concentrations. At a toluidine blue concentration of 0.455 µM, when
mixed with gold nanoparticle solution the extinction coefficient of the dye was 1.6 x 10⁶
M-1cm-1 at 631 nm. A solution of toluidine blue in water at the same concentration had
an extinction coefficient of 1.5 x 10⁵ M-1cm-1 at 631 nm. There is, therefore, an
enhancement of more than one order of magnitude in the extinction coefficient at 631
nm when gold nanoparticles are present at low concentrations of toluidine blue. At
higher concentrations, the increase in the maximum absorption at 631 nm becomes less
with each addition. This corresponds best with saturation of the gold nanoparticle
surface by the dye and further addition of the dye (> 100 µM) induces precipitation.
Example of how the values in Table 4-2 were calculated.
Extinction coefficient of methylene blue e:
Max absorption of methylene blue at 664 nm is 1.434
The concentration methylene blue was 5 × 10⁻⁶ M
A = C × l × e
Dye e (M-1 cm-1) λmax Enhanced e (M-1 cm-1)
Enhanced λmax
Enhanced Absorbance (A.U.)
Absorbance if no enhancement (A. U.)
Methylene Blue
2.9×10⁵ 664 1.1×10⁶ 667 1.08-0.23 0.23
Toluidine Blue
1.5×10⁵ 631 1.6×10⁶ 652 0.96-0.23 0.08
Thionin 4.8×10⁴ 600 1.2×10⁵ 714 0.59-0.27 0.15 Azure A 2.3×10⁴ 611 5.4×10⁴ 638 0.44-0.18 0.11 Azure B 6.1×10⁴ 648 2.7×10⁵ 656 0.89-0.25 0.15 Azure C 2.9×10⁴ 616 1.6×10⁵ 620 0.55-0.18 0.15

Chapter 4 Charge Stabilised Gold Nanoparticles and Photosensitisers
96
e = A ÷ (C × l) e = 1.434 ÷ (5 × 10-6 × 1) e = 2.8 × 10⁵ M-1cm-1
Maximum enhanced absorption was observed after 3 additions of methylene blue (5 ×
10-6).
Moles of methylene blue in 3 mL:
(3 × 10-3) × (5 × 10-6) = 1.5 × 10⁻⁸ mol.
Total volume where maximum enhanced absorption was observed:
16 mL (gold nanoparticles) + 3 mL (methylene blue) = 19 mL.
Concentration of methylene blue in the reaction mixture:
1.5 × 10⁻⁸ mol ÷ 19 × 10-3 L = 7.89 × 10⁻⁷ M.
Extinction coefficient of methylene blue (7.89 × 10⁻⁷ M) when gold nanoparticles are
present.
Maximum enhanced absorption of methylene blue at 667 nm:
1.08 – 0.23(background) = 0.85,
e = 0.85 ÷ (7.89 × 10-7 × 1), e = 1.1 × 10⁶ M-1cm-1
Absorbance of methylene blue at concentration 7.89 × 10⁻⁷ M, when gold nanoparticles
are not present:
A = 7.89 × 10-7 × 1 × 2.9 × 105. A =0.23
A buffer solution was introduced into the titration experiments in order to investigate
the effect of induced aggregation on the enhanced dye absorption. The addition of a
buffer did not appear to affect the titration with methylene blue (Figure 4-11).
However, there is an additional absorbance broad peak just below 800 nm, which was
not present in the methylene blue titration alone with gold nanoparticles (Figure 4-5).
This additional shoulder was probably an artefact of the aggregation induced by KCl.
The enhanced absorbance peak of the methylene blue was present along with the
additional aggregation shoulder. Therefore the absorbance associated with the dye was
enhanced, and was not the result of aggregation of the gold nanoparticles because this
peak occurs at a higher wavelength in this case.
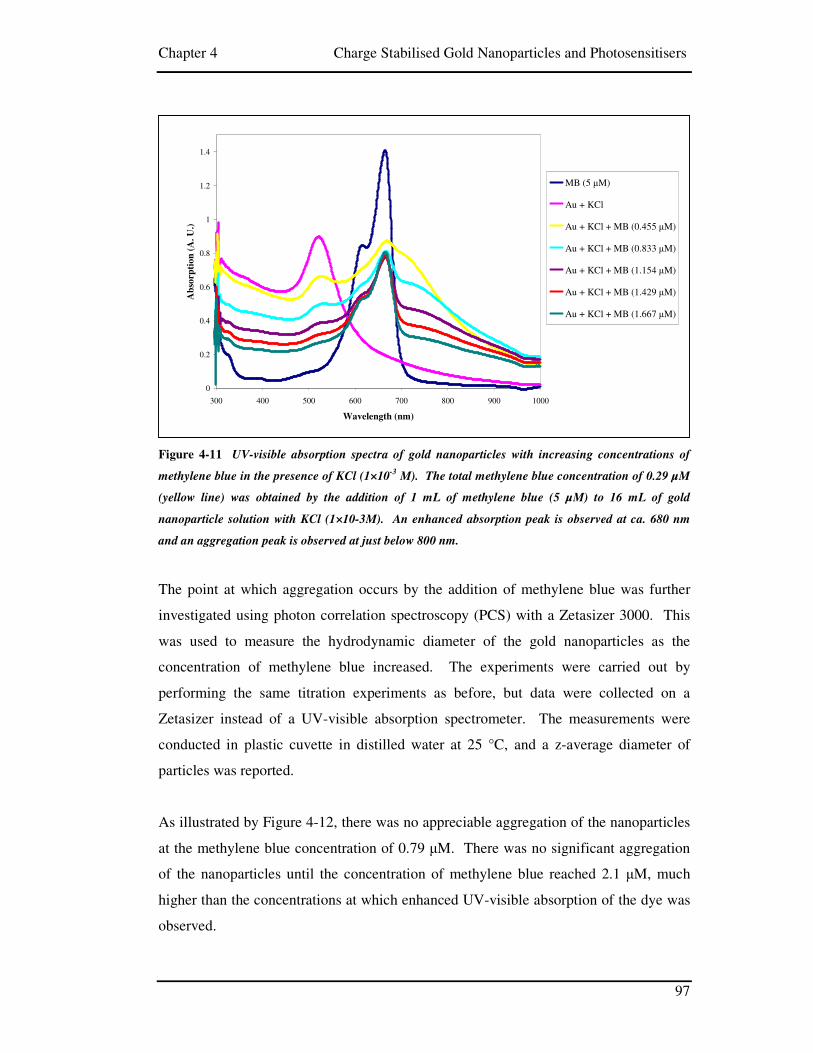
Chapter 4 Charge Stabilised Gold Nanoparticles and Photosensitisers
97
Figure 4-11 UV-visible absorption spectra of gold nanoparticles with increasing concentrations of
methylene blue in the presence of KCl (1×10⁻³
M). The total methylene blue concentration of 0.29 µM
(yellow line) was obtained by the addition of 1 mL of methylene blue (5 µM) to 16 mL of gold
nanoparticle solution with KCl (1×10⁻³M). An enhanced absorption peak is observed at ca. 680 nm
and an aggregation peak is observed at just below 800 nm.
The point at which aggregation occurs by the addition of methylene blue was further
investigated using photon correlation spectroscopy (PCS) with a Zetasizer 3000. This
was used to measure the hydrodynamic diameter of the gold nanoparticles as the
concentration of methylene blue increased. The experiments were carried out by
performing the same titration experiments as before, but data were collected on a
Zetasizer instead of a UV-visible absorption spectrometer. The measurements were
conducted in plastic cuvette in distilled water at 25 °C, and a z-average diameter of
particles was reported.
As illustrated by Figure 4-12, there was no appreciable aggregation of the nanoparticles
at the methylene blue concentration of 0.79 µM. There was no significant aggregation
of the nanoparticles until the concentration of methylene blue reached 2.1 µM, much
higher than the concentrations at which enhanced UV-visible absorption of the dye was
observed.
0
0.2
0.4
0.6
0.8
1
1.2
1.4
300 400 500 600 700 800 900 1000
Wavelength (nm)
Ab
sorp
tio
n (
A.
U.)
MB (5 µM)
Au + KCl
Au + KCl + MB (0.455 µM)
Au + KCl + MB (0.833 µM)
Au + KCl + MB (1.154 µM)
Au + KCl + MB (1.429 µM)
Au + KCl + MB (1.667 µM)

Chapter 4 Charge Stabilised Gold Nanoparticles and Photosensitisers
98
Figure 4-12 The results from photon correlation spectroscopy (PCS) with a Zetasizer 3000 to measure
the size distribution of (a) gold nanoparticle solution, (b) gold nanoparticle solution with methylene
blue (0.79 µM) and (c) gold nanoparticle solution with methylene blue (2.1 µM).
0
5
10
15
20
0.1 1 10 100 1000 10000
Inte
nsity
(%
)
Size (d.nm)
Size Distribution by Intensity
Record 18: Au+3MB(5x10⁻⁶M)
0
5
10
15
20
0.1 1 10 100 1000 10000
Inte
nsity
(%
)
Size (d.nm)
Size Distribution by Intensity
Record 8: Au
0
2
4
6
8
10
12
0.1 1 10 100 1000 10000
Inte
nsity
(%
)
Size (d.nm)
Size Distribution by Intensity
Record 45: Au+12MB(5x10⁻⁶M)
Au (a)
Au + MB (0.79 µM) (b)
Au + MB (2.1 µM) (c)
Peak 1 1 1 2 3 Size (nm) 21.4 21.9 26.3 693 3740 Intensity 100% 100% 84.2 3.2 12.6 Width (nm) 6.78 4.51 12.2 1240 1240
(a)
(b)
(c)

Chapter 4 Charge Stabilised Gold Nanoparticles and Photosensitisers
99
0
0.5
1
1.5
2
2.5
300 350 400 450 500 550 600 650 700 750
Wavelength (nm)
Ab
sorp
tion
(A
. U
.)
SnCe6 (200 µM)
Au
Au + SnCe6 (22.22 µM)
Au + SnCe6 (40.00 µM)
Au + SnCe6 (54.55 µM)
Au + SnCe6 (66.67 µM)
N
NN
N
Sn
HOO HO
O HO
O
Titration Experiments with Anionic Dyes:
The same titration experiments were performed using anionic dyes. Tin chlorin e6 has
been investigated as a possible LAAA.91 It has higher yields of singlet oxygen when
compared to other related chlorins, and has reactive carboxylic groups on the side
chains outside the polycyclic core, where antibody targeting moieties can be conjugated.
Figure 4-13 UV-visible absorption spectra tin chlorin e6 (SnCe6) in a gold nanoparticle solution. The
total tin chlorin e6 concentration of 22.22 µM (turquoise line) was obtained by the addition of 2 mL of
tin chlorin e6 (200 µM) to 16 mL of gold nanoparticle solution. The structure of structure of tin (IV)
chlorine e6 is displayed at the top right of the figure. The four isosbestic points are indicated with the
black arrows.
Unlike the thiazine dyes there was no enhancement of the dye peak (Figure 4-13).
There was a linear increase in the dye peaks of the absorption at approximately 400 nm
and 625 nm, which corresponds to the increase in concentration. There was a familiar
decrease in the nanoparticle peak which was a dilution effect. There were four
isosbestic points on the UV spectra (372 nm, 422 nm, 612nm, 655 nm), which
correspond to the wavelength at which the dye and the gold nanoparticle had the same
extinction coefficients. The isosbestic points occur because the nanoparticle solution

Chapter 4 Charge Stabilised Gold Nanoparticles and Photosensitisers
100
and the dye solution absorb light of that specific wavelength to the same extent
regardless of the relative concentrations. There was no electronic communication
between the dye and nanoparticle, hence isosbestic points were observed in the UV
spectra. If there was electronic communication between the dye and nanoparticle, there
would be an enhanced or shifted absorption (due to nanoparticle aggregation), and
therefore no isosbestic would points appear.
As mentioned in Chapter 1, rose bengal is a red acidic anionic dye which has also been
investigated as a LAA agent82 and was titrated against gold nanoparticle solution in this
investigation.
Figure 4-14 UV-visible absorption spectra of rose bengal (RB) in a gold nanoparticle solution. The
total rose bengal concentration of 5.556 µM (yellow line) was obtained by the addition of 2 mL of rose
bengal (50 µM) to 16 mL of gold nanoparticle solution. The structure of rose bengal is displayed at the
top right of the figure. The three isosbestic points are indicated with the black arrows.
The dilution effect of the gold nanoparticle solution was not observed in the rose bengal
titration (Figure 4-14) as the gold nanoparticle surface plasmon absorption peak is
overlapped by the rose bengal absorption peak. Again there was no enhancement of the
maximum absorption of the rose bengal which would then be followed by a gradual
decrease. There was an increase in the maximum absorption peak of the rose bengal
0
0.5
1
1.5
2
2.5
3
3.5
200 300 400 500 600 700 800 900
Wavelength (nm)
Ab
sorp
tio
n (
A.
U.)
RB (50 µM)
Au
Au + RB (5.556 µM)
Au + RB (10.00 µM)
Au + RB (13.64 µM)
Au + RB (16.67 µM)
Au + RB (19.23 µM)
O
Cl
Cl
Cl
Cl
O
ONa
I
II
O
Na
I
O

Chapter 4 Charge Stabilised Gold Nanoparticles and Photosensitisers
101
which corresponds to the increase in concentration of rose bengal. There were three
isosbestic points on the UV-visible absorption spectrum (270 nm, 497 nm, 574 nm)
where the extinction coefficients of the dye and gold nanoparticle solution were equal.
Rhodamine B is an amphoteric dye which is either acidic or basic depending on the pH
of the medium, which defines the overall charge on the molecule. In the slightly acidic
medium of the gold nanoparticle solution it is assumed that the dye is in its anionic
form.
Figure 4-15 UV-visible absorption spectra of rhodamine B (Rho B) in a gold nanoparticle solution.
The total rhodamine B concentration of 5.556 µM (yellow line) was obtained by the addition of 2 mL of
rhodamine B (50 µM) to 16 mL of gold nanoparticle solution. The structure of structure of rhodamine
B is displayed at the top right of the figure. The three isosbestic points are indicated with the arrows.
There was no enhancement of the maximum absorption of the dye rhodamine B (Figure
4-15). Additionally, the nanoparticle surface plasmon resonance absorption peak falls
below the dye peak so the dilution effect of the maximum absorption in the nanoparticle
peak was not observed. However, the increase maximum absorption of the rhodamine
dye peak which corresponds to the increase in concentration was observed. There were
three isosbestic points on the UV-visible absorption spectra (310 nm, 487 nm, 594 nm)
where the extinction coefficients of the dye and gold nanoparticle solution were equal.
0
0.5
1
1.5
2
2.5
3
200 300 400 500 600 700 800
Wavelength (nm)
Ab
sorp
tio
n (
A. U
.)
Rho B (50 µM)
Au
Au + Rho B (5.556 µM)
Au + Rho B (10.00 µM)
Au + Rho B (13.64 µM)
Au + Rho B (16.67 µM)
Au + Rho B (19.23 µM)
O
N
HO
O
N
Cl-

Chapter 4 Charge Stabilised Gold Nanoparticles and Photosensitisers
102
Lethal Photosensitisation of Bacteria Experiments:
As previously discussed (chapters 2 & 3), it has long been known that microbes can be
killed by white light in the presence of a photosensitiser such as toluidine blue
(TBO).148 The results from this work have demonstrated that the efficacy of lethal
photosensitisation of bacteria can be enhanced by the addition of gold nanoparticles.
The gold nanoparticles used in these experiments were synthesised by the same method
as those used in the titration experiments, and had a diameter of 21.4 nm (Figure 4-12).
There was an enhancement of lethal photosensitisation of S. aureus when the TBO was
used in conjunction with gold nanoparticle solution. This enhancement was
concentration dependant (Figure 4-16). Some enhancement was observed at 1 µM
whereas; significant enhancement was evident using higher TBO concentrations of 5,
10 and 20 µM. Enhancement was greatest using 10 and 20 µM TBO (Figure 4-17).
Enhancement appeared to be dependent on the ratio of TBO to nanoparticles. The
optimum final concentration of toluidine blue for the lethal photosensitisation of
bacteria was found to be 20 µM as higher concentrations appeared to give less effective
kills (Figure 4-17).
Figure 4-16 Lethal photosensitisation of S. aureus by TBO (1 µM, 5 µ, 10 µM and 20 µM) in the
absence (green, G-) and presence (pink, G+) of gold nanoparticles.

Chapter 4 Charge Stabilised Gold Nanoparticles and Photosensitisers
103
Figure 4-17 Lethal photosensitisation of S. aureus by TBO (10 µM, 20 µM, 50 µM and 100 µM) in the
absence (green, G-) and presence (pink, G+) of gold nanoparticles.
The UV-visible absorption spectra at a final toluidine blue concentration of 20 µM, with
water and gold nanoparticle solution is shown in Figure 4-18. An enhanced absorption
is observed for the toluidine blue in the presence of gold nanoparticles. Additionally, an
aggregation shoulder at approximately 700 nm is also observed.
Figure 4-18 UV-visible absorption spectra of toluidine blue (TBO) (20 µM), TBO (20 µM) + gold
nanoparticle solution and only gold nanoparticle solution. An enhanced absorption is observed for the
TBO when gold nanoparticles and TBO are mixed.
0
0.2
0.4
0.6
0.8
1
1.2
1.4
1.6
270 370 470 570 670 770 870 970
Wavelength (nm)
Ab
sorp
tion
(A
. U
.)
TBO (20 µM)
Au + TBO (20 µM)
Au

Chapter 4 Charge Stabilised Gold Nanoparticles and Photosensitisers
104
A series of experiments were conducted to measure the quantity of singlet oxygen
produced from the toluidine blue at different concentrations when mixed with gold
nanoparticles, an example of which is shown (Figure 4-19). All of the experiments
were conducted at the same gold nanoparticle concentration and size but at different
toluidine blue concentrations and are summarised in Figure 4-20. These experiments
were conducted by measuring the emission associated with the singlet oxygen to triplet
oxygen conversion at 1260 nm. The amount of singlet oxygen was determined by
measuring the area of the singlet oxygen fluorescence peak which is proportional to the
singlet to triplet oxygen conversion. The data showed that the amount of singlet oxygen
produced was directly linked to the TBO concentration.
Figure 4-19 Emission against time plot at 1260 nm after photoirradiation (532 nm) of a sample of gold
nanoparticles and TBO (4.7 µM). The plot shows the fluorescence emitted by singlet-triplet oxygen
conversion, the area under the curve is proportional to the amount of singlet oxygen generated.
Data were collected at various toluidine blue concentrations ranging from 2.5 µM to
12.5 µM, whilst keeping the gold nanoparticle concentration constant (Figure 4-20).
Obvious trends can be extracted form the data; increasing the concentration of toluidine
blue increases the amount of singlet oxygen produced and addition of gold nanoparticle
solution significantly decreases the amount of singlet oxygen produced, which is almost
proportional at each concentration.
y = 2213.6e-14110x
0
500
1000
1500
2000
2500
0.00E+00 2.00E-05 4.00E-05 6.00E-05 8.00E-05 1.00E-04 1.20E-04 1.40E-04 1.60E-04 1.80E-04 2.00E-04
Time (sec)
Inte
nsi
ty (
A.
U)
IntensityExpon. (Intensity)

Chapter 4 Charge Stabilised Gold Nanoparticles and Photosensitisers
105
Figure 4-20 Relative amounts of singlet oxygen produced for TBO and TBO + gold nanoparticle
solutions at different TBO concentrations. The concentration of singlet oxygen produced is dependant
on the concentration of toluidine blue present.
Toluidine blue has fluorescence at approximately 670 nm (Figure 4-21). This
fluorescence is quenched in the presence of the gold nanoparticles. The peaks observed
at 600 nm are a harmonic of the excitation source of the excitation light inputted.
Figure 4-21 Fluorescence spectra of toluidine blue (TBO) (5.5 µM) and TBO-Au nanoparticle
mixture, where the final concentration of toluidine blue is 5.5 µM. The fluorescence of TBO is
quenched in the presence of gold nanoparticles.
0
0.1
0.2
0.3
0.4
0.5
0.6
0.7
0 2 4 6 8 10 12 14
Concentration µM
Sin
gle
t o
xyg
en
pro
du
ced
TBOAu + TBOLinear (TBO)
Linear (Au + TBO)
0
200
400
600
800
1000
1200
575 625 675 725 775 825
Wavelength (nm)
Em
issi
on
(A
. U
.)
TBO
TBO + Au

Chapter 4 Charge Stabilised Gold Nanoparticles and Photosensitisers
106
The gold nanoparticles used in all of the studies were synthesised using a modified
Turkevich citrate reduction.142 The sample synthesised NN1.2, displayed the enhanced
kill of bacteria. However, many of the samples subsequently synthesised did not
enhance the lethal photosensitisation of bacteria. Therefore, it was concluded that there
were more factors affecting the synthesis reaction than first observed.
Figure 4-22 Transmission electron microscopy images of citrate stabilised gold nanoparticles (Sample
NN1.2) at various magnifications.
Different sized nanoparticles were tested at the Eastman Dental Institute for enhanced
lethal photosensitisation of bacteria. These were synthesised by the Turkevich method
as modified by Fren.18 The final average size of these nanoparticle solutions were 16

Chapter 4 Charge Stabilised Gold Nanoparticles and Photosensitisers
107
nm, 25 nm, 40 nm, 70 nm, 100 nm and 150 nm (from Ferns analysis18). Again none of
these showed any enhancement in the lethal photosensitisation of bacteria.
Sample NN1.2 had an average diameter of 18 nm ± 3.5 (Figure 4-22). This sample
enhanced the kill of bacteria and many attempts were made to reproduce this sample.
Although in each case nanoparticles were produced, none enhanced the lethal
photosensitisation of bacteria. Also none of these samples fit the UV-visible absorption
profile of NN1.2, or had the same pH. Attempts were made to regulate the reaction to
determine where the inconsistency was being introduced (same beakers, syringes,
needles, heating time etc). It was discovered that the rate of addition of the reducing
agent, was an important factor in determining the final size of nanoparticle. Whereas
the amount of citrate added varies the size between 16-150 nm (Fren18), the rate of
addition can vary the range between 15-25 nm (Table 4-3).
Sample
Time Taken For 20 ml of Water to Boil
Time Taken To Add Citrate
Time Left Boiling After Citrate is added λ(max)(nm)
NN1 120 sec 60 sec 60 sec 522 NN2 120 sec 120 sec 60 sec 524 NN3 120 sec 30 sec 60 sec 521 NN5 120 sec 50 sec 60 sec 522-523 NN6 120 sec 40 sec 60 sec 522
Table 4-3 The rates of addition of sodium citrate, to a solution of auric acid for the synthesis of gold
nanoparticles.
Increasing the rate of addition of the sodium citrate reductant, whilst synthesising gold
nanoparticle solutions, resulted in a decrease in the wavelength of maximum absorbance
of the surface plasmon resonance (Table 4-3). Therefore, by adding the reducing agent
at a faster rate smaller nanoparticles were obtained. The synthetic protocol was adjusted
so that the particle size could be closely monitored and further gold nanoparticle
solutions which had similar UV-visible absorption profiles to NN1.2 were synthesised
for testing for photodynamic action at the Eastman Dental Institute (Figure 4-23).

Chapter 4 Charge Stabilised Gold Nanoparticles and Photosensitisers
108
Figure 4-23 UV-visible absorption spectra of samples that have been found to enhance the kill of
bacteria (NN 1.2, NN 06.03.06) and samples that were predicted to enhance the kill of bacteria (NN5
04. 05.06, NN 15.05.06)
Figure 4-24 Viable counts of S. aureus, when 20 µM toluidine blue and sample NN06.03.06 are
present. When the sample NN06.03.06 is diluted (1 in 10), toluidine blue added then irradiated with
white light for 30 secs there is a statistically significant enhance of kill of bacteria of approximately 2
log10.

Chapter 4 Charge Stabilised Gold Nanoparticles and Photosensitisers
109
It was found that sample NN(06.03.06) also promoted the lethal photosensitisation of
bacteria (Figure 4-24). However, this sample had to be diluted so that the UV-visible
absorption profile matched sample NN1.2 more accurately, which indicates a critical
ratio between the photosensitiser and gold nanoparticles is needed for effective lethal
photosensitisation of bacteria.
Sample λ(max)(nm) NN1.2 522 NN06.03.06 527 NN5 04.05.06 523 NN15.05.06 526
Table 4-4 Maximum absorbance wavelengths in UV-visible absorption spectra of samples which
enhance the kill of bacteria (NN 1.2, NN 06.03.06) and samples that were predicted to enhance the kill
of bacteria (NN5 04. 05.06, NN 15.05.06)
Samples NN5 04.05.06 and NN15.05.06 had a maximum wavelength absorption fall in-
between the two samples NN1.2 and NN06.03.06 which were known to enhance the kill
of bacteria (Table 4-1).
4.4 Discussion
The optical response of gold metallic colloids arises from the ease at which
electromagnetic fields excite electrons at the surface of particles. This photo-excitation
induces charge density oscillations, a collective movement of electrons, the surface
plasmon, gives rise to the intense colour of the solution, and absorption at around 530
nm.
The electronic excitation leads to electronic field redistribution near the metal surface.
Therefore molecules which are in the vicinity of this surface experience an intense
electric field, which may give rise to the enhancement in the maximum absorption of
some dyes in the visible region. Dyes absorb light in the visible region and have a
characteristic spectrum. This spectrum changes when a dye is adsorbed onto the surface
Chapter 4 Charge Stabilised Gold Nanoparticles and Photosensitisers
110
of gold nanoparticles. This is indicative of electronic communication between the dye
and the gold nanoparticle surface.
Increasing the dye concentration increases the maximum absorption, as defined by the
Beer Lambert law: A = C × l × e. Where the path length (l) and extinction coefficient
(e) are constant and the absorption (A) is proportional to the concentration (C).
All of the thiazine dyes have a similar structure (Figure 4-3) and hence, displayed
comparable enhancement after the dye is added to a gold nanoparticle solution (Figure
4-4, Figure 4-5, Figure 4-7, Figure 4-8, Figure 4-9, Figure 4-10). There was a gradual
decrease in maximum nanoparticle absorption, where as the dye peak reached a
maximum and then decreased. This indicates that large loadings of dye molecules on
gold nanoparticles have detrimental effects on the maximum absorption. It is possible
that the surface of the gold nanoparticle may be covered by the maximum number of
dye molecules possible, and the additional dye molecules may not be affected by the
charge on the nanoparticles. As the inter chromophore distance decreased flocculation
of the nanoparticles occurred. After the methylene blue titration experiment was
completed and left to stand for a week, a black solid was observed. However trying to
isolate such a small mass of solid was extremely difficult. EDAX was performed on
some that were isolated but the results were inconclusive.
The enhanced maximum observed in the UV-visible absorption spectra of thiazine dyes
also resembles that of particle aggregation which was reported by Turkevich in the 700
nm region.149 Therefore a control titration experiment was carried out. This involved
the same titration experiment with a gold nanoparticle solution and addition of a
methylene blue solution. The added component of this titration was KCl which induced
aggregation. Adsorbed anionic citrate on the gold nanoparticle forms a layer of
electrostatic repulsion, which prevents the aggregation of the nanoparticles.
Electrolytes (solution of KCl) screen the repulsive electrostatic forces of the citrate layer
and induce aggregation. Aggregation was observed at around 710 nm and the
maximum enhancement in the methylene blue was observed at around 680 nm. This
indicates that although KCl induced aggregation on the gold nanoparticles, the dye still
exhibited an enhanced adsorption.

Chapter 4 Charge Stabilised Gold Nanoparticles and Photosensitisers
111
In the absence of KCl the point at which methylene blue induced aggregation of gold
nanoparticles was investigated using a zetasizer. For this system aggregation of gold
nanoparticles and an increase in particle size was not observed until the concentration of
methylene blue reached 2.1 µM. This concentration is higher than 0.79 µM which was
the concentration observed to give the maximum enhanced absorption. This adds to the
argument that dye molecules in close proximity to the gold nanoparticle surface
experience an intense electrical field and this has an antenna effect on the absorption of
these dyes.150
Generally, the UV-visible absorption spectrum of the thiazine dyes when titrated against
gold nanoparticle solutions, showed an enhancement of the absorption of the dye, at the
wavelength of the normal dye maxima. There was a gradual decrease in maximum
surface plasmon resonance absorption of the nanoparticle peak, which was attributed to
the continuing increase in total volume to the reaction mixture hence decrease in
relative concentration. The absorption peak for the thiazine dyes generally increases
until a critical concentration is reached. This critical concentration gives the maximum
enhancement. Once reached, the maximum absorption then gradually declined,
indicating that large loadings of dye molecules on gold nanoparticles have detrimental
effects on maximum absorption. The surface of the nanoparticle may be covered by the
maximum number of dye molecules possible and therefore, the additional dye
molecules would not be affected by the charge on the nanoparticles. As the inter-
chromophore distance decreases flocculation of the gold nanoparticles occurs.
The enhancement in UV-visible absorption spectra was not observed for acidic, anionic
dyes. This implied that a basic, cationic dye which was able to adsorb onto the surface
of gold nanoparticles was required for enhancement of the absorption properties of the
dye. Acidic, anionic dyes display isosbestic points, which suggest that there is no
communication between the dye and nanoparticle. The anionic dyes investigated were
tin chlorin e6, rose bengal and rhodamine B.
Rhodamine 6C has a similar structure to rhodamine B and is another zwitter ion.
Rhodamine 6G has a strong absorption in the visible and a high fluorescence yield, and

Chapter 4 Charge Stabilised Gold Nanoparticles and Photosensitisers
112
its well characterised properties has allowed the dye to be used as a probe for
aggregation effects on surfaces.151 Hu et al.152 studied the aggregation effects of
rhodamine 6G on the surface of gold nanoparticles. The 2-3 nm gold nanoparticles used
for their experiments were synthesised using SCN– as the reductant. The pH of the final
gold sol was increased by the addition of K2CO3. Therefore, when rhodamine 6G was
added it was in the cationic form and could adsorb onto the surface of the gold
nanoparticle. Their similar titration experiment involved keeping the concentration of
rhodamine G constant followed by addition of gold nanoparticle solution. The study
found the disappearance of the sharp absorption band in the visible region at 525 nm
and the appearance of two new bands at 507 and 537 nm. They have attributed this to
the close packing of the cationic dye molecules around the surface.
Figure 4-25 Types of aggregates formed by dyes in solution
There are a number ways that dye molecules could aggregate on the surface (Figure
4-25). Hu et al152 have suggested that the dye form herringbone type aggregates. This
would account for the appearance of the two new absorption bands at 507 and 537 nm.
Herringbone aggregates have two associated absorption bands corresponding to the two
different transitions that are polarised along perpendicular directions.114 However
aggregates of 2 nm gold nanoparticles could account for the absorption band at 537 nm
as they would be large enough to exhibit a surface plasmon. The absorption band at 507
nm would be associated with H–aggregates of the dye rhodamine 6G. H–aggregates
consist of a parallel arrangement of dye molecules to form a vertical stack and
correspond to a blue shift in the absorption band,114 which is consistent with their study.
The other type of dye aggregates that could form are J–aggregates which have a head to
tail arrangement of dye molecules and are associated with a red shift.114 The slight shift
H–Aggregates J–Aggregates Herringbone–Aggregates

Chapter 4 Charge Stabilised Gold Nanoparticles and Photosensitisers
113
in the absorption bands of the dyes, in the titration experiments discussed in this chapter
are possibly a result of dye aggregates on the surface of gold nanoparticles.
Toluidine blue is a positively charged molecule with a chloride counter ion. Therefore
it would be electrostatically attracted to the gold nanoparticle surface which is
negatively charged. The toluidine blue could co-ordinate to the surface of the gold
nanoparticle through the sulphur atom of the dye as it is extremely aurophillic. Also, in
aqueous solution the toluidine blue molecules are likely to form a shell around the gold
nanoparticles.
The maximum enhancement in bacterial kill was observed at a toluidine blue
concentration of 20 µM. The UV-visible absorption spectra of TBO (20 µM), the gold
nanoparticles and a mixture of both are displayed in Figure 4-18. The gold nanoparticles
displayed a plasmon resonance peak at approximately 530 nm. A significant
enhancement of approximately 240% in the maximum absorption of toluidine blue at
620 nm was observed in the presence gold nanoparticles. The additional shoulder at
approximately 710 nm was due to the aggregation of the gold nanoparticles. As
previously reported in this chapter this was studied using a zetasizer, this showed that
the main size of the gold nanoparticles was 20 nm and that this increased to
approximately 100 nm at higher TBO concentrations due to aggregation.
Addition of toluidine blue to a gold nanoparticle solution, so that the final concentration
of TBO is 20 µM in the reaction mixture, results in an enhanced UV-visible absorption
profile analogous to the results previously reported. Additionally, the disappearance of
the plasmon resonance peak but a broadening of the absorbance peak of the resulting
mixture compared with that of the TBO alone was displayed (Figure 4-18).
Photosensitisers have been covalently linked to gold nanoparticles to increase their
efficacy.99 Wieder et al. 99 have shown that covalently linking phthalocyanine to gold
nanoparticles results in the enhanced killing of human cells when irradiated. The results
presented here demonstrate that light activated antimicrobial activity of toluidine blue
can be enhanced by gold nanoparticles even when they are not covalently linked. The
presence of gold nanoparticles resulted in a 2 log10 increase in the number of colony

Chapter 4 Charge Stabilised Gold Nanoparticles and Photosensitisers
114
forming units (CFU) killed, following short periods of irradiation (10 min) with a
domestic light source. It has been suggested that irradiating gold nanoparticles
covalently linked to phthalocyanine, induces an energy transfer between phthalocyanine
and gold, which leads to an enhanced singlet oxygen production and enhanced kill of
human cells.99 This was attributed to increased triplet energy transfer from the
phthalocyanine–gold conjugate to molecular oxygen.153 It was concluded that the
photosensitisation efficacy of the conjugate was dependant on the presence of
monomeric phthalocyanine on the nanoparticle surface. The results presented in this
chapter suggest that covalent linkage of the photosensitiser is not essential to achieve
enhanced photodynamic action.
Nanoparticles can act as acceptor (quencher) or donor units.154 Gold nanoparticles can
act as efficient quenchers of fluorophores, and is the basis by which DNA sensing using
gold nanoparticles operates.55 It has been suggested that quenching of the fluorophore
by the gold surface results from both non-radiative energy transfer from the dye to the
metal and from the collision of the dye against the gold surface (dynamic quenching).155
It was found in this study that the weak fluorescence of toluidine blue at 670 nm is
quenched in the presence of gold nanoparticles (Figure 4-21)
The fluorescence of the dye ‘nile red’ has been investigated in experiments by Chen et
al.156 Nile red was adsorbed onto the surface of gold nanoparticles, and was used in the
detection of thiols. Nile red is a hydrophobic, highly fluorescent dye that undergoes
intensity or wavelength shifts upon changes in the polarity of its environment.157 Chen
et al.156 found the fluorescence of nile red to be weak when adsorbed onto the surface of
gold nanoparticles. When the adsorbed nile red was displaced in the presence of thiols
the fluorescence of the nile red was restored. Interestingly when the desorbed nile red
was examined, it was found to have changed structure suggesting a chemical reaction at
the surface of the gold nanoparticle. Chen et al.156 attributed the quenched fluorescence
to Förster resonance energy transfer (FRET) where a donor chromophore (nile red), in
its excited state transfers its energy by a non-radiative, long-range dipole-dipole
coupling mechanism to an acceptor (gold nanoparticle) in close proximity (typically
<10 nm). The results from their study correlate with the fluorescence experiments
presented in this chapter.

Chapter 4 Charge Stabilised Gold Nanoparticles and Photosensitisers
115
The fluorescence experiments, UV-visible absorption and singlet oxygen experiments
were performed in order to try and determine the mechanism by which the enhanced
lethal photosensitisation of bacteria is observed. The results are summarised below;
• In the presence of gold nanoparticles there is a marked increase in the extinction
coefficient at 631 nm of toluidine blue.
• At a 20 µM concentration of toluidine blue, where the maximum bacterial kill
was observed this enhancement of the extinction coefficient was still present.
• There is a significant decrease in the amount of singlet oxygen produced by the
toluidine blue when mixed with gold nanoparticles.
• The presence of gold nanoparticles quenches the weak fluorescence of toluidine
blue at 670 nm
• Aggregation of nanoparticles is induced at high loadings of dye molecules.
There was an abrupt increase in the extinction coefficient of toluidine blue in the
presence of gold nanoparticles. This was attributed to the adsorption of the toluidine
blue molecules onto the surface of the gold nanoparticle through the sulphur atom on
the TBO. This altered the profile of the UV-visible absorption spectra. This was
characteristic of all thiazine dyes when mixed with gold nanoparticles. Although the
mixing of gold nanoparticles with the dye significantly increases the extinction
coefficient of the dye, it did not lead to more singlet oxygen being produced. In fact,
the opposite effect was observed and significantly less singlet oxygen was formed.
Furthermore, the fluorescence of the TBO was completely quenched in the presence of
gold nanoparticles. This implied other radical species such as hydroxyls and
superoxides may have been produced when gold nanoparticles were mixed with
toluidine blue. These hydroxyl radicals and super oxide species are toxic to bacteria;
hence mixtures of gold nanoparticles with toluidine blue exhibit enhanced kill of
bacteria.
Considering all the data from these studies, it can be argued that the presence of gold
nanoparticles on TBO can harvest more incident light per molecule. This produces an
excited state of the dye. The excited state decays through a non-radiative process- as no

Chapter 4 Charge Stabilised Gold Nanoparticles and Photosensitisers
116
dye-fluorescence is observed. However the non-radiative process is not dominated by
formation of singlet oxygen, which is significantly depressed in the presence of the gold
nanoparticles. In the presence of gold nanoparticles, TBO relaxes to the ground state by
a non-radiative decay and this process is primarily through formation of other reactive
oxygen species- such as hydroxyl radicals. It is the formation of these reactive species
that are responsible for the increased bacterial kills observed. Hence, the gold
nanoparticles have two roles- firstly they enhance the light capture of the dye, by having
absorbed dye on the surface of the particles, and secondly they help direct the decay
pathway for the dye encouraging a non-radiative process through formation of excess
bactericidal radical species.
Chow and Zukoski43 reported that the wavelength of maximum absorbance of a gold
nanoparticle solution can be related to the diameter of the colloidal gold particle. A
longer wavelength corresponds to a larger particle. Fren18 described the particle size
obtained as a function of the number of nuclei over which the available gold is divided
and is not a result of a reduction of a different percentage of the available gold. This is
valid when examining particle size over a wide range. The colloid solution produced by
the citrate reduction of hydrogen tetrachloroaurate is dependant on the statistical
fluctuations in the nucleation process. Repeated attempts failed to produce
nanoparticles with identical UV-visible absorption profiles and pH. However a
correlation was observed between the rate of addition of sodium citrate and the diameter
of diameter of nanoparticles produced. Faster rates of addition favoured smaller
particles. The results obtained were in agreement with Sariva et al.158 The addition of
citrate at a higher flow rate results in a higher concentration of nuclei being produced
near the start of the reaction and that the growth period begins once all of the citrate is
added. In general, when there is a slower rate of addition larger particles are produced
and there is an increase in maximum wavelength absorption.
Summary of results:
Synthesis of gold nanoparticles was investigated using a modified Turkevich citrate
reduction.142 By varying the citrate rate of addition different sized nanoparticles were

Chapter 4 Charge Stabilised Gold Nanoparticles and Photosensitisers
117
obtained. Fast addition of the citrate produced smaller nanoparticles in the range of 16
nm. Adding the citrate over 50 seconds yielded nanoparticles of approximately 20 nm.
The adsorption of dye molecules onto the surface of the nanoparticle was investigated.
The collective movement of electrons (surface plasmon) gives rise to the intense colour
of gold nanoparticles. This electronic redistribution near the surface of the gold
nanoparticle effects molecules in close proximity to the surface. An enhanced
absorption has been observed for the dyes in the thiazine group when the dye is titrated
against the nanoparticle solution.
Generally in the UV-visible absorption spectrum of the thiazine dyes, there is a gradual
decrease in maximum nanoparticle absorption, where as the dye peak reaches a
maximum. The decrease in the nanoparticle intensity in the UV-visible absorption
spectrum corresponds to the decrease in concentration. The absorption peak for the
thiazine dyes generally increase until a critical concentration is reached. This critical
concentration gives the maximum enhancement. The maximum absorption then
gradually declines, indicating that large loadings of dye molecules on gold nanoparticles
have detrimental effects on maximum absorption. The surface of the nanoparticle may
be covered by the maximum number of dye molecules possible and the additional dye
molecules may not be affected by the charge on the nanoparticles. As the inter
chromophore distance decreases it may cause flocculation of the nanoparticles.
An enhancement of approximately one log10 in the extinction coefficient was displayed
in the UV-visible absorption spectra for all of the thiazine dyes, in the presence of gold
nanoparticles (16 nm) at a dye concentration of approximately 3×10⁻⁶ M. There is an
average enhancement of an average of 0.65 absorption units in the maximum absorption
of the dye, which indicates a direct communication between the nanoparticle and the
dye.
The enhancement in extinction coefficient was not observed for acidic, anionic dyes.
Acidic, anionic dyes display isosbestic points, which suggest that there is no
communication between the dye and nanoparticle, and that they do not adsorb onto the

Chapter 4 Charge Stabilised Gold Nanoparticles and Photosensitisers
118
surface of gold nanoparticles. Flocculation is observed when KCl is added to the gold
nanoparticles and dyes. However an enhancement is still observed.
Gold nanoparticles which absorb wavelengths of light between 522 and 527 nm,
enhance the lethal photosensitisation of bacteria when used in conjunction with
methylene or toluidine blue. These nanoparticles were 18 nm in diameter. Although
there was an enhancement in the lethal photosensitisation of bacteria, increased amounts
of singlet oxygen were not detected. Additionally the fluorescence of the dye was
quenched in the presence of gold nanoparticles at 670 nm. This implies that the other
pathways such as the formation of hydroxyl radicals are important to enhance the lethal
photosensitisation of bacteria.
It is thought that in the presence of gold nanoparticles with TBO makes it relax to the
ground state by a non-radiative decay. This process is primarily through formation of
other reactive oxygen species- such as hydroxyl radicals. The formation of these
reactive species is responsible for the increased bacterial kills observed. The gold
nanoparticles enhance the light capture of the dye, by having absorbed dye on the
surface of the particles, and direct the decay pathway for the dye encouraging a non-
radiative process through formation of excess bactericidal radical species.
4.5 Conclusion
It was found that the mixing of gold nanoparticles with basic cationic dyes of the
thiazine family enhance the extinction coefficient of the dye. This was not observed for
the acidic anionic dyes investigated. The fluorescence of the thiazine dye toluidine blue
is quenched in the presence of gold nanoparticles. Additionally, the production of
singlet oxygen by toluidine blue decreases in the presence of gold nanoparticles. It was
discovered that the covalent attachment of a light activated antimicrobial such as
toluidine blue is not required for an enhancement in bacterial kill to be observed. It is
thought that the enhanced bacterial kill is a result of reactive oxygen species other than
singlet oxygen, such as hydroxyl radicals being produced.

Chapter 4 Charge Stabilised Gold Nanoparticles and Photosensitisers
119
In order to further investigate the relationship between nanoparticles and
photosensitisers the nature of the nanoparticle was changed from gold to semi-
conductor (CdSe) quantum dots. Similar experiments, involving the mixing of
photosensitisers with quantum dots were performed and will be discussed in the next
chapter.

Chapter 5 Quantum Dots and Toluidine Blue
120
Chapter 5 Quantum Dots and Toluidine Blue
The purpose of this study was to determine whether CdSe quantum dots (QD) could
enhance the antibacterial activity of the LAAA, Toluidine Blue (TBO). Suspensions of
Staphylococcus aureus (5.47 × 10⁷ cfu/ml) were exposed to white light and TBO in the
presence and absence of 25 nm diameter CdSe/ZnS quantum dots (which had an
emission maximum at 627 nm). When the ratio of TBO:quantum dots were 2667:1
(quantum dot concentration of 0.0075 µM), killing of S. aureus was enhanced by 1.72
log10 units. In the case of Strep. pyogenes an enhanced kill of 1.55 log10 units was
achieved using TBO and quantum dots in the ratio 267:1. It was determined from
fluorescence quenching and singlet oxygen measurements that the quantum dots
enhanced the ability of toluidine blue to increase the formation of singlet oxygen,
especially at high TBO:QD ratios. The process was shown mechanistically to operate
by a non-FRET mechanism, where the quantum dot converted part of the light source to
the absorption maximum for toluidine blue. If such enhanced killing can be achieved in
vivo, quantum dots may be useful in improving the efficacy of antimicrobial
photodynamic therapy.
5.1 Introduction
Quantum dots (QDs) are nanometer scale semiconductor crystals of types II–VI, III–V
or IV, dependant on the elements position in the periodic table.159 Cadmium selenide
quantum dots are from group II–VI have been well characterised160 and were the focus
of this study, hence are the quantum dots referred to in the rest of this chapter.
Semi-conductor quantum dots have physical dimensions smaller than the excitation
Bohr radius.161 When a photon of visible light hits a semiconductor quantum dot, static
electrons from the valence band become mobile and are excited into a higher
conduction band within a semiconductor matrix. As the electron becomes mobile it
leaves behind a hole. After a certain period of time, usually in nano seconds, the
electrons and holes recombine. In quantum dots this recombination causes the emission

Chapter 5 Quantum Dots and Toluidine Blue
121
of a photon at a frequency characteristic of the material. The amount of energy required
to induce the electrons to become mobile and produce the quantum dot emission is
called the bandgap energy.162 The band gap energy is related to the size, shape and
composition of the quantum dot. This dependence is due to the quantization of discrete
energy levels, as the quantum dots size is in the same order as the excitation Bohr
radius.163
Quantum dots have a number of attractive optical properties. For example,
monodispersed quantum dots have narrow size tuneable photoluminescence with full
width half maxima (FWHM) in the range of 25 – 40 nm.164 The absorption spectra of
quantum dots are broad, often ranging from the visible region towards and into the
ultraviolet. Like the photoluminescence emission, the absorption spectrum also scales
with the size of the quantum dot.164 The combination of broad absorption and narrow
symmetric emission has made quantum dots very attractive for multiplexing.
Multiplexing is where different sized quantum dots are excited with the same
wavelength of light to produce emission of different wavelengths, and thus yielding
different colours.165
The size dependant photoluminescence colours of quantum dots are distributed through
out the visible region of the electromagnetic spectrum (Figure 5-1). As the size of the
particle decreases the bandgap increases, and the photoluminescence has a blue shift.
The size dependant photoluminescence colour has been exploited in various
applications including lasers, light emitting diodes and imaging.161
The quantum dots used for the experiments in this chapter have a coating of ZnS. This
acts as a physical barrier, whereby the often more soluble CdSe cannot come in contact
with the surrounding medium and dissolve through ionisation. The ZnS shell has larger
bandgap energy than CdSe, eliminating the cores defects states and passivates the
surfaces non radiative recombination sites.159 This results in an increased quantum
yield. Also, the Zn-S bond lengths are similar to Cd-Se bond lengths, minimising
crystal lattice strain and facilitating Zn-S epitaxial growth.162

Chapter 5 Quantum Dots and Toluidine Blue
122
Figure 5-1 (a) Size-dependent photoluminescence colour and (b) schematic presentation of size,
colour, and photoluminescence wavelength of CdSe–ZnS QDs. (c) Absorption (solid lines) and
photoluminescence (broken lines) spectra of CdSe QDs with various sizes taken from reference 161
.
Although the quantum dots used in this study were bought from Evident Technologies,
they can be synthesised by the following procedure. Dimethylcadmium and selenium
are initially dissolved in the organic solvent tri-n-octylphosphine at defined ratios
(usually a molar ratio of 1.4:1.0) and injected into a hot (350 °C) co-ordinating solvent
of tri-n-octylphosphine oxide (TOPO) under argon gas. A decrease in temperature and
change in colour of the solution from colourless to light yellow to orange to red,
indicates the nucleation and growth of the quantum dots. The growth of the quantum
dots is dependant on Ostwald ripening and a reduction of the temperature can lead to
smaller particles being obtained. To produce a capping layer of ZnS a solution of
dimethylzinc and hexamethydisilathiane in tri-n-octylphosphine can be slowly dripped
into the reaction vessel after isolating or obtaining CdSe quantum dots of the desired
size.162 The quantum dots bought from Evident Technologies also had a surface coating
of polyethylene glycol to aid solubilisation in water. A table summarising the various
synthesis methods, capping materials and biofunctionalisation has been presented by Iga
et al.159
Quantum dots have been used in a variety of applications including; gene technology,
fluorescent labelling, cell tracking, pathogen and toxin detection, in vivo animal imaging

Chapter 5 Quantum Dots and Toluidine Blue
123
and Förster resonance energy transfer analysis (FRET).165,166 FRET occurs when the
electronic excitation of a fluorophore, such as a quantum dot, is transferred to a nearby
acceptor molecule (dye) without exchanging light (non-radiative), which may relax to
its ground state by the emission of a photon. The process results from dipole – dipole
interactions, and is dependant on the separation distance between donor and acceptor.
FRET operates efficiently over donor-acceptor distances ranging from 1 to 10 nm.167
The transfer efficiency increases with increasing spectral overlap between the donor
emission and acceptor absorption. FRET leads to the reduction of the donor’s emission
and excited state lifetimes and an increase in the acceptor’s emission intensities.165
FRET is suited to measuring differences in distance making it appropriate for detecting
conformational change of ligand bound assays.168
Quantum dots are extremely attractive for FRET analysis assays because conventional
fluorescence assays have problems associated with cross-talk. Cross-talk occurs when
there is direct excitation of the acceptor and there is spectral overlap between the donor
and acceptor emissions which produces background emission, limiting the systems
sensitivity.168 As quantum dots have a broad absorption spectrum an appropriate
excitation wavelength can be chosen so that absorption by the acceptor is not possible.
Quantum dots have a narrow symmetric emission which allows for easy recognition
from acceptor emission profiles.166 Conventional fluorescence assays which measure
fluorescence of bound dye require the separation from free dye before extent of binding
can be measured. FRET simplifies these assays as binding can be measured directly.
One drawback to quantum dot labelling is the difficulty in producing stable quantum dot
biomolecule complexes in which, the number and orientation of the dyes and
biomolecules on the surface of the quantum dots is well characterised, and the synthesis
reproducible.168 For the experiments discussed in this chapter the quantum dots were
used in conjunction with a light activated antimicrobial (toluidine blue) to enhance the
lethal photosensitisation of bacteria by photodynamic action through a non-FRET
mechanism.
As detailed in previous chapters, photodynamic therapy is a local, repeatable and non-
invasive technique that has the potential to be an effective alternative to antibiotic
therapy in the treatment of local infections.74,169 Photodynamic action involves the

Chapter 5 Quantum Dots and Toluidine Blue
124
killing of target microbes via the formation of oxygen-derived cytotoxic species
produced by the interaction of a photosensitising compound with light of an appropriate
wavelength.84,170 Targeting of the infecting microbes can be achieved by chemical
modification of the photosensitiser and/or by choosing appropriate light energy doses
that do not damage host cells.171,172 The production of reactive oxygen species at the
microbial target results in rapid oxidative damage and cell death via a range of
mechanisms, depending on the nature of the target which include; the bacterial cell
wall/membrane, viral nucleic acids, and enzymes.173 A wide variety of photosensitisers
are available and toluidine blue (TBO) has been used successfully by a number of
investigators as an effective photosensitiser of antibiotic-resistant microbes.174,175
Samia et al.176 used quantum dots and covalently attached a phathalocyanine dye (Pc4)
through an alkyl amino group on the photosensitisers’ axial substituent. They found
that Pc4 has an absorption that spans wavelengths ca. 550 and 630 nm. However
quantum dots were needed as a primary donor between the wavelengths of 400 and 500
nm. Conjugation of the photosensitiser to the quantum dot resulted in the indirect
excitation of Pc4 using 488 nm light (at which Pc4 does not absorb). They attributed
this to a FRET type mechanism from the quantum dot to Pc4 as the emission of this dye
was observed at 680 nm. This combination of photosensitiser and quantum dot allows
the use of an excitation wavelength where the photosensitiser alone does not absorb.
The emission spectral properties of the quantum dots can be adjusted to match the
absorption profile of any dye by modifying the size of the quantum dots. Interestingly,
in the study of Samia et al.8 the photosensitising ability of the quantum dots in the
absence of a photosensitiser was discovered, through the detection of singlet oxygen.
Although the amount of singlet oxygen produced was very low ( ca. 5%) in comparison
to the photosensitiser (43%), it was still a significant result.176 However, their
experiments were conducted in toluene which would not be suited to biological systems.
Additionally there have been some issues concerning the toxicity of certain quantum
dots through the leaching of cadmium ions.177
Quantum dots are highly selective energy donors as clearly demonstrated by several
groups.167,168,178-180 Due to the ability of quantum dots to harvest light over a broad
range of wavelengths and emit this at a wavelength absorbed by TBO, the antimicrobial

Chapter 5 Quantum Dots and Toluidine Blue
125
effectiveness of TBO should increase when white light was used as the irradiating
source. To test this hypothesis a series of fluorescence absorption and singlet oxygen
experiments were conducted.
The experiments in this chapter were concerned with improving the effectiveness of
TBO in the lethal photosensitisation of bacteria using quantum dots. It was found that
quantum dots enhance the effectiveness of TBO. An investigation using UV-visible
absorption, and fluorescence spectroscopy along with singlet oxygen measurements
were carried out in order to uncover information on the mechanism by which this
occurs.
5.2 Experimental
Target organisms: Staphylococcus aureus NCTC 6571 and Streptococcus pyogenes
NCTC 12202. Staph. aureus was maintained by weekly transfer on nutrient agar while
Strep. pyogenes was sub-cultured on blood agar
Light source: The light source used was for the microbiology experiments was a
General electric 28-watts Biax 2D compact fluorescent lamp that emits light across the
visible spectrum. Prominent peaks were present at 435, 495, 545, 588 and 610 nm
(Figure 1). The lamp was fitted into a refrigerated incubator (LTE scientific ltd.,
Oldham, U.K) that maintained the temperature at a constant 22°C. The light intensity at
the surface of the microtitre plates was measured using a digital luxmeter (Hagner
photometric instruments limited; Bosham, U.K) and was found to be 3,600 lux.
Photosensitiser: The photosensitiser used in this study was toluidine blue O (C.I.
52040; Sigma-Aldrich Ltd, Poole, UK). The required concentration of the dye was
prepared by dissolving measured dye powder in sterilised distilled water and diluted
further to a required final concentration. The final concentration of TBO used in this
study was 20 µM.

Chapter 5 Quantum Dots and Toluidine Blue
126
Quantum dots: The quantum dots used were 25 nm diameter CdSe/ZnS nanoparticles
with a polyethylene glycol surface coating (T2-MP Maple Red-Orange EviTags;
Evident Technologies, New York, USA). These exhibited high absorbance below 550
nm and had an emission maximum at 627 nm.
Lethal photosensitisation of bacteria: Staph. aureus was grown in nutrient broth
overnight in a shaking incubator at 37 °C while Strep. pyogenes was grown overnight at
37 °C in air supplemented with 5% CO2. The cells were then harvested by
centrifugation and re-suspended in an equal volume of phosphate buffered saline (PBS)
and then diluted to an optical density of 0.05 at 600 nm, which was approximately equal
to 106 colony-forming units (cfu)/mL. In all experimental setups, the light source was
fitted vertically into a refrigerated incubator at a distance of 41 cm to the 96-well flat
bottom microtitre plate containing the bacterial suspensions.
A range of different concentrations of quantum dots were prepared in sterile distilled
water. To each test well, 20 µL of bacterial suspension, 10 µL of 80 µM TBO and 10
µL of suspension of quantum dots were added. The final concentration of TBO in each
well was 20 µM, and the concentration of the quantum dots ranged from 0.75 to 0.0075
µM. The ratio of TBO:quantum dots, therefore, ranged from 27:1 to 2667:1. Half of the
wells (2 for each concentration of quantum dots) were exposed to white light for 5 or 10
minutes. Suspensions treated this way were designated L+T+Q+. The remaining wells
were not exposed to light to determine the dark toxicity (L-T+Q+). Additional control
wells were also prepared without the quantum dots and treated in the same way
(L+T+Q-, L-T+Q-). Bacterial suspensions with quantum dots but without TBO were
also prepared and treated in the same way (L+T-Q+). To determine the effect of white
light alone, a further 4 wells were prepared and either exposed to white light (L+T-Q-)
or kept in the dark (L-T-Q-). The number of viable bacteria in each well was
enumerated by viable counting of serial dilutions of the microbial suspension. Serial
dilutions were prepared in sterile PBS, and 20 µL of the aliquots were plated on nutrient
agar plates (for Staph. aureus). All of the viable counts were performed in triplicate.
UV-visible absorbance of quantum dots (controls): The quantum dots had an initial
concentration of 3 µM. This solution was serially diluted to give quantum dot solution

Chapter 5 Quantum Dots and Toluidine Blue
127
concentrations of 0.3 µM, 0.15 µM, 0.06 µM and 0.03 µM. To a cuvette distilled water
(1.5 mL) and quantum dots (0.5 mL, 0.15 µM) were added and the UV-visible
absorption spectra recorded for each of the dilutions of quantum dots. The final
quantum dot solution concentrations in the cuvette were 0.075 µM, 0.0375 µM, 0.015
µM and 0.0075 µM and the UV-visible spectra was measured at each dilution.
UV-visible absorbance of quantum dots with toluidine blue: A solution of toluidine
blue was prepared of concentration 80 µM. The quantum dots had an initial
concentration of 3 µM. This solution was serially diluted to give quantum dot solution
concentrations of 0.3 µM, 0.15 µM, 0.06 µM, 0.03 µM. To a cuvette distilled water (1
mL), toluidine blue stock solution, (0.5 mL, 80 µM) and quantum dots (0.5 mL) were
added and the UV- visible absorption spectra recorded. The quantum dot solution was
serially diluted to give final quantum dot concentrations of 0.075 µM, 0.0375 µM, 0.015
µM and 0.0075 µM, these solutions contained toluidine blue of 20 µM. The UV-visible
spectra were measured at each dilution.
Fluorescence of quantum dots (controls): The measurement of fluorescence from the
quantum dots, TBO and quantum dot- TBO mixtures was determined on a Perkin Elmer
LS50B spectrometer, with an excitation wavelength of 365 nm. The emission spectra
were measured in a 1 cm quartz luminescence cuvettes containing quantum dot solution
of set concentrations with and without the dye. To a cuvette H2O (1.5 mL) and TBO
(80 µM, 0.5 mL) were added and the fluorescence spectra recorded at a TBO
concentration of 20 µM.
Fluorescence of quantum dots with toluidine blue: To a cuvette distilled water (1
mL), toluidine blue (0.5 mL, 80 µM) and quantum dots (0.5 mL) were added and
fluorescence spectra recorded (500-800 nm), this provides a solution that is 0.75 µM in
quantum dot and 20 µM in TBO. To water (1 mL) and an aqueous TBO solution (0.5
mL, 80 µM) the quantum dot solution which was serially diluted to give final quantum
dot concentrations of 0.075 µM, 0.0375 µM, 0.015 µM and 0.0075 µM. The total
concentration of TBO in each sample was 20 µM. The fluorescence spectra were
measured for the initial and all serially diluted samples.

Chapter 5 Quantum Dots and Toluidine Blue
128
Determination of FRET: A 3 mm internal diameter NMR tube (4 cm long) was
placed concentrically inside a 1 cm plastic cuvette and fixed in place with super glue.
To quantum dot solutions 0.0125 µM in water was placed inside the N.M.R tube, TBO
solutions of 80, 60, 40, and 0 µM were placed in the plastic cuvette. The fluorescence
spectra from the QD were measured at each TBO concentration.
Measurement of singlet oxygen: Singlet oxygen measurements employed the second
harmonic (lex = 532 nm) of a Q-switched Spectra Physics GCR-150.10 Nd:YAG laser as
the excitation source (~1 mJ per pulse, ~5 ns full-width at half-maximum); The
phosphorescence from the sample was collected at 90º, selected by an interference filter
centered at 1270 nm (Infra Red Engineering Ltd., Essex UK) and then focused onto the
active area of a liquid nitrogen-cooled germanium photodiode (North Coast EO-817P).
The output from this device was AC coupled to a digital oscilloscope (Tektronix TDS-
320), which digitized and averaged transients. Typically 20 laser shots were used for
each sample. The emission was measured on the same toluidine blue/ quantum
solutions as for the previous fluorescence experiments except that the toluidine blue and
dilution experiments were carried out in D2O.
5.3 Results
The effect on the viability of Staph. aureus sensitised with TBO, when exposure to
white light for 10 minutes in the presence and absence of quantum dots is shown in
Figure 5-2. In the absence of quantum dots, the TBO (20 µM) achieved a 1.75 log10
reduction in the viable count of a suspension of Staph. aureus containing 5.4 × 10⁷
cfu/ml. When quantum dots were used with toluidine blue in the ratio TBO:quantum
dots was 2667:1, where the concentration of toluidine blue was 20 µM and quantum
dots was 0.0075 µM, there was a further 1.72 log10 decrease in the viable count of the
bacteria. As the quantum dot concentration reduced, the extent of the enhanced kill
increased - such that the greatest kill was achieved at the highest TBO-quantum dot
ratio (lowest quantum dot concentration). None of the positive or negative controls
showed any significant changes in the number of viable bacteria throughout the course
of these experiments.

Chapter 5 Quantum Dots and Toluidine Blue
129
Figure 5-2 Lethal photosensitization of Staph. aureus by TBO in the absence and presence of various
concentrations of 25 nm diameter CdSe/ZnS quantum dots. L = light; QD = quantum dots; TBO =
toluidine blue.
Figure 5-3 Lethal photosensitization of Strep. pyogenes by TBO in the absence and presence of
various concentrations of 25 nm diameter CdSe/ZnS quantum dots.
1.00E+00
1.00E+01
1.00E+02
1.00E+03
1.00E+04
1.00E+05
1.00E+06
1.00E+07
1.00E+08
L+ TBO (20 µM)+
Q-
L+ TBO(20 µM)+
QD(0.075 µM)+
L+ TBO(20 µM)+
QD(0.0375 µM)+
L+ TBO(20 µM)+
QD(0.015 µM)+
L+ TBO(20 µM)+
QD(0.0075 µM)+
L-T-Q-
Via
ble
Co
un
t (c
fu/m
L)
1.00E+01
1.00E+02
1.00E+03
1.00E+04
1.00E+05
1.00E+06
1.00E+07
1.00E+08
L+T+Q- L+T+Q+ (27:1) L+T+Q+ (267:1) L+T+Q+ (2667:1) L-T-Q-
Via
ble
Co
un
t (c
fu/m
L)

Chapter 5 Quantum Dots and Toluidine Blue
130
When used at certain concentrations, enhanced kills of Strep. pyogenes were also
achieved (Figure 5-3). In the absence of the quantum dots, a 5 minute exposure of the
organism (at a concentration of 1.16 x 10⁷ cfu/mL) to light in the presence of TBO
resulted in a 2.53 log10 reduction in the viable count. However, when quantum dots
were included at a TBO:quantum dots ratio of 267:1, the reduction in viable count
amounted to 4.08 log10 units, an enhanced kill of 1.55 log10 units. At TBO:quantum
dots ratios of 2667:1 enhanced kills were also observed but the enhancement was not as
great as that observed at a ratio of 267:1. As with the S. aureus experiments the highest
quantum dot concentration of 0.75 µM (TBO:quantum dots (27:1)) resulted in kills that
were lower than those achieved with TBO alone. Positive and negative controls showed
no significant changes in cell numbers throughout the course of these experiments.
In order to unravel the cause of the enhancement in bacterial kill, four additional
experiments were conducted. First an absorption experiment was carried out to measure
the absorption characteristics of quantum dots when mixed with toluidine blue.
Secondly, a direct measurement of the amount of singlet oxygen generated at different
quantum dot-TBO ratios was taken. Thirdly, an experiment was carried out to measure
the fluorescence quenching of the quantum dots in the presence of TBO at different
concentrations. Finally, an investigation into the type of mechanism, whether it be a
FRET or non-FRET was conducted.
The absorption at 625 nm in the UV-visible absorption spectra (Figure 5-4) of quantum
dots increased with concentration. Quantum dots absorb at all wavelengths below 650
nm in the visible part of the spectrum. Mixtures of toluidine blue with quantum dots
absorb wavelengths of less than 700 nm in the visible part of the spectrum.

Chapter 5 Quantum Dots and Toluidine Blue
131
Figure 5-4 UV-visible absorption experiments at various concentrations of quantum dots with and
without toluidine blue (20 µM).
The second experiment was to measure the quantity of singlet oxygen produced from
the different quantum dot concentrations when mixed with toluidine blue. This
experiment measured the emission associated with the singlet oxygen to triplet oxygen
conversion at 1260 nm. The amount of singlet oxygen was determined by measuring
the area of the singlet oxygen fluorescence peak (measures singlet to triplet oxygen
conversion), by integrating the area under the best fit exponential curve (Figure 5-5).
These show that the amount of singlet oxygen produced is directly linked to the
quantum dot:TBO ratio. All of the experiments were conducted at the same TBO
concentration but at different quantum dot concentrations. At the lowest quantum dot
concentration (0.0075 µM), the largest amount of singlet oxygen was generated - and
this was more than twice the amount of singlet oxygen generated at the highest quantum
dot concentration of 0.075 µM. Furthermore, singlet oxygen was produced in the
absence of quantum dots – indeed the amount produced was greater than in the presence
of quantum dots demonstrating that the latter suppressed singlet oxygen generation.
0
0.2
0.4
0.6
0.8
1
1.2
1.4
400 450 500 550 600 650 700 750
Wavelength (nm)
Ab
so
rpti
on
(A
.U.)
QD (0.075 µM) + TBO (20 µM)
QD (0.075 µM)
QD (0.0075 µM) + TBO (20 µM)
QD (0.0075 µM)
TBO (20 µM)

Chapter 5 Quantum Dots and Toluidine Blue
132
Figure 5-5 (a) Plot of intensity against time of the singlet oxygen decay produced from quantum dots
at 0.015 µM and toluidine blue at 20 µM (area under the curve is proportional to singlet oxygen
concentration). (b) Plot of ln[I]/[I]0 transformation of the first order exponential decay of singlet
oxygen. (c) Graph of the relative proportion of singlet oxygen produced as a function of the
concentration of quantum dots whilst a constant concentration of toluidine blue (20 µM) was
maintained.
It was found that the emission peak of the quantum dots at 627 nm when mixed with
TBO was significantly reduced (Figure 5-6). This indicates that the TBO and quantum
dots were interacting with each other. Furthermore, this communication was
concentration-dependent, with the greatest reduction in emission seen at the lowest
quantum dot concentration (Figure 5-6 (d)). The evidence of emission adsorption was
very strong because the peak associated with the emission was significantly reduced (up
to ca. 90% absorption by TBO), whilst the second harmonic peak associated with the
exciting wavelength seen at ca. 720 nm was largely unaffected by the process.
y = -16575x + 0.3895
-4.5
-4
-3.5
-3
-2.5
-2
-1.5
-1
-0.5
0
0.E+00 5.E-05 1.E-04 2.E-04 2.E-04
Time (sec)
ln([
I]/[
I]0
)
y = -2194.9Ln(x) - 18745
0
1000
2000
3000
4000
5000
6000
0.E+00 5.E-05 1.E-04 2.E-04 2.E-04
Time (sec)
Inte
nsit
y Intensity
Log. (Intensity)
0
0.1
0.2
0.3
0.4
0.5
0.6
0.7
0.8
0 0.01 0.02 0.03 0.04 0.05 0.06 0.07 0.08
Concentration (µM)
Re
lati
ve
Pro
po
rtio
n o
f S
ing
let
Oxy
gen
De
tec
ted
(a) (b)
(c)

Chapter 5 Quantum Dots and Toluidine Blue
133
Figure 5-6 (a) Fluorescence spectra of quantum dots at 0.075 µM concentration (blue ) and a mixture
of quantum dots (0.075 µM)with toluidine blue, 20 µM (pink). (b) Fluorescence spectra of quantum
dots at 0.0375 µM concentration (blue) and a mixture of quantum dots (0.0375 µM) with toluidine
blue, 20 µM (pink). (c) Fluorescence spectra of quantum dots at 0.015 µM concentration (blue) and
quantum dots (0.015 µM) with toluidine blue, 20 µM (pink). (d) Fluorescence spectra of quantum dots
at 0.0075 µM concentration (blue) and a mixture of quantum dots (0.0075 µM) with toluidine blue, 20
µM (pink). The fluorescence emission decreases as the concentration of quantum dots decreases. The
fluorescence emission of the quantum dots is reduced when TBO (20 µM) is present. (e) The
percentage fluorescence emission (expressed as fluorescence in the presence of TBO/ fluorescence
without TBO × 100) as a function of quantum dot concentration in the presence of TBO 20 µM. The
peaks between 700 and 750 nm in (a), (b), (c) and (d) are second order excitation peaks from the 365
nm excitation.
0
100
200
300
400
500
600
700
500 550 600 650 700 750 800
Wavelength (nm)
Em
iss
ion
(A
.U.)
QD (0.075 µM)
TBO + QD (0.075 µM)
0
100
200
300
400
500
600
700
500 550 600 650 700 750 800
Wavelength (nm)
Em
iss
ion
(A
.U.)
QD (0.0375 µM)
TBO + QD (0.0375 µM)
0
100
200
300
400
500
600
700
500 550 600 650 700 750 800
Wavelength (nm)
Em
iss
ion
(A
.U.)
QD (0.015 µM)
TBO + QD (0.015 µM)
0
100
200
300
400
500
600
700
500 550 600 650 700 750 800
Wavelength (nm)E
mis
sio
n (
A.U
.)
QD (0.0075 µM)
TBO + QD (0.0075 µM)
0
10
20
30
40
50
60
70
80
90
100
0 0.05 0.1 0.15 0.2 0.25 0.3 0.35
Concentration of Quantum Dots (µM)
% L
os
s o
f T
BO
In
ten
sit
y (
Fre
e T
BO
- T
BO
+Q
D)
(a) (b)
(c) (d)
(e)

Chapter 5 Quantum Dots and Toluidine Blue
134
An experiment to determine whether the quantum dots and toluidine blue could interact
through a radiation-less energy exchange FRET mechanism or through an emission –
re-absorption phenomenon was conducted (Figure 5-7). FRET mechanisms are
reported to operate over very short distances (10 nm), by separating the TBO and QD in
separate compartments of the same cell with an intervening wall separation of at least
100,000 nm it was demonstrated mechanistically that the process could be accounted for
by a non-FRET mechanism.
Figure 5-7 Quenched fluorescence of quantum dots (0.0125 µM) in the presence of various
concentrations of TBO – the separation distance was in excess of 100,000 nm.
5.4 Discussion
Toluidine blue has long been known to be an effective lethal photosensitiser of bacteria.
Mathews181 and MacMillan et al.80 have reported the use of this dye to sensitise
bacteria, killing by white light and light from a helium/neon laser, respectively. The
results in this chapter have demonstrated that the addition of quantum dots with an
emission maximum of 627 nm, which is close to the absorption maximum of 630 nm of
0
100
200
300
400
500
600
700
800
900
1000
500 550 600 650 700 750 800
Wavelength (nm)
Inte
nsit
y (
A.U
.)
TBO 0 ( µM)
TBO 20 ( µM)
TBO 40 ( µM)
TBO 80 ( µM)

Chapter 5 Quantum Dots and Toluidine Blue
135
TBO, can significantly enhance the efficacy of TBO-mediated lethal photosensitisation
of Staph. aureus and Staph. pyrogenes.
There is currently great interest in the potential use of quantum dots and other
nanoparticles in photodynamic therapy.8,182 In a study by Samia et al.176, quantum dots
have been shown to transfer energy directly to molecular oxygen to generate singlet
oxygen.176 CdSe/ZnS quantum dots with a diameter of 5 nm were used in the study
and, on irradiation with light with a wavelength of 488 nm, singlet oxygen was
generated with a quantum yield of approximately 5%. In contrast, the results in this
chapter do not display any bactericidal effect when bacteria were irradiated in the
presence of quantum dots and in the absence of TBO. This may be because either no
singlet oxygen was generated by the quantum dots or else the yield was so low that the
resulting bacterial kill was too small to be detectable. When quantum dots are
covalently linked to a photosensitiser, singlet oxygen can be generated on irradiation
with light of a wavelength not absorbed by the photosensitiser itself.176 In this study, on
irradiation with 488 nm light, CdSe/ZnS quantum dots linked to a silicon
phthalocyanine photosensitiser were able to generate singlet oxygen by a “fluorescence”
resonance energy transfer (Förster resonance energy transfer - FRET) mechanism. In
this mechanism the excitation energy can be transferred by a radiationless process to a
neighboring fluorophore when their energy level difference corresponds to the quantum
of excitation energy. The conditions for this mechanism are: the fluorescent emission
spectra of the energy donor must overlap the absorption spectrum of the energy
acceptor. The two fluorophores need not necessarily be part of the same molecule.
Energy transfer will take place between isolated molecules in solution as long as the
concentration is high enough to bring the average intermolecular distance to less than a
few nm.
The experiments conducted by Samia et al.176 were performed in toluene, a solvent
which would not be compatible with biological systems. Shi et al.183 synthesised water
miscible Cd/Te quantum dots organic dye nanocomposites which produced singlet
oxygen. The organic dye used was meso-tetra(4-sulphonatophenyl)porphine
dihydochloride (TSPP) and was electrostatically bound to the surface of the quantum
dot. In their UV-visible absorption experiments they found the bound dye absorption

Chapter 5 Quantum Dots and Toluidine Blue
136
had a slight blue shift when compared to the unbound dye. This is consistent with the
results in this chapter and can be attributed to H-type aggregates of the dye on the
quantum dot surface. H–aggregates consist of a parallel arrangement of dye molecules
to form a vertical stack and correspond to a blue shift in the absorption band.114 Shi et
al.183 also observed immediate aggregation on addition of dye which was not observed
in the results presented here. This can be explained by comparing the concentration of
dye used; the Shi et al. experiment uses a concentration an order of magnitude larger.
In agreement with the results presented here, Shi et al.183 found the emission from the
quantum dots reduced greatly upon addition of dye. In contrast to the results presented
by Samia et al.176, Shi et al.
183 did not detect any singlet oxygen production in the
absence of a dye, which is again consistent with the results presented here. The dye that
Shi et al.183 used (TSPP) had no appreciable absorption at the excitation wavelength
(355 nm, Nd:YAG) that they used to irradiate the quantum dot/dye nanocomposite for
the singlet oxygen detection experiments. A FRET type mechanism was proposed to
account for the singlet oxygen produced. FRET is the non-radiative transfer from the
quantum dot to the dye which subsequently produced singlet oxygen.
The experiments in this chapter were performed on quantum dots which were not
covalently linked to the toluidine blue molecules. Irradiation with white light resulted
in bacterial kills in considerable excess to those achieved when toluidine blue was used
alone. Significantly, the greatest kills or enhancements were seen at the higher
TBO:quantum dots ratios or lowest quantum dot concentrations. The CdSe/ZnS
quantum dots exhibited high absorbance with a number of bands (440-550 nm and 610-
620 nm) emitted by the white light source used. The emission band of the quantum dots
(627 nm) corresponded closely with the main absorbance band of the TBO (630 nm). It
is possible, therefore, that the TBO molecules were sufficiently close to the quantum
dots (within 6 nm) to enable a FRET mechanism to take place resulting in the
generation of cytotoxic species and, consequently, a bactericidal effect. It is also
possible that the TBO interacts with the PEG coating of the quantum dot via a weak
electrostatic/hydrogen bonding interaction.
The greatest interaction between the quantum dot and toluidine blue was observed at the
lowest quantum dot concentration which is counter intuitive to a direct FRET

Chapter 5 Quantum Dots and Toluidine Blue
137
mechanism. The ratio of TBO:QD was crucial for achieving an enhancement of the
bactericidal effect. For Staph. aureus, enhancement occurred only when the ratio of
TBO:quantum dots was between 133:1 and 2667:1 at quantum dot concentrations
between 0.075 and 0.0075 µM. There have been many reports which conclude that
quantum dots are not toxic to biological cells177,184 from leaching of cadmium ions.
However this did not affect the lethal photosensitisation results here as control
experiments indicated that the quantum dots were toxic to the bacteria in the
environment and for experimental time that they were in contact.
The fluorescence measurements of the TBO:QD mixture showed significant absorption
of the quantum dot emission. This reduction in emission may be due to energy transfer
from the quantum dot to the toluidine blue. By measuring the emission of a
compartmentalised quantum dot and toluidine blue solution, it was evident that the
quantum dot emission as measured by the instrument detector was directly proportional
to the external toluidine blue concentration and followed the Beer-Lambert law. This
indicates that the light emitted by the quantum dots is directly absorbed by the toluidine
blue solution (Figure 5-7). This process can only be through a radiative process as the
two compartments were separated by a distance far in excess of that required for a
FRET pathway to operate. This experiment indicates that the observed pathway in
fluorescence seen for intermixed QD-TBO solutions can be fully explained by a non-
FRET mechanism in which the quantum dot absorbs radiation and emits at the
maximum absorption of the toluidine blue dye.
In summary:-
• Mixtures of quantum dots and toluidine blue enhance bacterial kills in solution
upon irradiation with white light at low quantum dot concentrations. Quantum dots
have no direct toxic effect on the bacteria in the presence or absence of the white,
light, and the observed bacterial kill did not scale with relative singlet oxygen
concentration.
• Quantum dots suppress the formation of singlet oxygen from toluidine blue in
water. The higher the quantum dot concentration in a solution, the lower the
amount of singlet oxygen produced. Toluidine blue on its own produces more
singlet oxygen on irradiation with white light than any TBO/QD solution.

Chapter 5 Quantum Dots and Toluidine Blue
138
• Quantum dot fluorescence is significantly absorbed in the presence of toluidine
blue. The quantum dot fluorescence is quenched through absorption of the emitted
light from the quantum dot and not through a FRET mechanism. The amount of
emitted light from the quantum dot that is absorbed by the TBO is directly
proportional to the TBO concentration.
• The emission spectrum of the light used in the experiments did not match very
well with the TBO absorption maximum; however the QD emission and TBO
absorption were closely matched.
Figure 5-8 Absorption of white light by quantum dots and emission at 627, which is absorbed by
toluidine blue. Toluidine blue is essential for the formation of singlet oxygen and cytotoxic species
which are lethal to bacteria.
It can be deduced that quantum dots synergistically enhance the ability of toluidine blue
to kill bacteria. No bacterial kill was seen in the absence of toluidine blue and the
quantum dots improve the photosensitising ability of toluidine blue by absorbing light
with a wavelength less than 620 nm and up-shifting this via an emission process to
approximately 627 nm which is close to the absorption maximum of the toluidine blue
(Figure 5-8). The quantum dots also have a further role in the process, as they suppress
the formation of singlet oxygen from the excited toluidine blue molecule. The QD-
TBO interaction is a complicated one, in the presence of quantum dots more toluidine
blue is found in the excited state. However, the toluidine blue relaxes to its ground state
through the formation of cytotoxic molecular species other than singlet oxygen:
Cytotoxic species,
Enhanced bacterial kill
Quantum Dot
Toluidine Blue
Emission at 627 nm Absorption of
white light

Chapter 5 Quantum Dots and Toluidine Blue
139
presumably other radicals such as the hydroxyl radical.90 It is the formation of these
activated radicals that are responsible for the enhanced bacterial kills observed.
5.5 Conclusion
In conclusion, quantum dots of CdSe/ZnS enhance the antimicrobial effect of the light-
activated antimicrobial agent toluidine blue. The lethal photosensitisation of Staph.
aureus, using toluidine blue and quantum dots is concentration-dependent. An excess
of a 1.7 log10 enhancement was observed with the lowest quantum dot concentration
(0.0075 µM), highest QD:TBO ratios. It was deduced that an emission- absorption
process from the quantum dots to the toluidine blue occurs, especially at low quantum
dot concentrations by fluorescence measurements. The enhanced bacterial kills
observed in lethal photosensitisation experiments in the presence of quantum dots and
toluidine blue are the result of light-induced production of greater quantities of reactive
oxygen species (other than singlet oxygen) by toluidine blue. An energy transfer from
the quantum dots to toluidine blue is induced at low quantum dot concentrations. Light
was absorbed by the quantum dots and then re-emitted at the absorption maximum of
TBO. The quantum dot, converts the incident white light to the frequency at which
toluidine blue has a maximum absorption. Consequently a greater proportion of toxic
species are formed and an enhanced bacterial kill is observed.

Chapter 6 Conclusion
140
Chapter 6 Conclusion
This thesis reported on coupling light activated antimicrobial agents with gold
nanoparticles to provide new nano bio-materials which displayed enhanced
antimicrobial properties. The gold nanoparticle formed the central core of the nano-
biomaterial. Organic molecules were adsorbed onto the surface or they were
chemically attached. Light activated antimicrobial agents were mixed with gold
nanoparticles so that they were adsorbed onto the surface. Additionally alkane thiol
protected nanoparticles were synthesised, and the light activated antimicrobial was
chemically attached to the monolayer. A mechanistic study was performed in order to
uncover information on the relationship between quantum dots and toluidine blue.
6.1 Summary of Results
A novel highly effective and potent light activated antimicrobial was synthesised. The
conjugation of toluidine blue to tiopronin–gold nanoparticles has proved to be
exceptionally effective at killing Staphylococcus aureus. At 1 µM concentration and
using white light for 30 minutes, the conjugate showed a reduction in colony forming
units (cfu) of 4.5 log10 compared with 0.5 log10 for toluidine blue at the same
concentration. The superior performance of the conjugate was attributed to the
enhanced extinction coefficient of toluidine blue–tiopronin–gold nanoparticles, a result
of the association to the gold core surface, when compared to free toluidine blue. In
terms of their minimum bactericidal concentrations (MBCs), the covalently linked
toluidine blue–tiopronin–gold nanoparticle conjugates are the most potent light-
activated antimicrobial agents reported to date. This gold-thiol-photosensitiser motif
was further investigated by using the thiol glutathione (GS) and photosensitiser tin
chlorin e6. Nanoparticles with motifs of gold-glutathione-tin chlorin e6
(Au-GS-SnCe6), of different diameters ranging from 1.73 to 6.24 nm were synthesised
in a two step reaction. The attachment of the photosensitiser tin chlorin e6 to
glutathione protected gold nanoparticles was confirmed by UV-visible absorption
Chapter 6 Conclusion
141
spectroscopy. This study established that the synthetic route is robust enough for many
different combinations of gold-thiol-photosensitiser to be explored.
The adsorption of basic cationic dyes of the thiazine family onto gold nanoparticles
enhances the extinction coefficient of the dyes. This was not observed for the acidic
anionic dyes investigated. The fluorescence of the thiazine dye toluidine blue is
quenched in the presence of gold nanoparticles. Additionally, the production of singlet
oxygen by toluidine blue decreases in the presence of gold nanoparticles. Importantly it
was found that the covalent attachment of a light activated antimicrobial such as
toluidine blue was not required for an enhancement in bacterial kill to be observed. The
enhanced bacterial kill observed was attributed to reactive oxygen species other than
singlet oxygen, such as hydroxyl radicals being production.
Quantum dots of CdSe/ZnS enhance the antimicrobial effect of the light-activated
antimicrobial agent toluidine blue. It was found that the lethal photosensitisation of
bacteria using toluidine blue and quantum dots was concentration-dependent. An
excess of 1.7 log10 enhancement in bacterial kill was observed with the lowest quantum
dot concentration (0.0075 µM). A mechanistic study revealed that an emission -
absorption process from the quantum dots to the toluidine blue occurs, especially at low
quantum dot concentrations. The enhanced bacterial kills observed in lethal
photosensitisation experiments in the presence of quantum dots and toluidine blue, are
attributed but not proven to be due to light-induced production of greater quantities of
reactive oxygen species (other than singlet oxygen) by toluidine blue. Incoming light
was absorbed by the quantum dots and then re-emitted at the absorption maximum of
toluidine blue. The quantum dot, converts the incident white light to the frequency at
which toluidine blue has a maximum absorption. Consequently a greater proportion of
toxic species are formed and an enhanced bacterial kill is observed.
The investigations conducted in this work can be split into two areas; covalent
attachment of photosensitisers to gold nanoparticles and mixing of photosensitisers with
nanoparticles. The covalent attachment of photosensitisers to thiol protected gold
nanoparticles was divided into a further two systems. The two systems investigated had
motifs of gold-tiopronin-toluidine blue and gold-glutathione-tin chlorin e6. The

Chapter 6 Conclusion
142
synthesis of these particles has proven to be versatile and the coupling chemistry robust
enough to be applied to different systems. The covalent attachment of photosensitisers
to gold nanoparticles has antibacterial properties and nanoparticles with the motif
gold-tiopronin-toluidine blue enhance the bacterial kill. This has been the first
application of nanoparticles coupled with photosensitisers in the lethal
photosensitisation of microbes.
The second area investigated was the mixing of nanoparticles and photosensitisers.
This was split into a further two systems of gold and CdSe quantum dots. Both systems
were found to enhance the kill of bacteria. The singlet oxygen experiments for both
systems found that the relative proportion of singlet oxygen produced by the
photosensitiser, in the presence of gold and CdSe nanoparticles was suppressed. This
indicates that the mechanism by which bacterial kill is achieved is not solely due to the
production of singlet oxygen and that other radical species such as hydroxyl radicals
play an important role. It was found that the photoluminescence of toluidine blue was
quenched by gold nanoparticles, whereas the photoluminescence of the quantum dots
was absorbed by the toluidine blue, suggesting that the enhanced bacterial kill operates
via different pathways. In the case of CdSe quantum dots and toluidine blue some
evidence was found to suggest a non-FRET mechanism whereby, the quantum dots
absorb light and re-emit the light at a wavelength optimum for the absorption by
toluidine blue. In the case of charge stabilised gold nanoparticles it was found that
mixing of these particles with certain basic cationic dyes achieved enhanced extinction
coefficients by UV-visible absorption spectroscopy. This enhanced absorption is
thought to be part of the reason behind the enhanced bacterial kills observed when gold
nanoparticles are mixed with photosensitisers.
In general nanoparticles of gold and CdSe enhance the lethal photosensitisation of
bacteria, and that covalent attachment of the photosensitiser to the surface of the
nanoparticle is not necessary for this enhancement to be observed. The relationship
between the nanoparticles and photosensitisers seems to be a complex one, where the
nature of the nanoparticles and photosensitisers, the ratio between the two and size of
the particles, all play a vital role. It appears that each system has its own mechanistic
pathway by which enhanced lethal photosensitisation of bacteria occurs. However,

Chapter 6 Conclusion
143
enough evidence has been gathered in this investigation to suggest an antenna effect by
the nanoparticle so that a higher concentration of toxic species (other than singlet
oxygen) is produced.
6.2 Future perspectives
There many other aspects of chromophore functionalised gold nanoparticles that could
be investigated. One of these is changing the linker tiopronin to other bioavailable
molecules such as amines. The core size could be further increased and decreased to
find an optimum, where the bacterial kill is highest. This could be achieved by
decreasing the temperature at which the gold core was formed along with altering the
coating : gold ratio. The gold–thiol nanoparticles acted as a supporting scaffold for
attachment of the photosensitiser groups and also conferred water solubility. Other
thiols which allow water solubility could be investigated. Additionally, the other
photosensitisers could be placed in the gold-thiol-photosensitiser motif. It should be
possible for the gold core to support further molecules. This could be utilised for the
attachment of a specific targeting moiety such as an antibody or antibody fragment that
is specific for a certain bacterial type, to obtain selective killing of bacteria.
In order to investigate the mechanism by which this enhanced bacterial kill operates
EPR studies should be performed, to identify the triplet state of the photosensitiser
when irradiated by light. This should be done in the presence and absence of gold
nanoparticles to detect any differences.

References
144
References
1. M. B. Cortie, The weird world of nanoscale gold. Gold Bulletin, 2004. 37(1-2): p. 12-19.
2. S. Eustis and M. A. El-Sayed, Why gold nanoparticles are more precious than
pretty gold: Noble metal surface plasmon resonance and its enhancement of the
radiative and nonradiative properties of nanocrystals of different shapes. Chemical Society Reviews, 2006. 35(3): p. 209-217.
3. M. C. Daniel and D. Astruc, Gold nanoparticles: Assembly, supramolecular
chemistry, quantum-size-related properties, and applications toward biology,
catalysis, and nanotechnology. Chemical Reviews, 2004. 104(1): p. 293-346. 4. L. F. Kozin and V. T. Melekhin, Extraction of gold from ores and concentrates
by leaching with the use of cyanides and alternative reagents. Russian Journal of Applied Chemistry, 2004. 77(10): p. 1573-1592.
5. R. H. Swendsen, Statistical mechanics of colloids and Boltzmann's definition of
the entropy. American Journal of Physics, 2006. 74(3): p. 187-190. 6. S. K. Ghosh and T. Pal, Interparticle coupling effect on the surface plasmon
resonance of gold nanoparticles: From theory to applications. Chemical Reviews, 2007. 107(11): p. 4797-4862.
7. L. A. Dykman and V. A. Bogatyrev, Gold nanoparticles: Preparation,
functionalisation, applications in biochemistry and immunochemistry. Uspekhi Khimii, 2007. 76(2): p. 199-213.
8. A. C. S. Samia, S. Dayal and C. Burda, Quantum dot-based energy transfer:
Perspectives and potential for applications in photodynamic therapy. Photochemistry and Photobiology, 2006. 82(3): p. 617-625.
9. A. K. Gupta and M. Gupta, Synthesis and surface engineering of iron oxide
nanoparticles for biomedical applications. Biomaterials, 2005. 26(18): p. 3995-4021.
10. G. Schmid, R. Pfeil, R. Boese, F. Bandermann, S. Meyer, G. H. M. Calis and W. A. Vandervelden, Au55[P(C6H5)3]12Cl6 - a Gold Cluster of an Exceptional Size. Chemische Berichte-Recueil, 1981. 114(11): p. 3634-3642.
11. M. Giersig and P. Mulvaney, Preparation of Ordered Colloid Monolayers by
Electrophoretic Deposition. Langmuir, 1993. 9(12): p. 3408-3413. 12. U. Simon, G. Schon and G. Schmid, The Application of Au-55 Clusters as
Quantum Dots. Angewandte Chemie-International Edition in English, 1993. 32(2): p. 250-254.
13. H. J. Zhang, G. Schmid and U. Hartmann, Reduced metallic properties of
ligand-stabilized small metal clusters. Nano Letters, 2003. 3(3): p. 305-307. 14. S. Link and M. A. El-Sayed, Size and temperature dependence of the plasmon
absorption of colloidal gold nanoparticles. Journal of Physical Chemistry B, 1999. 103(21): p. 4212-4217.
15. A. I. Frenkel, C. W. Hills and R. G. Nuzzo, A view from the inside: Complexity
in the atomic scale ordering of supported metal nanoparticles. Journal of Physical Chemistry B, 2001. 105(51): p. 12689-12703.
16. J. W. Gentry, The legacy of John Tyndall in aerosol science. Journal of Aerosol Science, 1997. 28(8): p. 1365-1372.

References
145
17. G. Frens, Particle-Size and Sol Stability in Metal Colloids. Kolloid-Zeitschrift and Zeitschrift Fur Polymere, 1972. 250(7): p. 736-&.
18. G. Frens, Controlled Nucleation for the Particle Size in Monodisperse Gold
Suspensions. Nature Physical Science, 1973. 241: p. 20-22. 19. M. G. Blaber, M. D. Arnold, N. Harris, M. J. Ford and M. B. Cortie, Plasmon
absorption in nanospheres: A comparison of sodium, potassium, aluminium,
silver and gold. Physica B-Condensed Matter, 2007. 394(2): p. 184-187. 20. L. E. Murillo, O. Viera, E. Vicuna, J. G. Briano, M. Castro, Y. Ishikawa, R.
Irizarry and L. Sola, Growth kinetics of gold nanoparticles. 2006 International Conference on Computational Nanoscience and Nanotechnology - Iccn 2002, 2002: p. 435-438.
21. P. N. Njoki, I. I. S. Lim, D. Mott, H. Y. Park, B. Khan, S. Mishra, R. Sujakumar, J. Luo and C. J. Zhong, Size correlation of optical and spectroscopic properties
for gold nanoparticles. Journal of Physical Chemistry C, 2007. 111: p. 14664-14669.
22. T. Klar, M. Perner, S. Grosse, G. von Plessen, W. Spirkl and J. Feldmann, Surface-plasmon resonances in single metallic nanoparticles. Physical Review Letters, 1998. 80(19): p. 4249-4252.
23. M. Faraday, The Bakerian Lecture: Experimental Relations of Gold (and Other
Metals) to Light. Philosophical Transactions of the Royal Society of London, 1857. 147: p. 145-181.
24. B. L. Cushing, V. L. Kolesnichenko and C. J. O'Connor, Recent advances in the
liquid-phase syntheses of inorganic nanoparticles. Chemical Reviews, 2004. 104: p. 3893-3946.
25. S. L. Barnholtz, J. D. Lydon, G. Huang, M. Venkatesh, C. L. Barnes, A. R. Ketring and S. S. Jurisson, Syntheses and characterization of gold(III)
tetradentate Schiff base complexes. X-ray crystal structures of [Au(sal(2)pn)]Cl
center dot 2.5H(2)O and [Au(sal(2)en)]PF6. Inorganic Chemistry, 2001. 40(5): p. 972-976.
26. W. Ostwald, Practical Colloid Chemistry. 4th ed. 1924, New York: Dutton. 1-11.
27. H. B. Weiser, Inorganic Colloid Chemistry. Vol. 1. 1933, New York: Wiley. 21-57.
28. J. Turkevich, P. C. Stevenson and J. Hillier, A Study of the Nucleation and
Growth Processes in the Synthesis of Colloidal Gold. Discussions of the Faraday Society, 1951(11): p. 55-&.
29. J. W. Slot and H. J. Geuze, A New Method of Preparing Gold Probes for
Multiple-Labeling Cyto-Chemistry. European Journal of Cell Biology, 1985. 38(1): p. 87-93.
30. J. W. Slot and H. J. Geuze, Sizing of Protein a-Colloidal Gold Probes for
Immunoelectron Microscopy. Journal of Cell Biology, 1981. 90(2): p. 533-536. 31. M. Brust, M. Walker, D. Bethell, D. J. Schiffrin and R. Whyman, Synthesis of
Thiol-Derivatized Gold Nanoparticles in a 2-Phase Liquid-Liquid System. Journal of the Chemical Society-Chemical Communications, 1994(7): p. 801-802.
32. R. G. Pearson and J. Songstad, Application of Principle of Hard and Soft Acids
and Bases to Organic Chemistry. Journal of the American Chemical Society, 1967. 89(8): p. 1827-&.

References
146
33. M. Brust, J. Fink, D. Bethell, D. J. Schiffrin and C. Kiely, Synthesis and
Reactions of Functionalized Gold Nanoparticles. Journal of the Chemical Society-Chemical Communications, 1995(16): p. 1655-1656.
34. M. J. Hostetler, A. C. Templeton and R. W. Murray, Dynamics of place-
exchange reactions on monolayer-protected gold cluster molecules. Langmuir, 1999. 15(11): p. 3782-3789.
35. B. Nikoobakht and M. A. El-Sayed, Preparation and growth mechanism of gold
nanorods (NRs) using seed-mediated growth method. Chemistry of Materials, 2003. 15(10): p. 1957-1962.
36. K. R. Brown, D. G. Walter and M. J. Natan, Seeding of colloidal Au
nanoparticle solutions. 2. Improved control of particle size and shape. Chemistry of Materials, 2000. 12(2): p. 306-313.
37. K. R. Brown, L. A. Lyon, A. P. Fox, B. D. Reiss and M. J. Natan, Hydroxylamine seeding of colloidal au nanoparticles. 3. Controlled formation of
conductive Au films. Chemistry of Materials, 2000. 12(2): p. 314-323. 38. T. K. Sau, A. Pal, N. R. Jana, Z. L. Wang and T. Pal, Size controlled synthesis of
gold nanoparticles using photochemically prepared seed particles. Journal of Nanoparticle Research, 2001. 3(4): p. 257-261.
39. F. Chen, G.-Q. Xu and T. S. A. Hor, Preparation and assembly of colloidal gold
nanoparticles in CTAB-stabilized reverse microemulsion. Materials Letters, 2003. 57(21): p. 3282-3286.
40. H. Bonnemann and R. M. Richards, Nanoscopic metal particles - Synthetic
methods and potential applications. European Journal of Inorganic Chemistry, 2001(10): p. 2455-2480.
41. V. K. Lamer and R. H. Dinegar, Theory, Production and Mechanism of
Formation of Monodispersed Hydrosols. Journal of the American Chemical Society, 1950. 72(11): p. 4847-4854.
42. E. J. Perry, Extinctiometric Methods for Studying Protective Colloid Action and
Ostwald Ripening of Silver Bromide Sols. Journal of Physical Chemistry, 1958. 62(5): p. 585-589.
43. M. K. Chow and C. F. Zukoski, Gold Sol Formation Mechanisms - Role of
Colloidal Stability. Journal of Colloid and Interface Science, 1994. 165(1): p. 97-109.
44. C. J. Sandroff and D. R. Herschbach, Kinetics of Displacement and Charge-
Transfer Reactions Probed by Sers - Evidence for Distinct Donor and Acceptor
Sites on Colloidal Gold Surfaces. Langmuir, 1985. 1(1): p. 131-135. 45. M. Aslam, L. Fu, M. Su, K. Vijayamohanan and V. P. Dravid, Novel one-step
synthesis of amine-stabilized aqueous colloidal gold nanoparticles. Journal of Materials Chemistry, 2004. 14(12): p. 1795-1797.
46. E. A. K. J. E. Hughey, R. L. Keiter, Principles of Structure and Reactivity. 4th ed. Inorganic Chemistry. 1993, New York: Harper Collins College Publishers.
47. G. Han, P. Ghosh and V. M. Rotello, Functionalized gold nanoparticles for drug
delivery. Nanomedicine, 2007. 2(1): p. 113-123. 48. R. Levy, Peptide-capped gold nanoparticles: Towards artificial proteins.
Chembiochem, 2006. 7(8): p. 1141-1145. 49. A. C. Enriquez, I. A. R. Espejel, E. A. Garcia and M. E. Diaz-Garcia, Enhanced
resonance light scattering properties of gold nanoparticles due to cooperative
binding. Analytical and Bioanalytical Chemistry, 2008. 391(3): p. 807-815.

References
147
50. V. Sokolova and M. Epple, Inorganic nanoparticles as carriers of nucleic acids
into cells. Angewandte Chemie-International Edition, 2008. 47(8): p. 1382-1395.
51. T. Murakami and K. Tsuchida, Recent advances in inorganic nanoparticle-
based drug delivery systems. Mini-Reviews in Medicinal Chemistry, 2008. 8(2): p. 175-183.
52. P. Pandey, M. Datta and B. D. Malhotra, Prospects of nanomaterials in
biosensors. Analytical Letters, 2008. 41(2): p. 159-209. 53. I. Palchetti and M. Mascini, Nucleic acid biosensors for environmental pollution
monitoring. Analyst, 2008. 133(7): p. 846-854. 54. P. P. Pompa, R. Chiuri, L. Manna, T. Pellegrino, L. L. del Mercato, W. J. Parak,
F. Calabi, R. Cingolani and R. Rinaldi, Fluorescence resonance energy transfer
induced by conjugation of metalloproteins to nanoparticles. Chemical Physics Letters, 2006. 417(4-6): p. 351-357.
55. I. Willner, B. Shlyahovsky, M. Zayats and B. Willner, DNAzymes for sensing,
nanobiotechnology and logic gate applications. Chemical Society Reviews, 2008. 37(6): p. 1153-1165.
56. S. H. Hsu, H. J. Yen and C. L. Tsai, The response of articular chondrocytes to
type II collagen-Au nanocomposites. Artificial Organs, 2007. 31: p. 854-868. 57. X. J. Ji, R. P. Shao, A. M. Elliott, R. J. Stafford, E. Esparza-Coss, J. A. Bankson,
G. Liang, Z. P. Luo, K. Park, J. T. Markert and C. Li, Bifunctional gold
nanoshells with a superparamagnetic iron oxide-silica core suitable for both
MR imaging and photothermal therapy. Journal of Physical Chemistry C, 2007. 111(17): p. 6245-6251.
58. H. Z. Jin and K. A. Kang, Application of novel metal nanoparticles as
optical/thermal agents in optical mammography and hyperthermic treatment for
breast cancer. Oxygen Transport to Tissue Xxviii, 2007. 599: p. 45-52. 59. S. H. Kim, M. J. Kim and Y. H. Choa, Fabrication and estimation of Au-coated
Fe3O4 nanocomposite powders for the separation and purification of
biomolecules. Materials Science and Engineering a-Structural Materials Properties Microstructure and Processing, 2007. 449: p. 386-388.
60. H. Y. Park, M. J. Schadt, L. Wang, I. I. S. Lim, P. N. Njoki, S. H. Kim, M. Y. Jang, J. Luo and C. J. Zhong, Fabrication of magnetic core @ shell Fe oxide @
Au nanoparticles for interfacial bioactivity and bio-separation. Langmuir, 2007. 23(17): p. 9050-9056.
61. C. Alric, J. Taleb, G. Le Duc, C. Mandon, C. Billotey, A. Le Meur-Herland, T. Brochard, F. Vocanson, M. Janier, P. Perriat, S. Roux and O. Tillement, Gadolinium chelate coated gold nanoparticles as contrast agents for both X-ray
computed tomography and magnetic resonance imaging. Journal of the American Chemical Society, 2008. 130(18): p. 5908-5915.
62. P. J. Debouttiere, S. Roux, F. Vocanson, C. Billotey, O. Beuf, A. Favre-Reguillon, Y. Lin, S. Pellet-Rostaing, R. Lamartine, P. Perriat and O. Tillement, Design of gold nanoparticles for magnetic resonance imaging. Advanced Functional Materials, 2006. 16(18): p. 2330-2339.
63. K. K. Jain, Nanomedicine: Application of nanobiotechnology in medical
practice. Medical Principles and Practice, 2008. 17(2): p. 89-101. 64. T. Powell and J. Y. Yoon, Fluorescent biorecognition of gold nanoparticle-IgG
conjugates self-assembled on e-beam patterns. Biotechnology Progress, 2006. 22(1): p. 106-110.

References
148
65. C. J. Ackerson, P. D. Jadzinsky and R. D. Kornberg, Thiolate ligands for
synthesis of water-soluble gold clusters. Journal of the American Chemical Society, 2005. 127(18): p. 6550-6551.
66. L. A. Porter, D. Ji, S. L. Westcott, M. Graupe, R. S. Czernuszewicz, N. J. Halas and T. R. Lee, Gold and silver nanoparticles functionalized by the adsorption of
dialkyl disulfides. Langmuir, 1998. 14(26): p. 7378-7386. 67. Y. S. Shon, C. Mazzitelli and R. W. Murray, Unsymmetrical disulfides and thiol
mixtures produce different mixed monolayer-protected gold clusters. Langmuir, 2001. 17(25): p. 7735-7741.
68. Y. L. Liu, K. B. Male, P. Bouvrette and J. H. T. Luong, Control of the size and
distribution of gold nanoparticles by unmodified cyclodextrins. Chemistry of Materials, 2003. 15(22): p. 4172-4180.
69. G. H. Woehrle and J. E. Hutchison, Thiol-functionalized undecagold clusters by
ligand exchange: Synthesis, mechanism, and properties. Inorganic Chemistry, 2005. 44(18): p. 6149-6158.
70. R. Hong, J. M. Fernandez, H. Nakade, R. Arvizo, T. Emrick and V. M. Rotello, In situ observation of place exchange reactions of gold nanoparticles.
Correlation of monolayer structure and stability. Chemical Communications, 2006(22): p. 2347-2349.
71. T. J. Dougherty, C. J. Gomer, B. W. Henderson, G. Jori, D. Kessel, M. Korbelik, J. Moan and Q. Peng, Photodynamic therapy. Journal of the National Cancer Institute, 1998. 90(12): p. 889-905.
72. D. Mitton and R. Ackroyd, History of photodynamic therapy in Great Britain. Photodiagnosis and Photodynamic Therapy, 2005. 2(4): p. 239-246.
73. R. Ackroyd, C. Kelty, N. Brown and M. Reed, The history of photodetection and
photodynamic therapy. Photochemistry and Photobiology, 2001. 74(5): p. 656-669.
74. G. Jori, C. Fabris, M. Soncin, S. Ferro, O. Coppellotti, D. Dei, L. Fantetti, G. Chiti and G. Roneucci, Photodynamic therapy in the treatment of microbial
infections: Basic principles and perspective applications. Lasers in Surgery and Medicine, 2006. 38(5): p. 468-481.
75. U. O. Nseyo, J. DeHaven, T. J. Dougherty, W. R. Potter, D. L. Merrill, S. L. Lundahl and D. L. Lamm, Photodynamic therapy (PDT) in the treatment of
patients with resistant superficial bladder cancer: A long term experience. Journal of Clinical Laser Medicine & Surgery, 1998. 16(1): p. 61-68.
76. J. Usuda, H. Kato, T. Okunaka, K. Furukawa, H. Tsutsui, K. Yamada, Y. Suga, H. Honda, Y. Nagatsuka, T. Ohira, M. Tsuboi and T. Hirano, Photodynamic
therapy (PDT) for lung cancers. Journal of Thoracic Oncology, 2006. 1(5): p. 489-493.
77. S. M. Fien and A. R. Oseroff, Photodynamic therapy for non-melanoma skin
cancer. J Natl Compr Canc Netw, 2007. 5(5): p. 531-40. 78. J. Trachtenberg, A. Bogaards, R. A. Weersink, M. A. Haider, A. Evans, S. A.
McCluskey, A. Scherz, M. R. Gertner, C. Yue, S. Appu, A. Aprikian, J. Savard, B. C. Wilson and M. Elhilali, Vascular targeted photodynamic therapy with
palladium-bacteriopheophorbide photosensitizer for recurrent prostate cancer
following definitive radiation therapy: Assessment of safety and treatment
response. Journal of Urology, 2007. 178: p. 1974-1979. 79. N. M. Bressler, S. B. Bressler, L. A. Haynes, Y. Hao, P. K. Kaiser, J. W. Miller,
J. Naor, M. J. Potter, C. J. Pournaras, A. Reaves, P. J. Rosenfeld, U. Schmidt-Erfurth, J. S. Slakter, A. Strong and S. Vannier, Verteporfin therapy for

References
149
subfoveal choroidal neovascularization in age-related macular degeneration:
four-year results of an open-label extension of 2 randomized clinical trials: TAP
Report No. 7. Arch Ophthalmol, 2005. 123(9): p. 1283-5. 80. J. D. Macmillan, W. A. Maxwell and C. O. Chichester, Lethal photosensitization
of microorganisms with light from a continuous-wave gas laser. Photochem Photobiol, 1966. 5(7): p. 555-65.
81. J. S. Bellin, L. Lutwick and B. Jonas, Effects of Photodynamic Action on E Coli. Archives of Biochemistry and Biophysics, 1969. 132(1): p. 157-&.
82. J. E. Schneider, J. R. Phillips, Q. Pye, M. L. Maidt, S. Price and R. A. Floyd, Methylene-Blue and Rose-Bengal Photoinactivation of Rna Bacteriophages -
Comparative-Studies of 8-Oxoguanine Formation in Isolated Rna. Archives of Biochemistry and Biophysics, 1993. 301(1): p. 91-97.
83. R. Bonnett, Photosensitizers of the Porphyrin and Phthalocyanine Series for
Photodynamic Therapy. Chemical Society Reviews, 1995. 24(1): p. 19-33. 84. M. Wainwright, Photodynamic antimicrobial chemotherapy (PACT). Journal of
Antimicrobial Chemotherapy, 1998. 42(1): p. 13-28. 85. M. Wainwright, Methylene blue derivatives -- suitable photoantimicrobials for
blood product disinfection? International Journal of Antimicrobial Agents, 2000. 16(4): p. 381-394.
86. T. C. Oldham and D. Phillips, Flash photolysis of sensitizers in microbes. Journal of Physical Chemistry B, 1999. 103(43): p. 9333-9349.
87. F. Bohm, G. Marston, T. G. Truscott and R. P. Wayne, Fourier-Transform
Detection of Singlet Oxygen and Fluorescence from Cell-Membrane Bound
Porphyrins. Journal of the Chemical Society-Faraday Transactions, 1994. 90(17): p. 2453-2454.
88. L. W. Ma, J. Moan and K. Berg, Evaluation of a New Photosensitizer, Meso-
Tetra-Hydroxyphenyl-Chlorin, for Use in Photodynamic Therapy - a
Comparison of Its Photobiological Properties with Those of 2 Other
Photosensitizers. International Journal of Cancer, 1994. 57(6): p. 883-888. 89. F. Fischer, G. Graschew, H. J. Sinn, W. Maier-Borst, W. J. Lorenz and P. M.
Schlag, A chemical dosimeter for the determination of the photodynamic activity
of photosensitizers. Clinica Chimica Acta, 1998. 274(1): p. 89-104. 90. G. P. Tegos, T. N. Demidova, D. Arcila-Lopez, H. Lee, T. Wharton, H. Gali and
M. R. Hamblin, Cationic fullerenes are effective and selective antimicrobial
photosensitizers. Chemistry & Biology, 2005. 12(10): p. 1127-1135. 91. M. L. Embleton, S. P. Nair, B. D. Cookson and M. Wilson, Selective lethal
photosensitization of methicillin-resistant Staphylococcus aureus using an IgG-
tin(IV) chlorin e6 conjugate. Journal of Antimicrobial Chemotherapy, 2002. 50(6): p. 857-864.
92. N. Komerik, H. Nakanishi, A. J. MacRobert, B. Henderson, P. Speight and M. Wilson, In vivo killing of Porphyromonas gingivalis by toluidine blue-mediated
photosensitization in an animal model. Antimicrobial Agents and Chemotherapy, 2003. 47(3): p. 932-940.
93. M. Wilson, Photolysis of Oral Bacteria and Its Potential Use in the Treatment of
Caries and Periodontal-Disease. Journal of Applied Bacteriology, 1993. 75(4): p. 299-306.
94. Y. Itoh, Y. Ninomiya, S. Tajima and A. Ishibashi, Photodynamic therapy of
acne vulgaris with topical delta-aminolaevulinic acid and incoherent light in
Japanese patients. British Journal of Dermatology, 2001. 144(3): p. 575-579.

References
150
95. M. R. Hamblin, D. A. O'Donnell, N. Murthy, C. H. Contag and T. Hasan, Rapid
control of wound infections by targeted photodynamic therapy monitored by in
vivo bioluminescence imaging. Photochemistry and Photobiology, 2002. 75(1): p. 51-57.
96. M. C. Teichert, J. W. Jones, M. N. Usacheva and M. A. Biel, Treatment of oral
candidiasis with methylene blue-mediated photodynamic therapy in an
immunodeficient murine model. Oral Surgery Oral Medicine Oral Pathology Oral Radiology and Endodontics, 2002. 93(2): p. 155-160.
97. S. L. Rakestraw, W. E. Ford, R. G. Tompkins, M. A. J. Rodgers, W. P. Thorpe and M. L. Yarmush, Antibody-Targeted Photolysis - Invitro Immunological,
Photophysical, and Cytotoxic Properties of Monoclonal-Antibody Dextran
Sn(Iv) Chlorin-E6 Immunoconjugates. Biotechnology Progress, 1992. 8(1): p. 30-39.
98. H. M. Tang, M. R. Hamblin and C. M. N. Yow, A comparative in vitro
photoinactivation study of clinical isolates of multidrug-resistant pathogens. Journal of Infection and Chemotherapy, 2007. 13(2): p. 87-91.
99. M. E. Wieder, D. C. Hone, M. J. Cook, M. M. Handsley, J. Gavrilovic and D. A. Russell, Intracellular photodynamic therapy with photosensitizer-nanoparticle
conjugates: cancer therapy using a 'Trojan horse'. Photochemical & Photobiological Sciences, 2006. 5(8): p. 727-734.
100. A. C. Templeton, D. E. Cliffel and R. W. Murray, Redox and fluorophore
functionalization of water-soluble, tiopronin-protected gold clusters. Journal of the American Chemical Society, 1999. 121(30): p. 7081-7089.
101. Z. Malik, J. Hanania and Y. Nitzan, Bactericidal Effects of Photoactivated
Porphyrins - an Alternative Approach to Antimicrobial Drugs. Journal of Photochemistry and Photobiology B-Biology, 1990. 5(3-4): p. 281-293.
102. M. Wilson, Bactericidal effect of laser light and its potential use in the treatment
of plaque-related diseases. Int Dent J, 1994. 44(2): p. 181-9. 103. R. G. Palgrave and I. P. Parkin, Surfactant directed chemical vapour deposition
of gold nanoparticles with narrow size distributions. Gold Bulletin, 2008. 41(1): p. 66-69.
104. N. L. Rosi, D. A. Giljohann, C. S. Thaxton, A. K. R. Lytton-Jean, M. S. Han and C. A. Mirkin, Oligonucleotide-modified gold nanoparticles for intracellular
gene regulation. Science, 2006. 312: p. 1027-1030. 105. P. Christou, Rice transformation: bombardment. Plant Molecular Biology, 1997.
35(1-2): p. 197-203. 106. J. M. de la Fuente, C. C. Berry, M. O. Riehle and A. S. G. Curtis, Nanoparticle
targeting at cells. Langmuir, 2006. 22(7): p. 3286-3293. 107. R. P. Brinas, M. H. Hu, L. P. Qian, E. S. Lymar and J. F. Hainfeld, Gold
nanoparticle size controlled by polymeric Au(I) thiolate precursor size. Journal of the American Chemical Society, 2008. 130(3): p. 975-982.
108. D. G. Duff, A. Baiker and P. P. Edwards, A New Hydrosol of Gold Clusters .1.
Formation and Particle-Size Variation. Langmuir, 1993. 9(9): p. 2301-2309. 109. A. C. Templeton, S. W. Chen, S. M. Gross and R. W. Murray, Water-soluble,
isolable gold clusters protected by tiopronin and coenzyme A monolayers. Langmuir, 1999. 15(1): p. 66-76.
110. A. Mattoo and D. S. Goldfarb, Cystinuria. Seminars in Nephrology, 2008. 28(2): p. 181-191.
111. J. L. Domingo, Prevention by Chelating-Agents of Metal-Induced
Developmental Toxicity. Reproductive Toxicology, 1995. 9(2): p. 105-113.

References
151
112. A. M. Prieur and P. Quartier, Comparative tolerability of treatments for juvenile
idiopathic arthritis. Biodrugs, 2000. 14(3): p. 159-183. 113. K. G. Thomas and P. V. Kamat, Chromophore-functionalized gold
nanoparticles. Accounts of Chemical Research, 2003. 36(12): p. 888-898. 114. L. D'Ilario and A. Martinelli, Toluidine blue: aggregation properties and
structural aspects. Modelling and Simulation in Materials Science and Engineering, 2006. 14(4): p. 581-595.
115. V. Decraene, J. Pratten and M. Wilson, Cellulose acetate containing toluidine
blue and rose bengal is an effective antimicrobial coating when exposed to white
light. Applied and Environmental Microbiology, 2006. 72(6): p. 4436-4439. 116. G. H. Woehrle, J. E. Hutchison, S. Ozkar and R. G. Finke, Analysis of
nanoparticle Transmission Electron Microscopy data using a public-domain
image-processing program, Image. Turkish Journal of Chemistry, 2006. 30(1): p. 1-13.
117. M. Zheng and X. Y. Huang, Nanoparticles comprising a mixed monolayer for
specific bindings with biomolecules. Journal of the American Chemical Society, 2004. 126(38): p. 12047-12054.
118. H. Tang, J. H. Chen, L. H. Nie, Y. F. Kuang and S. Z. Yao, A label-free
electrochemical immunoassay for carcinoembryonic antigen (CEA) based on
gold nanoparticles (AuNPs) and nonconductive polymer film. Biosensors & Bioelectronics, 2007. 22(6): p. 1061-1067.
119. S. Basu, S. Panigrahi, S. Praharaj, S. K. Ghosh, S. Pande, S. Jana and T. Pal, Dipole-dipole plasmon interactions in self-assembly of gold organosol induced
by glutathione. New Journal of Chemistry, 2006. 30(9): p. 1333-1339. 120. J. Malicka, I. Gryczynski, C. D. Geddes and J. R. Lakowicz, Metal-enhanced
emission from indocyanine green: a new approach to in vivo imaging. Journal of Biomedical Optics, 2003. 8(3): p. 472-478.
121. S. Banfi, E. Caruso, L. Buccafurni, V. Battini, S. Zazzaron, P. Barbieri and V. Orlandi, Antibacterial activity of tetraaryl-porphyrin photosensitizers: An in
vitro study on Gram negative and Gram positive bacteria. Journal of Photochemistry and Photobiology B-Biology, 2006. 85(1): p. 28-38.
122. E. Dulkeith, A. C. Morteani, T. Niedereichholz, T. A. Klar, J. Feldmann, S. A. Levi, F. van Veggel, D. N. Reinhoudt, M. Moller and D. I. Gittins, Fluorescence
quenching of dye molecules near gold nanoparticles: Radiative and
nonradiative effects. Physical Review Letters, 2002. 89(20). 123. S. K. Ghosh, A. Pal, S. Kundu, S. Nath and T. Pal, Fluorescence quenching of 1-
methylaminopyrene near gold nanoparticles: size regime dependence of the
small metallic particles. Chemical Physics Letters, 2004. 395(4-6): p. 366-372. 124. X. S. Kou, S. Z. Zhang, Z. Yang, C. K. Tsung, G. D. Stucky, L. D. Sun, J. F.
Wang and C. H. Yan, Glutathione- and cysteine-induced transverse overgrowth
on gold nanorods. Journal of the American Chemical Society, 2007. 129(20): p. 6402-+.
125. A. Pastore, G. Federici, E. Bertini and F. Piemonte, Analysis of glutathione:
implication in redox and detoxification. Clinica Chimica Acta, 2003. 333(1): p. 19-39.
126. R. Hong, G. Han, J. M. Fernandez, B. J. Kim, N. S. Forbes and V. M. Rotello, Glutathione-mediated delivery and release using monolayer protected
nanoparticle carriers. Journal of the American Chemical Society, 2006. 128(4): p. 1078-1079.

References
152
127. T. G. Schaaff, G. Knight, M. N. Shafigullin, R. F. Borkman and R. L. Whetten, Isolation and selected properties of a 10.4 kDa Gold : Glutathione cluster
compound. Journal of Physical Chemistry B, 1998. 102(52): p. 10643-10646. 128. T. G. Schaaff and R. L. Whetten, Giant gold-glutathione cluster compounds:
Intense optical activity in metal-based transitions. Journal of Physical Chemistry B, 2000. 104(12): p. 2630-2641.
129. Y. Negishi, K. Nobusada and T. Tsukuda, Glutathione-protected gold clusters
revisited: Bridging the gap between gold(I)-thiolate complexes and thiolate-
protected gold nanocrystals. Journal of the American Chemical Society, 2005. 127(14): p. 5261-5270.
130. Y. Negishi, Y. Takasugi, S. Sato, H. Yao, K. Kimura and T. Tsukuda, Magic-
numbered Au-n clusters protected by glutathione monolayers (n=18, 21, 25, 28,
32, 39): Isolation and spectroscopic characterization. Journal of the American Chemical Society, 2004. 126(21): p. 6518-6519.
131. N. Damrongchai, K. Yun, E. Kobatake and M. Aizawa, Self-assembling of
glutathione S-transferase/calmodulin fusion protein on chemically modified gold
surface. Journal of Biotechnology, 1997. 55(2): p. 125-133. 132. C. F. Shaw, Gold-based therapeutic agents. Chemical Reviews, 1999. 99(9): p.
2589-2600. 133. D. J. LeBlanc, R. W. Smith, Z. X. Wang, H. E. HowardLock and C. J. L. Lock,
Thiomalate complexes of gold(I): preparation, characterization and crystal
structures of 1:2 gold to thiomalate complexes. Journal of the Chemical Society-Dalton Transactions, 1997(18): p. 3263-3267.
134. B. D. Berezin, Coordination Compounds of Porphyrins ans Phthalocyanines. 1981, Chichester U.K.: John Wiley & Sons.
135. M. L. Yarmush, W. P. Thorpe, L. Strong, S. L. Rakestraw, M. Toner and R. G. Tompkins, Antibody-Targeted Photolysis. Critical Reviews in Therapeutic Drug Carrier Systems, 1993. 10(3): p. 197-252.
136. S. B. Brown, E. A. Brown and I. Walker, The present and future role of
photodynamic therapy in cancer treatment. Lancet Oncology, 2004. 5(8): p. 497-508.
137. M. J. Hostetler, J. E. Wingate, C. J. Zhong, J. E. Harris, R. W. Vachet, M. R. Clark, J. D. Londono, S. J. Green, J. J. Stokes, G. D. Wignall, G. L. Glish, M. D. Porter, N. D. Evans and R. W. Murray, Alkanethiolate gold cluster molecules
with core diameters from 1.5 to 5.2 nm: Core and monolayer properties as a
function of core size. Langmuir, 1998. 14(1): p. 17-30. 138. A. M. Awawdeh and H. J. Harmon, Spectrophotometric detection of
pentachlorophenol (PCP) in water using immobilized and water-soluble
porphyrins. Biosensors & Bioelectronics, 2005. 20(8): p. 1595-1601. 139. D. V. Leff, P. C. Ohara, J. R. Heath and W. M. Gelbart, Thermodynamic Control
of Gold Nanocrystal Size - Experiment and Theory. Journal of Physical Chemistry, 1995. 99(18): p. 7036-7041.
140. E. S. Shibu, M. A. H. Muhammed, T. Tsukuda and T. Pradeep, Ligand exchange
of Au(25)SG(18) leading to functionalized gold clusters: Spectroscopy, kinetics,
and luminescence. Journal of Physical Chemistry C, 2008. 112(32): p. 12168-12176.
141. C. Burns, W. U. Spendel, S. Puckett and G. E. Pacey, Solution ionic strength
effect on gold nanoparticle solution color transition. Talanta, 2006. 69(4): p. 873-876.

References
153
142. J. Turkevich, P. C. Stevenson and J. Hillier, The Formation of Colloidal Gold. Journal of Physical Chemistry, 1953. 57(7): p. 670-673.
143. L. M. Liz-Marzan, Tailoring surface plasmons through the morphology and
assembly of metal nanoparticles. Langmuir, 2006. 22(1): p. 32-41. 144. B. Khlebtsov, V. Zharov, A. Melnikov, V. Tuchin and N. Khlebtsov, Optical
amplification of photothermal therapy with gold nanoparticles and nanoclusters. Nanotechnology, 2006. 17(20): p. 5167-5179.
145. N. G. Khlebtsov, V. A. Bogatyrev, L. A. Dykman and A. G. Melnikov, Spectral
extinction of colloidal gold and its biospecific conjugates. Journal of Colloid and Interface Science, 1996. 180(2): p. 436-445.
146. G. Bertoloni, F. M. Lauro, G. Cortella and M. Merchat, Photosensitizing activity
of hematoporphyrin on Staphylococcus aureus cells. Biochimica Et Biophysica Acta-General Subjects, 2000. 1475(2): p. 169-174.
147. C. Deroe, P. J. Courtoy and P. Baudhuin, A Model of Protein Colloidal Gold
Interactions. Journal of Histochemistry & Cytochemistry, 1987. 35(11): p. 1191-1198.
148. J. Gil-Tomas, S. Tubby, I. P. Parkin, N. Narband, L. Dekker, S. P. Nair, M. Wilson and C. Street, Lethal photosensitisation of Staphylococcus aureus using
a toluidine blue O-tiopronin-gold nanoparticle conjugate. Journal of Materials Chemistry, 2007. 17(35): p. 3739-3746.
149. B. V. Enustun and J. Turkevich, Coagulation of Colloidal Gold. Journal of the American Chemical Society, 1963. 85(21): p. 3317-&.
150. P. K. Sudeep, B. I. Ipe, K. G. Thomas, M. V. George, S. Barazzouk, S. Hotchandani and P. V. Kamat, Fullerene-functionalized gold nanoparticles. A
self-assembled photoactive antenna-metal nanocore assembly. Nano Letters, 2002. 2(1): p. 29-35.
151. A. Ianoul and A. Bergeron, Spatially inhomogeneous enhancement of
fluorescence by a monolayer of silver nanoparticles. Langmuir, 2006. 22(24): p. 10217-10222.
152. N. Chandrasekharan, P. V. Kamat, J. Hu and G. Jones, Dye-Capped Gold
Nanoclusters: Photoinduced Morphological Changes in Gold/Rhodamine 6G
Nanoassemblies. J. Phys. Chem. B, 2000. 104(47): p. 11103-11109. 153. D. C. Hone, P. I. Walker, R. Evans-Gowing, S. FitzGerald, A. Beeby, I.
Chambrier, M. J. Cook and D. A. Russell, Generation of cytotoxic singlet
oxygen via phthalocyanine-stabilized gold nanoparticles: A potential delivery
vehicle for photodynamic therapy. Langmuir, 2002. 18(8): p. 2985-2987. 154. S. Link and M. A. El-Sayed, Spectral properties and relaxation dynamics of
surface plasmon electronic oscillations in gold and silver nanodots and
nanorods. Journal of Physical Chemistry B, 1999. 103(40): p. 8410-8426. 155. B. Dubertret, M. Calame and A. J. Libchaber, Single-mismatch detection using
gold-quenched fluorescent oligonucleotides. Nature Biotechnology, 2001. 19(4): p. 365-370.
156. S. J. Chen and H. T. Chang, Nile red-adsorbed gold nanoparticles for selective
determination of thiols based on energy transfer and aggregation. Analytical Chemistry, 2004. 76(13): p. 3727-3734.
157. A. K. Dutta, K. Kamada and K. Ohta, Spectroscopic studies of nile red in
organic solvents and polymers. Journal of Photochemistry and Photobiology a-Chemistry, 1996. 93(1): p. 57-64.

References
154
158. S. M. Saraiva and J. F. de Oliveira, Control of particle size in the preparation of
colloidal gold. Journal of Dispersion Science and Technology, 2002. 23(6): p. 837-844.
159. A. M. Iga, J. H. P. Robertson, M. C. Winslet and A. M. Seifalian, Clinical
potential of quantum dots. Journal of Biomedicine and Biotechnology, 2007. 160. F. F. Yang, J. S. Yu and Y. Xie, Synthesis and characterization of water-soluble
CdSe/CdS/ZnS core-shell quantum dots. Chinese Journal of Inorganic Chemistry, 2008. 24(7): p. 1142-1147.
161. V. Biju, T. Itoh, A. Anas, A. Sujith and M. Ishikawa, Semiconductor quantum
dots and metal nanoparticles: syntheses, optical properties, and biological
applications. Analytical and Bioanalytical Chemistry, 2008. 391(7): p. 2469-2495.
162. J. M. Klostranec and W. C. W. Chan, Quantum dots in biological and
biomedical research: Recent progress and present challenges. Advanced Materials, 2006. 18(15): p. 1953-1964.
163. R. E. Bailey, A. M. Smith and S. M. Nie, Quantum dots in biology and
medicine. Physica E-Low-Dimensional Systems & Nanostructures, 2004. 25(1): p. 1-12.
164. W. R. Algar and U. J. Krull, Quantum dots as donors in fluorescence resonance
energy transfer for the bioanalysis of nucleic acids, proteins, and other
biological molecules. Analytical and Bioanalytical Chemistry, 2008. 391(5): p. 1609-1618.
165. T. Jamieson, R. Bakhshi, D. Petrova, R. Pocock, M. Imani and A. M. Seifalian, Biological applications of quantum dots. Biomaterials, 2007. 28(31): p. 4717-4732.
166. J. F. Weng and J. C. Ren, Luminescent quantum dots: A very attractive and
promising tool in biomedicine. Current Medicinal Chemistry, 2006. 13(8): p. 897-909.
167. A. R. Clapp, I. L. Medintz, J. M. Mauro, B. R. Fisher, M. G. Bawendi and H. Mattoussi, Fluorescence resonance energy transfer between quantum dot donors
and dye-labeled protein acceptors. Journal of the American Chemical Society, 2004. 126(1): p. 301-310.
168. D. M. Willard and A. Van Orden, Quantum dots - Resonant energy-transfer
sensor. Nature Materials, 2003. 2(9): p. 575-576. 169. M. R. Hamblin and T. Hasan, Photodynamic therapy: a new antimicrobial
approach to infectious disease? Photochemical & Photobiological Sciences, 2004. 3(5): p. 436-450.
170. G. Jori, Photodynamic therapy of microbial infections: State of the art and
perspectives. Journal of Environmental Pathology Toxicology and Oncology, 2006. 25(1-2): p. 505-519.
171. M. L. Embleton, S. P. Nair, W. Heywood, D. C. Menon, B. D. Cookson and M. Wilson, Development of a novel targeting system for lethal photo sensitization
of antibiotic-resistant strains of Staphylococcus aureus. Antimicrobial Agents and Chemotherapy, 2005. 49(9): p. 3690-3696.
172. T. N. Demidova and M. R. Hamblin, Photodynamic therapy targeted to
pathogens. International Journal of Immunopathology and Pharmacology, 2004. 17(3): p. 245-254.
173. F. Harris, L. K. Chatfield and D. A. Phoenix, Phenothiazinium based
photosensitisers - Photodynamic agents with a multiplicity of cellular targets
and clinical applications. Current Drug Targets, 2005. 6(5): p. 615-627.

References
155
174. M. Wainwright, D. A. Phoenix, J. Marland, D. R. A. Wareing and F. J. Bolton, A study of photobactericidal activity in the phenothiazinium series. Fems Immunology and Medical Microbiology, 1997. 19(1): p. 75-80.
175. M. Wilson, Lethal photosensitisation of oral bacteria and its potential
application in the photodynamic therapy of oral infections. Photochemical & Photobiological Sciences, 2004. 3(5): p. 412-418.
176. A. C. S. Samia, X. B. Chen and C. Burda, Semiconductor quantum dots for
photodynamic therapy. Journal of the American Chemical Society, 2003. 125(51): p. 15736-15737.
177. W. W. Yu, E. Chang, R. Drezek and V. L. Colvin, Water-soluble quantum dots
for biomedical applications. Biochemical and Biophysical Research Communications, 2006. 348(3): p. 781-786.
178. B. R. Fisher, H. J. Eisler, N. E. Stott and M. G. Bawendi, Emission intensity
dependence and single-exponential behavior in single colloidal quantum dot
fluorescence lifetimes. Journal of Physical Chemistry B, 2004. 108(1): p. 143-148.
179. I. L. Medintz, S. A. Trammell, H. Mattoussi and J. M. Mauro, Reversible
modulation of quantum dot photoluminescence using a protein-bound
photochromic fluorescence resonance energy transfer acceptor. Journal of the American Chemical Society, 2004. 126(1): p. 30-31.
180. R. Bakalova, H. Ohba, Z. Zhelev, M. Ishikawa and Y. Baba, Quantum dots as
photosensitizers? Nature Biotechnology, 2004. 22(11): p. 1360-1361. 181. M. M. Mathews, Comparative Study of Lethal Photosensitization of Sarcina
Lutea by 8-Methoxypsoralen and by Toluidine Blue. Journal of Bacteriology, 1963. 85(2): p. 322.
182. A. J. Gomes, L. O. Lunardi, J. M. Marchetti, C. N. Lunardi and A. C. Tedesco, Indocyanine green nanoparticles useful for photomedicine. Photomedicine and Laser Surgery, 2006. 24(4): p. 514-521.
183. L. X. Shi, B. Hernandez and M. Selke, Singlet oxygen generation from water-
soluble quantum dot-organic dye nanocomposites. Journal of the American Chemical Society, 2006. 128(19): p. 6278-6279.
184. M. Ozkan, Quantum dots and other nanoparticles: what can they offer to drug
discovery? Drug Discovery Today, 2004. 9(24): p. 1065-1071.