Embed Size (px)
Citation preview
Pharmacokinetics
Nanoparticle Accumulation in Angiogenic Tissues: Towards Predictable Pharmacokinetics
Kristin Yaehne , Amy Tekrony , Aisling Clancy , Yiota Gregoriou , John Walker , Kwin Dean , Trinh Nguyen , Amber Doiron , Kristina Rinker , Xiao Yu Jiang , Sarah Childs , and David Cramb *
Nanoparticles are increasingly used in medical applications such as drug delivery, imaging, and biodiagnostics, particularly for cancer. The design of nanoparticles for tumor delivery has been largely empirical, owing to a lack of quantitative data on angiogenic tissue sequestration. Using fl uorescence correlation spectroscopy, the deposition rate constants of nanoparticles into angiogenic blood vessel tissue are determined. It is shown that deposition is dependent on surface charge. Moreover, the size dependency strongly suggests that nanoparticles are taken up by a passive mechanism that depends largely on geometry. These fi ndings imply that it is possible to tune nanoparticle pharmacokinetics simply by adjusting nanoparticle size.
1. Introduction
Nanoparticles have increasing utility as drug delivery vehi-
cles and diagnostic imaging agents, particularly for treating
cancer. Such nanotherapeutic approaches exploit the
enhanced permeability and retention (EPR) effect, [ 1 ] whereby
© 2013 Wiley-VCH Verlag Gmb
DOI: 10.1002/smll.201201848
K. Yaehne, A. Tekrony, A. Clancy, Dr. Y. Gregoriou, J. Walker, K. Dean, T. Nguyen, Prof. D. CrambDepartment of Chemistry2500 University Dr NWUniversity of CalgaryCalgary, Alberta, Canada, T2N 1N4 E-mail: [email protected]
Dr. A. Doiron, Prof. K. RinkerDepartment of Chemical and Petroleum EngineeringSchulich School of Engineering2500 University Dr NWUniversity of CalgaryCalgary, Alberta, Canada, T2N 1N4
X. Y. Jiang, Prof. S. ChildsDepartment of Biochemistry and Molecular BiologyFaculty of MedicineHealth Sciences Centre3330 Hospital Drive, NWUniversity of CalgaryCalgary, Alberta, Canada, T2N 4N1
small 2013, DOI: 10.1002/smll.201201848
nanoparticles become sequestered in angiogenic tissues sur-
rounding growing tumors. Nanoparticle accumulation into
tissues via the EPR effect is partly due to the leakiness of the
newly forming (angiogenic) blood vessels of cancerous tissues
and partly due to poor lymphatic drainage in growing tumors.
For the former, it has been demonstrated that in angiogen-
esis, the endothelial cells comprising the blood vessel walls
do not seal tightly against each other, leaving fenestrations
through which small species can pass. These fenestrations
are approximately 200–800 nm in diameter [ 2 ] and thus nano-
particles smaller than this size are desirable as vehicles for
angiogenesis-related drug delivery. [ 3–10 ] A critical component
to understand and optimize for drug delivery is the physico-
chemical properties of a nanoparticle which can predict their
pharmacokinetics and accumulation in tumors. Predictively
modeling how a given nanocarrier biodistributes relies upon
an accurate understanding of its tissue interactions in various
organs, which can be approximated as compartments in the
organism. Since such predictive pharmacokinetic models for
sequestration of nanoparticles into angiogenic tissues are
unavailable, much of the nanoparticle delivery vehicle devel-
opment has necessarily been empirical. [ 11–19 ] Quantitative
data that relate the size and charge of nanoparticles to rate
constants for bioacummulation in angiogenic tissues would
represent an excellent fi rst step towards holistic, predictive
pharmacokinetics. Such data would allow the refi nement of
nanoparticle deposition mechanisms and thus generate more
1H & Co. KGaA, Weinheim wileyonlinelibrary.com

K. Yaehne et al.full papers
predicitive pharmacokinetic models. These models will facili-tate both rational drug delivery agent design and a predic-
tive understanding of nanotoxicity. It is the aim of the present
study to present quantitative data that connects specifi c nan-
oparticle properties to deposition rates in angiogenic tissues.
To avoid confusion, we propose the following defi nitions.
‘Deposition’ will mean the accumulation of nanoparticles
in angiogenic tissues. This could mean surface deposition or
nanoparticles entering the tissues. ‘Uptake’ will only be used
for denoting when nanoparticles enter individual cells.
One of the major challenges in developing predictive
models for bioaccumulation of nanoparticles, particularly with
respect to tumors, is representing the anatomic complexity of
the physiologic environment. This is particularly problematic
when attempting to separate the effects of various angiogenic
characteristics, such as fenestration size, local blood fl ow and
local blood pressure on NP accumulation. [ 20 ] The very prop-
erty of mammalian orthotopic models that makes them pow-
erful mimics of tumors, makes them extremely challenging to
use as quantitative predictors of accumulation. For deconvo-
lution of the nanoparticle deposition kinetics into angiogenic
tissues from tumor distribution and/or sequestration into
the reticuloendothelial system (RES), the chicken embryo
chorioallantoic membrane (CAM) provides an excellent
platform. [ 21 , 22 ] The CAM is an extra-embryonic organ that
functions as the embryo’s lung and provides a large blood
volume connected primarily to angiogenic blood vessels
until day 14 post fertilization (PF). [ 22 ] Moreover, since the
immune system of the chicken embryo is relatively undevel-
oped up to 14 days PF; immune responses to nanoparticles
in the blood stream are minimal. Finally, the CAM expresses
both VEGF-C and the VEGF receptor in the blood vessel
endothelial cells during angiogenesis. [ 22 ] We propose that the
CAM model could be a fi rst screening system for assessing
nanoparticle pharmacokinetics (PK) as this biological system
is more complex than a cell culture model, but is simpler to
use and easier to maintain and grow than a full animal model.
Using the CAM model, we would be able to narrow down
candidate nanoparticle formulations that could undergo a
full evaluation in an orthotopically implanted tumor rodent
model. It has been proposed that it is diffi cult to evaluate
the large amount of different nanoparticle formulations in
animal models in a timely manner. Therefore, novel screening
tools are required to speed the evaluation of potential nano-
particle candidates for in vivo applications. [ 23 ] The CAM is a
powerful tool for understanding, quantitatively and predic-
tively, the behavior of nanoparticles in an angiogenic environ-
ment relevant to tumor drug delivery. Moreover, we suggest
that by using this simple model, one will fi ll a knowledge gap
in the dependence of nanoparticle properties on uptake into
angiogenic tissues.
Presently, nanoparticle bioaccumulation PK models have
only been developed for mature, healthy organisms lacking
angiogenic blood vessels. The most realistic model predicted
quantum dot (QD) distribution in healthy mature rodents
and compared results with literature data. [ 24 ] The blood-
fl ow-limited physiologically based pharmacokinetic (PBPK)
model predicted liver deposition to within 30% of the experi-
mental data but predicted blood and kidney levels with lower
2 www.small-journal.com © 2013 Wiley-VCH
accuracy (greater than 50% difference from experiment),
suggesting that more specifi c tissue interaction mechanisms
need to be developed. Issues surrounding the modeling of
absorption, distribution, metabolism and excretion (ADME)
of nanoparticle drug carriers have been reviewed by Zolnik
and Sadrieh. [ 25 ] Their review again indicated that more spe-
cifi c mechanism-based guidelines are needed to predict the
effi cacy/risk balance in the development of nanotechnology-
derived therapeutics with particular emphasis on delivery via
angiogenic tissues. As we will see, the work presented in our
study has provided a mechanistic understanding of NP des-
position critical to application of PK models to drug delivery.
Our study provides quantitative relationships between NP
properties and deposition rates not previously available.
Previous nanoparticle deposition studies have exam-
ined nanoparticle size versus circulation half-life in animal
models [ 26 , 27 ] and in the chicken embryo. [ 28 , 29 ] The fi rst nano-
particle size study, performed by Yuan et al. [ 27 ] examined
size-dependent permeability of small nanoparticles (2–5
nm diameter proteins and 90 nm diameter PEGylated lipo-
somes) into xenografted human tumors in mice. There was
a slight decline in permeability to the larger liposomes com-
pared with the protein particles. In another example, Lewis
et al. examined the utility of cowpea mosaic virus (30 nm
diameter, CPMV) for intravital imaging of angiogenic tis-
sues. [ 28 ] They saw direct evidence of nanoparticle uptake into
vascular endothelial cells of the chicken embryo CAM and
compared native CPMV, PEGylated CPMV and 40 nm diam-
eter fl uospheres. The latter two nanoparticles showed lower
absolute uptake. No estimate of CPMV surface charge was
given. In another study, Smith et al. examined a series of QDs
injected into the CAM blood stream and found that there
was longer persistence of aminoPEG dots versus polyacrylic
acid QDs [ 29 ] suggesting greater deposition of aminoPEG QDs
into the endothelium. Dreher et al. examined a size series of
dextran nanoparticles for their propensity to accumulate in
mice tumor models [ 30 ] and found an anticorrelation between
nanoparticle size and angiogenic vascular permeability. More
recently, Bawendi and co-workers [ 26 ] designed a size series
of QD-based nanoparticles (12, 60 and 125 nm diameter) to
image tumors in mice and showed that the main difference in
the particles’ behavior was due to size. They tracked the dis-
tance from the tumor blood vessel wall and found that only
the 12 nm particle traveled any signifi cant distance, 100 mm
in 120 min. Many of the above studies measure the convo-
lution of nanoparticle propensity to extravasate and subse-
quently disperse in surrounding tissue with size and charge.
Therefore, it is challenging to use these results in a quanti-
tatively predictive model without fi rst deconvoluting the two
processes.
In the current study, we use a fl uorescence-based assay
to measure the effects of NP properties on deposition into
the angiogenic tissues of the CAM. It is possible to quanti-
tiatively determine nanoparticle deposition kinetics if the
concentration of nanoparticles can be measured in the blood
stream. Fluorescence-based measurement of nanoparticle
concentration in the blood stream is not trivial. Using direct
fl uorescence intensities may give misleading information, as
aggregation of nanoparticles may not change the average
Verlag GmbH & Co. KGaA, Weinheim small 2013, DOI: 10.1002/smll.201201848

Nanoparticle Accumulation in Angiogenic Tissues
Figure 1 . a) Microscope set-up for micro-injection into and fl uorescence correlation spectroscopy measurements of chicken embryo blood vessels. (See text for details of experiment). b) Example of nanoparticle solution injection into a CAM blood vessel. Note the laminar fl ow of the clear injectate solution. c) Confocal fl uorescence image of a fi xed blood vessel that was injected with QDs. The sample shows a venule of approximately 70 μ m inner diameter that was extracted from an embryo following systemic injection of 300 μ L of 40 nM amino605 QD solution. Fluorescence is evident on the one side of the blood vessel but less apparent on the opposite side. The sample was fi xed 10 minutes after injection.
fl uorescence rate. However, fl uorescence
correlation spectroscopy (FCS) reports
on aggregation of nanoparticles in solu-
tion [ 31 , 32 ] and therefore provides a method
to measure accurately nanoparticle con-
centration in the blood, as we have pre-
viously demonstrated. [ 31 ] Briefl y, FCS
measures and correlates fl uctuations in
fl uorescence intensity from a well-defi ned
volume of excited molecules, where the
fl uctuations result from a changing number
of fl uorescence emitters (fl uorophores)
within the volume. Thus, any phenomenon
that alters the number or diffusion behav-
iour of fl uorophores within the volume
will induce a change in the time depend-
ence of fl uorescence intensity fl uctuations
around the average. These effects arise
from simple diffusion, fl ow, chemical reac-
tivity, aggregation, or photochemistry. The
time scales of the fl uctuations are related
to the kinetic rates of the phenomena.
The goal of the current study is to
quantitatively determine the contribution
of nanoparticle size and charge to bioac-
cumulation in the CAM angiogenic tissues,
as this can then inform the development
of nanoparticle-based drug delivery and
diagnostic imaging vehicles. To our knowl-
edge, there is no study that covers the
range of nanoparticles investigated here
and that separates NPs exiting the blood
vessels from local tumor distribution. It
is challenging to develop a single type of
nanoparticle with broadly tunable size
and charge. Therefore, we chose to study
a series of different types of nanoparticles
(polymer coated quantum dots, QDs, polystyrene nanospheres
and liposomes) that provide a range in diameter from 24–500
nm and in surface zeta potential from ∼ 40 mV to − 66 mV. We
have employed the chicken embryo CAM as our primary
angiogenic tissue model organism and also have examined
nanoparticle charge effects in zebrafi sh embryos and cultured
human umbilical vein endothelial cells (HUVEC). We have
measured nanoparticle deposition kinetics and distributions
and related the quantitiative data to nanoparticle proper-
ties in an attempt to provide broad ranging insight into the
mechanism of deposition into angiogenic tissues. Our results
suggest that one can tune the angiogenesis-related NP phar-
macokinetics by size, regardless of the nanoparticle chemistry.
2. Results and Discussion
2.1. Nanoparticle Charge and Accumulation in Angiogenic Tissues
Imaging of microinjection of nanoparticle solutions into the
CAM blood vessels provided preliminary insight into charge
© 2013 Wiley-VCH Verlag Gmbsmall 2013, DOI: 10.1002/smll.201201848
effects. Figure 1 shows the microscope set-up (Figure 1 a) and
results of a typical injection (Figure 1 b,c) into a moderate
sized blood vessel ( ∼ 150 μ m diameter, Figure 1 b). Near the
injection points, fl ow was generally laminar as indicated by
the streamlines of clear fl uid. Mixing occurs further down-
stream where blood vessels are more serpentine. Fluores-
cence imaging of the CAM (Figure 1 c) reveals that amino605
CdSe/ZnS QDs (amino terminated polyethylene glycol, emis-
sion maximum 605 nm, ζ = − 10 mV) are localized to the wall
of a CAM venule, preferentially on one side of the vessel.
This non-uniform vessel wall deposition could be attributed
to the distribution of injectate solution immediately down-
stream of the injection site where the injectate encountered
only one side of the venule. This qualitative, rapid redistri-
bution behavior occurred only for particles that had small
negative to positive zeta potential charge ( − 10 to + 41 mV,
Table 1 ).
It is important to note the slight negative potential of the
amine-terminated particles. This range of zeta potential meas-
urements for amine-functionalized polystyrene NPs is not
uncommon. [ 33 ] It was suggested by Roebben et al. that soni-
cation, while necessary to maintain a monodisperse sample,
3www.small-journal.comH & Co. KGaA, Weinheim

K. Yaehne et al.
4
full papers Table 1. Blood deposition rate constants, hydrodynamic radii and zeta potentials of nanoparticles.
Nanoparticle k fast [s − 1 ]
k slow [s − 1 ]
r H [nm]
ζ ± std dev [mV]
QD-AminoPEG 605 2.42 0.02 12 − 10 ± 5
QD-Methoxy 605 0.01 0.01 13 − 15 ± 5
QD-Carboxy 605 0.04 0.01 14 − 25 ± 7
DOTAP Lipsosomes > 3 – 55 41 ± 11
DOPC Liposomes 0.003/0.002 – 50/82 − 40 ± 10
Amino Polystyrene nanosphere > 3 100 − 10 ± 5
Carboxy Polystyrene nanosphere 0.02 – 20 − 66 ± 12
Carboxy Polystyrene nanosphere 0.003 – 50 − 60 ± 11
Carboxy Polystyrene nanosphere 0.002 – 100 − 53 ± 7
Carboxy Polystyrene nanosphere no loss No loss 250 − 50 ± 5
could degrade the surface chemistry and remove surface
species. It is also possible that for amino-PEG coated nano-
particles, the amine termination does not completely com-
pensate for the negative charge of the PEG. Zeta potential
Figure 2 . Distribution pattern of Amino- and Carboxy-terminated quantum dots in Zebrafi sh Caudal Tail Plexus. In all panels green represents GFP expressed in endothelial cells, while red represents Quantum dots (A,B). The ventral-most vessel of the caudal tail plexus in a 53 hpf zebrafi sh embryo 0.5 hours post-injection of quantum dots is portrayed in uninjected animals. C) Injected amino-terminated quantum dots (Amino-QD) form a visible punctate pattern along the vessel walls 30 minutes after injection (white arrows). D) At the same timepoint, a large portion of injected Carboxy-QDs remain circulating in the lumen, often in large aggregates of the Carboxy-QD (blue arrows). Circulating aggregates are rarely observed in Amino-QD injected embryos. E) and F) are overlays for the amino-QD and carboxy-QD and GFP images, respectively.
measurements are not an absolute indica-
tion of surface charge but do give a rela-
tive idea of particle charge in relation to
other particles, which we can use to pre-
dict the behaviour of the NPs.
To determine whether or not this charge
dependent, fast accumulation is specifi c to
the CAM blood vessels, analogous experi-
ments were performed using the zebrafi sh
embryo as an alternate model for angio-
genesis. Zebrafi sh embryos were injected
with equivalent concentrations of nano-
particles (quantum dots) that had either
amino-PEG or carboxy-poly acrylic acid
terminated surfaces ( ζ = − 10 and − 22 mV,
respectively) to assess qualitatively, charge
dependent accumulation behavior. The
distribution and dynamics of the quantum
dots were examined using confocal micro-
scopy imaging of live embryos. Figure 2
displays the fl uorescence confocal micro-
scopy images of zebrafi sh embryo blood
vessels. The amino-terminated quantum
dots were observed to adhere more quickly
to the endothelial layer of the blood ves-
sels. This was evidenced by the immediate
and lasting small punctate nature of the
red channel images, which has been shown
to indicate cellular internalization of fl uo-
rescent particles. [ 34–39 ] By contrast, similar
punctate patterns were not observed for
the carboxy-terminated quantum dots
in the short term. Larger clusters of red
signal may be evidence of quantum dots
in the lumen of the blood vessels, since
the fl ow is quite slow in the tortuous small
vessels.
www.small-journal.com © 2013 Wiley-VCH V
HUVEC were used as a system to examine the inter-
action of nanoparticles of differing charge directly with
endothelial cells. We compared amino- ( ζ = − 10 mV) and car-
boxy- ( ζ = − 53 mV) terminated 200 nm diameter polystyrene
erlag GmbH & Co. KGaA, Weinheim small 2013, DOI: 10.1002/smll.201201848
Nanoparticle Accumulation in Angiogenic Tissues
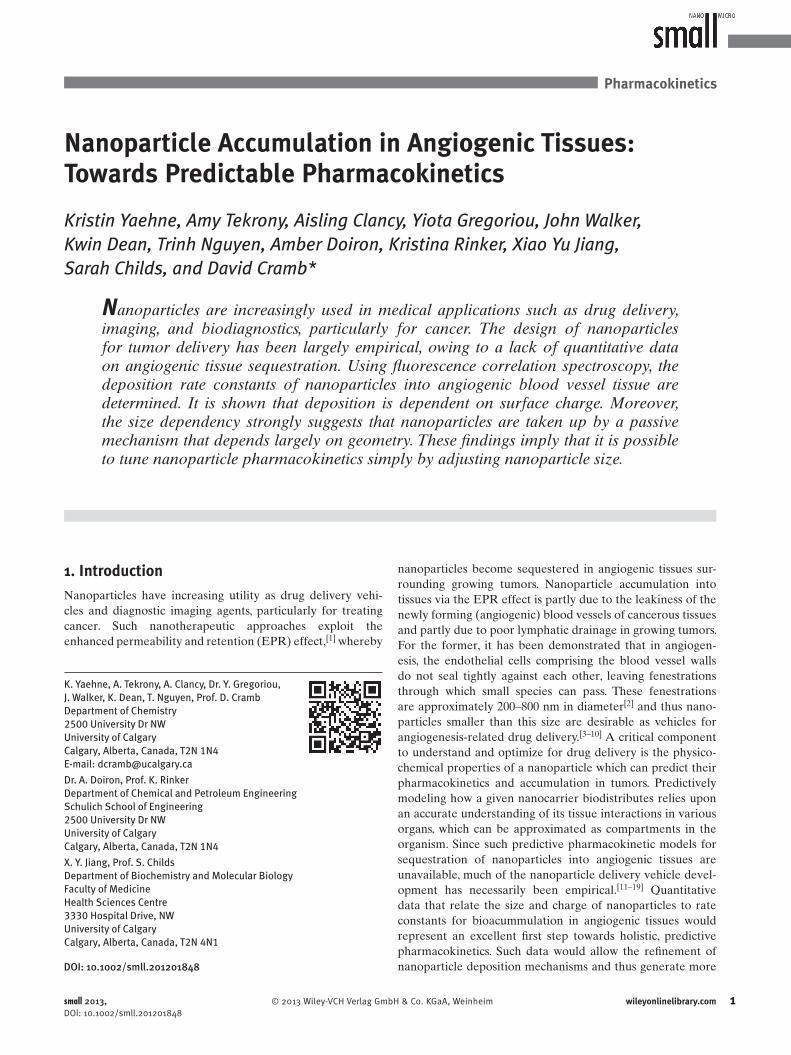
Figure 3 . HUVEC grown on a thin coating of collagen and exposed to 200 nm polystyrene nanoparticles. A,B) Confocal microscopy images of cells exposed for one hour to amino-modifi ed particles (A) and carboxy-modifi ed particles (B), from left to right of cell membrane stained with CellMask, nuclei stained with Hoechst, red nanoparticles, and the overlay of the three. Scale bar applies to all images and denotes 50 μ m. C,D) Number of adherent and internalized particles over time per cell surface area (n = 3). Cells were incubated at 37 ˚C with either positive (C) or negative (D) particles, and fl uorescence intensity was measured. The goodness of fi t (R 2 ) for each fi tted curve is 0.935 (C) and 0.911 (D).
nanoparticle (at equivalent concentrations) uptake behavior,
as shown in confocal microscopy images in panels A and
B of Figure 3 . It can be seen that the particles are brighter
in panel A than they are in panel B, indicating increased
adsorption of the amino-terminated polystyrene spheres over
the carboxy-terminated ones. In addition, from panels C and
D in Figure 3 , we found that the adsorption rate for amino-
terminated spheres was 1.3 × 10 7 M − 1 s − 1 , whereas the car-
boxy-terminated spheres was 1.8 × 10 6 M − 1 s − 1 (see Section
S3, Supporting Information for deposition rate measurement
details). Intuitively, this difference in rates can be observed in
the y-axis by the larger number of amino particles per surface
area in comparison to the carboxy-terminated particles. Thus
the less negative nanoparticles show a 10x faster adherence to
the endothelial cells, supporting our hypothesis that a similar
charge selection for fast adhesion to the endothelium occurs
in the chicken embryo and zebrafi sh embryo. Moreover, the
punctate nature of internalization is evident in this fi gure.
We next set out to measure quantitatively nanoparticle
deposition kinetics in the CAM and determine how charge
and size infl uence rate constants. Thus, a time series of auto-
correlation decays (ACDs) were measured shortly after
systemic injections of nanoparticles into large vessels signifi -
cantly upstream of the region of interrogation. Systemic injec-
tions with subsequent 3-minute circulation time were found
© 2013 Wiley-VCH Verlag Gmbsmall 2013, DOI: 10.1002/smll.201201848
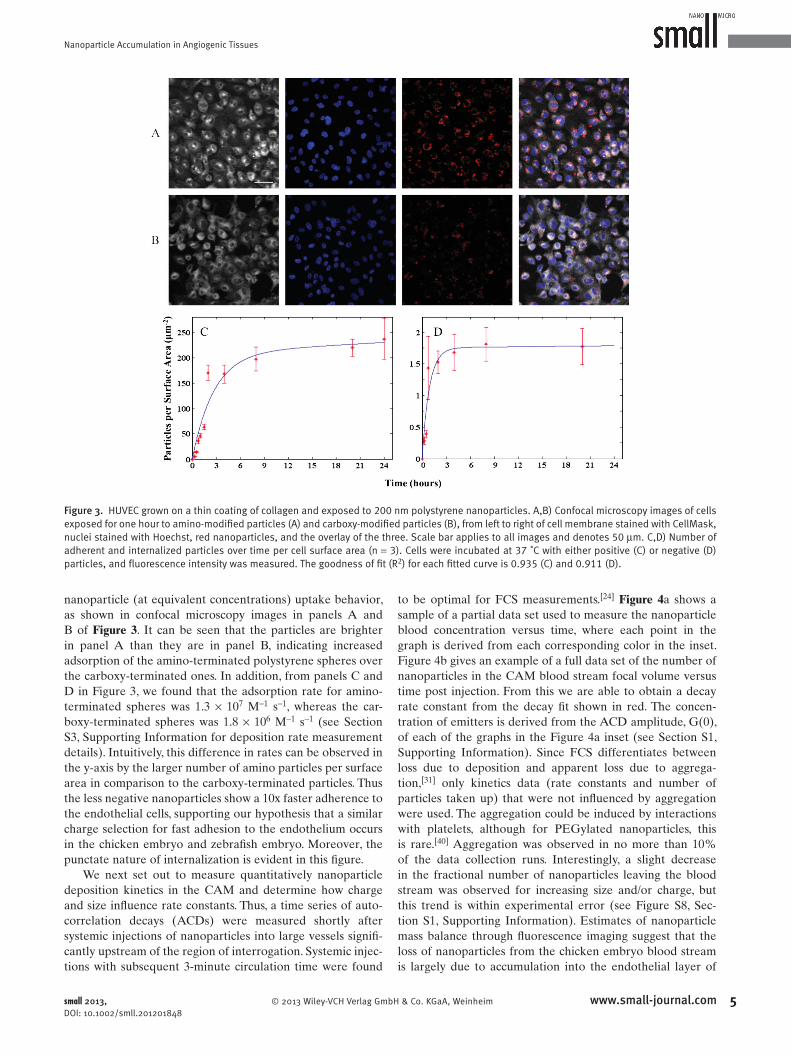
to be optimal for FCS measurements. [ 24 ] Figure 4 a shows a
sample of a partial data set used to measure the nanoparticle
blood concentration versus time, where each point in the
graph is derived from each corresponding color in the inset.
Figure 4 b gives an example of a full data set of the number of
nanoparticles in the CAM blood stream focal volume versus
time post injection. From this we are able to obtain a decay
rate constant from the decay fi t shown in red. The concen-
tration of emitters is derived from the ACD amplitude, G(0),
of each of the graphs in the Figure 4 a inset (see Section S1,
Supporting Information). Since FCS differentiates between
loss due to deposition and apparent loss due to aggrega-
tion, [ 31 ] only kinetics data (rate constants and number of
particles taken up) that were not infl uenced by aggregation
were used. The aggregation could be induced by interactions
with platelets, although for PEGylated nanoparticles, this
is rare. [ 40 ] Aggregation was observed in no more than 10%
of the data collection runs. Interestingly, a slight decrease
in the fractional number of nanoparticles leaving the blood
stream was observed for increasing size and/or charge, but
this trend is within experimental error (see Figure S8, Sec-
tion S1, Supporting Information). Estimates of nanoparticle
mass balance through fl uorescence imaging suggest that the
loss of nanoparticles from the chicken embryo blood stream
is largely due to accumulation into the endothelial layer of
5www.small-journal.comH & Co. KGaA, Weinheim
K. Yaehne et al.full papers
Figure 4 . a) Simplifi ed example of nanoparticle loss from the bloodstream versus time after injection. The concentration data are taken from a series of autocorrelation decays collected (ACDs) using TPE-FCS within a 200 μ m venule following systemic injection of 100 μ L of 20 nM methoxy565 solution. ACDs are shown in the inset of panel a). The dotted line is a single exponential decay fi t to the data. b) Complete data set from one CAM injection of number of 20 nm polystyrene nanopsheres in the focal volume versus time post injection. The red line is a single exponential decay fi t to the data. c) High resolution fl uorescence deconvolution microscopy image of an arteriole in the CAM following systematic injection of 200 μ L of 40 nM carboxy655 QD (red channel). The blue channel is a nucleic acid stain. Scale bar is 5 μ m. d) High resolution fl uorescence deconvolution image of an intact arteriole from the CAM after injection of amino-PEG605 QD (yellow channel). Blue and red channels are nuclear and membrane stains, respectively. Scale bar is 15 μ m.
the CAM blood vessels (Figure 4 c and d). Analysis of the
chicken embryo organs revealed almost no accumulation of
nanoparticles (data not shown). For less negatively charged
nanoparticles ( ζ > − 10 mV), the kinetics were best modelled
using a bi-exponential decay (see Figure S5c), suggesting two
mechanisms for nanoparticle loss; rapid adherence to the vas-
cular endothelium or slower deposition into nanofenestra-
tions (see Section S1, Supporting Information for details on
all kinetics data used). For 110 nm diameter DOTAP lipo-
somes ( ζ = + 41 mV) adherence to the vessel wall was so rapid
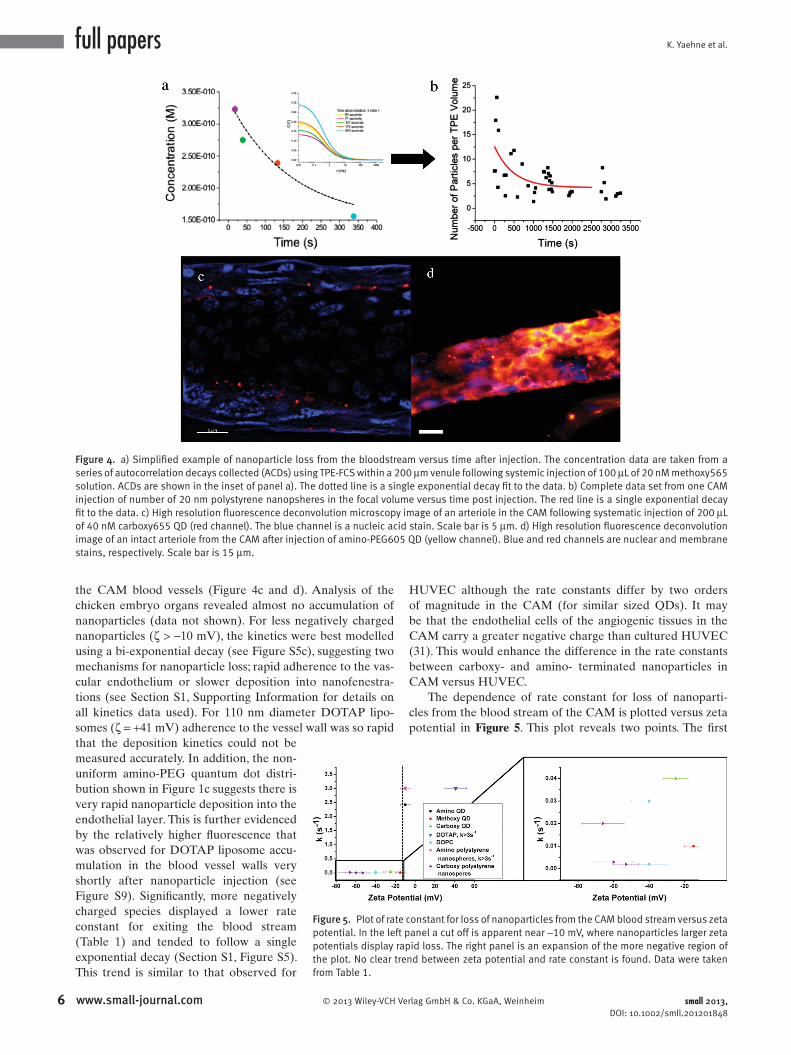
Figure 5 . Plot of rate constant for loss of nanoparticles from the CAM blood stream versus zeta potential. In the left panel a cut off is apparent near − 10 mV, where nanoparticles larger zeta potentials display rapid loss. The right panel is an expansion of the more negative region of the plot. No clear trend between zeta potential and rate constant is found. Data were taken from Table 1 .
that the deposition kinetics could not be
measured accurately. In addition, the non-
uniform amino-PEG quantum dot distri-
bution shown in Figure 1 c suggests there is
very rapid nanoparticle deposition into the
endothelial layer. This is further evidenced
by the relatively higher fl uorescence that
was observed for DOTAP liposome accu-
mulation in the blood vessel walls very
shortly after nanoparticle injection (see
Figure S9). Signifi cantly, more negatively
charged species displayed a lower rate
constant for exiting the blood stream
(Table 1 ) and tended to follow a single
exponential decay (Section S1, Figure S5).
This trend is similar to that observed for
6 www.small-journal.com © 2013 Wiley-VCH Ve
HUVEC although the rate constants differ by two orders
of magnitude in the CAM (for similar sized QDs). It may
be that the endothelial cells of the angiogenic tissues in the
CAM carry a greater negative charge than cultured HUVEC
(31). This would enhance the difference in the rate constants
between carboxy- and amino- terminated nanoparticles in
CAM versus HUVEC.
The dependence of rate constant for loss of nanoparti-
cles from the blood stream of the CAM is plotted versus zeta
potential in Figure 5 . This plot reveals two points. The fi rst
rlag GmbH & Co. KGaA, Weinheim small 2013, DOI: 10.1002/smll.201201848

Nanoparticle Accumulation in Angiogenic Tissues
Figure 6 . Plots of the rate constants for nanoparticle loss from the blood stream of chicken embryos versus a) the particle radius, b) the inverse of the particle radius, and c) the inverse squared of the particle radius. The plots include three different types of nanoparticles with negative zeta potentials in the range − 20 to − 66 mV. d) Fluorescence confocal image of an intact CAM blood vessel that was injected with 100 μ L of a 160 nM carboxyPAA 655 QD solution. Blue regions represent signal detected from a nucleic acid stain (Hoescht 33258) to indicate location of endothelial cells and red-pink regions indicate signal from the injected QDs. Scale bar is 10 μ m.
is that there is an apparent cutoff around − 15 mV. The loss
is much more rapid for particles whose zeta potentials are
more positive than this cutoff. The second is that for nano-
particles with zeta potential more negative than − 15 mV, the
rate constant is small, with no apparent dependence on the
zeta potential value.
The effect of charge on deposition into angiogenic tissues
is challenging to assess quantitatively. Elegant work by Del-
lian on charged serum proteins [ 41 ] and later by Krasnici et al.
on liposomes [ 42 ] suggests a rapid adherence of positive nano-
particles to the angiogenic endothelium surrounding tumors.
However, adherence rates and the apparent charge cutoff for
this effect were not presented. Lewis et al. [ 28 ] observed nan-
oparticle uptake into CAM vascular endothelial cells with
enhanced uptake for positive particles, without accounting
for size differences in the nanoparticles. The longer persist-
ence of aminoPEG dots versus polyacrylic acid QDs in the
CAM observed by Smith et al. [ 29 ] could be rationalized by
greater adherence and possibly uptake of aminoPEG QDs
into the endothelium. In their work, Smith et al. did not dif-
ferentiate between nanoparticles in the lumen and those in
or on the endothelium.
Our current study also evaulates the different interactions
of nanoparticles with angiogenic tissues, based on charge.
We demonstrate that there is much more rapid adherence
of more positive nanoparticles to endothelial cells across
three species (cultured HUVEC, zebrafi sh and chicken).
© 2013 Wiley-VCH Verlag Gmsmall 2013, DOI: 10.1002/smll.201201848
Moreover, from the CAM study we can suggest a cutoff for
this interaction of approximately − 15 mV (Figure 5 ). Nano-
particles more negative than –15 mV display a stronger pro-
pensity to exit the blood vessels slowly (possibly through
fenestrations), whereas nanoparticles with a potential greater
than this tend to adhere to the endothelium (Figure 3 and
Supporting Information, section S3). We used this cutoff to
help separate size and charge effects of apparent deposition
into the angiogenic tissues.
2.2. Effects of Size on Nanoparticle Accumulation
We propose that studying more negative nanoparticles ( ζ
< − 15 mV), with smaller rate constants, will permit the
measurement of size dependencies and thus allow the sep-
aration of charge and size effects. Indeed, for the CAM
system, using the more negative, carboxy-terminated PAA
quantum dots, carboxy-terminated polystyrene nanospheres,
and 1,2-dileoyl-sn-3-glycero-3-phospocholine (DOPC) lipo-
somes, there appears to be a trend in rate constant versus
size (Table 1 , Figure 6 a-c). That the rate constants are much
smaller than those for the amino-terminated nanoparticles
may result from electrostatic repulsion with the endothelial
cells, which have a net negative membrane charge. [ 25 ] This
suggests that direct endothelial membrane adherence may
not be the mechanism of deposition for nanoparticles with
7www.small-journal.combH & Co. KGaA, Weinheim

K. Yaehne et al.full papers
Figure 7 . Schematic representations depicting the relative sizes of the nanoparticles compared to the angiogenic fenestrations in the vessel wall. It is proposed that the linearity of the k vs. 1/r 2 plot is derived from a loss mechanism that depends primarily on the relative sizes (i.e. footprints) of the particles.
a zeta potential less than − 15 mV. Indeed more negative
nanoparticles are distributed within the endothelial layer
after systemic injection into the CAM blood vessel system
(Figure 6 d, for polyacrylic acid coated, carboxy605 QDs). It
is notable that no loss was observed for negative nanoparti-
cles whose diameters were 500 nm or greater (see Figure S6).
This would likely be a consequence of the fenestrations
between the endothelial cells having an effective diameter of
500 nm or less, and is consistent with those found in rodent
tumor models [ 27 ] and in the angiogenic tissues surrounding
human tumors. [ 43] ]
When the rate constants are compared with nanoparticle
size (nanoparticles with ζ < − 15 mV), a nonlinear anticorrela-
tion between rate constant and size (r) can be seen (Figure
6 a) suggesting an inverse relationship. If the rate constants
depend on the diffusion coeffi cients, then a plot of k vs. 1/r
should be linear. Such a plot was also non-linear (Figure 6 b),
suggesting that the deposition rate constant is not directly
proportional to diffusion rate. When the rate constant was
plotted versus 1/r 2 for the nanoparticles (including carboxy-
polyacrylic acid coated QDs, carboxy-terminated polystyrene
nanospheres and DOPC unilamellar vesicles) a linear rela-
tionship is observed (Figure 6 c). It follows that either the sur-
face area or the footprint of the nanoparticles is related to
the mechanism of deposition into the endothelial layer. Since
there appears to be no charge dependent relationship that
agrees with 1/r 2 (see zeta potentials in Table 1 and Figure 5 ),
8 www.small-journal.com © 2013 Wiley-VCH
this therefore suggests that the footprints of nanoparticles
are related to their deposition rate constants ( Figure 7 ).
In a random nanoparticle-fenestration collision regime,
this 1/r 2 geometric dependence would arise because there is
a greater probability of a smaller area object passing through
an opening of constant area. The rate of passage is propor-
tional to the number of objects that can occupy the opening.
For spherical nanoparticles, the occupation number in the
opening of a fenestration is proportional to 1/r 2 (as shown
in Figure 6 c). Therefore, for nanoparticles where adherence
to the endothelium does not dominate loss from the blood
stream (Table 1 ), we suggest the rate of deposition into the
endothelium of angiogenic blood vessels is predominantly
based on the nanoparticle footprint area and is independent
of NP surface chemistry.
There have been no previous studies that assessed, quan-
titatively, nanoparticle deposition rates versus nanoparticle
size while separating effects due to surface charge. However,
we can still compare our results with prior, qualitative work.
Our results are consistent with the size study by Yuan et al.
(2–5 nm proteins and 45 nm PEGylated liposomes), [ 27 ] where
there was a slight decline in angiogenic vascular permeability
to the larger liposomes compared with the protein particles,
similar to the trends observed presently. The size-related,
QD-tumor study by Bawendi and co-workers [ 26 ] indicated
that only small nanoparticles ( ∼ 10 nm diameter or less) pen-
etrate signifi cantly into the tumor mass. Since their study was
directed towards optimizing nanoparticle design for tumor
imaging, they did not measure extravasation rates, but rather
circulation half-lives. It is challenging to directly compare
half-lives with deposition rates across species, because of the
vastly different angiogenic tissue volumes for xenografted
tumors in mice and in the CAM, but the trends are similar.
Dreher et al. [ 30 ] examined rhodamine labeled dextrans of
various molecular weights for apparent permeability, P app , (a measure of the fl ux, i.e. rate) across the endothelial walls
surrounding a xenografted tumor in a mouse model. They
plotted P app versus hydrodynamic radius ( Figure 8 a) and
observed an anticorrelation between the two parameters,
similar to that from Figure 6 a. Signifi cantly, we have replotted
the data as P app vs. 1/r and 1/r 2 (Figure 8 b and c, respectively).
The plot of P app vs. 1/r 2 is linear (R 2 = 0.98), suggesting agree-
ment with our current study and further indicating that this
size relationship may indeed be universal for endothelial per-
meability to nanoparticles.
3. Conclusion
We have demonstrated the successful use of the CAM to
study the transport of nanoparticles. In this work, the effects
of nanoparticle zeta potential and size on deposition rate con-
stants into angiogenic tissues have been effectively separated.
Also, our results help to deconvolute the data from these pre-
vious studies by quantitating interactions specifi cally with the
endothelial layer of new blood vessels, whilst eliminating the
convolution of dependences on local blood fl ow and blood
pressure in the complex tumor environment. Finally, our
results suggest that the radius squared is the most important
Verlag GmbH & Co. KGaA, Weinheim small 2013, DOI: 10.1002/smll.201201848

Nanoparticle Accumulation in Angiogenic Tissues
Figure 8 . Apparent permeability, P app , of the vascular endothelial wall surrounding a mouse model tumor to a dextran nanoparticle size series (26). a) P app as a function of increasing nanoparticle radius. b) P app as a function of inverse radius. c) P app as a function of inverse radius squared. Linear regression fi t (R 2 = 0.98) also shown.
parameter in predicting deposition rates into angiogenic tis-
sues when nanoparticles carry moderate negative zeta poten-
tial (less than − 15 mV). The deposition rate dependence on
the footprint area of the nanoparticles holds for fi ve different
general surface chemistries spanning solids (polystyrene, dex-
tran), lipid liquid phase (DOPC) and semi solid (poly acrylic
acid, polyethylene glycol) and two species (chicken and
mouse). We identifi ed specifi c nanoparticle parameters that
dictate the deposition rates in the CAM from a drug delivery
perspective. Consequently, the CAM model may be useful
in assessing nanoparticle toxicity. The study presented here
has added to our understanding of the mechanism of nano-
particle deposition into angiogenic tissues but also presents a
new biological model that can accelerate our understanding
of nanoparticle toxicity and tumor targeting.
4. Experimental Section
All commercial nanoparticles (QDs and fl uospheres) were obtained from Invitrogen (Burlington, ON) and diluted into phosphate buffered saline to a concentration of 10 nM prior to injection. Fluorescence (1,2-dioleoyl- sn -glycero-3-phosphoethanolamine- N -(lissamine rhodamine B sulfonyl) (ammonium salt)) labeled 1,2-dileoyl-sn-3-glycero-3-phosphocholine (DOPC) and 1,2-dileoyl-sn-3-glycero-3-trimethylammonium-propane (DOTAP) liposomes were prepared via extrusion as described in detail in section S2 of the Supporting Information. Nanoparticles’ hydrodynamic radii in buffer solution were characterized via dynamic light scattering (Malvern Nano ZS) and FCS. Zeta potentials were also measured (Malvern Nano ZS, details in Section S2, Supporting Information). All nanoparticles were tested for stability in chicken blood sera as
© 2013 Wiley-VCH Verlag GmbH & Co. KGaA, Weinheimsmall 2013, DOI: 10.1002/smll.201201848
described previously. [ 31 ] They were all found to be stable for the timeframe over which they were used (1–3 days).
The chicken embryo CAM was prepared according to Samkoe et al. [ 44 ] and detailed in Section S1 of the Supporting Infomation. Systemic injections and measurements were performed on day 9 PF. A photograph of an intravenous injection into a blood vessel of the CAM with a glass micro-needle ( ∼ 0.02 mm tip diameter) is shown in Figure 1 B. Injections were typically 50–100 μ L. The blood is cleared by the injectate, which then remixes with blood as the bolus circulates, typically 2-3 round trips ( ∼ 1 min). [ 31 ] FCS measurements were taken at least 100 μ m downstream to avoid artifacts due do occasional leakage of blood at the injection site.
Two-photon excitation-FCS (TPE-FCS) data were collected and autocorrelation decays calculated in real time using an ALV 3000 cor-relator board. The sample was excited with a 780 nm (100 fsec) laser and signal collected in an epifl uorescence confi guration through a 1 cm working distance, 0.4 NA objective lens (Zeiss, Canada). This arrangement delivered a TPE volume of approximately 33 fL (an ovoid
with axes, 3 and 10 μ m). [ 31 ] Autocorrelation decays were analyzed as described in the Section S1 of the Supporting Information (Figure S4).
In addition to TPE-FCS measurements, confocal fl uorescence imaging of nanoparticle distributions in the CAM, zebrafi sh and HUVECs was performed. For the CAM, nanoparticles and/or dye (1 mg/mL of Hoescht 33258; ∼ 40 nM QD) were injected into blood vessels and allowed to circulate for 2−3 hours. Vessels were then fi xed with formaldehyde and laid fl at on slides or cross-sectioned for imaging. Sectioning was performed using a Leica CM1850 cryostat microtome (kindly made available in the laboratory of Dr. William Stell, University of Calgary) at − 20 ° C with the sectioning thickness set between 8 and 30 μ m. Tissue was embedded in Tissue-Tek embedding medium (Sakura, CA) prior to sectioning. Fixed blood vessel samples were imaged using a Leica DM RXA2 upright confocal microscope equipped with a 63X DIC-D oil immer-sion lens (with a numerical aperture of 1.32). Further details can be found in the Supporting Information.
Zebrafi sh embryos were immobilized with 5% tricaine in E3 solution prior to injection of approximately 5–10 nL of amino or carboxy conjugated QD 605 solution (Invitrogen, Q21501MP and Q21301MP respectively). Injected embryos were embedded in 1% low-melting-point agarose after 10 min of recovery. Images were taken, on a Zeiss LSM510 Meta confocal microscope at 1 μ m intervals using a 40x objective lens, of 3 independently injected embryos at each time point and injection type. Images were taken at 30 min post-injection (30 min p.i.), 1.5 hpi, and 3.5 hpi. The images presented are a maximum intensity projection of 5 con-secutive sagittal confocal slices of the zebrafi sh caudal tail plexus, processed with a KalmanStack Filter using ImageJ.
HUVEC (Lonza, Walkersville, MD, USA) were cultured according to manufacturer’s directions in endothelial growth medium (EGM,
9www.small-journal.com

K. Yaehne et al.full papers
[ 1 ] Y. Matsumura , H. Maeda , Cancer Res. 1986 , 46 , 6387 . [ 2 ] W. G. Roberts , G. E. Palade , Cancer Res. 1997 , 57 , 765 . [ 3 ] E. Blanco , A. Hsiao , A. P. Mann , M. G. Landry , F. Meric-Bernstam ,
M. Ferrari , Cancer Sci. 2011 , 102 , 1247 . [ 4 ] F. Danhier , O. Feron , V. Preat , J. Control. Release 2010 , 148 , 135 . [ 5 ] K. K. Jain , BMC Med. 2010 , 8 . [ 6 ] D. Peer , J. M. Karp , S. Hong , O. C. FaroKhzad , R. Margalit ,
R. Langer , Nat. Nanotechnol. 2007 , 2 , 751 . [ 7 ] E. Ruoslahti , S. N. Bhatia , M. J. Sailor , J. Cell Biol. 2010 , 188 , 759 . [ 8 ] J. Wang , J. D. Byrne , M. E. Napier , J. M. DeSimone , Small 2011 , 7 ,
1919 . [ 9 ] C. Wong , T. Stylianopoulos , J. A. Cui , J. Martin , V. P. Chauhan ,
W. Jiang , Z. Popovic , R. K. Jain , M. G. Bawendi , D. Fukumura , Proc. Natl. Acad. Sci. USA 2011 , 108 , 2426 .
[ 10 ] B. Y. S. Kim , J. T. Rutka , W. C. W. Chan , N. Engl. J. Med. 2010 , 363 , 2434 .
[ 11 ] G. Alexandrakis , E. B. Brown , R. T. Tong , T. D. McKee , R. B. Campbell , Y. Boucher , R. K. Jain , Nat. Med. 2004 , 10 , 203 .
[ 12 ] C. Buzea , I. Pacheco , K. Robbie , Biointerphases 2007 , 2 , MR17 . [ 13 ] Z. Chen , Trends Mol. Med. 2010 , 16 , 594 . [ 14 ] Y. W. Cho , Y. S. Kim , I. S. Yjm , R. W. Park , S. J. Oh , D. H. Moon ,
S. Y. Kim , I. C. Kwon , Macromol. Res. 2008 , 16 , 15 . [ 15 ] K. Greish , J. Drug Targeting 2007 , 15 , 457 . [ 16 ] S. Hak , N. K. Reitan , O. Haraldseth , C. D. Davies , Angiogenesis
2010 , 13 , 113 . [ 17 ] R. K. Jain , T. Stylianopoulos , Nat. Rev. Clin. Oncology 2010 , 7 , 653 . [ 18 ] K. K. Leslie , C. Koil , W. F. Rayburn , Obstet. Gynecol. Clin. North
Am. 2005 , 32 , 627 .
Lonza) until confl uent. HUVEC were grown on tissue culture treated 48-well plates coated with a thin layer of collagen or on top of pre-formed 3D collagen hydrogels. For confocal microscopy studies, HUVEC were grown on collagen-coated (2D or 3D) glass slides. Cells were stained and imaged as described in Section S3 of the Supporting Information.
University of Calgary and Canadian Council on Animal Care (CCAC) regulations for embryo handling and ethics were fol-lowed and care was taken to cause as little stress to the chicken embryos as possible. All chicken embryos were euthanized before day 15 (HH40-41) of incubation, when they develop the ability to experience pain. Wildtype zebrafi sh were raised and maintained according to Westerfi eld [ 45 ] with approval from the University of Calgary Animal Care Committee.
Supporting Information
Supporting Information is available from the Wiley Online Library or from the author.
Acknowledgements
The authors are grateful to the Natural Sciences and Engineering Council of Canada and the Canadian Institutes of Health for a Col-laborative Health Research Project Grant. We thank Warren Chan (University of Toronto) for insightful discussions.
10 www.small-journal.com © 2013 Wiley-VCH V
[ 19 ] P. Lin , J. W. Chen , L. W. Chang , J. P. Wu , L. Redding , H. Chang , T. K. Yeh , C. S. Yang , M. H. Tsai , H. J. Wang , Y. C. Kuo , R. S. H. Yang , Environ. Sci. Technol. 2008 , 42 , 6264 .
[ 20 ] T. Lammers , F. Kiessling , W. E. Hennink , G. Storm , J. Control. Release 2012 , 161 , 175 .
[ 21 ] M. Hagedorn , S. Javerzat , D. Gilges , A. Meyre , B. C. Lafarge , A. Eichmann , A. Bikfalvi , Proc. Natl. Acad. Sci. USA 2005 , 102 , 1643 .
[ 22 ] D. Ribatti in International Review of Cell and Molecular Biology , Vol. 270 (Ed: W. J. Kwang ), Academic Press , San Diego, USA, 2008 , Ch.5, p. 181 .
[ 23 ] L. Y. T. Chou , W. C. W. Chan , Nat. Nanotechnol. 2012 , 7 , 416 . [ 24 ] H. A. Lee , T. L. Leavens , S. E. Mason , N. A. Monteiro-Riviere ,
J. E. Riviere , Nano Lett. 2009 , 9 , 794 . [ 25 ] B. S. Zolnik , N. Sadrieh , Adv. Drug Deliv. Rev. 2009 , 61 , 422 . [ 26 ] Z. Popovic , W. H. Liu , V. P. Chauhan , J. Lee , C. Wong , A. B. Greytak ,
N. Insin , D. G. Nocera , D. Fukumura , R. K. Jain , M. G. Bawendi, Angew. Chem. Int. Ed. 2010 , 49 , 8649 .
[ 27 ] F. Yuan , M. Dellian , D. Fukumura , M. Leunig , D. A. Berk , V. P. Torchilin , R. K. Jain , Cancer Res. 1995 , 55 , 3752 .
[ 28 ] J. D. Lewis , G. Destito , A. Zijlstra , M. J. Gonzalez , J. P. Quigley , M. Manchester , H. Stuhlmann , Nat. Med. 2006 , 12 , 354 .
[ 29 ] J. D. Smith , G. W. Fisher , A. S. Waggoner , P. G. Campbell Micro-vasc. Res. 2007 , 73 , 75 .
[ 30 ] M. R. Dreher , W. G. Liu , C. R. Michelich , M. W. Dewhirst , F. Yuan , A. Chilkoti , J. Natl. Cancer Inst. 2006 , 98 , 335 .
[ 31 ] A. A. Clancy , Y. Gregoriou , K. Yaehne , D. T. Cramb , Chem. Phys. Lett. 2010 , 488 , 99 .
[ 32 ] D. Merkle , S. P. Lees-Miller , D. T. Cramb , Biochemistry 2004 , 43 , 7263 .
[ 33 ] G. Roebben , S. Ramirez-Garcia , V. A. Hackley , M. Roesslein , F. Klaessig , V. Kestens , I. Lynch , C. M. Garner , A. Rawle , A. Elder , V. L. Colvin , W. Kreyling , H. F. Krug , Z. A. Lewicka , S. McNeil , A. Nel , A. Patri , P. Wick , M. Wiesner , T. Xia , G. Oberdoerster , K. A. Dawson , J. Nanoparticle Res. 2011 , 13 , 2675 .
[ 34 ] E. Aamar , I. B. Dawid , Dev. Biol. 2008 , 318 , 335 . [ 35 ] A. L. Doiron , B. Clark , K. D. Rinker , Biotechnol. Bioeng. 2011 , 108 ,
2988 . [ 36 ] T. Drmota , G. W. Gould , G. Milligan , J. Biol. Chem. 1998 , 273 ,
24000 . [ 37 ] T. J. Daou , L. Li , P. Reiss , V. Josserand , I. Texier , Langmuir 2009 ,
25 , 3040 . [ 38 ] K. Huang , A. Jacobs , J. Rzayev , Biomacromolecules 2011 , 12 ,
2327 . [ 39 ] W. Li , C. Y. Chen , C. Ye , T. T. Wei , Y. L. Zhao , F. Lao , Z. Chen ,
H. Meng , Y. X. Gao , H. Yuan , G. M. Xing , F. Zhao , Z. F. Chai , X. J. Zhang , F. Y. Yang , D. Han , X. H. Tang , Y. G. Zhang , Nano-technology 2008 , 19 , 145102.
[ 40 ] M. O. Oyewumi , R. A. Yokel , M. Jay , T. Coakley , R. J. Mumper , J. Control. Release 2004 , 95 , 613 .
[ 41 ] M. Dellian , F. Yuan , V. S. Trubetskoy , V. P. Torchilin , R. K. Jain , Br. J. Cancer 2000 , 82 , 1513 .
[ 42 ] S. Krasnici , A. Werner , M. E. Eichhorn , M. Schmitt-Sody , S. A. Pahernik , B. Sauer , B. Schulze , M. Teifel , U. Michaelis , K. Naujoks , M. Dellian , Int. J. Cancer 2003 , 105 , 561 .
[ 43 ] S. K. Hobbs , W. L. Monsky , F. Yuan , W. G. Roberts , L. Griffi th , V. P. Torchilin , R. K. Jain , Proc. Natl. Acad. Sci. USA 1998 , 95 , 4607 .
[ 44 ] K. S. Samkoe , A. A. Clancy , A. Karotki , B. C. Wilson , D. T. Cramb , J. Biomed. Opt. 2007 , 12 .
[ 45 ] F. M. Westerfi eld , The Zebrafi sh Book University of Oregon Press , Eugene, USA 1993 .
Received: July 31, 2012 Revised: October 11, 2012Published online:
erlag GmbH & Co. KGaA, Weinheim small 2013, DOI: 10.1002/smll.201201848