Embed Size (px)
Citation preview

Nanocrystal imaging using intense and ultrashortX-ray pulsesCarl Caleman ∗, Gosta Huldt †, Carlos Ortiz ‡, Filipe R. N. C. Maia † , Erik G. Marklund † , Fritz G. Parak ∗ , David van derSpoel † and Nicusor Tımneanu †
∗Physik Department E17, Technische Universitat Munchen, James-Franck-Strasse, DE-85748 Garching, Germany,†Department of Cell and Molecular Biology, Biomedical
Centre, Uppsala University, Box 596, SE-751 24 Uppsala, Sweden, and ‡Department of Physics and Material Science, Uppsala University, Box 530, SE-751 21 Uppsala, Sweden
Submitted to Proceedings of the National Academy of Sciences of the United States of America
Structural studies of biological macromolecules are severely limitedby radiation damage. Traditional crystallography curbs the effectsof damage by spreading damage over many copies of the moleculeof interest in the crystal. X-ray lasers offer an additional oppor-tunity for limiting damage by out-running damage processes withultrashort and very intense X-ray pulses. Such pulses may allow theimaging of single molecules, clusters or nanoparticles, but coherentflash imaging will also open up new avenues for structural studieson nano- and micro-crystalline substances. This paper addresses thepotentials and limitations of nanocrystallography with extremely in-tense coherent X-ray pulses. We use urea nanocrystals as a modelfor generic biological substances, and simulate the primary and sec-ondary ionization dynamics in the crystalline sample. The resultsestablish conditions for diffraction experiments as a function of X-ray fluence, pulse duration, and the size of nanocrystals.
nanocrystallography | X-ray Free Electron Laser | radiation damage | coherent
flash imaging
Abbreviations: XFEL, X-ray Free Electron Laser; LCLS, Linac Coherent Light Source;
MD, Molecular Dynamics
New light sources have had a significant influence on natural sci-ences throughout history. Radio transmitters, X-ray sources
and optical lasers triggered fundamental transformations both in sci-ence and society. As a consequence, expectations are high, regard-ing the impact of the long-awaited first hard X-ray lasers, which willstart user operation this year. These lasers produce ultra-short and ex-tremely intense coherent X-ray pulses with a peak brilliance, exceed-ing that of conventional synchrotron sources by more than billiontimes. The FLASH soft X-ray free-electron laser in Germany [1]was the first to reach into the X-ray frequencies, and it is a fullyoperational user facility today. The LINAC Coherent Light Source(LCLS) [2] in the USA is a hard X-ray laser that has produced firstlight and it is lasing at 1.5 A . Similar projects are under way inJapan [3] and in Europe. In addition to these linear accelerator-based machines, table-top X-ray lasers, driven by optical lasers, havestarted making their mark [4–7]. Short, intense, coherent, hard X-raypulses can be exploited for new experiments in disciplines, rangingfrom experimental astrophysics to structural biology [8]. Such X-raypulses could open the door to single molecule imaging, i.e. retriev-ing atomic structures from large biomolecules without the need of acrystalline sample [9, 10].
Structures could also be determined from nanocrystalline mate-rials. In the process of crystallization, many macromolecules (e.g.membrane proteins) do not form large crystals. However, they oftenform sub-micron crystals but these are usually too small to gener-ate useful diffraction data at a conventional synchrotron source. Ithas been suggested [11–13] that such nanocrystals could be used forstructural studies with X-ray lasers.
Any sample exposed to an intense X-ray pulse will be ionized,and extensive ionization destroys the sample. The time scale onwhich this process occurs is critical for obtaining an interpretablediffraction pattern to yield an atomic structure of the sample. Inprinciple, the X-ray pulse must be short enough such that the entirepulse passes through the sample before a major disarrangement of the
Fig. 1. Crystal size and the extent of secondary electron cascades. The figure in
(a) shows the overall dimensions of electron clouds produced during the thermaliza-
tion of an 8 keV photoelectron and a 0.4 keV Auger electron (ejected from a nitrogen
atom) inside a large urea crystal. Similar cascade sizes are produced in protein crys-
tals, in an X-ray diffraction experiment. The total number of ionizations was 18 in
the Auger cascade, and 118 in the photoelectron cascade at 100 fs after the emission
of the primary electrons. At this point, the radius of gyration of the photoelectron
cascade reached 2 µm, and that of the Auger electron cascade 200 nm. The photo-
electron cascade is significantly bigger than a typical nanocrystal/microcrystal under
considerations here (b). Using lysozyme as an example, the protein nanocrystal would
contain about 300,000 unit cells (c).
atomic and electronic configurations takes place. The ionizations dueto the direct photoabsorption and subsequent secondary processes af-fect the ability to get useful structural information from the diffrac-tion pattern in three ways. (i) Ionization decreases the elastic X-rayscattering power of the atoms. (ii) Removal of electrons from theatoms leaves behind positively charged ions that repel each other dueto Coulomb forces, leading to the destruction of the structure. (iii)
Reserved for Publication Footnotes
www.pnas.org/cgi/doi/10.1073/pnas.0709640104 PNAS Issue Date Volume Issue Number 1–7

Fig. 2. Evolution of secondary electron cascades in a urea crystal over time. (a) Number of secondary ionizations produced by a photoelectron of 8 KeV and by Auger
electrons (impact energies: 250 eV for carbon, 400 eV for nitrogen, 500 eV for oxygen). (b) Spatial evolution of the secondary electron cloud from a photoelectron in a large
urea crystal depicted through the radial electron density as a function of time. (c) Secondary electron cloud from an Auger electron (nitrogen). The termalization of electrons
from oxyen and carbon has similar features. Black lines show changes in the radius of gyration (defined in Methods) of the electron clouds.
Free electrons either leave the sample, if their energy is high enough,or remain in the sample as a background electron gas, in which casethey will contribute to noise in the diffraction pattern.
There are no experiments on the dynamics of radiation dam-age from FEL pulses at angstrom wavelengths. Experiments pub-lished so far reach into the soft X-ray regime (down to about 13.5nm wavelength) [14–17]. Data about this regime come from experi-ments performed at the FLASH free-electron laser in Hamburg. The-oretical models extend the picture into the unexplored hard X-rayregime [9, 18–20]. The explosion mechanism strongly depends onsample size. Electrons ejected from atoms during exposure prop-agate through the sample, and cause further ionization by elicitingsecondary electron cascades. The extent of ionization through thismechanism depends on the size of the sample. Photoelectrons re-leased by X-rays of 1.5 A wavelength are fast (53 nm/fs), and theycan escape from small samples early in an exposure (Figure 1). Incontrast, Auger electrons are slow (9.5 nm/fs for carbon) and it islikely that they will thermalize even in a small sample (Figure 1).In late phases of an exposure, a significant fraction of the emittedelectrons will not be able to escape the increased positive potentialof the sample even if the sample is small. For small samples, theexplosion is dominated by Coulomb processes. This is driven bythe repulsion of the positive ions left behind by electrons leaving thesample. In big samples, electrons will be trapped simply because theylose energy before reaching the surface. Trapped electrons increasethe kinetic energy of the sample through thermal processes, whileslowing the Coulomb explosion by partially screening the positivelycharged core. Predictions point to a transition from Coulomb explo-sion to a hydrodynamic explosion. A positively charged surface layeris formed and it peels off, burning the sample from outside towardsthe core. The expansion of the core is driven by thermal processes asthe electron pressure grows [18, 19].
The aim of this work is to study the damage caused by ion-ization in nanocrystals of biological material, with sizes up to onemicrometer. Crystals larger than one micrometer are normally con-sidered viable and diffract good enough at conventional synchrotronsources. Our study aims at providing a screening tool for usable sam-ple sizes in nanocrystallography experiments, with regard to samplesize and X-ray laser pulse parameters. Serial crystallography experi-ments with sub-micron protein crystals have recently been performedat a synchrotron [21], and showed that powder diffraction data canbe obtained using a continuous microjet of nanocrystals. It has alsobeen found that longitudinal coherence properties of the X-ray laserslimit the resolution of single-particle diffraction imaging [22]. At awavelength of 1.5 A the particles have to be smaller than 500 nm indiameter to achieve imaging with a resolution length of less than 2 A.
Detailed description of electron impact ionization and secondaryelectron cascades has been presented in the literature for different ma-
terials [23–25]. The dynamics of photoelectrons in protein crystalshave been investigated [26] (without consideration to Auger emissionor secondary electron cascades. The results suggest that radiationdamage can be limited by reducing the crystal size. The present papersteps beyond these studies, and treats photo-emission, Auger emis-sion and cascade processes during exposure of a biological nanocrys-tal to an XFEL pulse. We investigate the effect of radiation damagefor samples of several sizes and different X-ray pulse lengths, and theconsequences it has on diffractive imaging of biological samples asthey are exposed to an XFEL pulse.
Electron impact ionization and secondary cascadesFigure 1 shows the simulated dynamics of ionization in an infinitelylarge urea crystal exposed to an X-ray pulse with 1.5 A wavelength.A nanocrystal is smaller than the electron cascades and most photo-electrons may leave the sample before thermalization. In a step-wiseapproach, we first treat the thermalization of electrons with variousenergies, corresponding to photoelectrons or different Auger elec-trons in urea. In the next step, we combine the primary and secondaryionization effects to describe the entire dynamics of the system duringand after the X-ray pulse (see the Methods section). Detailed descrip-tion of the model, electron scattering on atoms, treatment of electron-hole recombinations and electron-phonon interactions is presentedin [25].
At low atomic numbers, a single photo-ionization releases elec-trons at two distinctly different energies. The energy of the photo-electron corresponds to the difference between the photon energy (8.3keV in this case) and the K-shell binding energy, while Auger elec-trons carry kinetic energy dependent on the Auger process. Augerenergies for carbon, nitrogen and oxygen in the urea target are ap-proximately 250 eV, 400 eV and 500 eV, which is more than an orderof magnitude lower than the energy of a photoelectron (≈8 keV). Inthe energy range considered here, the number of secondary ioniza-tions produced by the inelastic scattering of a single electron, scaleslinearly with the energy of the initial electron [23, 25] (Figure 2a).
The onset of the electron cascade scales also with the incidentelectron energy. The electron cloud initiated by an energetic photo-electron thermalizes much slower than electrons in Auger cascades,as the electron travels further between each scattering event in thecrystal due to its higher energy and low interaction cross section (Fig-ure 2b). However, when the energy distribution in the electron cloudhas reached impact ionization threshold and no more ionizations canoccur, the cloud has generated ten times as many secondary electronsthan an Auger electron. In the same time, the photoelectron cloudis more than an order of magnitude larger than the Auger electroninduced cloud. Figure 2b shows radial electron density from the pho-toelectron and Auger electron cloud as these develop in time. At eachtime point, the radial density is normalized to give the total number
2 www.pnas.org/cgi/doi/10.1073/pnas.0709640104 Footline Author

Fig. 3. Evolution of secondary electron cascades as a function of the X-ray pulse length in a urea crystal. The pulse is centered at t=0. (a) The probability distribution
(normalized to 1) for the emission of a photoelectron (1.5 A X-ray wavelength) and the subsequent emission of an Auger electron from carbon, nitrogen or oxygen during a 10 fs
X-ray pulse (full width at half maximum, FWHM). Auger electron lifetimes are 11.3 fs s for carbon, 8.3 fs for nitrogen and 6.6 fs for oxygen. (b) Evolution of the photoelectron
cascades in the urea crystal as a function of pulse length. The data are normalized to a single photoionization occurrence. (c) Evolution of the Auger electron cascades from
carbon, nitrogen, and oxygen under the same conditions as in (b). The black line shows when 99.5% of the pulse has passed.
of secondary ionizations (Figure 2a). For comparison, the radii ofgyration (defined in the Method section) of the photoelectric cloudand Auger cloud are presented with black lines. As shown, radius ofgyration describes well the spatial extent of the electron clouds andit will be used to characterize electron clouds throughout the paper(Figure 2b).
Sample damage is caused by ionization. At a wavelength of1.5 A, the ratio between elastically (coherently) scattered photonsand photoionization is 1:32 for oxygen, 1:26 for nitrogen and 1:20for carbon [27]. Most of the incoming photons will primarily con-tribute to ionization in the sample and only a few will generate acoherent diffraction image. The loss of an electron from a carbonatom will decrease its scattering power by about 17%. This is 14%for nitrogen and about 12% for oxygen. However, ionizations occur-ring after the X-ray pulse has left the sample will no longer influencethe diffraction pattern. Therefore, more photoionizations can be al-lowed when using a very short X-ray pulse, as only few secondaryelectrons will be generated during the pulse as compared to longerpulses (Figure 3).
In a very large crystal the ejected electrons have nowhere to es-cape, and no Coulomb explosion is possible. In such a system thepressure of the ejected electrons drives a hydrodynamic expansion ofthe sample, and heats the system. At 8.3 keV photon energy, a singlephotoelectron will liberate about 390 electrons as it comes to a ther-mal equilibrium in a large sample (Figure 2a). This free electron gaswill contribute to a Thomson background in the diffraction pattern.Some of these ionizations can be avoided by using smaller crystals.
0
10
20
30
40
50
60
70
80
90
100
0 2 4 6 8 10 12 14 16 18
Pul
se le
ngth
(F
WH
M, f
s)
Number of ionizations
cascadeAuger
0 50 100 150 200 250
Radius of gyration (nm)
cascade x 0.1Photo-
Fig. 4. Number of secondary ionizations (left) and the radius of gyration (right,
for definition see Methods) at the point when 99.5% of the pulse passed the sample.
These values are plotted as a function of pulse length (FWHM). The solid red curves
for the photoelectron cascades are scaled down by a factor 10. The Auger cascades
(blue dotted line) contains all secondary electrons from C, N and O combined, and
are normalized to a single photoionization event.
In a sample that is small compared to the size of the X-ray beam,photoionization events will occur with equal probability throughoutthe entire sample. If the sample is smaller than the mean free path ofphotoelectrons or Auger electrons, many of the high-energy electronsare expected to escape the system during the exposure.
When investigating the feasibility of imaging crystals of varioussizes, we calculate the total number of electrons generated for eachcrystal size based on the electron cloud dynamics as a function ofpulse length (Figure 3). If the electron cloud is expected to be largerthan the crystal, electrons will escape and it is necessary to compen-sate for that effect in the calculation. Figure 3 provides the basis forcalculating the tolerable levels of radiation damage, as a function ofpulse length and size of electron cloud.
It is worth noting the differences between the present method oftreating the entire dynamics of the electron clouds versus pulse length(Figures 3 and 3) and the treatment of single electron thermalization(Figure 2). For short X-ray pulses which are comparable to Augerlifetimes, the single electron approximation overestimates the Augercascade but provides a good approximation for the photoelectron cas-cades. For pulses longer than 10 femtoseconds, the single electronmethod (Figure 2) underestimates the ionization and development ofthe photo-cascades.
Imaging nanocrystalsThree-dimensional (3D) structural studies require a 3D data set.Since the XFEL pulse will destroy the sample, structure determina-tion relies on the fact that the experiment can be repeated, i.e. thatmany crystals can be produced from the same material, and thendelivered into the X-ray beam in a repetitive and controlled man-ner. Rather than building up a complete X-ray diffraction data setby rotating the crystal and collecting a sequence of diffraction im-ages, as is done in conventional crystallography, one will be needto scale together individual diffraction images from many of differ-ent nanocrystals, in order to build up complete 3D data set. It isyet to be proven that it is possible to effectively combine such data,but it is reasonable to expect that this computational problem can besolved, as it has in the case of continuous diffraction pattern [28].Assuming that the XFEL provides enough X-ray photons per pulseto record a diffraction pattern from a single shot, a crystal with 100unit cells produces a discrete diffraction pattern, just as any largecrystal, and conventional X-ray phasing technique can be used. Fur-thermore, oversampling techniques for direct phase retrival may alsobe employed for a 3D structural determination [29] For an averagesize protein molecule, like Deacetoxycephalosporin (DAOCS) with aunit cell size of (a=10.7 nm, b=10.7 nm, c=7.01 nm) [30] a crystaledge of 100 nm corresponds to around 1000 unit cells. In the case ofa single molecule, where a continuous diffraction image is generated,different reconstruction algorithms have to be employed [16, 28, 31].
Footline Author PNAS Issue Date Volume Issue Number 3
0
0.2
0.4
0.6
0.8
1
-15 -10 -5 0 5 10 15 0
0.02
0.04
0.06
0.08
0.1R
elat
ive
inte
nsity
of B
ragg
pea
k
RM
SD
ato
mic
pos
ition
s (n
m)
Time (fs)
Pulse
RMSD urea
(110)(220)(330)(440)
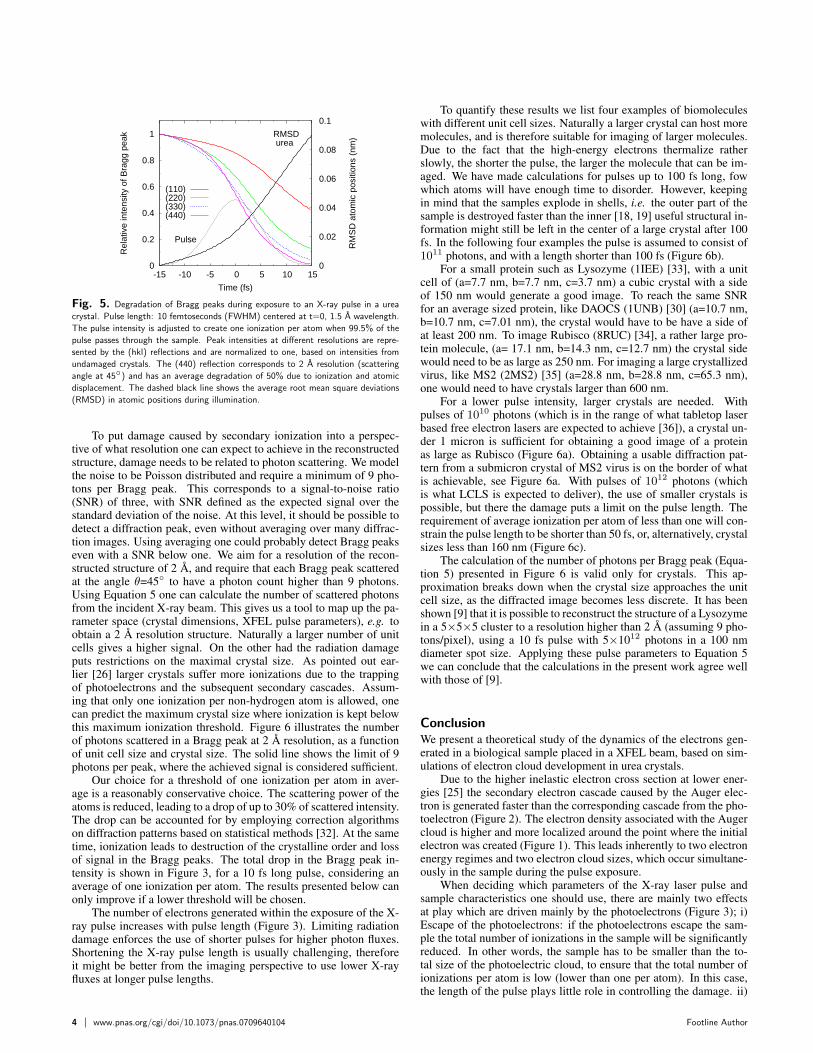
Fig. 5. Degradation of Bragg peaks during exposure to an X-ray pulse in a urea
crystal. Pulse length: 10 femtoseconds (FWHM) centered at t=0, 1.5 A wavelength.
The pulse intensity is adjusted to create one ionization per atom when 99.5% of the
pulse passes through the sample. Peak intensities at different resolutions are repre-
sented by the (hkl) reflections and are normalized to one, based on intensities from
undamaged crystals. The (440) reflection corresponds to 2 A resolution (scattering
angle at 45) and has an average degradation of 50% due to ionization and atomic
displacement. The dashed black line shows the average root mean square deviations
(RMSD) in atomic positions during illumination.
To put damage caused by secondary ionization into a perspec-tive of what resolution one can expect to achieve in the reconstructedstructure, damage needs to be related to photon scattering. We modelthe noise to be Poisson distributed and require a minimum of 9 pho-tons per Bragg peak. This corresponds to a signal-to-noise ratio(SNR) of three, with SNR defined as the expected signal over thestandard deviation of the noise. At this level, it should be possible todetect a diffraction peak, even without averaging over many diffrac-tion images. Using averaging one could probably detect Bragg peakseven with a SNR below one. We aim for a resolution of the recon-structed structure of 2 A, and require that each Bragg peak scatteredat the angle θ=45 to have a photon count higher than 9 photons.Using Equation 5 one can calculate the number of scattered photonsfrom the incident X-ray beam. This gives us a tool to map up the pa-rameter space (crystal dimensions, XFEL pulse parameters), e.g. toobtain a 2 A resolution structure. Naturally a larger number of unitcells gives a higher signal. On the other had the radiation damageputs restrictions on the maximal crystal size. As pointed out ear-lier [26] larger crystals suffer more ionizations due to the trappingof photoelectrons and the subsequent secondary cascades. Assum-ing that only one ionization per non-hydrogen atom is allowed, onecan predict the maximum crystal size where ionization is kept belowthis maximum ionization threshold. Figure 6 illustrates the numberof photons scattered in a Bragg peak at 2 A resolution, as a functionof unit cell size and crystal size. The solid line shows the limit of 9photons per peak, where the achieved signal is considered sufficient.
Our choice for a threshold of one ionization per atom in aver-age is a reasonably conservative choice. The scattering power of theatoms is reduced, leading to a drop of up to 30% of scattered intensity.The drop can be accounted for by employing correction algorithmson diffraction patterns based on statistical methods [32]. At the sametime, ionization leads to destruction of the crystalline order and lossof signal in the Bragg peaks. The total drop in the Bragg peak in-tensity is shown in Figure 3, for a 10 fs long pulse, considering anaverage of one ionization per atom. The results presented below canonly improve if a lower threshold will be chosen.
The number of electrons generated within the exposure of the X-ray pulse increases with pulse length (Figure 3). Limiting radiationdamage enforces the use of shorter pulses for higher photon fluxes.Shortening the X-ray pulse length is usually challenging, thereforeit might be better from the imaging perspective to use lower X-rayfluxes at longer pulse lengths.
To quantify these results we list four examples of biomoleculeswith different unit cell sizes. Naturally a larger crystal can host moremolecules, and is therefore suitable for imaging of larger molecules.Due to the fact that the high-energy electrons thermalize ratherslowly, the shorter the pulse, the larger the molecule that can be im-aged. We have made calculations for pulses up to 100 fs long, fowwhich atoms will have enough time to disorder. However, keepingin mind that the samples explode in shells, i.e. the outer part of thesample is destroyed faster than the inner [18, 19] useful structural in-formation might still be left in the center of a large crystal after 100fs. In the following four examples the pulse is assumed to consist of1011 photons, and with a length shorter than 100 fs (Figure 6b).
For a small protein such as Lysozyme (1IEE) [33], with a unitcell of (a=7.7 nm, b=7.7 nm, c=3.7 nm) a cubic crystal with a sideof 150 nm would generate a good image. To reach the same SNRfor an average sized protein, like DAOCS (1UNB) [30] (a=10.7 nm,b=10.7 nm, c=7.01 nm), the crystal would have to be have a side ofat least 200 nm. To image Rubisco (8RUC) [34], a rather large pro-tein molecule, (a= 17.1 nm, b=14.3 nm, c=12.7 nm) the crystal sidewould need to be as large as 250 nm. For imaging a large crystallizedvirus, like MS2 (2MS2) [35] (a=28.8 nm, b=28.8 nm, c=65.3 nm),one would need to have crystals larger than 600 nm.
For a lower pulse intensity, larger crystals are needed. Withpulses of 1010 photons (which is in the range of what tabletop laserbased free electron lasers are expected to achieve [36]), a crystal un-der 1 micron is sufficient for obtaining a good image of a proteinas large as Rubisco (Figure 6a). Obtaining a usable diffraction pat-tern from a submicron crystal of MS2 virus is on the border of whatis achievable, see Figure 6a. With pulses of 1012 photons (whichis what LCLS is expected to deliver), the use of smaller crystals ispossible, but there the damage puts a limit on the pulse length. Therequirement of average ionization per atom of less than one will con-strain the pulse length to be shorter than 50 fs, or, alternatively, crystalsizes less than 160 nm (Figure 6c).
The calculation of the number of photons per Bragg peak (Equa-tion 5) presented in Figure 6 is valid only for crystals. This ap-proximation breaks down when the crystal size approaches the unitcell size, as the diffracted image becomes less discrete. It has beenshown [9] that it is possible to reconstruct the structure of a Lysozymein a 5×5×5 cluster to a resolution higher than 2 A (assuming 9 pho-tons/pixel), using a 10 fs pulse with 5×10¹² photons in a 100 nmdiameter spot size. Applying these pulse parameters to Equation 5we can conclude that the calculations in the present work agree wellwith those of [9].
ConclusionWe present a theoretical study of the dynamics of the electrons gen-erated in a biological sample placed in a XFEL beam, based on sim-ulations of electron cloud development in urea crystals.
Due to the higher inelastic electron cross section at lower ener-gies [25] the secondary electron cascade caused by the Auger elec-tron is generated faster than the corresponding cascade from the pho-toelectron (Figure 2). The electron density associated with the Augercloud is higher and more localized around the point where the initialelectron was created (Figure 1). This leads inherently to two electronenergy regimes and two electron cloud sizes, which occur simultane-ously in the sample during the pulse exposure.
When deciding which parameters of the X-ray laser pulse andsample characteristics one should use, there are mainly two effectsat play which are driven mainly by the photoelectrons (Figure 3); i)Escape of the photoelectrons: if the photoelectrons escape the sam-ple the total number of ionizations in the sample will be significantlyreduced. In other words, the sample has to be smaller than the to-tal size of the photoelectric cloud, to ensure that the total number ofionizations per atom is low (lower than one per atom). In this case,the length of the pulse plays little role in controlling the damage. ii)
4 www.pnas.org/cgi/doi/10.1073/pnas.0709640104 Footline Author
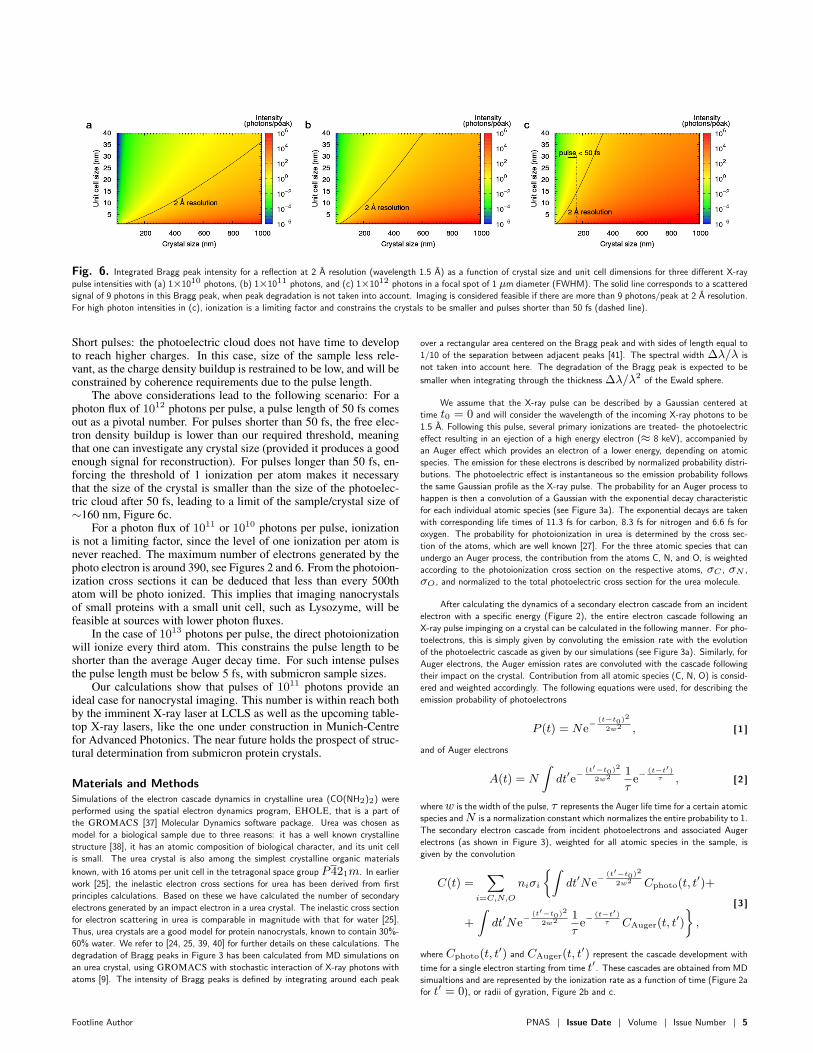
Fig. 6. Integrated Bragg peak intensity for a reflection at 2 A resolution (wavelength 1.5 A) as a function of crystal size and unit cell dimensions for three different X-ray
pulse intensities with (a) 1×10¹⁰ photons, (b) 1×10¹¹ photons, and (c) 1×10¹² photons in a focal spot of 1 µm diameter (FWHM). The solid line corresponds to a scattered
signal of 9 photons in this Bragg peak, when peak degradation is not taken into account. Imaging is considered feasible if there are more than 9 photons/peak at 2 A resolution.
For high photon intensities in (c), ionization is a limiting factor and constrains the crystals to be smaller and pulses shorter than 50 fs (dashed line).
Short pulses: the photoelectric cloud does not have time to developto reach higher charges. In this case, size of the sample less rele-vant, as the charge density buildup is restrained to be low, and will beconstrained by coherence requirements due to the pulse length.
The above considerations lead to the following scenario: For aphoton flux of 1012 photons per pulse, a pulse length of 50 fs comesout as a pivotal number. For pulses shorter than 50 fs, the free elec-tron density buildup is lower than our required threshold, meaningthat one can investigate any crystal size (provided it produces a goodenough signal for reconstruction). For pulses longer than 50 fs, en-forcing the threshold of 1 ionization per atom makes it necessarythat the size of the crystal is smaller than the size of the photoelec-tric cloud after 50 fs, leading to a limit of the sample/crystal size of∼160 nm, Figure 6c.
For a photon flux of 1011 or 1010 photons per pulse, ionizationis not a limiting factor, since the level of one ionization per atom isnever reached. The maximum number of electrons generated by thephoto electron is around 390, see Figures 2 and 6. From the photoion-ization cross sections it can be deduced that less than every 500thatom will be photo ionized. This implies that imaging nanocrystalsof small proteins with a small unit cell, such as Lysozyme, will befeasible at sources with lower photon fluxes.
In the case of 1013 photons per pulse, the direct photoionizationwill ionize every third atom. This constrains the pulse length to beshorter than the average Auger decay time. For such intense pulsesthe pulse length must be below 5 fs, with submicron sample sizes.
Our calculations show that pulses of 1011 photons provide anideal case for nanocrystal imaging. This number is within reach bothby the imminent X-ray laser at LCLS as well as the upcoming table-top X-ray lasers, like the one under construction in Munich-Centrefor Advanced Photonics. The near future holds the prospect of struc-tural determination from submicron protein crystals.
Materials and MethodsSimulations of the electron cascade dynamics in crystalline urea (CO(NH2)2) were
performed using the spatial electron dynamics program, EHOLE, that is a part of
the GROMACS [37] Molecular Dynamics software package. Urea was chosen as
model for a biological sample due to three reasons: it has a well known crystalline
structure [38], it has an atomic composition of biological character, and its unit cell
is small. The urea crystal is also among the simplest crystalline organic materials
known, with 16 atoms per unit cell in the tetragonal space group P421m. In earlier
work [25], the inelastic electron cross sections for urea has been derived from first
principles calculations. Based on these we have calculated the number of secondary
electrons generated by an impact electron in a urea crystal. The inelastic cross section
for electron scattering in urea is comparable in magnitude with that for water [25].
Thus, urea crystals are a good model for protein nanocrystals, known to contain 30%-
60% water. We refer to [24, 25, 39, 40] for further details on these calculations. The
degradation of Bragg peaks in Figure 3 has been calculated from MD simulations on
an urea crystal, using GROMACS with stochastic interaction of X-ray photons with
atoms [9]. The intensity of Bragg peaks is defined by integrating around each peak
over a rectangular area centered on the Bragg peak and with sides of length equal to
1/10 of the separation between adjacent peaks [41]. The spectral width ∆λ/λ is
not taken into account here. The degradation of the Bragg peak is expected to be
smaller when integrating through the thickness ∆λ/λ2of the Ewald sphere.
We assume that the X-ray pulse can be described by a Gaussian centered at
time t0 = 0 and will consider the wavelength of the incoming X-ray photons to be
1.5 A. Following this pulse, several primary ionizations are treated- the photoelectric
effect resulting in an ejection of a high energy electron (≈ 8 keV), accompanied by
an Auger effect which provides an electron of a lower energy, depending on atomic
species. The emission for these electrons is described by normalized probability distri-
butions. The photoelectric effect is instantaneous so the emission probability follows
the same Gaussian profile as the X-ray pulse. The probability for an Auger process to
happen is then a convolution of a Gaussian with the exponential decay characteristic
for each individual atomic species (see Figure 3a). The exponential decays are taken
with corresponding life times of 11.3 fs for carbon, 8.3 fs for nitrogen and 6.6 fs for
oxygen. The probability for photoionization in urea is determined by the cross sec-
tion of the atoms, which are well known [27]. For the three atomic species that can
undergo an Auger process, the contribution from the atoms C, N, and O, is weighted
according to the photoionization cross section on the respective atoms, σC , σN ,
σO , and normalized to the total photoelectric cross section for the urea molecule.
After calculating the dynamics of a secondary electron cascade from an incident
electron with a specific energy (Figure 2), the entire electron cascade following an
X-ray pulse impinging on a crystal can be calculated in the following manner. For pho-
toelectrons, this is simply given by convoluting the emission rate with the evolution
of the photoelectric cascade as given by our simulations (see Figure 3a). Similarly, for
Auger electrons, the Auger emission rates are convoluted with the cascade following
their impact on the crystal. Contribution from all atomic species (C, N, O) is consid-
ered and weighted accordingly. The following equations were used, for describing the
emission probability of photoelectrons
P (t) = Ne− (t−t0)2
2w2 , [ 1 ]
and of Auger electrons
A(t) = N
Zdt′e
− (t′−t0)2
2w21
τe−
(t−t′)τ , [ 2 ]
where w is the width of the pulse, τ represents the Auger life time for a certain atomic
species and N is a normalization constant which normalizes the entire probability to 1.
The secondary electron cascade from incident photoelectrons and associated Auger
electrons (as shown in Figure 3), weighted for all atomic species in the sample, is
given by the convolution
C(t) =X
i=C,N,O
niσi
Zdt′Ne
− (t′−t0)2
2w2 Cphoto(t, t′)+
+
Zdt′Ne
− (t′−t0)2
2w21
τe−
(t−t′)τ CAuger(t, t
′)
ff,
[ 3 ]
where Cphoto(t, t′) and CAuger(t, t
′) represent the cascade development with
time for a single electron starting from time t′. These cascades are obtained from MD
simualtions and are represented by the ionization rate as a function of time (Figure 2a
for t′ = 0), or radii of gyration, Figure 2b and c.
Footline Author PNAS Issue Date Volume Issue Number 5
The radius of gyration, used in Figure 3, is described by
Rg(t) =
„ Pi ri(t)
2miPi mi
«1/2
, [ 4 ]
where mi is the mass of electron i and ri the position of electron i with respect to
the center of mass of all free electrons.
Through calculations similar to those in [42], the average number of photons
scattered elastically by a protein crystal within a Bragg peak centered on the direc-
tion (θ0, ϕ0) can be approximated by the expressionZZΩ
I(θ, ϕ) dΩ ≈ Φr2eλ2 A4
a6
Xatoms
f2atom(θ0)
1 + cos2(θ0)
2, [ 5 ]
where Ω is the solid angle spanned by the Bragg peak, Φ the fluence of the incoming
X-ray beam, re the classical electron radius, λ the wavelength, A the crystal width,
a the unit cell width, fatom the atomic scattering factor, and θ0 the polar angle
between the incident pulse and the center of the Bragg peak. It is assumed that the
unit cell structure factor is constant within the Bragg peak, and that adjacent Bragg
peaks do not overlap; both these approximations improve with the ratio A/a. The
squared structure factor of the unit cell is represented by its average value at high
scattering angles [43]. For numerical evaluation, the unit cell was assumed to have a
density 1/30 A−3
carbon-equivalent atoms (corresponding to a unit cell consisting of
50% non-structural water and protein with density approximately 1.35 g/cm3), and
the scattering factor of carbon was calculated from the Cromer-Mann parameters [44].
ACKNOWLEDGMENTS. The Swedish Research Council is acknowledged for finan-cial support as well as the DFG Cluster of Excellence: Munich-Centre for AdvancedPhotonics. The authors would like to thank Janos Hajdu, Magnus Bergh, GerardKleywegt, Inger Andersson, Richard Neutze, Martin Svenda, Rosmarie Friemann andKarin Valegard, for their valuable input.
References1. Ackermann W, et al. (2007) Operation of a free-electron laser from the extreme ultraviolet to
the water window. Nat. Photonics 1:336–342.2. DiMauro LF, et al. (2007) Progress report on the LCLS XFEL at SLAC. J. Phys.: Conf. Ser.
88:012058.3. Shintake T, et al. (2008) A compact free-electron laser for generating coherent radiation in
the extreme ultraviolet region. Nat. Photonics 2:555–559.
4. Geddes CGR, et al. (2004) High-quality electron beams from a laser wakefield accelerator usingplasma-channel guiding. Nature 431:538–541.
5. Mangles SPD, et al. (2004) Monoenergetic beams of relativistic electrons from intense laser-plasma interactions. Nature 431:535–538.
6. Faure J, et al. (2004) A laser-plasma accelerator producing monoenergetic electron beams.Nature 431:541–544.
7. Sandberg RL, et al. (2008) High numerical aperture tabletop soft x-ray diffraction microscopywith 70-nm resolution. Proc. Natl. Acad. Sci. U.S.A. 105:24–27.
8. Gaffney KJ, Chapman HN (2007) Imaging atomic structure and dynamics with ultrafast x-rayscattering. Science 316:1444–1448.
9. Neutze R, Wouts R, van der Spoel D, Weckert E, Hajdu J (2000) Potential for biomolecularimaging with femtosecond X-ray pulses. Nature 406:752–757.
10. Hajdu J (2000) Single-molecule x-ray diffraction. Curr. Opin. Struct. Biol. 10:569–573.
11. Neutze R, Huldt G, Hajdu J, van der Spoel D (2004) Potential impact of an X-ray free electronlaser on structural biology. Radiat. Phys. Chem. 71:905–916.
12. Boutet S, Robinson I (2008) Coherent x-ray diffractive imaging of protein crystals. J. Syn-chrotron Rad. 15:576–583.
13. Chapman HN (2009) X-ray imaging beyond the limits. Nat. Mater. 8:299–301.
14. Hau-Riege SP, et al. (2007) Subnanometer-scale measurements of the interaction of ultrafastsoft x-ray free-electron-laser pulses with matter. Phys. Rev. Lett. 98:145502.
15. Hau-Riege SP, et al. (2007) Damage threshold of inorganic solids under free-electron-laserirradiation at 32.5 nm wavelength. Appl. Rev. Lett. 90:173128.
16. Chapman HN, et al. (2007) Femtosecond time-delay x-ray holography. Nature 448:676–680.
17. Chalupsky J, et al. (2007) Characteristics of focused soft x-ray free-electron laser beam deter-mined by ablation of organic molecular solids. Opt. Expr. 15:6036–6043.
18. Bergh M, Tımneanu N, van der Spoel D (2004) A model for the dynamics of a water clusterin a X-ray FEL beam. Phys. Rev. E 70:051904.
19. Hau-Riege SP, London RA, Szoke A (2004) Dynamics of biological molecules irradiated byshort x-ray pulses. Phys. Rev. E 69:051906.
20. Jurek Z, Faigel G, Tegze M (2004) Dynamics in a cluster under the influence of intensefemtosecond hard X-ray pulses. Eur. Phys. J. D 29:217–229.
21. Shapiro DA, et al. (2008) Powder diffraction from a continuous microjet of submicrometerprotein crystals. J. Sync. Rad. 15:593–599.
22. Hau-Riege SP (2008) Effect of the coherence properties of self-amplified-spontaneous-emissionx-ray free electron lasers on single-particle diffractive imaging. Opt. Express 16:2840–2844.
23. Ziaja B, London RA, Hajdu J (2005) Unified model of secondary electron cascades in diamond.J. Appl. Phys. 97:064905.
24. Ortiz C, Caleman C (2007) Secondary electron cascade dynamics in KI and CsI. J. Phys.Chem. C. 111:17442–17447.
25. Caleman C, et al. (2009) Radiation damage in biological material: electronic properties andelectron impact ionization in urea. Europhys. Lett. 85:18005.
26. Nave C, Hill MA (2005) Will reduced radiation damage occur with very small crystals? J.Synchrotron Rad. 12:299–303.
27. Berger M, et al. (1998) XCOM: photon cross sections database.(http://physics.nist.gov/PhysRefData/Xcom/Text/XCOM.html).
28. Fung R, Shneerson V, Saldin DK, Ourmazd A (2009) Structure from fleeting illumination offaint spinning objects in flight. Nat. Phys. 5:64–67.
29. Miao J, Hodgson KO, Sayre D (2001) An approach to three-dimensional structures ofbiomolecules by using single-molecule diffraction images. Proc. Natl. Acad. Sci. U.S.A.98:6641–6645.
30. Valegard K, et al. (2004) Deacetoxycephalosporin c synthase complexed with 2-oxoglutarateand ampicillin. Nat. Struct. Biol. 11:95–10.
31. Huldt G, Szoke A, Hajdu J (2003) Diffraction imaging of single particles and biomolecules. J.Struct. Biol. 144:219–227.
32. Hau-Riege SP, London RA, Chapman HN, Szoke A, Tımneanu N (2007) Encapsulation anddiffraction-pattern-correction methods to reduce the effect of damage in x-ray diffraction imag-ing of single biological molecules. Phys. Rev. Lett. 98:198302.
33. Sauter C, et al. (2001) Structure of tetragonal hen egg-white lysozyme at 0.94 a from crystalsgrown by the counter-diffusion method. Acta Cryst. D 57:1119–1126.
34. Knight S, Andersson I, Branden C (1990) Crystallographic analysis of ribose 1,5-biphosphatecarboxylase from spinach at 2.4 a resolution - subunit interactions and active-site. J. Mol. Biol.215:113–160.
35. Valegard K, Liljas L, Fridborg K, Unge T (1990) The 3-dimensional structure of the bacterial-virus MS2. Nature 345:36–41.
36. Gunter F, et al. (2007) Design considerations for table-top, laser-based VUV and X-ray freeelectron lasers. Appl. Phys. B 86:431–435.
37. van der Spoel D, et al. (2005) GROMACS: Fast, Flexible and Free. J. Comp. Chem. 26:1701–1718.
38. Pryor AW, Sanger PL (1970) Collection and interpretation of neutron diffraction measurementson urea. Acta Cryst. A 26:543–558.
39. Tımneanu N, Caleman C, Hajdu J, van der Spoel D (2004) Auger electron cascades in waterand ice. Chem. Phys. 299:277–283.
40. Ziaja B, van der Spoel D, Szoke A, Hajdu J (2001) Radiation induced electron cascade indiamond and amorphous carbon. Phys. Rev. B 64:214104.
41. van der Spoel D, Maia FRNC, Caleman C (2008) Structural studies of melting on the picosec-ond time scale. Phys. Chem. Chem. Phys. 10:6344–6349.
42. James RW (1948) The optical principles of the diffraction of X-rays (Oxbow press, Wood-bridge).
43. Wilson AJC (1949) The probability distribution of X-ray intensities. Act. Cryst. 2:318–321.
44. Cromer DT, Mann JB (1968) X-ray scattering factors computed from numerical Hartree-Fockwave functions. Acta Cryst. A 24:321–326.
6 www.pnas.org/cgi/doi/10.1073/pnas.0709640104 Footline Author


![Fragmentation of CD induced by intense ultrashort …intensity, as determined by a frequency resolved autocorrela-tion (FRAC) measurement [45,46]] Fourier transform limited (FTL) pulses](https://img.dokumen.tips/doc/110x75/5fea9ead36d7801864349bb3/fragmentation-of-cd-induced-by-intense-ultrashort-intensity-as-determined-by-a.jpg)