Embed Size (px)
Citation preview

NANO ELECTROCERAMICS FOR INTERMEDIATE
TEMPERATURE SOLID OXIDE FUEL CELL
By
Raja Kishora Lenka
Enrolment No: CHEM01200604025
Bhabha Atomic Research Center, Mumbai
A thesis submitted to the
Board of Studies in Chemical Sciences
In partial fulfillment of requirements
For the Degree of
DOCTOR OF PHILOSOPHY
of
HOMI BHABHA NATIONAL INSTITUTE
July, 2012


STATEMENT BY AUTHOR
This dissertation has been submitted in partial fulfillment of requirements for an
advanced degree at Homi Bhabha National Institute (HBNI) and is deposited in the
Library to be made available to borrowers under rules of the HBNI.
Brief quotations from this dissertation are allowable without special permission, provided
that accurate acknowledgement of source is made. Requests for permission for extended
quotation from or reproduction of this manuscript in whole or in part may be granted by
the Competent Authority of HBNI when in his or her judgment the proposed use of the
material is in the interests of scholarship. In all other instances, however, permission must
be obtained from the author.
Raja Kishora Lenka

DECLARATION
I, hereby declare that the investigation presented in the thesis has been carried out by
me. The work is original and has not been submitted earlier as a whole or in part for a
degree / diploma at this or any other Institution / University.
Raja Kishora Lenka

Dedicated to my parents

ACKNOWLEDGEMENTS
The first and foremost, I take a highly esteemed privilege to express my deep sense of
gratitude to my research guide and mentor Dr. A.K. Tyagi, Head, Solid State Chemistry Section,
Chemistry Division, BARC, for his continuous guidance during the thesis work. I owe
completely to him for his enormous effort for timely submission of this dissertation. It is my
pleasure to express my grateful thanks to Dr. A. K. Suri, Director, Materials Group and Shri B.
P. Sharma ex-director, Chemical Engineering Group for their encouragement and support. I
express my deep gratitude to Shri P.K. Sinha, Head, Energy Conversion Materials Section, for
supports and guidance for conducting various experiments. His continuous effort has sharpened
the work of the thesis towards the departmental mandate. I sincerely acknowledge Dr T. Mahata
(ECMS) for his continuous guidance at each and every stages of work, without whom, the work
is incomplete.
I take this opportunity to thank my colleagues in ECMS, Dr. Deep Prakash, Dr. Amit
Sinha, Shri M. Syambabu, Dr. R. D. Purohit, Dr(Smt) S R Nair, Dr. P. K. Patro, Shri N. E.
Mawal, Shri A. K. Mishra, and other colleagues for extending support and help at various stages
of the thesis work.
I wish thank all my teachers right from my school days till date who nurtured and shaped up my
career. I am fortunate enough to have very good friends at every step of my life. I am extremely
grateful to my friend’s Jaykrushna, Soumitra, Dheeraj, Shankar, Chhavi, Ajay, Pabitra,
Himansu bhai, Rabi, Manoj and Balaji, for their continuous support during the course of the
work. I am grateful to Dr. R. Mishra and Shri Jitendra Nawad, Chemistry Division, BARC,
for helping in TG and SEM analysis.
Last but not least, I would like to offer my whole-hearted indebtness to my family, who
have always motivated and supported me. Thanks to my brother, sister, mother-in-law, sister-in-
law, prince, shriyu, kanha and my newly born son. Special thanks to my wife Sangita, for
continuous encouragement and managing good environment at home.
Perhaps, I forgot someone… so, just in case: thank you to whomever it concerns!
RAJA KISHORA LENKA

Contents
Page
No.
SYNOPSIS i
LIST OF FIGURES xii
LIST OF TABLES xvii
Chapter 1
Introduction 1
1.1 Different types of Fuel Cells 2
1.2 Solid Oxide Fuel Cells (SOFC):
Operating principle
4
1.3 Advantages of SOFC 8
1.4 Candidate SOFC materials 9
1.4.1 Electrolyte material 9
1.4.2 Anode material 13
1.4.3 Cathode materials 16
1.5 SOFC technology: Critical issues 24
1.6 Motivation of work 27
Chapter 2
EXPERIMANTAL 28
2.1 Synthesis of fine powders for SOFC 28

application
2.1.1 Gel combustion route 29
2.1.2 Solution polymerisation route 30
2.2 characterization of precursor and phase
pure powder
32
2.2.1 Thermal analysis of precursor gel and as-
synthesized powders
32
2.2.2 X-ray diffraction pattern of powders 32
2.2.3 Calcination of precursor powders 33
2.2.4 Particle size analysis of powders 33
2.2.5 Specific surface area measurement 34
2.2.6 Powder morphology by SEM and TEM 34
2.2.7 Powder compaction and sintering
behaviour by TMA
35
2.3 Sintering 36
2.4 Fabrication of symmetric cells 36
2.5 Characterization of sintered materials 37
2.5.1 Microstructure and composition 37
2.5.2 Measurement of ionic conductivity 38
2.5.2.1 Coating with platinum paste 38
2.5.2.2 AC impedance spectroscopy 38
2.5.3 Measurement of electronic conductivity 39
2.5.4 Evaluation of TEC 39
2.6 Symmetric cell measurement 40

2.7 Fabrication of anode supported cells 41
2.8 characterization of single cell 41
Chapter 3
Synthesis and characterization of
GDC electrolyte material
42
3.1 Introduction 42
3.2 Experimental 44
3.3 Results and discussion 47
3.3.1 Combustion reactions: theoretical
analysis
48
3.3.2 Thermal studies on precursor gels formed
using different fuels
51
3.3.3 Thermal studies on precursor gels of
different gadolinia content
53
3.3.4 Effect of fuel on powder characteristics 54
3.3.5 Effect of gadolinia content on powder
characteristics
58
3.3.6 Sintering behavior of Gd doped CeO2 :
Effect of Gd content
61
3.4 Summary 63
Chapter 4
Ionic conductivity of GDC
electrolyte
4.1 Introduction 64

4.2 Experimental 69
4.3 Results and Discussion 70
4.3.1 Densities and microstructures of the
sintered 12GDC pellets
70
4.3.2 Complex impedance plot: Determination
of bulk, grain boundary and total
conductivity
72
4.3.3 Analysis of imaginary impedance spectra 77
4.3.4 Grain size effect 81
4.3.5 Variation of conductivity with
composition
81
4.3.6 Activation energies for ionic conduction 84
4.4 Summary 86
Chapter 5 88
Synthesis and characterization of
NiO- GDC composite for SOFC
anode
88
5.1 Introduction 88
5.2 Experimental 90
5.2.1 Synthesis of fine NiO powder 90
5.2.2 Preparation of NiO-GDC powder 92
5.3 Results and Discussion 92
5.3.1 Synthesis and characterisation of fine
NiO powder
92
5.3.2 Characterisation of NiO-GDC sintered
pellet
96
5.3.3 Characterisation of Ni-GDC
cermets
98
5.4 Summary 100

Chapter 6
Synthesis and Characterization of
GdCoO3 based Cathode Materials
6.1 Introduction 101
6.2 Experimental 104
6.1.1 Preparation of precursor powders of
GdCoO3 and Ba-doped GdCoO3
104
6.1.2 Thermogravimetry and Calcination of
precursor powders
105
6.1.3 Characterisation of calcined powders 106
6.1.4 Cold compaction and sintering of
calcined powders
106
6.2.5 Evaluation of functional properties 107
6.3 Results and discussion 107
6.3.1 Synthesis of GdCoO3 and Ba-doped
GdCoO3 powders
107
6.3.2 XRD of GdCoO3 and Ba-doped GdCoO3
powders
109
6.3.3 Morphology of calcined powder 110
6.3.4 Sintering of GdCoO3 and Ba-doped
GdCoO3 powders
111
6.3.5 Coefficient of thermal expansion 117
6.3.6 GdCoO3-GDC composite 119
6.3.7 Electrical conductivity of GdCoO3 122
6.2 Summary
123

Chapter 7
Evaluation of Electrode
Performance by Electrochemical
Impedance Spectroscopy (EIS)
7.1 Introduction 124
7.2 Experimental 129
7.2.1 Cathode symmetric cell fabrication
129
7.2.2 Anode symmetric cell fabrication 130
7.3 Results and Discussion 131
7.3.1 Symmetric cells formed using pure and
Ba-doped GdCoO3
132
7.3.2 Effect of electrolyte interlayer on ASR
value
135
7. 3.3 Symmetric cells using composite
electrode
136
7.3.4 Effect of pore former on interfacial
polarization
140
7.3.5 Characterization of anode symmetric cell 144
7.4 Summary 145
Chapter 8
Fabrication and characterization
of single cells
8.1 Introduction 147
8.2 Experimental 149
8.2.1 Starting materials 149
8.2.2 Fabrication of anode supported half cell
by uniaxial pressing
149
8.2.3 Fabrication of anode supported half cell 150

by co-casting
8.2.3.1 Preparation of NiO-GDC slurry for tape
casting
150
8.2.3.2 Preparation of GDC slurry for tape
casting
150
8.2.3.3 Co-casting using doctors blade 151
8.2.3.4 Sintering of the tapes 153
8.2.4 Integration of anode supported half cell
with cathode
153
8.2.5 Performance testing of single cell 153
8.3 Results and discussion 155
8.3.1 On the fabrication of anode supported
half cell through doctor blade tape
casting
155
8.3.2 I-V characteristics of anode supported
cell prepared by uniaxial die pressing
158
8.3.3 I-V characteristics of anode supported
cell prepared by tape casting
160
8.4 Summary 161
Chapter 9 162
Conclusions
Future scope 166
References 167
Publications 184

i
Synopsis
Solid Oxide Fuel Cell (SOFC) is an all oxide electrochemical device which directly
converts chemical energy into electrical energy in an efficient and environmental
friendly manner [1]. SOFCs are required to be operated at high temperatures for
getting high power density. The operating temperature has been reported to be as high
as 1000 oC. However, operation at high temperatures leads to various practical
problems, such as, corrosion, thermal instability of the materials, loss of mechanical
integrity [2]. Interdiffusion of cations at the interfaces at high temperatures may lead
to formation of electrically insulating barrier at the interface and thereby decreasing
the cell performance over a period of time. Therefore, selection of SOFC functional
materials as well as materials required for assembling the cells become a constraint
for SOFCs operating at higher temperatures. These problems can be largely
circumvented by bringing down the operating temperature of a SOFC cell. Lower
temperature operation will lead to long term stability and reduced cost. Hence, there
has been continuous effort to reduce the operating temperature of SOFC without
sacrificing the overall performance.
For improved performance the internal resistance of a cell should be as low as
possible at the operation temperatures. In a fuel cell the internal resistance is primarily
comprised of the ohmic resistance contribution from the materials and interfacial
polarization resistance from the electrode-electrolyte interfaces. The ohmic resistance
of the electrolyte is much higher compared to the electrode materials. Therefore, the
electrolyte should be an excellent oxygen ion conducting material and the thickness of
the electrolyte layer should be minimum in the SOFC stack. There has also been
continuous effort to reduce the interfacial polarization resistance by way of searching
new electrode materials having superior electro-catalytic activity in the intermediate
temperature range. Optimization of cell fabrication methodology and electrode
microstructure plays an important role in reducing the area specific resistance of a cell

ii
and thus enhancing the performance. Further, the electrode materials must be
compatible with the electrolyte material.
Yttria stabilized zirconia (YSZ) is the most widely used electrolyte material till now.
The operating temperature for SOFC is between 800-1000 oC when YSZ is used as an
electrolyte. The high temperature operation can be minimized by the use of alternative
electrolyte materials having appreciable ionic conductivity at lower temperature.
Doped ceria, bismuth oxides and lanthanum gallate are few electrolytes reported in
the literature which have appreciably ionic conductivity at lower temperature [3].
However, in addition to high ionic conductivity an electrolyte must be stable in both
oxidizing and reducing environments. Bismuth oxide based systems fall short in terms
of their stability in reducing environment. In lanthanum gallate based electrolyte
systems gallium evaporation at elevated temperature is a major concern for use as
SOFC electrolyte. In doped ceria system change in valency state of cerium cations
takes place at high temperature and reduced environment leading to introduction of
electronic conductivity in the material [4]. However, it has been reported that at
intermediated temperature (600-800 oC) the electronic contribution is negligible and
ionic conductivity is appreciable in doped ceria system thus making it as a potential
electrolyte material for intermediate temperature solid oxide fuel cell (IT-SOFC)[5].
At the anode-electrolyte interface electrochemical combination of oxide ion and
hydrogen takes place. Nickel is the most suitable low cost material for the
hydrogenation reaction [6]. A composite of nickel and electrolyte material is
commonly used as an anode material. The composite anode structure helps in
matching the thermal expansion coefficient with the electrolyte material and extends
the triple phase reaction sites. NiO is generally used as the precursor material for
anode. NiO gets reduced to Ni under the cell operating conditions. The anode
microstructure in terms of particle size and distribution of composite phases play an
important role in determining the catalytic activity towards hydrogenation reaction
[7,8].
The oxygen reduction reaction of the cathode requires a mixed ionic and electronic
conductor (MIEC) for decreasing cathode resistance and thereby increasing the
performance [9,10]. In the intermediate temperature range doped LnCoO3 (Ln=

iii
lanthanides) system shows highest conductivity and lowest cathodic over potential.
However, mismatch in thermal expansion coefficient is a common problem in many
doped LnCoO3 system. For GDC electrolyte based SOFC, GdCoO3 based cathode
could be a candidate material. Limited literature is available on the use of GdCoO3 as
cathode material. The functional properties are influenced by addition of dopants.
Therefore, defining suitable composition with improved microstructure is of particular
importance for practical application.
As discussed above, the roles of polarization resistance and electrolyte thickness are
crucial for the overall performance. The ceramic fabrication technique plays an
important role in order to minimize the area specific cell resistance. The fabrication
parameters need to be optimized for a particular starting powder. Electrode and
interface microstructure can be tailored when starting with nano-ceramic powder.
Solution synthesis routes are known for producing high purity nano-sized powders of
mixed oxides at lower temperature.
In view of the above, the present thesis is aimed towards development of nano-
electroceramics for IT-SOFC application. Gadolinia doped ceria has been chosen as
the electrolyte material. Ni-GDC and Ba-doped GdCoO3 have been considered as the
anode and cathode materials, respectively. The following objectives were set to be
realized in the present study.
o Preparation and characterization of nano-powders of the above mentioned IT-
SOFC materials through solution synthesis route and optimization of
processing parameters.
o Study of sintering behavior of the nano-electroceramic powders.
o Evaluation of functional properties of individual IT-SOFC materials.
o Integration of cell materials to form symmetric cells and single cells and
electrochemical evaluation.
To meet the above objectives, 12 mol% gadolinia doped ceria (12GDC) powder was
synthesized by combustion route using different fuels. The characteristics of the
processes have been studied by thermal analysis of gel precursor. The processes have
been analyzed through thermodynamic calculation. Physical properties of powders
prepared through different route were characterized. Based on the characteristics of

iv
the synthesized GDC powder metal nitrate - citric acid gel combustion route was
chosen for the preparation of powder. In order to study the effect of dopant
concentration on the sintering and electrical behavior, GDC powders of different
composition (3, 6, 8, 10, 12, 15 and 18 mol% GDC) were synthesized by citrate-
nitrate gel combustion route. Shrinkage behavior of GDC powders was monitored by
a dilatometer. The powders were sintered to get pellets with density above 97% of
theoretical density. The dense sintered pellets of different compositions were used for
conductivity measurements using a frequency response analyzer. The contributions of
bulk and grain boundaries towards the total resistance have been delineated and the
conductivity has been explained on the basis of hopping frequency from the complex
impedance plot. The activation energies for oxygen ion conduction in the bulk and
grain boundary have been determined from the Arrhenius type relationship of
conductivity. It was confirmed that maximum ionic conductivity was obtained with 12
mol% GDC. 12GDC pellet sintered at 1200 oC are further heated for grain growth in
order to study the effect of grain size on ionic conductivity.
Ultrafine NiO powder for use in anode material was synthesized by solution
combustion route. NiO-GDC composition in 50:50 weight ratios was prepared by
mixing in a pot mill. Shrinkage behavior of the anode composition was studied using
a dilatometer. Electrical conductivity was measured after reduction in hydrogen
atmosphere. The effect of sintering temperature on the microstructure and electrical
conductivity of Ni-GDC cermet was studied. For estimating the ASR at the interfaces,
NiO-GDC electrode and GDC electrolyte have been integrated in symmetric cell form
to evaluate the interfacial polarization resistance by ac impedance spectroscopy
technique.
Gadolinium cobaltate doped with different percentage of barium was synthesized by
solution combustion route as well as solution polymerization method. Based on the
process and powder characteristics the later process was chosen for further study. The
effect of barium doping on sintering behavior, thermal expansion coefficient and
electrical conductivity was studied. Symmetrical cells were prepared and area specific
resistance for interfacial polarization was evaluated. The composition and processing
parameters were optimized for its application as cathode.

v
Based on the results of the above studies, anode supported single cells were fabricated
by tape casting method. In this electrolyte, anode was integrated by co-casting in tape
form and co-firing. Cathode slurry in terpinoel medium was painted over the
electrolyte followed by sintering. I-V characterization of the single button cell was
carried out.
The total work carried out in this thesis has been organized in eight chapters with
further sub-chapters as and when required.
Chapter 1: Introduction
The need of SOFC as an energy efficient and environment friendly new technology
has been addressed. This chapter contains a brief review on the functioning of a
SOFC, its advantages and disadvantages. Different designing aspects of a SOFC and
associated advantages are presented. It outlines technological importance of the
materials, and issues associated with high temperature operation of the fuel cell.
Review on the literature pertaining to the present work is narrated here. The necessity
of an intermediate temperature solid oxide fuel cell has been addressed. Present IT-
SOFC materials and their status are reviewed in this chapter. More detailed literature
review is also incorporated in the individual chapters. Finally, based on the literature
review a set of IT-SOFC materials have been selected and statement of the objectives
and scope of the work have been described.
Chapter 2: Experimental
The synthesis techniques adopted in preparation of different nano-ceramics and the
experimental techniques used for characterization of the ceramics have been presented
in the Chapter 2. The solution combustion route used for preparation of GDC and NiO
powder has been described. Solution polymerization route adopted for preparation of
gadolinium cobaltate has been elaborated. Thermal analysis (TG/DSC) of the gel
precursors / precursor powders has been carried out in order to study the nature of
thermal decomposition and determination of calcination temperatures. Phase
evolution of synthesized powders was characterized by X–ray diffraction after
calcination. Particle size of powder was characterized by laser scattering particle size
analyzer. Surface area was measured using BET principle. Particle morphologies were
observed in scanning electron microscope (SEM) and transmission electron

vi
microscope (TEM). The shrinkage behavior of the powder compact on heating was
observed by a dilatometer.
The microstructures of the sintered samples were observed in SEM. The
measurements of thermal expansion co-efficient of the sintered materials were carried
out using a dilatometer. Electrical conductivity was estimated from the four probe
measurements. Ionic conductivity of the electrolyte material was determined by ac
impedance spectroscopic technique. The principle of all of these characterization
techniques have been described in detail in this chapter.
The electrodes have been integrated with electrolyte to form symmetric cells for
evaluation of area specific interfacial polarization resistance. The methodology
adopted for integrating the cell has been described. The technique used for
determining ASR has been elaborated. Anode supported cell has been fabricated and
performance tested. The single cell fabrication methodology and the testing procedure
have been elaborated in this chapter.
Chapter-3: Synthesis and characterization of GDC electrolyte material
Preparation of gadolinia doped ceria powder through gel combustion route and its
characterization has been discussed in this chapter. Ceria powder doped with 12
mol% gadolinia was prepared by combustion route using different fuels (citric acid,
glycine and urea) to study the effect of fuel on the combustion process and powder
characteristics. The exothermic heat energies and adiabatic flame temperatures of the
possible combustion reactions have been calculated theoretically for different fuels.
TG-DTA results of the dried gels indicate that calcination step is not necessary for
powders synthesized using citric acid and glycine as fuel. However, the powder
produced using urea needs to be calcined at 700o C. The crystallite size of the
combustion synthesized powder depends on the type of fuel and is in relation with the
exothermic heat and the flame temperature of the reaction. The degree of
agglomeration was found to vary with the fuel type. Citric acid was found to give
optimum results in terms of producing carbon free nano-crystalline powder through a
controlled combustion reaction and with minimal agglomeration. As-synthesized
powder prepared using citric acid could be sintered to near theoretical density at 1250

vii
oC. It is observed that sintered density remains low when using powder cacined at
higher temperature. Based on the above observations, for the subsequent studies
gadolinia doped ceria powders have been prepared by combustion route using citric
acid as fuel.
In order to study the effect of gadolinia content on powder characteristics, its sintering
behaviour and ionic conductivity Gadolinia doped ceria with different compositions
were prepared by combustion route. X-ray diffraction patterns indicated that phase
pure powder is obtained in combustion synthesis for all the compositions. The
powders were nanocrystalline in nature as revealed from the X-ray line broadening.
The particle size (agglomerate size) measured by laser scattring particle size shows
monomodal distribution of particles for all the compositions. Analysis of crystallite
size, surface area and particle size indicates that the powders are agglomerates of
nanosize primary particles. The degree of agglomeration increases with increase in
gadolinia content. The shrinkage behavior on firing of the powders was studied using
a dilatometer. Although the shrinkage starts at a lower temperature the densification
completes at higher temperature as the gadolinia content increases. Shrinkage pattern
with different composition shows initial shrinkage at lower temperature below 600 oC
and shrinkage insertion temperature decreases with gadolinia doping which is
attributed to the increased reactivity with gadolinia doping. However for complete
densification the final temperature increases as hard agglomerates are formed with
increase in doping concentration.
Chapter-4: Ionic conductivity of GDC electrolyte
The results on the electrical conductivity of gadolinia doped ceria have been presented
and discussed in this chapter. The conductivity data have been presented in complex
impedance plot (Z” vs. Z’). After analyzing the impedance plot the conductivity is
presented in terms of Arrhenius plots, from which activation energy is calculated. The
hopping frequency related to oxygen jump has been evaluated from the imaginary
impedance spectra (plot of Z” vs. log frequency). The frequency corresponding to
max value of Z” could be related to the hopping frequency.
It has been observed that the conductivity of GDC system increases with increase in
gadolinia content. Maximum conductivity is obtained for 12 mol% gadolinia doped

viii
ceria. Thereafter, on further doping conductivity has been found to decrease. As the
gadolinia concentration increases the oxygen vacancy concentration increases leading
to increase in oxygen ion conductivity. However, at higher dopant concentration
vacancy association takes place leading to decrease in conductivity. The activation
energies for ion conduction /ion hopping have been found to increase with gadolinia
content. For the GDC compositions studied, the activation energy for bulk
conduction varies from 0.66 to 1.13 eV and the activation energy for grain boundary
conduction varies from 0.97 to 2.24 eV. The variation in activation energy has been
attributed to higher degree of association as the gadolinia content increases. For grain
boundary process the activation energies are higher than that of bulk. The difference
decreases with increase in gadolinia content.
In order to study the effect of grain size on ionic conductivity samples of 12 mol%
Gd2O3 doped ceria having different grain sizes were produced. In the low temperature
measurements, a significant decrease in the total resistivity was observed in the fine
grained sample. As the grain size decreases the bulk conductivity is found to decrease
and grain boundary conductivity is found to increase. Analysis of the impedance
spectra indicates that the relaxation frequencies in the bulk and the grain boundary are
influenced by grain size. This behavior explains well the significantly higher ionic
conductivity in nanocrystalline doped ceria and zirconia structures reported earlier by
many authors. However, improved ionic conductivity in fine grained material is
observed only in the lower temperature range where grain boundary effect is
dominant. In the higher temperature range, where the bulk effect is dominant, the
total conductivity increases with increase in grain size.
Chapter-5: Synthesis and characterization of Ni-GDC composite for SOFC
anode
NiO powder was synthesized by combustion method using glycine and citric acid as
fuels. Results of thermal analysis and X-ray diffraction data show that as-synthesized
powder contains some carbonaceous material and a mixture of NiO and Ni. Therefore,
the powder was calcined at 700 oC for total conversion to NiO. SEM micrographs of
the phase pure powder shows submicron size particles. Based on the recovery of
powder, citric acid was chosen as fuel. Phase pure NiO and GDC powder are properly

ix
mixed in a ball mill for better homogenization. Conductivity of a sintered bar pellet
after reduction shows a value more than 1100 Scm-1
in the operating temperature
region. Thermal expansion co-efficient of Ni-GDC is close to that of GDC electrolyte
material. Symmetric cells have been fabricated using dense electrolyte and this NiO-
GDC anode. ASR value of a NiO-GDC/GDC symmetric cell measured as low as 0.06
Ώ.cm at 600 oC.
Chapter-6: Synthesis and characterization of GdCoO3 based cathode materials
This chapter deals with the development of GdCoO3 based new cathode material.
Synthesis of the material was carried out by combustion method as well as solution
polymerization method. Based on the thermogravimetric and X-ray diffraction results
the as synthesized powder in combustion was calcined at 700 oC and the other powder
at 1000 oC. Nano-crystalline powder was produced by a solution polymerization route
and submicron size powder in combustion route as seen in the TEM micrographs.
Shrinkage behavior of GdCoO3 was observed with Ba doping. It has been observed
with barium substitution that shrinkage starts at a lower temperature attributed to the
more defect formation with doping. Electrical conductivity of GdCoO3 at low
temperature increases with increases with barium doping and remains almost
unaffected at higher temperature. The conductivity of GdCoO3 system is sufficient for
better current collection. Thermal expansion of the material decreases with barium
substitution and with 10% Ba substitution the TEC has decreased from 16 to 12 x 10-6
K-1
.
Chapter-7: Evaluation of electrode performance by electrochemical impedance
spsctroscopy
Measurement of area specific resistance of electrode material determines the
interfacial polarization resistance of the electrode electrolyte interface. Fabrication
methodologies has great role in determining the interface i.e. the triple phase
boundary. Hence this ASR value in the symmetric cell qualifies both the material and
the fabrication procedure. Slurries of electrode material in terpinol medium were
applied over dense electrolyte pellet. Symmetric measurements were taken in
respective environment as seen in the fuel cell working condition. The interfacial
polarization resistance of a dense NiO-GDC anode was 0.06 ohm.cm2 at 600
0C in
hydrogen environment. This value is comparable to the lowest ever ASR value

x
reported in case of NiO-GDC anode. SEM micrograph and EDS analysis showed well
distributed Ni particles in GDC matrix helpful in decreasing the resistance.
From the symmetric cell measurement, the area specific resistance (ASR) of the pure
GdCoO3 was calculated to be 5 ohm.cm2 at 900
0C. An attempt to increase the triple
phase boundary was initiated with an addition of porous electrolyte layer, the
measured ASR value was further decreased to 2 ohm.cm2 at 900
0C. It has been
observed that a composite layer of cathode and electrolyte layer has helped in
decreasing the ASR value to 0.48 ohm.cm2 at 900
0C. With Barium doping the ASR
value is decreased because of mixed conductivity behavior [MIEC]. However the
ASR values for sample with 10 mol% and 15 mol% Ba are not quite different. When
graphite pore former was added the ASR value of a pure GdCoO3 cathode decreases
from 0.48 to 0.265 ohm.cm2 and 0.40 to 0.12 5 ohm.cm
2 for 10 mol% Ba doped
sample. This change in ASR value is due to increase in the triple phase boundary area.
Chapter-8: Fabrication and characterization of single cells
This chapter describes the methodology of Ni-GDC anode supported single cell
fabrication by tape casting and its characterization. The materials used for electrolyte,
anode and cathode were of optimized composition and prepared using optimized
process parameters. The compositions of the tape casting slurries were suitably
formulated based on powder characteristics. For the preparation of single cells, tapes
of GDC electrolyte and NiO-GDC anode precursor were co-cast on a glass plate. The
bi-layer was fired at 1350 oC to achieve near theoretical densification of GDC
electrolyte. The cathode layer was formed by screen printing using a terpineol based
slurry of cathode material followed by firing at 1050 oC. Microstructural
characterization of the cell by SEM showed good adherence between the three layers
before and after testing of cell. A maximum power density of 80 mW.cm-2
was
obtained for these types of cells at 800 oC. The power density is expected to increase
by improving the current collection.

xi
Future scope:
Ba-doped GdCoO3 being a novel cathode material there is need to study its long term
stability under the cell operating conditions. The cells prepared using the
nanoceramics as studied here need to be performance tested extensively. There is a
further scope in optimization of cathode and anode microstructure for enhanced
performance.
References:
1. N Q Minh, J Am Ceramic Soc 76 (1993)563.
2. J.A.M van Roosmalen and E.H.P. Cordfunke, Solid State Ionics 52(1992) 303.
3. Keegan C, Wincewicz, Joyce S. Cooper, Journal of power Sources
140(2005)280.
4. Y. Zhou, M.N. Rahman, Acta. Mater., 45 (1997) 3635.
5. B.C.H. Steele, Solid State Ionics, 129 (2000) 95.
6. Jan Rossmeisl, Wolfgang G. Bessler, Solis State Ionics 178(2008) 1694.
7. Lee, J. H., Heo, J. W., Lee, D.S., Kim, J., Kim, G.H., Lee, H.W.et al,. Solid
State Ionics, 158 (2003) 225.
8. Hideto Koide, Yoshiyuki Someya, Toshihiko Yoshida, Toshio Maruyama,
Solid State Ionics 132(2000) 253.
9. S.P. Jiang, W. Wang, Solid State Ionics 176(2005) 1351.
10. Chunwen Sun, Rob Hui, Justin Roller, Journal of Solid State Electrochemistry
14(2009) 1125.

xii
List of figures
1. Fig.1.1 Schematics of a fuel cell
2. Fig. 1.2 Current - voltage (I - V) characteristics of a fuel cell
3. Fig. 2.1 Schematic presentation of solution polymerization reaction
4. Fig. 3.1 Flow sheet for synthesis of GDC powder by combustion route
5. Fig.3.2 TG-DSC of gel precursors formed using different fuels; (a) citric acid,
(b) glycine and (c) urea
6. Fig.3.3 TG patterns of the gel precursors of pure ceria, 4GDC and 18GDC in
flowing oxygen atmosphere
7. Fig. 3.4 XRD patterns of the powder samples obtained after combustion
synthesis using different fuels (a) citric acid, (b) glycine and (c) urea
8. Fig. 3.5 TEM images of the combustion synthesized powders; (a) citric acid
route, (b) glycine route and (c) urea route
9. Fig. 3.6 SEM of sintered pellets; (a) citric acid route, (b) glycine route (c) urea
route
10. Fig. 3.7 Linear shrinkage as recorded from dilatometer experiments under
constant rate (4 oC/min) of heating
11. Fig. 4.1 SEM micrographs of the samples fired at (a)1200 (b)1400 and
(c)1500 oC
12. Figure 4.2 Complex impedance plot of different samples (GDC12, GDC14 and
GDC15) at (a) 300 oC (b) 500 and (c) 1000
oC
(c)
2µm
xiii
13. Figure 4.3 Variation of (a) bulk conductivity and (b) effective grain boundary
conductivity with temperature presented in the form of Arrhenius plot
14. Fig. 4.4 Variation of total conductivity with temperature (a) in lower
temperature range, (b) in higher temperature range
15. Figure 4.5 Imaginary impedance spectra of different samples (GDC12, GDC14
and GDC15) at (a) 300 oC, (b) 500 and (c) 1000
oC
16. Figure 4.6 Variation of hopping frequency with temperature (a) bulk and
(b)grain boundary
17. Fig 4.7 Variation of lattice conductivity with composition at different
temperatures
18. Fig. 4.8 Variation of grain boundary conductivity with composition at different
temperatures
19. Fig. 4.9 Variation of total conductivity with composition
20. Fig.4.10 Variation of activation energy of grain and grain boundary with
composition
21. Fig.4.11 Variation of activation energy with composition
22. Fig. 5.1 Flowchart for the preparation of fine NiO powder through combustion
route
23. Fig. 5.2 TG-DSC pattern of gel precursor of NiO in the combustion method
24. Fig. 5.3 X-ray diffraction pattern of as-synthesized (black line) and calcined
(red line) NiO powder
25. Fig.5.4 SEM micrograph of the calcined NiO powder

xiv
26. Fig. 5.5 TEM image of calcined NiO powder showing nm size primary
particles
The insert show SAED pattern
27. Fig. 5.6 SEM micrograph of NiO-GDC pellet sintered at 1250 oC
28. Fig. 5.7 EDS element scan of the NiO-GDC surface and the corresponding SE
image
29. Fig: 5.8 Variation of conductivity with temperature of a reduced NiO-GDC bar
pellet
30. Fig: 5.9 SEM micrograph of the reduced Ni-GDC pellet
31. Fig. 6.1 Flow sheet for the preparation of GdCoO3 and Ba-doped GdCoO3
powders
32. Fig. 6.2 TG-DSC curves of the GdCoO3 powder precursor obtained by solution
polymerization route
33. Fig. 6.3 X-ray diffraction pattern of GdCoO3 powder (calcined at 800 oC)
34. Fig. 6.4 X-ray diffraction pattern of Ba-substituted GdCoO3 powder (calcined
at 800 oC)
35. Fig. 6.5 TEM image of phase pure GdCoO3 powder (calcined at 800 oC)
36. Fig. 6.6 (a) Shrinkage pattern of green pellets on heating in air upto 1300 oC
37. Fig. 6.6 Shrinkage pattern of green pellets on heating in air upto 1300 oC (b)
GdCoO3 (C) 10GBC
38. Fig. 6.6(d) Shrinkage pattern of green pellets of 15GBC on heating in air upto
1300 oC

xv
39. Fig.6.7 X-ray diffraction pattern of GdCoO3 sintered at 1200 oC
40. Fig. 6.8 SEM micrograph of pellet sintered at 1200 oC (a) GdCoO3 (b)10GBC
(c) 15GBC
41. Fig. 6.9 Linear thermal expansion curve of GdCoO3 sintered at 1200 oC
42. Fig. 6.10 Linear thermal expansion curve of GdCoO3, 10 and 15 mol% barium
doped samples
43. Fig. 6.11 X-ray diffraction pattern of GdCoO3 –GDC mixture sintered at 1200
oC
44. Fig.6.12 Linear thermal expansion curve of GdCoO3-GDC composite sintered
at 1200 oC
45. Fig.6.13 Linear thermal expansion curve of Ba doped GdCoO3 and GdCoO3-
GDC composite sintered at 1200 oC
46. Fig. 6.14 Electrical conductivity of dense GdCoO3 pellet sintered at 1200 oC
47. Fig.7.1 Schematics of triple phase boundary area (TPB)
48. Fig.7.2 Schematics of the oxygen reduction reaction paths at cathode
49. Fig. 7.3 Electrochemical reactions in a composite cathode
50. Fig 7.4 Complex impedance plots of symmetric cells of GC and GB10C
51. Fig. 7.5 SEM micrographs showing the electrode-electrolyte interfaces. (a) GC
electrode (b) GB10C electrode
52. Fig 7.6 Complex impedance plots of symmetric cells formed using electrolyte
interlayer (a) GC (b) GB10C

xvi
53. Fig. 7.7 SEM micrographs showing the electrode-electrolyte interfaces of
symmetric cell formed using GDC interlayer. (a) GC electrode (b) GB 10C
electrode
54. Fig. 7.8 Complex impedance plots of symmetric cells formed using composite
electrodes
55. Fig. 7.9 SEM micrographs showing the electrode-electrolyte interfaces of
symmetric cell formed using composite electrode (a) GC-GDC electrode (b)
G10BC -GDC electrode
56. Fig. 7.10 Complex impedance plots of symmetric cells formed using composite
electrodes
57. Fig. 7.11 SEM micrographs showing electrode-electrolyte interfaces of
symmetric cells of (a) GC-GDC-G electrode (b) GB10C-GDC-G electrode (c)
GB10C-GDC-G electrode
58. Fig.7.12 Variation of ASR with temperature for NiO-GDC/GDC symmetric
cell
59. Fig: 7.13 SEM micrograph NiO-GDC/GDC symmetric cell
60. Fig. 8.1 Doctors’ Blade tape casting machine
61. Fig. 8.2 Sample fixing assembly in the Probostat unit
62. Fig. 8.3 Anode and electrolyte layer of green tape and sintered single cell
63. Fig. 8.4 SEM micrograph of anode-electrolyte half cell at low magnification;
(a) 230 X, (b) 970 X
64. Fig. 8.5 SEM micrographs of (a) GDC electrolyte and (b) NiO-GDC anode of
the sintered bilayer
xvii
65. Fig. 8.6 I-V characteristics of single cell fabricated by tape casting
66. Fig. 8.7 SEM micrograph of single cell fabricated by die pressing (after cell
testing)
67. Fig 8.8 I-V curve of single cell fabricated by tape casting
68. Fig. 8.9 SEM micrograph of single cell fabricated by tape casting (after cell
testing)

xviii
List of tables
1. Table 1.1 Different types of fuel cells: A comparison
2. Table-3.1 Oxidizing and reducing valency of oxidants and fuels used in the study
3. Table 3.2 Calculated thermodynamic quantities of combustion reaction using
different fuels
4. Table 3.3 Crystallite size, particle size and surface area of combustion synthesized
ceria and doped ceria powders
5. Table 4.1 Activation energies for the bulk and the grain boundary conduction
6. Table 7.1 Different cathode compositions used for making symmetric cells
7. Table 7.2 ASR values of symmetric cells of GC and GB10C at different
temperatures
8. Table 7.2 ASR values of symmetric cells of GC and GB10C at different
temperatures
9. Table 8.1 Formulation used for the preparation of tape casting slurries
10. Table 8.2 Variation in the thickness of the tape in drying and at sintering stage
for NiO-GDC anode and GDC electrolyte tape

1
Chapter 1
Introduction
Fossil fuel is widely used as source of energy at present and more than 80% of the energy
comes from coal, natural gas, and petroleum products [1]. However, considering a limit
in these natural resources and increasing demand of power in modern life, the society has
been compelled to think of new renewable energy sources before confronting any
severity in future. The consumption of natural fuels leads to green house effect and this
has further accelerated the quest for renewable energy sources. Renewable energy
sources, such as, solar energy and wind energy are not continuous sources of energy. In
the quest for continuous and reliable energy sources hydrogen is being considered
worldwide as a future energy carrier. However, it is not naturally available and needs to
be produced using renewable energy sources and nuclear energy. Fuel cell is considered
to be a promising technology towards direct conversion of chemical energy of fuel to
electrical energy without any intermediate step [2-3]. Being a direct energy conversion
device the efficiency of energy production in fuel cell is high. The operation of a fuel cell
is similar to a battery; the difference is that fuel cell is a continuous source of energy as
long as the reactants are supplied to it. Like battery, it can be used in remote locations.

2
Fuel cell technology is being investigated in many countries for transport and power
generation applications.
1.1 Different types of Fuel Cells
Fuel cell was first demonstrated by Sir William Grove in 1839 using a liquid electrolyte
[4]. Later on in 1899, Nernst discovered the solid oxide electrolyte and the famous Nernst
equation was established. Based on the electrolyte used fuel cells can be classified into
five different types; namely, Polymer electrolyte membrane fuel cell (PEMFC), Alkaline
fuel cell (AFC), Phosphoric acid fuel cell (PAFC), Molten carbonate fuel cell (MCFC)
and Solid oxide fuel cell (SOFC). The moving ions and the interfacial catalytic reactions
are different for different fuel cells. PEMFC, PAFC and AFC operate at a lower
temperature region and pure hydrogen is used. However, the other two fuel cells (MCFC
and SOFC) are operated at a higher temperature region. High temperature operation
enables internal reforming of hydrocarbon in these fuel cells. Fuel and oxidant are
supplied continuously at the anode side and cathode side, respectively. Based on the
electrolyte and working temperature different types of catalyst are used for these cells. A
comparison of different types of fuel cells is shown in Table 1.1.
Among the fuel cells, the low operating temperature fuel cells (PEMFC, AFC and PAFC)
have been demonstrated in commercial application but not with a cost competitive basis.
The cost of other two types of fuel cells, namely, MCFC and SOFC, are also high and

3
lack in competition with the contemporary power generating systems. MCFC uses molten
carbonate at high temperature and hence, corrosion problems need to be addressed with
long time operation. The modular design with all-solid construction, operating at high
efficiency has made SOFC attractive compared to other types of fuel cells. Westinghouse
laboratories have worked extensively towards the commercialization of fuel cell [5].
Table 1.1 Different types of fuel cells: A comparison
Fuel cell
type
Operating
temperature
(C)
Fuel Mobile
ion Electrolyte
Power
efficiency
( %)
Low
temperature
PEMFC 60-90 Hydrogen H+
Sulphonated
polymers 50-55
AFC 50-200 Hydrogen OH-
Aqueous
KOH 45-50
Medium
temperature PAFC 180-210 Hydrogen H
+ H3PO4 35-45
High
temperature
MCFC 650 Reformed
hydrocarbons CO3
2- (Na/K)2CO3 45-53
SOFC 650-950
Hydrogen,
Reformed
hydrocarbons
O2-
YSZ 45-57

4
1.2 Solid Oxide Fuel Cells (SOFC): Operating principle
In a solid oxide fuel cell (SOFC) the solid oxide electrolyte is sandwiched between two
porous electrodes. Oxidant is passed through the cathode and oxygen ions are generated
through electrochemical reactions at the cathode-electrolyte interface. Under chemical
potential gradient these oxygen ions are transported through the oxygen conducting
electrolyte to the anode side. Hydrogen is passed through the anode and at the anode-
electrolyte interface the oxygen ions combine with the hydrogen to form water. The
electrochemical reactions lead to the flow of current in the external load thus producing
electricity. The schematic of a solid oxide fuel cell is shown in Fig. 1.1.
Fig.1.1 Schematics of a fuel cell

5
The electrochemical reactions of the fuel cell can be written as:
2
2
2
2 2
2 2 2
1: 22
: 2
1: 2
Cathode O e O
Anode H O H O e
Overall O H H O
During a fuel cell operation oxygen is reduced at the interface of cathode and electrolyte,
whereas hydrogen is oxidized at the anode side. The difference in the oxygen chemical
potential is the driving force for the migration of oxygen ions from cathode to anode side.
At the anode and electrolyte interface hydrogen combines with oxygen to form water
along with release of two electrons which flows through the external circuit. All the
electrochemical reactions at the electrode-electrolyte interface occur within a distance of
less than 20 m from the electrolyte surface, referred as the functional layer [6-7].
Beyond the functional layer rest part of the electrode is used for current collection and
facilitates the flow of oxidants and fuels to the reaction sites. Dense electrolyte maintains
the partial pressure difference between the cathode and anode. The difference of the
chemical potential between oxidant gas and fuel is converted to the electrostatic potential
difference of the anode and the cathode. From the partial pressures of different gases, the
open circuit voltage (OCV) of the cell is determined using Nernst equation.
……………(1.1)
where, R is the gas constant (8.314 J.mol-1
.K-1
) and F is the Faradays constant
(96500 C.mol-1
).

6
For a hydrogen-oxygen fuel cell taking pO2 at the cathode side as 0.21 atm.(in case of air)
and pO2 at the anode side as 10–18
atm. the open circuit potential is calculated to be 1.229
V. The potential developed in a fuel cell obeys Nernst equation at zero current. While
drawing current from a cell, the cell voltage decreases due to internal resistance. Current
to voltage characteristics of a typical SOFC is shown in Fig. 1.2.
Fig. 1.2 Current - voltage (I - V) characteristics of a fuel cell [5]
There are three distinct regions in the I-V curve representing three different reaction
mechanisms. The low current density region is called the activation polarization domain
where the charged species have to move through an activation barrier. Approximately
200 mV of potential is lost to overcome the activation barrier. Hence, there is a need of
high performance material to reduce this activation barrier.

7
At high current density region, there will be large concentration of products at the
interface site. The products may accumulate at the interface, leading to concentration
polarization at the interface. This concentration polarization arises due to inadequate
mass transfer of reactants and products. Between the activation and concentration
polarization region the current to voltage follows the ohm’s law. This region is called
ohmic region where most of the fuel cells are operated. All the three polarizations are
available at any point of time, however their contribution to the total resistance are
different.
The performance of a fuel cell is represented by the power density at a particular
temperature. Powder density is the multiplication of voltage to current density of the fuel
cell. While drawing current, the cell voltage decreases. Voltage drop is associated with
different polarization and ohmic losses in the circuit as well as in the cell. The voltage
output is given by:
E = Eeq −EL − ηact − ηiR − ηdiff ……………………(1.2)
where, Eeq is the equilibrium voltage as calculated from Nernst equation, EL is the voltage
loss due to leaks through the electrolyte, ηact is the activation over potential due to slow
electrode reactions, ηiR is the over potential due to ohmic resistances in the cell and ηdiff is
the over potential due to concentration polarization. EL is attributed to the gas mixing that
may occur through the porous electrolyte layer and improper sealing. Electronic
conductivity in electrolyte also leads to loss in voltage and is accounted in EL.

8
1.3 Advantages of SOFC
Solid oxide fuel cell is an environmental friendly, pollution free energy conversion
system which directly converts chemical energy to electrical energy with high efficiency.
Advantages of SOFC are numerous and few are highlighted below.
1. High efficiency: SOFC operates at high temperature, hence rate of reaction
increases. The byproduct is also a source of heat and can be combined with other
energy conversion system to increase the efficiency. The high grade waste heat
coming through the byproduct can be coupled with other new energy technologies
eg. Micro turbines to increase the overall efficiency. Efficiency of such systems
reaches to ~90% with CHP applications with natural fuels [8-10].
2. Modular design: All components are solid oxides, so SOFC can be constructed in
different shapes and sizes to fulfill the need. There are no moving parts and no
corrosive liquids are used. It is a high performance electrochemical device with
great reliability and durability.
3. Fuel flexibility: SOFC can be operated on all type of hydrocarbon fuels, whereas
all other type of fuel cells requires clean hydrogen, free of impurities. Operating
the SOFC at high temperature favors internal reforming of the fuel. The fuel can
be passed directly at the anode or with reforming. Hydrocarbon fuels like LPG,
diesel, petrol methanol, and butane can be used directly in SOFC.
4. No green house gas and noise: No noise is produced during the operation of the
fuel cell. In the electrochemical reaction water is produced as byproduct along
with very little amount of NOx and SO2 gases in ppm level.

9
1.4 Candidate SOFC materials
There are three basic components namely, electrolyte, cathode and anode, which
constitute the fuel cell. Interconnect and high temperature sealants are the other important
materials required for assembling multiple SOFC cells and testing of SOFC cells.
Suitable high temperature sealant is used to separate the oxidizing chamber from the fuel
chamber. The interconnect helps in collecting current from the electrodes of multi-cell
SOFC assembly. All the components should satisfy some basic properties for use in
SOFC. These are: chemical, mechanical and thermal stability in the operating conditions,
sufficient conductivity, chemical compatibility with other cell components and matching
coefficient of thermal expansion (CTE) with other cell components. Fabrication criteria
are also important factors governing the performance of the cell. The stability of
individual components and the chemical compatibility among the cell materials should be
maintained during the fabrication of cells. Finally, the fabrication and processing cost
should be kept at a minimum. The requirements of different cell components are
described below.
1.4.1 Electrolyte material
In a solid oxide fuel cell, electrolyte is the most important component around which the
material selection starts. Therefore, the property of the electrolyte material defines the
whole structure of the fuel cell. The following criteria should be met by a material for
application as an electrolyte of SOFC.

10
i. The material should have appreciable oxygen ionic conductivity in the operating
temperature regime.
ii. The transport number for oxygen ion conduction should be close to unity, i.e. it
should have negligible electronic conductivity.
iii. The material should be stable over a wide range of oxygen partial pressure.
iv. Electrolyte should have good mechanical strength and good thermal shock
resistance.
v. Electrolyte should be impervious and free of porosity after fabrication and
sintering.
vi. Compatibility with electrodes and interconnect material.
vii. Chemically inert to the fuel cell gases.
Oxides with fluorite structure have been investigated for use as electrolyte. Doped ZrO2
ceramics having fluorite structure are first investigated as electrolyte material for high
temperature operation of the fuel cell between 800-1000 oC. Aliovalent metal oxides,
such as, CaO, Y2O3, Sc2O3 and other rare earth oxides form solid solutions with zirconia
and stabilize the cubic phase. In addition, these aliovalent oxides introduce vacancies in
the oxygen sub-lattice as charge compensating defects. The defect reaction can be
presented in Kröger-Vink notation as given below for yttria addition in zirconia.
O
x
OZr
ZrO VOYOY 32 '2
322
The diffusion of oxygen ions through the vacancies is responsible for the high ionic
conduction in yttria stabilized zirconia (YSZ). Oxygen ions hop through the vacancies

11
and under a potential gradient a net flux of ions takes place resulting in ionic
conductivity. The conductivity value depends on the dopant concentration [11]. As the
dopant concentration increases concentration of oxygen vacancy increases. It may be
apparent that the conductivity will increase with dopant concentration. However, for
various zirconia systems it is known that conductivity increases with dopant
concentration, exhibits a maximum and subsequently decreases with increasing dopant
concentration. Increasing trend in conductivity can be explained by increase in the
number of vacancies; whereas decrease in conductivity is associated with decrease of
vacancy mobility due to trapping of oxygen vacancies through vacancy clustering or
electrostatic interaction [12]. In ZrO2-Y2O3 system the maximum conductivity has been
found at 8 mol% Y2O3 concentration. Yttria stabilized zirconia (YSZ) is chemically stable
and remains a purely oxygen ion conductor over a wide range of oxygen partial pressure
[13-14]. Therefore, YSZ is widely used as an electrolyte material for high temperature
SOFC.
The oxygen ion conductivity also depends on the microstructure and impurity content.
Presence of silica is detrimental to the ionic conductivity in solid oxide electrolytes.
Silica segregates at the grain boundary and increases the grain boundary resistivity
substantially. Effect of Al2O3 impurity on the microstructure, electrical resistivity,
mechanical strength and SOFC performance in YSZ electrolyte system was studied by
Ishizaki et al.[15]. Alumina addition decreases the total resistance and increases the
mechanical strength. The added alumina acts as scavenger of silica and precipitates at the
grain boundary.
12
Doped ceria based electrolyte are studied extensively after YSZ electrolyte material.
Compared to zirconia system, higher conductivity of doped ceria system at lower
temperature region with lower activation energy makes the material a candidate
electrolyte material [16]. Ceria based electrolyte materials have some inherent electronic
conductivity at higher temperature and reducing environment. Hence these types of
materials are used for intermediate temperature fuel cell applications.
Among the fluorite based electrolyte system, Bi2O3-based oxides have also been
investigated [17-18]. These materials have conductivity values several orders of
magnitude higher than that of YSZ [19-21], at similar condition of temperature and
oxygen partial pressure. -cubic phase in Bi2O3-PbO2 system has conductivity value as
high as 1.0 S.cm-1
at 600 oC with a relatively low activation energy (0.4 - 0.5 eV). The
disadvantage of a Bi2O3 based systems is their stability over a narrow range of oxygen
partial pressure and at high temperature [22]. Hence, this system is not pursued largely by
researchers.
Solid electrolytes with ABO3 perovskite structure is another class of materials used for
SOFC applications [23-31]. In this system oxygen vacancy is generated by substitution of
aliovalent cations at A and B-site. The total conductivity depends on the activation
energy for oxygen ion conduction and free volume available for oxygen migration [31].
Some of the well studied perovskite systems are CaTi1-xAlxO3 -δ, CaTi1-xMgxO3- δ, La1-
xCaxAlO3, BaCe1-xGdxO3 --δ, SrZr1-xScxO3- δ, and doped LaGaO3. Among these materials
lanthanum gallate based materials have been proven as alternate promising electrolyte

13
material for use in intermediate temperature solid oxide fuel cell (IT-SOFC) [32]. Both A
site and B-site are substituted by divalent ions for increasing the conductivity value.
Among this family, La1-xSrxGa1-yMgyO3 (LSGM) has been reported to have better
conductivity properties [32]. LSGM has significantly higher oxygen ion conductivity
than YSZ in the intermediate temperature region and is considered to be a candidate
electrolyte material for IT-SOFC. The disadvantage of this system is the instability of the
compound and difficulty in preparing single phase LSGM. Insulting phases of La4Ga2O9
and SrLaGa3O7 evolve at the grain boundary during the phase formation and degrades
the performance of the fuel cell in the long term operation [32].
1.4.2 Anode materials
In a fuel cell, anode is called the fuel electrode through which fuel is fed to the system.
Anode faces the reducing environment at high temperature, 700-1000 oC. At the anode
side hydrogen combines with the oxygen ion at the electrolyte interface. The following
criteria should be met by a material for application as an anode for SOFC.
i. Good electronic conductivity in reducing environment.
ii. Porous enough for the passage of inlet fuel and exit of byproduct (H2O).
iii. Good catalytic activity towards hydrogen oxidation reaction.
iv. Stability (chemical, mechanical, morphological and phase) in the operating
condition.
v. Thermal expansion coefficient matching with other cell components.
vi. Chemical compatibility with electrolyte and the interconnect material.

14
Ni, Co, Cu, Ru and Pt are some metals which have better catalytic activity for hydrogen
oxygen recombination reaction. Though metals have good catalytic properties towards
oxidation of fuels, they cannot be used in the fuel cell operating condition alone. TEC of
metals is too high in comparison with the electrolyte material. In order to bring down the
TEC of anode structure a composite electrode approach is adopted in which a mixture of
metal catalyst and ceramic is used. The ceramic helps in matching the TEC with other
cell components. Conventionally, the electrolyte material is chosen to make the ceramic
phase of the cermet structure. Ru, Pt and Co if used increases the cost of anode. Hence Ni
is widely used as anode material in SOFC. NiO is generally used as precursor of Ni and
undergoes reduction in the operating condition of SOFC. The minimum amount of Ni for
percolation in YSZ matrix is 30%. In long term operation of the fuel cell coarsening of Ni
takes place.
Ni-YSZ, Ni-GDC, Cu-GDC are most extensively used anode materials for SOFC
applications. The metallic phase is used for catalytic reaction and electronic conduction
in the anode phase. The electrolyte is used to bring down the TEC value close to the
electrolyte material. As the reaction is heterogeneous in nature more the reaction sites
faster will be the reaction kinetics. The active reaction sites are located at the triple phase
boundary (TPB) where ceramic electrolyte, metal catalyst and pores meet together. The
TPB length at the anode-electrolyte interface should be maximized for good electrode
performance [33]. There should be good percolation path for the electron transfer, oxygen
migration and gas diffusion in the anode layer which is controlled by the microstructure.
For this purpose fine nickel particles and high electrolyte to nickel ratio is used. Graded

15
microstructure was adopted by many researchers where both fine and coarse electrolyte
and Ni particle are used to optimize the microstructure. Mathematical calculation shows
30 vol% metallic phase as the percolation threshold of metallic conduction. Use of fine
Ni particles from combustion method alters the electrical properties near the percolation
limit [34]. At high temperature, anodes with high nickel content degrade fast due to
coarsening of nickel particles. When natural gases are used as fuel carbon deposition on
nickel catalyst reduces the catalytic activity. Copper based anode materials have been
tried along with ceria based material because of lower C-C bond formation to get rid of
the carbon deposition at anode. However, these materials show very low electro-catalytic
activity.
Ceria based nickel cermet anode was considered during 1960 [35-37] because of some
added advantages of doped ceria compared to YSZ. Ceria has good catalytic activity for
carbon oxidation. Hence, fuels cells operating on hydrocarbon fuels or biogas have
considerable decrease in the carbon deposition at the anode side. Ceria has some
electronic conductivity contribution along with ionic conductivity which helps in
increasing the electrocatalytic reaction [36,37]. Nanocrystalline ceria can be infiltrated in
the anode to enhance the reaction sites. Presence of nano crystalline ceria is reported to
increase the tolerance towards carbon deposition and sulfur poisoning [35,38].
A new class of redox stable La1-xSrxCrxMn1-xO3 (LSCM) anode material has been
developed [39-42]. The advantage of this material is that it has good electrochemical
activity at both cathode and anode environment and compatibility with many solid

16
electrolytes. This material has very low electrical conductivity and low ionic transport.
However, this can be improved by YSZ or ceria addition in the anode. Another advantage
of this material is that it can be used as cathode and or anode in single chamber SOFC.
1.4.3 Cathode materials
Cathode is a porous oxide material through which air/oxygen is passed to the electrolyte.
At the cathode-electrolyte interface, reduction of oxygen takes place. The reaction is
heterogeneous in nature where the cathode material plays an important role. Cathode
alternatively is knows as air electrode in SOFC has to meet the following requirements:
1. High electrical conductivity.
2. Porous enough for transport of oxidant to the reaction site.
3. Stability (chemical, mechanical dimensional and phase) in the operating
condition.
4. TEC matching with other cell components.
5. No interaction with electrolyte and the interconnect material (no diffusion of
materials).
Doped lanthanum manganites, and doped lanthanum cobaltites are widely used as
cathode materials. The dual valency of Mn and Co governs the conduction mechanism in
these types of cathodes. The reaction at the cathode-electrolyte interface is very slow and
dominates the overall reaction rate of SOFC. Cathode offers major resistance component
to the total resistance of SOFC. Suitable material selection and fabrication is must for
better realization of a fuel cell.

17
Manganites
Manganite based perovskite (Ln1-xAxMnO3) (Ln- lanthanides, A= Ca, Sr, Ba, Pb)
materials is a state of art cathode material for its high electronic conductivity, matching
thermal expansion co-efficient with many electrolyte materials (e.g. YSZ), and
appreciable catalytic activity for oxygen reduction reaction at the cathode-electrolyte
interface [43-49]. Lanthanum strontium manganite (LSM) is widely used as a cathode
material for fuel cells operating between 800 to 1000 oC [44-47,50-55]. Nickel and cobalt
based cathode materials have higher electronic conductivity and good catalytic activity
compared to manganite based cathode material. However, these materials have high
thermal expansion coefficient and poor stability. The solubility of the aliovalent dopant
like Ca, Sr, Ba and Pb varies from 40-70% in the lanthanum manganate cathode material
[48,56-59]. This solubility limit depends on the size of the lanthanide ion.
Manganite systems show some oxygen non-stoichiometry and this amount varies with
temperature and doping level. The catalytic properties and transport properties depends
on this non-stoichiometry, which is responsible for electronic conductivity and oxygen
ion diffusion. The concentration of oxygen vacancy at the cathode surface influences the
cathodic polarization and hence the catalytic property [55,60-62]. In air at a temperature
below 1000 oC LSM ( Sr =20 mol%) are oxygen-hyperstoichiometric. Beyond this
doping concentration, loss of oxygen takes place from the lattice [56,63]. The electrical
conductivity of doped lanthanum manganite system increases with increase in dopant
concentration as per the following equation.

18
+ SrO + +
Mn4+
concentration increases with Sr2+
doping level and is responsible for the increase
in conductivity value. At the lower temperature range conductivity maximum is obtained
at a substitution level of 20 to 50%. However, this maximum value is obtained at a lower
dopant concentration in the higher temperature region. Sakaki et al. have studied the
Ln0.7Sr0.3MnO3 (Ln=La-Gd) system where maximum conductivity is obtained for
Nd0.7Sr0.3MnO3 at higher temperature region and Pr0.7Sr0.3MnO3 at lower temperature
region [65]. Praseodymium based cathode materials (Pr0.6Sr0.4MnO3 and Pr0.7Ca0.3MnO3)
have superior properties owing to the Pr3+
/Pr4+
redox couple and lower interaction with
zirconia based electrolyte material [65,66]. Ln1-xAxMnO3 based cathode materials react
with zirconia based electrolyte material resulting in the formation of AZrO3 based
perovskite and Ln2Zr2O7 type pyrochlore resistive phase [43,55,56,57,59,64-71]. These
resistive phases are responsible for the higher interfacial polarization at the cathode
electrolyte interface. As the radius of Ln ion decrease, the possibility of formation of
zirconia pyrochlore phase decreases [64,65,68,72]. This is attributed to the lower
thermodynamic stability of the pyrochlore phase with smaller rA/rB ratio.
In the lanthanum manganite based cathode materials partial substitution of manganese
with other transition metal ions with stable oxidation state helps in improved thermal
expansion, interfacial stability and improves the electrode performance [48,56,57,73-76].

19
Ferrites
The advantage of ferrite system is that they have TEC close to YSZ and GDC electrolyte
systems. However, LnFeO3 system has very low conductivity in the fuel cell operating
temperature region. Substitution of acceptor type cations increases the oxygen vacancy
concentration and p-type electronic charge carriers in (Ln1-xAx)FeO3 system. When Sr is
substituted at the A sites the charge of is balanced by either formation of oxygen
vacancy or Fe4+
. Hence the maximum conductivity is expected when the substitution
level is 50% i.e. the ratio of Fe3+
to Fe4+
is 1:1. [77]. Increasing the dopant concentration
above 50% has negative impact on the conductivity due to vacancy ordering and hole
localization process. At low oxygen partial pressure oxygen vacancy formation is more
favorable because of the formation of , but at high oxygen partial pressure holes are
the predominate charge carriers. At high temperature nonstiochiometry in the ferrite
system leads to formation of oxygen vacancy as per the following equation.
+ 1/2O2 + 2 +
Since the mobility of the electrons or holes is very high compared to the oxygen
vacancy/oxygen ions, the conductivity in ferrite system is dominated by holes [77].
Compared to manganite cathodes, perovskite based ferrite cathode materials lose oxygen
at elevated temperature unfavorably affecting the TEC and hence are thermochemically
incompatible with few solid electrolytes [78-82]. This oxygen loss can be avoided by
substitution of iron by cations with stable oxidation state. But substitution of other ions
for Fe leads to decrease in the transport number of ions. Ferrite systems are more stable

20
compared to the cobaltite system as they have stable 3d5 electronic configuration.
La0.8Sr0.2FeO3 cathode with little lanthanum deficiency showed an ASR value of
0.1ohm.cm2 at 800
oC and has matching TEC with YSZ and GDC electrolyte material
[83]. A power density of 900 mW.cm-2
was obtained at 700 oC for a cell using this
cathode and YSZ as electrolyte [84]. Cu doped LSF shows better kinetics for the oxygen
reduction reaction compared to LSF cathode [85]. During sintering of the cathode there
was no Zr4+
diffusion into the perovskite cathode.
Cobaltite cathodes
Cobaltite based cathode materials have superior cathodic and transport properties
compared to the ferrites. However, cobaltites have higher chemical reactivity and higher
thermal expansion coefficient [55,56,57,86-101]. Ln1-xAxCoO3 perovskite shows greater
hole delocalization and mobility compared to the manganite or ferrite based cathode
materials. La1-xSrxCoO3 series is the most studied system in cobaltite cathodes.
Substitution of Sr at lanthanum site forms electron holes. The charge neutrality is
maintained by formation of and oxygen vacancy as per the following equation,
+ + = +
+ + + 1/2O2(g)
And
[ ] [2 = K [ ]
2 [ ]

21
Where and represents Co3+
and Co4+
at cobalt site respectively and K is the
equilibrium constant.
The charge compensation mechanism for the cation deficiency at the Ln side depends on
the ratio of Ln/A, temperature and oxygen partial pressure. Cobaltite system is
thermodynamically less stable and less tolerant to cation non-stoichometry. Hence
synthesis condition influences the structural and electrical data along with microstructure
[56,101-103]. Ba2+
doping has some positive effect on the oxygen reduction reaction as
revealed by many researchers [104-107]. Lanthanum site can be substituted by Gd or Pr
for a decreased TEC and ASR values. Cobaltite based cathode materials have higher TEC
than the manganite based cathode materials due to the formation of oxygen vacancy and
spin state transitions associated with Co3+
[108] and weak Co-O bond compared to Mn-
O bond [109].
Substitution of Cu at the cobalt site enhances the catalytic property as well as ionic
conductivity of LaSrCoO3 cathode material [110]. The dual oxidation state of Pr3+
/Pr4+
may be utilized by substituting at the A site of LaSrCoO3 to improve the over potential
[111]. Zhu et. al [112] substituted Pr and Sr at A side, Cu at the B-site in lanthanum
cobaltite cathode and observed improved performance. Few researchers have also
substituted Mn at cobalt site, however they have higher TEC [113].

22
The disadvantages of a cobalt based system are its high TEC value and interaction with
YSZ electrolyte material. This inter diffusion mechanism is more pronounced due to
lower thermodynamic stability of cobaltite phase [56,114].
Ferro-Cobaltite cathodes
La1-xSrxFe1-yCoyO3 (LSCF) is a state of art cathode material for IT-SOFC because of its
good electrical conductivity, excellent oxygen surface exchange co-efficient and oxygen
self diffusion co-efficient compared to lanthanum manganite based cathode materials
[115-116]. LSCF has a thermal expansion co-efficient close to 13 x 10 -6
K-1
and do not
react with ceria based electrolyte material [117,118]. Electrical conductivity of LSCF
based cathode material depends on the Fe content at the Co side and ionic conductivity is
controlled by the Sr concentration at the lanthanum site. Cation deficiency at the A site
has less effect to the TEC value of the cathode material. LSCF based cathode materials
are incompatible to YSZ based electrolyte materials and for this type of cells, an
interlayer of GDC is applied between the cathode and electrolyte layer. It has been
observed that substitution of multivalent Pr (in PSCF) improves the cathode performance
of IT-SOFC [119]. PSCF with composition Pr0.6Sr0.4Co0.8Fe0.2O3 shows a conductivity
value of 1040 S cm-1
at 300 oC. The ASR value of a composite of PSCF-GDC (50:50) is
0.046 ohm.cm2 at 800
oC. From these results it can be inferred that PSCF is a promising
cathode material for IT-SOFC.

23
For the first time rare earth element free cathode material Ba0.5Sr0.5Co0.8Fe0.2O3 (BSCF) is
developed by Haile and Sao [120]. This material showed an ASR value as low as 0.05
ohm.cm2 at 600
oC. However this cathode material has very high TEC value for practical
use. Another disadvantage of BSCF is that it is susceptible to CO2 between 450-750 oC
[121].
Nickelate cathodes
LaNi0.6Fe0.4O3 (LNF) is a candidate cathode material having an electronic conductivity of
580 S.cm-1
at 800 oC and TEC of 11.4 x 10
-6 K
-1 [122]. This has better TEC value
compared to LSM cathode. The biggest disadvantage of this type of cathode is the
reaction of LNF with zirconia based electrolyte material and rapid formation of resistive
La2Zr2O7 pyrochlore phase [123]. However the reaction problem can be avoided by
applying a GDC interlayer between the cathode and electrolyte layer.
K2NiF4 type La2NiO4 is another class of compound having stability at both oxidizing and
moderately reducing atmospheres [48,56]. P-type electronic conductivity mechanism
dominates over all range of oxygen partial pressure for this type of cathode material with
less contribution from hole conduction. These compounds have lower conductivity
compared to cobaltite cathode materials. A2+
substitution leads to decrease in the oxygen
content and increase in the conductivity value detrimental for the performance of cathode
material.

24
1.5 SOFC technology: Critical issues
The performance of a fuel cell is governed by different parameters, such as, cell
component materials, fabrication methodology and operating temperature. Processing
method has a great role in determining the microstructure of the electrodes, electrolytes
and electrode-electrolyte interfaces. Again use of fine powder helps in decreasing the
processing temperature during cell fabrication. Starting with fine powders the
microstructure can be tailored.
Operating temperature is also important while developing a fuel cell. High temperature
operation leads to higher kinetics and higher performance. However, chemical
compatibility of cell components, inter-diffusion of chemical species, chemical stability
of construction materials and usefulness of sealing are the issues associated with the high
temperature operation. Hence, over the last decades thrust has been given to develop
SOFC than can be operated in the intermediate temperature range without sacrificing the
performance. This challenge has been mitigated by various research groups worldwide
through the development of new materials and improvement in fabrication
methodologies. In many cases extraordinary performance has been reported in IT-SOFC.
Microstructure has immense effect on the polarization resistance of electrode-electrolyte
interface. A numerous literature is available on oxygen reduction reaction at the cathode
[124-128] and electrochemical oxidation of hydrogen/fuel at the anode [129-131]. The

25
reaction sites i.e. the length of the triple phase boundary can be correlated to the
polarization resistance. The reaction sites should be increased in order to increase the
electrode performance. This can be achieved by adopting suitable ceramic processing
techniques.
Cathode materials having mixed ionic-electronic conduction (MIEC) can extend the
reaction region and thereby increases the triple phase boundary area. Distribution of
MIEC cathode material and pores in finer scale will have more number of reaction sites.
Nano-materials can be used as a starting material for tailoring the final microstructure.
Excellent electrochemical properties have been reported for nano-structured cathode
materials with higher surface area [132]. Nano-structured and functionally graded
cathode with graded porosity in the microstructure has been fabricated by CVD method
and the cathode is reported to have a reduced interfacial polarization resistance [126]. A
maximum power density of 375 mW.cm-2
was obtained for the Ni-SDC (samarium doped
ceria) anode supported cell with GDC electrolyte and SSC(samarium strontium
cobaltite)-SDC cathode fabricated by the above approach.
Nano-structured electrodes with improved performance have been fabricated by wet
impregnation technique. In the wet impregnation method the fine nano particles forms a
well connected network in the porous electrode and are responsible for this property
enhancement [133]. It has been observed that LSCo infiltration to LSM-YSZ composite
cathode improved the electrochemical property significantly [134]. The nano-particles

26
coat the pore wall and oxygen reduction reaction (ORR) within the cathode is enhanced
as reflected in the low ASR values obtained in the impedance analysis. However, long
term operation of SOFC at high temperature leads to agglomeration of nano-particles and
decrease in the catalytic property. Therefore, retaining the nano-structured cathode
remains a challenge to researchers.
Synthesis of nanomaterials and their previous history determines the properties as well as
the microstructure. Powders prepared by solution route are smaller in size with narrow
size distribution and have high surface area. However the cost of material synthesis for
large scale production should be considered before a technology development.
Apart from microstructural optimization and development of high performance cathode
material, composite cathode approach has been adopted by many researchers [135-148].
In the composite cathode one part is the electronically conducting cathode whereas other
part is the electrolyte in definite proportion. The electrolyte component helps in
extending the triple phase boundary away from the electrolyte-electrode interface, helps
in matching the TEC of cathode with the electrolyte, adheres the electrode layer to the
electrolyte, and enhances the microstructural stability of the cathode. For ferrite and
cobaltite based materials with high thermal expansion coefficient, composite electrode
approach has been adopted to get matching TEC.

27
1.6 Motivation of work
Long term operation of SOFC with improved performance compelled the material
scientists for the development of materials for intermediate temperature fuel cell
operation. In general catalytic activity decreases with decrease in temperature. Therefore,
to retain the performance at a reasonably high value the materials need to have high
catalytic activity. The different materials used for the intermediate operation were briefly
described above along with the issues and concerns. Though there is a range of materials
for intermediate temperature operation, a particular set of electrolyte and electrode
materials have been chosen for the above issues.
The present study is aimed at exploring the beneficial effect of using nano-sized powders
in developing IT-SOFC. Gadolinia doped ceria was selected as the electrolyte material.
Ni-GDC cermet was studied as the anode material. Based on the literature doped
gadolinium cobaltite seems to be a promising material for use as cathode in GDC
electrolyte based system and development of this novel cathode material has been
explored in the present study. Cell fabrication parameters have been optimized for a
better performance.

28
Chapter 2
Experimental Work
The work carried out in this thesis primarily consists of (a) synthesis of fine ceramic
powders by wet chemical route for use as SOFC electrolyte and electrodes, (b)
characterisation of as-synthesized powders and precursors, (c) study of sintering
behaviour of the powders, (d) evaluation of functional properties of each SOFC
component materials, (e) integration of electrodes with electrolyte to form symmetric
cells and characterization of symmetric cells, and (f) fabrication of single cell and
performance evaluation. Microstructural evaluation has been carried out at different
stages of the work to correlate with the properties. The experimental procedures
adopted in the present work are described below.
2.1 Synthesis of fine powders for SOFC application
Two different wet chemical routes, namely, gel combustion and solution
polymerisation route have been adopted to prepare the SOFC materials in this work.
Powders of gadolinia doped ceria electrolyte material and nickel oxide anode material
have been prepared by gel combustion route. Based on preliminary studies, it has
been observed that material containing multiple transition elements can be synthesised
in phase pure nano-crystalline form at lower calcinations temperature using solution
polymerisation route in comparison with gel combustion route. Therefore, gadolinium
cobaltite based cathode materials have been prepared by solution polymerisation
route. The details of these two synthesis processes are described as follows.

29
2.1.1 Gel combustion route
In gel combustion an exothermic reaction between an oxidiser and fuel takes place.
Usually metal nitrates are used as the starting materials. These metal nitrates act as
oxidizer. Aqueous metal nitrate solution forms gel in combination with complexing
agents such as, citric acid, glycine, urea, EDTA etc. These complexing agents act as
fuel in the combustion synthesis process. In combustion synthesis the ratio of oxidizer
and fuel is fixed in such a way that the net oxidizing valency of the oxidizer becomes
equal to the net reducing valency of the fuel. In the present work, citric acid, glycine
and urea are used as fuels. Metal nitrates are first dissolved in the deionised water for
preparation of stock solution. The metal nitrate solutions in definite ratio are mixed
with constant stirring on a hot plate at 80 oC. Required amount of fuel is added to the
mixed nitrate solution and dehydrated on a hot plate with stirring. The metal nitrates
form complexes with the chelating agent (fuel). The gel formation takes place with
dehydration and further heating of gel leads to combustion. Combustion reaction is a
highly exothermic reaction with evolution of large amount of gaseous products in a
small time scale. The powder characteristics depend on the exothermicity and evolved
gaseous products. Fuel to oxidant ratio has a great role in determining the
exothermicity of the reaction. The advantage of a combustion reaction is that final
product is often formed in a single step and no calcination is required. However,
precursor of the desired product may be formed in some cases. Combustion is a less
cumbersome method for the synthesis of oxides, starting with low cost materials. As
the metal ions form complexes with the fuels, homogenous distribution of cations
takes place. Again the decomposition of the metal fuel complex is exothermic in
nature. The released heat during the decomposition of metal-fuel complex is utilised
for the phase formation.

30
2.1.2 Solution polymerisation route
Solution polymerization is a wet chemical process like combustion method. In the wet
chemical process the final product may be achieved directly or through an
intermediate step. The self sustaining combustion process is very fast and leads to the
final product from the molecular mixture instead of any intermediate crystalline phase
which on further inter-crystalline mass transfer leads to the final product. However
solution polymerization is a method where an amorphous intermediate is formed from
the liquid mixture homogenous at the molecular level. This amorphous solid
decomposes on heating and thermal reaction at high temperature gives the final
product.
Like other wet chemical processes the metal solutions are homogenously mixed
to get a complex with a polymerizing agent. In the solution polymerization method
sucrose and poly vinyl alcohol (PVA) are taken as polymerizing agent. In this
method, stoichiometric amounts of metal nitrates are taken in deionized water.
Sucrose and PVA are added to the nitrate solution with constant stirring on a Hot-
plate at 80 oC. The solution pH is adjusted to 1.0 with citric acid. Further heating of
the gel after total dehydration leads to fluffy charred mass. This amorphous solid is
calcined at desired temperature for phase formation. As the molecules are closely
spaced, lower temperature is required for phase formation with better homogeneity
compared to the conventional solid state route.
Excess sucrose is added during the synthesis to the metal nitrate solution which is
converted to saccaric acid in the acidic medium. Saccaric acid, a good chelating agent,
forms complexes with the metal ions in the solution. On a hotplate at a temperature

31
around 200 0C, PVA (10-20mol %) and saccaric acid undergoes polycondensation (
polyesterification) reaction. At the same time dehydration of the gel takes place and
lot of water molecules are removed. A viscous gel is formed which on further heating
leads to charring of the gel. This amorphous fluffy mass is calcined to form the final
product. The advantage of the process is that atomistic distribution of metal ions in
the polymer requires lower calcinations temperature for phase formation. A schematic
representation of the reaction is shown in Figure 2.1.
C12H22O11
SUCROSE
H+, H2O
CHO
OHH
HHO
OHH
OHH
CH2OH
+
CH2OH
O
HHO
OHH
OHH
CH2OH
GLUCOSE FRUCTOSE
HNO3
[O]CO2H
OH
H
OH
H
OH
H
OH
H
HO2C
SACCARIC ACID
CO2H
OH
H
OH
H
OH
H
OH
H
HO2C
SACCARIC ACID
OH
HH
HO
PVA
C
OH
H
OH
H
OH
H
OH
H
HO2C
COMPLEXED SACCARIC ACID
O
O
Mn+
C
OH
H
OH
H
OH
H
OH
H
HO2C
HH
O
O
C
OH
H
OH
H
OH
H
OH
H
C
O
O
Mn+
O
O
PART OF POLYMERIC RESIN
+ +
Fig. 2.1: Schematic presentation of solution polymerization reaction.

32
2.2 characterization of precursor and phase pure
powder
2.2.1 Thermal analysis of precursor gel and as-synthesized powders
During the combustion synthesis little amount of gel was taken out and dried
separately to remove the water. Thermo-gravimetric analysis of the dried gel
precursor was carried out on a TG-DSC instrument (SETARAM make: SETSYS
EVOLUTION) to study its thermal decomposition behaviour. Similarly the
synthesized powder from combustion and the charred mass from the solution
polymerization route were taken for thermal analysis to know the residual
carbonaceous materials. All experiments were carried out in flowing air atmosphere in
a platinum crucible at a heating rate of 10 o C/min. The mass loss with temperature
was recorded up to 1000 o C. DSC curve was recorded along with the TG curve to
ensure any phase change, to observe the nature of decomposition, to calculate the heat
capacity and heat of reaction. Always an experiment without the sample was carried
out under the same experimental condition as the sample to compensate the
instrumental contribution.
2.2.2 X-ray diffraction pattern of powders
Phase analysis of the powders obtained after synthesis and at various stages of
synthesis were characterised by X-ray diffraction (Philips, PW 1830) method. Silicon
single crystal supplied by the manufacturer was taken for calibration as internal
standard. The powder sample was spread thin over a glass slide using a suitable
binder. For sintered samples, the sintered masses were ground into fine powder by a

33
mortar and pestle and then the powder diffraction pattern was recorded. Diffraction
patterns were taken between 20-80 degree at an interval of 0.2 degree and 1minute per
interval. For better representation few diffraction patterns were taken at a slow scan
rate.
2.2.3 Calcination of precursor powders
All the powder synthesis was carried out through a wet chemical process.
Carbonaceous materials are used either as a fuel or a complexing (polymerizing)
agent, during synthesis. Hence, unreacted reactants or carbon based material may
form part of the as-synthesized product. Based on the results of thermal analysis and
X-ray diffraction data, the as synthesized powders were calcined at desired
temperature for phase formation as well as for removal of carbonaceous materials. All
calcinations were carried out in CARBOLITE furnace in static air environment.
2.2.4 Particle size analysis of powders
The Particle size and distribution of powders were measured by a laser diffraction
particle size analyser (Model: LA–500, Horiba, Japan). The method of analysis is
based on the combination of Fraunhoffer diffraction and Mie’s scattering theories.
He-Ne laser source is used for light scattering. When laser beam falls on the particles,
it is scattered through different angles and the intensity of light at different angles are
recorded. The angle of light scattering is inversely proportional to the particle size and
the intensity is proportional to the distribution of the particles. Scanning of the angular
distribution of scattered light flux provides information on particle size and size
distribution. Photomultiplier detectors are arranged at different angles for measuring
the light intensity over a wide range of angle.

34
2.2.5 Specific surface area measurement
Surface force is one among the driving forces for sintering of powder compacts.
Hence measurement of surface area gives an idea of reactivity of the combustion-
synthesized powder. The specific surface area of the phase pure powders was
measured using a surface area analyser (Sorptomatic 1990, Thermoquest, Italy). The
principle behind the measurement is the adsorption of mono layer of gas molecules
(Nitrogen) on the powder surface and the analysis was based on BET principle. When
nitrogen is passed over the sample with pressure, gas molecules are adsorbed on the
powder surface and the volume of gas absorbed at different pressure is recorded.
From the diameter of the adsorbed molecules, the amount of gas molecules required
for monolayer absorption is calculated. Adsorption and desorption both cycles were
taken after degassing the sample at 120 o C. Specific surface area and the particle size
are calculated from the surface area data.
2.2.6 Powder morphology by SEM and TEM
Fine particles are produced in the solution synthesis route. Though particle size and
distribution is measured by laser diffraction, and surface area by BET principle, the
finer details of the powder like morphology and agglomeration nature is not clear.
Hence the powder Morphology was studied by scanning electron microscopy
(SERON technology, Korea) and Transmission electron microscopy (Philips
CM#)/super TWIN). For SEM analysis, powder sample was dispersed in acetone
using ultrasonic bath. A drop of this powder suspension was placed on a carbon tape
pasted on an aluminium stub. Acetone is evaporated from the stub surface leaving
behind the dispersed powder on the stub. For TEM sample preparation, one drop of

35
the dispersed powder in acetone was put on a copper grid in the similar fashion.
Before analysis, the dispersed powder on the carbon tape and cupper grid was coated
with gold using a D.C. sputtering unit.
2.2.7 Powder compaction and sintering behaviour by TMA
Compaction of the powder was carried out by a motor driven uniaxial hydraulic press.
Steel die with tungsten carbide lining was used for pressing. Pellets of different
diameter were prepared followed by sintering for different applications. Pre-
compaction was carried out prior to final compaction. Pre-compaction was carried
out at 80MPa pressure and final compaction at 150MPa pressure in the hydraulic
press. The die-wall was lubricated with stearic acid for smooth operation. For the
dilatometric study, green pellets of 8mm diameter were prepared by uniaxial die
pressing. For ionic conductivity measurement and symmetric cell measurement pellets
were prepared in a die of 15mm diameter. Few electrolyte button cells were prepared
in a die of 25mm diameter for cell characterization.
Green pellets in cylindrical shape, of approximately 8 mm diameter x 6 mm height
were used for studying the shrinkage behaviour. Linear shrinkage of the sample was
recorded at a heating rate of 4 oC /min in air on a dilatometer (Theta make having two
push rods and SETARAM make with single push rod). Data were taken at an interval
of 0.4 oC up to 1400
oC for ceria samples and up to 1300
oC for other samples.
Bar pellets were prepared using a rectangular die. The rectangular die was made
up of steel with an inner lining of tungsten carbide. These rectangular pellets are used
for 4-probe DC conductivity measurement.

36
2.3 Sintering
From the analysis of the sintering curve, sintering temperature was decided. The
temperature at which two third of the sintering takes place is chosen as the sintering
temperature. Most of the sintering was carried out in air using a resistance heated
muffle furnace (Model: HTF-18, Carbolite, UK). The furnace is programmable and is
controlled by auto-tuning Eurotherm PID controller. The furnace has Super Kanthal
heating element and LJ – type (Pt 20% Rh – Pt 40% Rh) thermocouple. The heating
schedules were decided based on some preliminary experiments and literature reports.
2.4 Fabrication of symmetric cells
For our experiments both electrolyte and electrode supported symmetric cells were
fabricated. For the electrolyte supported cells dense electrolyte pellets of 12mm
diameter were prepared by uniaxial pressing followed by sintering. Both surfaces
were polished near to flatness and cleaned in an ultrasonic bath. Organic slurries of
electrolyte-electrode composites (1:1) and electrodes were prepared in terpinol
medium. Slurry of the composite was first applied at the two faces and dried in air.
Again the cathode slurry was applied on both the sides followed by drying and
sintering at the desired temperature. Samples of different kind were sintered at
different temperatures based on the shrinkage behaviour. Anode supported symmetric
cells are prepared by co-pressing method. First anode material was pressed in a die
and electrolyte slurry was applied over the anode compact inside the die. After drying
of the slurry again anode material is poured over the electrolyte layer and pressed in
the uniaxial die. The co-pressed sample was then co-sintered at desired temperature.

37
2.5 Characterization of sintered materials
After characterization of the synthesized powders, sintered mass were characterized in
terms of microstructure, electrical properties and functional properties. Details of the
characterization procedure are mentioned as follows.
2.5.1 Microstructure and composition
One face of the sintered GDC pellet was polished using diamond suspension prior to
taking for microstructural study. For polishing diamond particles in the suspensions
were 9, 6, 3, 1, ¼ m for sequential use. The samples were ultrasonically cleaned
after polishing followed by thermal etching at 1200 oC to reveal the grain boundaries.
The samples were coated with gold employing a d.c. sputtering unit before taking
micrographs in a SEM.
The micrographs were analysed by image analysis software (BIOVIS) for determining
the grain size. Average grain size of the sintered samples were measured by line-
intercept method where, a line of known length (L) is drawn on the micrograph of the
sample and the number of grains intercepted (N) is counted. The ratio of L by N gives
the value of average grain size. For better result lines at different places of the
micrographs were taken and the average grain size was calculated statistically.
Micrographs of the sintered pellets of cathode and anode materials were taken on
the fracture surfaces. Fracture surface was also taken in symmetric cells as well as in a
complete cell. Micrographs of the anode materials were taken before and after
reduction. The sintered and fracture mass were mounted on an alumina stub. A carbon

38
tape was put between the alumina stub and the sintered mass. The sample was coated
with gold using a d.c. sputtering unit. For EDS analysis, the sample was mounted in a
bakelite mould and sample surface was polished using diamond paste. Oxford make
EDX was used for this purpose. Gold coating was applied on the sample surface for
better conduction.
2.5.2 Measurement of ionic conductivity
2.5.2.1 Coating with platinum paste
The sintered pellets were polished near to flatness at both the faces and cleaned in an
ultrasonic bath. Both the faces of the polished pellets were coated with Platinum
conductive paste (frit free) procured from M/s ELTECKS Corporation, Bangalore.
The coating was allowed to dry at room temperature or under an IR lamp if required.
The coating was baked at 1000o C for one hour to remove the organic binders mixed
in the platinum paste and to makes a continuous conducting layer. After baking the
surface platinum layer conductivity was checked by a multimeter.
2.5.2.2 AC impedance spectroscopy
Impedance spectroscopy was used for characterizing the conductivity behaviour of the
electrolyte material. Impedance was measured by a frequency response analyser
(SOLARTRON 1260) in the frequency range 0.01 Hz to 10 MHz with PROBOSTAT
sample holder (Norweigian Ceramic Society, Norway). The platinum coated sample
was fixed in the PROBOSTAT test set-up with two platinum electrodes at both faces
of the pellet. Measurements were carried out from 125 oC to 1000
oC in air
environment. The advantages of AC measurement is to separate the contribution of

39
grains, grain boundaries and electrodes from a single measurement. Z-plot and Z-view
software were used for data presentation and analysis, respectively.
2.5.3 Measurement of electronic conductivity
Electronic conductivity of the material was measured by DC 4-probe method using a
sintered bar sample. Two grooves were made in the middle part of the bar at 1cm
apart. Platinum paste was applied at the two ends as well as in the grooves followed
by baking of the platinum past to reduce the contact resistance. Current was passed
though the end terminals of the bar and the voltage was measured through two probes
wound over the grooves. The voltage to current response of the material was measures
by an in-house set up using a source meter (Kethley-238) in combination with a nano
voltmeter (Aligent). For the cathode materials, the electrical conductivity was
measured in air; however conductivity of anode materials were measured in the
reducing atmosphere.
2.5.4 Evaluation of TEC
Thermal expansion coefficients of the materials were calculated from the dilatometry
data. Sintered cylindrical samples of nearly 6mm dia x 3mm height were used for
dilatometric study. Thermal expansion was assumed to be isotropic and the linear
thermal expansion of the samples were recorded at a heating rate of 10 oC /min in
flowing helium atmosphere using a thermo mechanical analyzer (SETARAM , setsys
evolution) with a single push rod. Thermal expansion of a standard Safire sample
was taken in the same condition as the sample and the thermal expansion coefficient
(TEC) of the samples were corrected by the TEC of Safire.

40
2.6 Symmetric cell measurement
The symmetric cells prepared by the methods mentioned above are fixed in a
PROBOSTAT unit using a spring load. Both the sides of the pellets are attached to
two platinum electrodes with platinum mesh. The four electrodes are connected to the
four terminal of a frequency response analyzer (Solartron 1260 with the
electrochemical interface 1287). Impedance of the symmetric cells was measured at
different temperature in the corresponding electrode environment. All cathode
symmetric cells were measured in air environment and anode symmetric cells were
measured in hydrogen environment. The impedance plots were represented by
imaginary plots. Resistance was calculated from the impedance plot fitting into
semicircles and area specific resistance of the electrode material in a desired condition
was calculated from the symmetric cell data considering the area of the electrode
surface. Z-view software was used for analyzing the complex impedance data.
2.7 Fabrication of anode supported cells
Two methods are used for the fabrication of anode supported cells, namely uniaxial
die pressing and tape casting method. Anode supported cells of 22mm diameter were
fabricated for characterizing the cells. Green pellet of NiO-GDC was prepared by
uniaxial die pressing. Slurry of the electrolyte in terpinoel medium was brush painted
over the anode layer. After room temperature drying, the half cell was co-sintered at
1300 oC. Slurry of the cathode material in terpinoel midium was brush painted over
the electrolyte layer and calcined at 1100 oC. Platinum paste was applied over the two
sides of the pellet and baked at desired temperature.
For cell fabrication by tape casting, slurries of anode and electrolyte were prepared
in organic medium. The organic slurry was casted on a mylar film fixed on a glass

41
plate using a doctors’ blade tape casting machine. The doctor’s blade is forced to
move by an electric motor with definite control over speed. First electrolyte layer was
casted followed by anode layer. The two layers were then co-sintered at 1300 oC.
Slurry of the cathode was applied over the sintered electrolyte layer and sintered at
1100 oC. Platinum paste was applied over the two sides of the pellet and baked.
2.8 characterization of single cell
The cell tests were carried out using probostat cell test setup. This full cell was
mounted over an alumina tube by ceramic sealant (CERABOND 885). The sealant
was baked at different temperatures as recommended by the supplier. Platinum mesh
connected with platinum wire was used as current collector and fixed at opposite
faces of the cell. The single cells in disc shape attached to the test set up is heated in a
controlled rate with oxygen gas flowing through the cathode side and moist hydrogen
at the anode side. For passing humidified hydrogen in the anode side, hydrogen was
bubbling through water for absorbing water. The sealing between the sample and the
alumina holder was checked by a hydrogen leak detector. At different temperatures
the current to voltage response was checked using a Nano-voltmeter (Aligent) and a
source meter (kethley model-238). After the experiment, the SEM micrograph of the
facture surfaces was taken by a scanning electron microscope.

42
Chapter 3
Synthesis and characterization
of GDC electrolyte material
3.1 Introduction Ceria based oxide materials are used as electrolytes for intermediate temperature solid
oxide fuel cell (IT-SOFC) applications. Gadolinia doped ceria (GDC) is a potential
solid electrolyte for intermediate temperature solid oxide fuel cell system because of
its high ionic conductivity in low temperature range (500 – 700oC) [149]. When
gadolinia is substituted in ceria, it introduces vacancies in the oxygen sub-lattice as
charge compensating defects responsible for oxide ion conductivity through these
vacancies. The oxide ion conductivity increases with increase in temperature
following Arrhenius equation. At a given temperature, conductivity increases with
increase in substitution level, and decreases after attaining a peak in the conductivity
value. Ceria doped with 12 mol% gadolinia is reported to have maximum
conductivity in the ceria-gadolinia system [118]. The high oxygen ion conductivity
has led to its use as a solid oxide electrolyte in various electrochemical applications
[150]. However, at higher temperatures and reducing environments the valency state
of cerium ions starts changing from Ce4+
to Ce3+
[151]. This phenomenon introduces
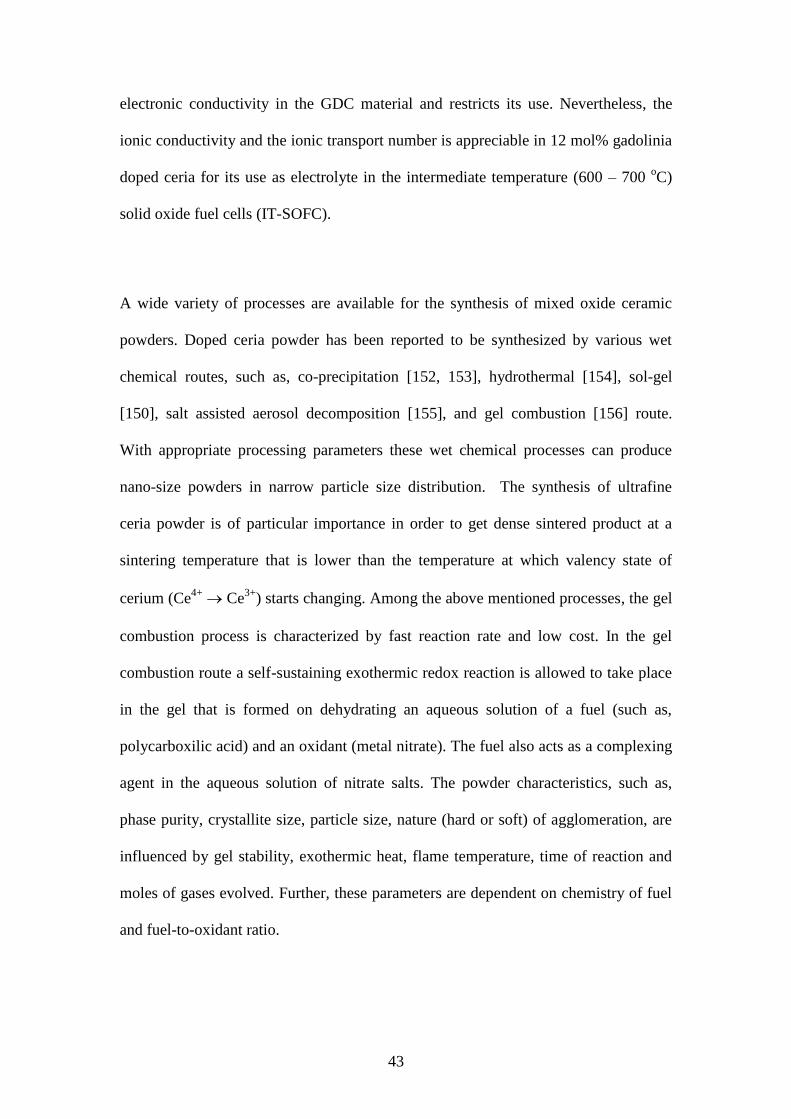
43
electronic conductivity in the GDC material and restricts its use. Nevertheless, the
ionic conductivity and the ionic transport number is appreciable in 12 mol% gadolinia
doped ceria for its use as electrolyte in the intermediate temperature (600 – 700 oC)
solid oxide fuel cells (IT-SOFC).
A wide variety of processes are available for the synthesis of mixed oxide ceramic
powders. Doped ceria powder has been reported to be synthesized by various wet
chemical routes, such as, co-precipitation [152, 153], hydrothermal [154], sol-gel
[150], salt assisted aerosol decomposition [155], and gel combustion [156] route.
With appropriate processing parameters these wet chemical processes can produce
nano-size powders in narrow particle size distribution. The synthesis of ultrafine
ceria powder is of particular importance in order to get dense sintered product at a
sintering temperature that is lower than the temperature at which valency state of
cerium (Ce4+
Ce3+
) starts changing. Among the above mentioned processes, the gel
combustion process is characterized by fast reaction rate and low cost. In the gel
combustion route a self-sustaining exothermic redox reaction is allowed to take place
in the gel that is formed on dehydrating an aqueous solution of a fuel (such as,
polycarboxilic acid) and an oxidant (metal nitrate). The fuel also acts as a complexing
agent in the aqueous solution of nitrate salts. The powder characteristics, such as,
phase purity, crystallite size, particle size, nature (hard or soft) of agglomeration, are
influenced by gel stability, exothermic heat, flame temperature, time of reaction and
moles of gases evolved. Further, these parameters are dependent on chemistry of fuel
and fuel-to-oxidant ratio.

44
In the present investigation fine and nano-crystalline 12 mol% gadolinia doped ceria
powders have been prepared by gel combustion route using three different fuels,
namely, citric acid, glycine and urea. The fuel-to-oxidant ratio has been taken as per
stoichiometric reaction [157]. The characteristics of the processes have been studied
by thermal analysis of gel precursor. The processes have been analyzed through
thermodynamic calculation. Physical properties of powders prepared using different
fuels were characterized and correlated with the process thermodynamics. Based on
the characteristics of GDC powders synthesized using different fuels, metal nitrate -
citric acid gel combustion route was chosen for the preparation of doped ceria
powders of various compositions (3, 4, 6, 8, 10, 12, 15 and 18 mol% GDC) for further
studies (sintering and electrical behavior).
On firing a green pellet shrinkage takes place leading to densification. The
shrinkage behavior depends on the powder characteristics. The powder characteristics
have been reported to be influenced by the dopant concentration [158]. Further,
addition of dopant in ceria increases the defect concentration and may play an
important role in the densification process. Comparative study of shrinkage behavior
of ceria with different level of substitution is limited in the literature. In the present
study, the shrinkage behavior of combustion synthesized pure ceria and doped ceria
powders of two different compositions have been studied using a dilatometer.
3.2 Experimental
Cerium (III) nitrate hexahydrate (purity: 99.9%, Indian Rare Earths Limited, India)
and gadolinium (III) nitrate hexahydrate (purity: 99.9%, Indian Rare Earths Limited,
India) were dissolved in deionised water for preparation of stock solution. Required

45
volume of the stock solutions were taken and mixed. Different fuels (citric acid,
glycine and urea) were added separately to the mixed nitrate solution. The molar
ratios of fuel to metal nitrates were 5:6, 5:3 and 5:2 for citric acid, glycine and urea
fuels, respectively. In each case the solution was dehydrated slowly on a hot plate
forming viscous gel. On further heating, auto-ignition of the gel took place with
evolution of large amount of gaseous molecules. The flow sheet for the synthesis of
gadolinia doped ceria powder is shown in Fig. 3.1. Combined thermogravimetry and
differential scanning calorimetry (TG-DSC) (Setaram, Model: 92-16.18) of the gel
precursors were carried out in the temperature range from 25 to 900 oC in flowing
oxygen environment with a heating rate of 10 oC/min. Based on the
thermogravimetric results, the powder synthesized by urea route was calcined at 700
oC. This calcined powder was used for particle size analysis and sintering study. In
case of citric acid and glycine route as-synthesized powders were used for particle
size analysis and sintering study.
The powders were pre-compacted by cold pressing at 75 MPa pressure using a
uniaxial hydraulic press. The final compaction was done with at a pressure of 150
MPa. The green pellets from all the three routes were sintered at 1250 oC. Densities
of the sintered pellets were determined using Archimedes principle. The
microstructures of the sintered pellets were studied using a scanning electron
microscope (SEM) (SERON technology, Korea).

46
Fig. 3.1 Flow sheet for synthesis of GDC powder by combustion route

47
Based on the powder properties, citric acid fuel was found to give optimum results in
terms of production of fine powder in narrow size distribution. Hence for further
studies GDC powders with different gadoloinia substitution level (3, 4, 6, 8, 10, 12,
15 and 18 mol% GDC) were synthesized by citrate nitrate gel combustion route. The
powders were characterized in terms of particle size, surface area and crystallite size
by X-ray diffraction. The shrinkage behavior of GDC with different level of gadolinia
substitution was studied using a dilatometer (Model: SETARAM evolution 1700)
under constant rate of heating (4oC/min.).
3.3 Results and discussion
Gel combustion is an exothermic reaction between an oxidizer and a fuel. Metal
nitrates are used as oxidizer and citric acid, glycine, urea, EDTA, etc are the probable
fuels. These fuels form complexes with metal nitrates in the aqueous media and their
decomposition reactions are exothermic in nature. This exothermic heat is used for
phase formation during synthesis. In many cases desired phase is obtained during
combustion. However in some cases, the precursor of the desired phase is formed
which needs further calcination for phase formation. The residual carbonaceous
materials are also removed during calcination. Either a single fuel or a mixture of two
fuels in definite ratio can be used for combustion. In the present study citric acid,
glycine and urea are used as fuels to study the effect of fuel on powder characteristics.

48
3.3.1 Combustion reactions: theoretical analysis
As per the propellant chemistry, the ratio of fuel to oxidant in a combustion reaction is
fixed in such a way that the net reducing valency of the fuel equals to the net
oxidizing valency of the oxidant. The oxidizing valencies of the oxidants and the
reducing valences of different fuels are given in Table 3.1. The molar ratio of fuel to
metal nitrate has been determined based on the above concept. It may be mentioned
here that the reducing valencies of nitrogen and carbon have been taken as 0 and 4,
respectively, considering N2 and CO2 as the gaseous combustion products. Presence
of these gaseous states in the evolved combustion product has been reported in the
literature [157]. For evaluating the relative exothermicity of combustion reactions
involving different fuels, a simplified theoretical approach has been taken. This
approach is similar to that reported by Purohit et al. [155]. The following combustion
reactions that are balanced to give pure ceria have been considered.
Table 3.1 Oxidizing and reducing valencies of oxidants and fuels used in the study
Compound
Derivation
Valency
oxidizing (-)
reducing (+)
Oxidizers
M(NO3)3 M = Ce, Gd
3+3.0+3.(-2)
-15
Fuels
Citric acid (C6H8O7)
Glycine (C2H5NO2)
Urea (CH4N2O)
6.(4)+8.(1)+7.(-2)
2.(4)+5.(1)+0+2.(-2)
4+4.(1)+2.(0)+(-2)
18
9
6

49
Fuel: Citric acid
)(2)(2)(2)(2)(2)(2786)(2336
615
2
3
4
1
6
56)( gggCgCC OHCONCeOOOHOHCOHNOCe
…..(3.1a)
Fuel: Glycine
)(2)(2)(2)(2)(2)(22)(2336
61
3
10
3
7
4
1
9
156)( gggCgCc OHCONCeOOCOOHCHNHOHNOCe
…..(3.1b)
Fuel: Urea
)(2)(2)(2)(2)(2)(22)(233 112
54
4
1
2
56)( gggCgCC OHCONCeOOCONHNHOHNOCe
…..(3.1c)
Heat of combustion reaction has been determined using the relation:
tsreacfproductsfcombustion HHH
tan …..(3.2)
The combustion reactions have been found to occur on dehydration of gel at a
temperature above the ambient. However, for simplification in the calculation of
exothermic heat, the reaction temperature has been assumed to be 298 K. The heat
evolved in the combustion will raise the temperature of the products. In a complete
combustion reaction total reactants are converted into product in a very small time
scale. With this condition the system has been assumed to be adiabatic and the
adiabatic flame temperature can be calculated by solving the equation:

50
dTnCH products
T
Pcombustion
ad
)(298 …..(3.3)
where, n is the number of moles of a reaction product and Tad is the adiabatic flame
temperature. The calculated thermodynamic quantities of combustion reactions of
cerium nitrate with different fuels are given in Table 3.2. The values indicate that the
heat of combustion is significant for all the three fuels and the heat can raise the
temperature of the products (referred as adiabatic flame temperature) above 1100 oC.
It may be mentioned here that in the time scale longer than the combustion reaction
time the experimental condition is far from adiabatic and hence, the temperature rise
will be for a very short period. The differences in the total amount of evolved gases
in the combustion reactions using the three different fuels are not significant. Thus the
variation in the product characteristics will be predominantly dependent on the
reaction kinetics.
Table 3.2 Calculated thermodynamic quantities of combustion reaction using different
fuels
Fuel ΔH298
combustion
(kcal/mol)
Adiabatic flame
temperature T(oC)
Total no. of moles
of evolved gases
(per mole of CeO2)
Citric acid -222.741 1170 16.66
Glycine -221.789 1248 15.83
Urea -202.668 1103 17.50

51
3.3.2 Thermal studies on precursor gels formed using different fuels
In citric acid and glycine route the combustion reaction was found to propagate
through the reaction container and the powder was voluminous with uniform light
yellow in color. When glycine was used as fuel, the reaction was more vigorous and
the product yield was low. However, citric acid as a fuel, showed a controlled
combustion reaction with better product yield. In case of urea route the reaction was
found to be localized and the powder obtained was less voluminous. The colour of the
powder was yellow with distributed intensity.
TG-DSC results of the gel precursors formed using different fuels are shown in
Figures 3.2(a-c). Exothermic peak associated with sharp weight loss was observed in
each case. This feature indicates the occurrence of a combustion reaction. The
combustion reactions start at around 178, 192 and 235 oC in case of citric acid,
glycine and urea fuels, respectively. It is observed that the reaction initiates at a higher
temperature when the heat of combustion is less (ref. Table 3.2). No weight loss was
observed after the combustion reaction when citric acid and glycine were used as fuel.
This indicates complete combustion reaction giving a product free of residual
reactants and carbonaceous matter. In case of urea fuel weight loss continues up to
700 oC. This indicates incomplete combustion of oxidant and fuel. Based on the TGA
result the powder prepared by urea route has been calcined at 700 oC. The results
indicate that the exothermic heat is adequate for combustion to take place when
glycine and citric acid are used as fuel. The calculated values of exothermic heat of
combustion and adiabatic flame temperature for urea fuel are lower than that of
glycine and citric acid fuel. However, the values are significant to support a

52
100 200 300 400 500 600 700
-14
-12
-10
-8
-6
-4
-2
0
2
Mass lo
ss (
mg
)
Temperature (°C)
0
4
8
12
16
TG
DSC
DS
C (
V.s
ec)
0 100 200 300 400 500 600 700 800 900
-4
-3
-2
-1
0
1
TG
DSC
Temperature ( oC)
Mas
s l
os
s (
mg
)
-1
0
1
2
3
4
5
DS
C (
V.s
ec)
0 100 200 300 400 500 600 700 800 900
-4
-3
-2
-1
0
1
TG
DSC
Temperature(0C)
Mas
s l
os
s (
mg
)
-3
-2
-1
0
1
DS
C (
V.s
ec)
Fig.3.2 TG-DSC of gel precursors formed using different fuels; (a) citric acid (b)
glycine and (c) urea

53
combustion reaction. Inspite of this, the combustion reaction remains localized and
incomplete in case of urea fuel. This may be attributed to inhomogeneous precursor
formed out of an unstable gel. In such case the combustion heat can be dissipated to
the surrounding colder region where fuel to oxidant ratio is not favorable for
combustion and consequently the flame temperature would significantly decrease. In
urea route the pH condition changes significantly on dehydration of the gel and might
have lead to partial precipitation of weakly coordinated precursors. The continuous
mass loss at later stage in the TG curve (Fig3.2c) is attributed to decomposition of
weakly coordinated precursor. The results indicate that intimate mixing of the oxidant
and fuel in the form of a stable gel is necessary for propagation of combustion
reaction.
3.3.3 Thermal studies on precursor gels of different gadolinia content
In order to study the effect of gadolinia doping on combustion behavior of the gel
precursor, three different compositions of gadolinia doped ceria (0, 4 and 18 mol%
Gd) were synthesized using citrate-nitrate gel combustion route. The TG patterns of
the precursor gels for the three compositions in flowing oxygen environment are
shown in Fig. 3.3. It has been observed that major weight loss occurs in the
temperature range of 178-192 oC for pure ceria, 187-206
oC for 4GDC and 210-230
oC for 18GDC. The weight loss in the narrow temperature range is due to combustion
reaction of a precursor gel. As the gadolinia content increases, the combustion
initiation temperature and final temperature both increase. Major weight loss took
place in the combustion reaction. No detectable weight loss was observed after the
combustion. It confirms that for all compositions the combustion synthesized powder
is phase pure and free of carbonaceous material when stiochiometric ratio of fuel to

54
oxidant was used. The combustion reaction occurs with a large volume of evolved
gases. This leads to physical loss of some amount of mass from the TG crucible.
Therefore quantitative information could not be obtained from TG plot.
0 100 200 300 400 500 600 700-0.7
-0.6
-0.5
-0.4
-0.3
-0.2
-0.1
0.0
0.1
heating rate=10oC/min
in pt crucible
flowing oxygen atmosphere
Fra
ctio
nal
wt.
ch
an
ge
Temperature (oC)
pure ceria
4GDC
18GDC
Fig.3.3. TG patterns of the gel precursors of pure ceria, 4GDC and 18GDC in flowing
oxygen atmosphere
3.3.3 Effect of fuel on powder characteristics
X-ray diffraction (XRD) patterns of the powder samples obtained after combustion
synthesis using three different fuels are shown in Fig. 3.4. In case of urea fuel
calcined powder was used for recording XRD pattern. In all the three cases single
phase fluorite structure was obtained. The presence of broad peaks in the diffraction
pattern indicates the nano-crystalline nature of the powders. The broadening of the

55
peak is generally expressed in terms of FWHM (full width at half maximum). The
crystallite size has been calculated from FWHM data using Scherrer formula;
cos.
9.0D ….. (3.4)
where, D is the crystallite size in nm, is the radiation wavelength (0.154056 nm in
present case, Cu Kα ), 2 is the diffraction angle, and is the corrected line width at
half peak intensity. can be calculated using the formula:
2 =
2m -
2s …..(3.5)
where m is the measured FWHM and s is the FWHM of a standard silicon sample.
The reflection from (111) plane was used for determination of average crystallite size.
The crystallite sizes as determined using Scherrer formula are 7, 16 and 14 nm for
citric acid, glycine and urea fuel, respectively. The largest crystallite size is obtained
in case of glycine route. This can be attributed to the highest adiabatic flame
20 30 40 50 60 70 80
(440)(222)
(311)(220)
(200)
(111)
GDC - Urea (c)
GDC - Glycine (b)
GDC - Citric acid (a)
inte
nsity in a
rbitary
un
it
2 in degree
Fig. 3.4 XRD patterns of the powder samples obtained after combustion synthesis
using different fuels (a) citric acid (b) glycine and (c) urea
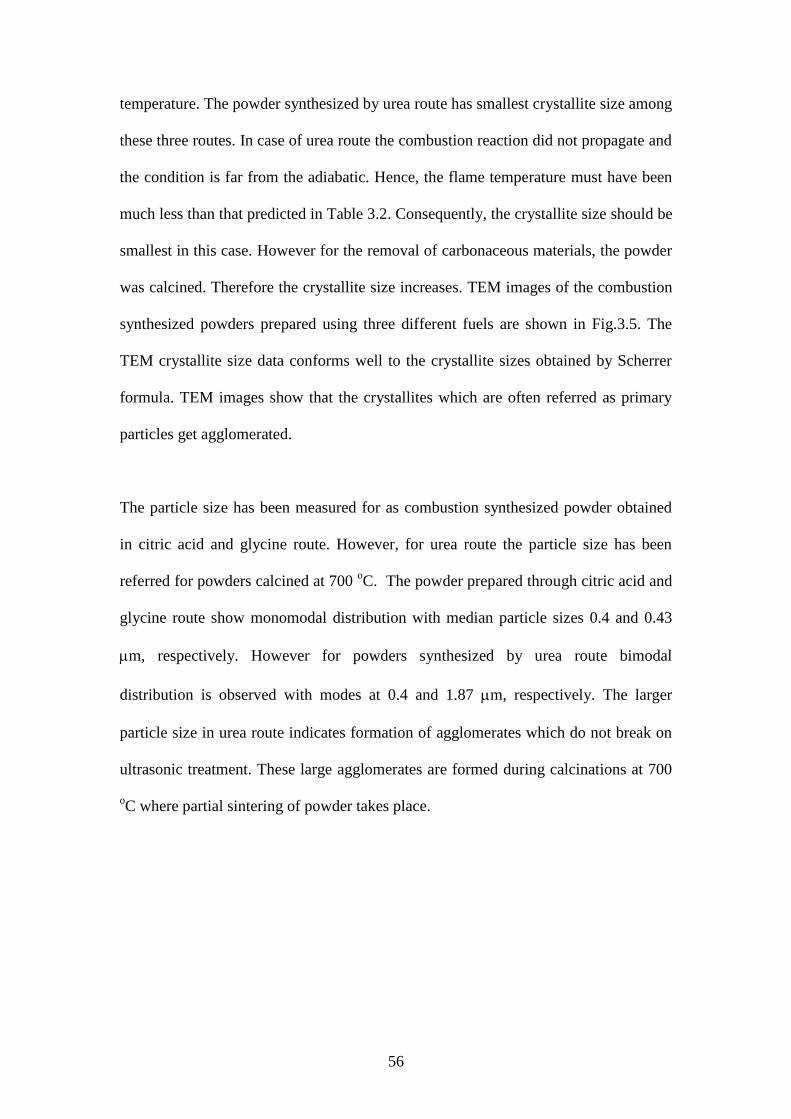
56
temperature. The powder synthesized by urea route has smallest crystallite size among
these three routes. In case of urea route the combustion reaction did not propagate and
the condition is far from the adiabatic. Hence, the flame temperature must have been
much less than that predicted in Table 3.2. Consequently, the crystallite size should be
smallest in this case. However for the removal of carbonaceous materials, the powder
was calcined. Therefore the crystallite size increases. TEM images of the combustion
synthesized powders prepared using three different fuels are shown in Fig.3.5. The
TEM crystallite size data conforms well to the crystallite sizes obtained by Scherrer
formula. TEM images show that the crystallites which are often referred as primary
particles get agglomerated.
The particle size has been measured for as combustion synthesized powder obtained
in citric acid and glycine route. However, for urea route the particle size has been
referred for powders calcined at 700 oC. The powder prepared through citric acid and
glycine route show monomodal distribution with median particle sizes 0.4 and 0.43
m, respectively. However for powders synthesized by urea route bimodal
distribution is observed with modes at 0.4 and 1.87 m, respectively. The larger
particle size in urea route indicates formation of agglomerates which do not break on
ultrasonic treatment. These large agglomerates are formed during calcinations at 700
oC where partial sintering of powder takes place.

57
Fig. 3.5 TEM images of the combustion synthesized powders; (a) citric acid route, (b)
glycine route and (c) urea route

58
The densities obtained after sintering at 1250 oC, 3 h are 98%, 96%, and 86% of the
theoretical density for powders prepared through citric acid, glycine and urea route,
respectively. The lowest density in urea route is because of presence of hard
agglomerates which are difficult to break during compaction. SEM pictures of the
sintered pellets are shown in figures 3.6(a-c). The microstructures show submicron
grain size. The grain sizes are relatively small in the sintered pellet obtained through
urea route. This may be attributed to the lower reactivity of the calcined powder used
for sintering
3.3.3 Effect of gadolinia content on powder characteristics
To study the effect of gadolinia concentration on crystallite size, three compositions
were selected. Variation of crystallite size with composition for pure ceria, 4 and 18
mol% gadolinia doped ceria is shown in Table 3.3. The crystallite size decreases with
increase in gadolinia substitution. The average measured particle sizes and surface
areas of different GDC compositions are given in the Table 3.3. The equivalent
spherical diameter of the particles has been calculated using the relation:
D = S
6000 ………(3.6)
where, D is the equivalent spherical diameter of the particles (in nm), is the
density of the material (in g/cm3) and S is the measured surface area (in m
2/g). In
these calculations the densities for different compositions have been obtained from
lattice parameters reported in literature in the form of Vegard’s law [156]. The density
values taken are 7.24, 7.23 and 7.20 g/cm3 for pure ceria, 4GDC and 18GDC,
respectively.

59
Fig. 3.6 SEM of sintered pellets; (a) citric acid route, (b) glycine route (c) urea route
2µm
(c)

60
The values of equivalent particle size are too low in comparison to measured particle
size. However, the values are closer to the crystallite sizes. These observations
indicate that particles are in agglomerate form of primary particles which are single
crystallites. In agglomerates, the primary particles are bonded together by forming
necks at the active contact points. The degree of agglomeration increases with
increase in gadolinia content as indicated in the variation in particle size. This may be
attributed to the more reactive surfaces of the primary particles as the gadolinia
concentration increases. With increase in gadolinia concentration the oxygen vacancy
concentration increases both in the lattice and on the surface of the primary particles.
This makes the surfaces more reactive for higher gadolinia content GDC material.
Further, with decrease in crystallite size the total surface area (defective region)
increases thus enhancing surface diffusion leading to neck formation during
combustion. Neck formation effectively reduces the surface area of agglomerate
particles. This is manifested in the lower value of measured surface area compared to
crystallite size equivalent surface area as given in Table 3.3.
Table 3.3: Crystallite size, particle size and surface area of combustion synthesized
ceria and doped ceria powders
Pure ceria 4GDC 18GDC
Crystallite size (nm) 18 11 8
Particle size (nm) 510 620 1210
Surface area (m2/g) 41 44 50
Surface area equivalent
particle size (nm)
20 19 17
Crystallite size equivalent
surface area (m2/g)
46
76
104

61
3.3.5 Sintering behavior of Gd doped CeO2 : Effect of Gd content
Three different compositions of GDC were taken for studying the effect of gadolinia
content on sintering behaviors. The linear shrinkage as obtained from dilatometric
experiment is shown in Fig. 3.7 for all the three compositions. The shrinkage behavior
is found to be dependent on the dopant concentration. An initial shrinkage at lower
temperatures (e.g. below 500 oC for 18GDC) is observed in the samples. This
becomes prominent at higher gadolinia content samples. During compaction the
rearrangement of agglomerates takes place, and contact points develop among the
agglomerates. On heating neck formation takes place at the contact points by surface
diffusion followed by densification through grain boundary and volume diffusion. As
the surface area of 18GDC is more, the initial shrinkage becomes more prominent in
this composition.
Significant shrinkage sets in at around 625, 525 and 455 oC for pure ceria, 4GDC and
18GDC, respectively. This shrinkage is due to the growth of neck regions which are
already developed among the primary particles. The decrease in shrinkage initiation
temperature is again due to the more reactive particles of higher dopant concentration.
Although the shrinkage sets in at a lower temperature the densification process is
completed at higher temperature when the dopant concentration is high. It is found
that for pure ceria near theoretical density is obtained on firing up to 1100 oC. The
densification process for 4GDC composition completes at around 1225 oC. This
temperature is more than 1400 oC for 18GDC composition. Shrinkage is found to
occur in wider temperature range as gadolinia content increases. As mentioned earlier,
the degree of agglomeration increases with increase in gadolinia content. It is likely

62
that the agglomerates will be harder at higher gadolinia content. Although the hard
agglomerates rearrange themselves during cold pressing these may not break
completely. This will leave larger inter-particle pores in the green compact. It may be
mentioned here that within the agglomerate the pores will be much smaller. Thus the
green compact will contain pores with wider distribution in the size of pores. The
larger pores take higher temperature and longer time to shrink. Soft agglomerates, as
can be expected in pure ceria powder, are likely to break during green compaction and
the larger interparticle pores will be eliminated. Hence, densification has been found
to occur over a narrow temperature range.
0 200 400 600 800 1000 1200 1400
-0.20
-0.15
-0.10
-0.05
0.00
Fra
ctio
nal
Lin
ear
Sh
rin
kag
e
Temperature (K)
Pure Ceria
GDC4
GDC18
Fig. 3.6 Linear shrinkage as recorded from dilatometer experiments under constant
rate (4 oC/min) of heating

63
3.4 Summary
GDC has been synthesized by gel combustion route using three different fuels
namely, citric acid, glycine and urea. Citric acid and glycine form stable gels with
mixed nitrate solutions of cerium and gadolinium and the combustion of the gel
produces phase pure nanocrystalline powder without any residual reactant or
carbonaceous matter. Urea is a weak complexing agent in mixed nitrate solutions of
cerium and gadolinium and in turn it produces inhomogeneous precursor resulting in
localized and incomplete combustion on heating. The combustion synthesized powder
produced using urea fuel needs to be calcined at 700 oC. As the gadolinia content
increases the combustion temperature increases because of the variation of heat of
combustion. Phase pure and nano crystalline GDC powders with different level of
gadolinia doping are successfully prepared through citrate nitrate gel combustion
route using stoichiometric amount of fuel-to-oxidant. The powders produced using
citric acid fuel could be sintered to near theoretical density at 1250 oC. Shrinkage sets
in at a lower temperature as gadolinia dopant concentration increases. Because of
higher reactivity of primary particle surface, the agglomerated particle size increases
with increase in gadolinia content in gadolinia-ceria system. Due to the formation of
hard agglomerates shrinkage occurs over wider temperature range and final sintering
temperature is found to increase with increase in gadolinia content.

64
Chapter 4
Ionic conductivity of GDC
electrolyte
4.1 Introduction
Solid oxides with fluorite structure, such as, ZrO2 and CeO2, when doped with aliovalent
cations become oxygen ion conductor and are used as solid-oxide electrolyte in various
electrochemical applications [118,159]. Rare earth oxides, such as, Gd2O3 and Sm2O3, are
the most commonly used dopants in ceria. Their doping in ceria introduces vacancies in
the oxygen sub-lattice as charge compensating defects. The defect reaction can be
presented in Kröger-Vink notation:
OOCe
CeOVOGdOGd 32 '2
322 …………..….. (4.1)
Oxygen ions hop through the vacancies and under a potential gradient a net flux of ions
takes place resulting in ionic conductivity. The high oxygen ion conductivity has led to
its use as an electrolyte material in solid oxide fuel cells. At higher temperatures and

65
reducing environment the valence state of cerium ions starts changing from Ce4+
to Ce3+
.
This phenomenon introduces electronic conductivity in the material and restricts its use at
higher temperature. Nevertheless, appreciable ionic conductivity and ionic transport
number in doped ceria at temperatures lower than 800 oC make it a candidate electrolyte
material for intermediate temperature solid oxide fuel cells (IT-SOFC) [160,43].
The diffusion of oxygen ions through the fluorite structure is a thermally activated
process and is associated with an activation barrier. The oxygen ion conductivity
increases with increase in temperature following Arrhenius equation. The temperature
dependent ionic conductivity is expressed as:
kT
Eexp0 ………………….. (4.2)
where, k is the Boltzmann’s constant, E is the activation energy for ionic conduction and
o is the pre-exponential factor.
The pre-exponential term in Eq. (4.2) increases linearly with oxygen vacancy
concentration. The concentration of oxygen vacancies increases with increase in dopant
concentration. It may be apparent that the conductivity will increase with dopant
concentration. However, for various fluorite based electrolyte systems it is known that
conductivity increases with dopant concentration, exhibits a maximum and subsequently
decreases with increasing dopant concentration. This is explained as due to the opposite
effects associated with increase in the number of vacancies and decrease of vacancy
mobility as the dopant concentration increases. At higher dopant concentration oxygen
vacancies get associated with cations forming (Gd’ce-
OV - Gd’ce) and (Gd’ce-
OV )0

66
clusters. This association energy is a function of (a) coulombic interaction between the
oxygen vacancy and the dopant cations and (b) the elastic strain field around the defect
complex. The vacancies need to overcome these barriers to be mobile leading to oxygen
ion conduction. Therefore, it is apparent that activation energy for ion migration increases
with dopant concentration.
The ionic conductivity is also influenced by microstructure and impurities as reported by
many authors for zirconia and ceria based electrolyte systems [161-166]. In zirconia
based electrolyte systems it has been indicated that the grain boundary resistivity is two
to three orders of magnitude higher than the bulk conductivity [161,162]. The grain-
boundary resistivity originating from the space-charge layers has been discussed in detail
by X. Guo [163]. With the logic of very high grain boundary resistivity as compared to
the bulk resistivity, it is expected that large grained microstructure is preferable in order
to achieve higher conductivity. In YSZ system Verkerk et al. [162] found that the grain
boundary conductivity increases linearly with the grain size in small grained (0.3 to 2.4
m) structure and is constant in large grained structure. On the contrary nanostructured
YSZ fabricated by spark plasma sintering have significantly higher grain boundary
conductivity in comparison with conventionally processed microcrystalline samples
[164,165]. Presence of silica has been reported to affect the grain boundary conductivity
significantly [165-168]. In samples having larger grains the total grain boundary area
becomes less and there is a possibility that a significant part of grain boundary is covered
by non-conducting impurity phase, such as, silica. Mondal et al. [168] has indicated that
the specific grain boundary conductivity of the nanocrystalline samples is 1 to 2 orders of
the magnitude higher than that of the microcrystalline samples. This has been attributed

67
to the low silica content and its grain size-dependent segregation in the nanocrystalline
samples.
Contradictory results have also been reported in ceria based electrolyte systems. Zhou et
al.[169] indicated that Ce0.9Gd0.1O1.95 with finest grain size possessed highest grain
boundary resistance. On the contrary, Christie and van Berkel [170] measured
significantly low overall grain boundary resistance in Ce0.8Gd0.2O1.90 samples with sub-
micron mean grain size. Enhanced ionic conductivity in nanocrystalline solid electrolyte
thin film has also been reported by many authors [171-174]. It has also been reported
that decreasing grain size induces electronic conductivity [175]. This makes the
generalization more difficult. As discussed by Belleno et al.[176], the electronic
conductivity in nanocrystalline undoped or lightly doped ceria is attributed to the
formation of space charge layer close to the grain boundary region. The width of the
space charge region is inversely proportional to the root of the concentration of ionic
defects. Thus, in heavily doped ceria the space charge region is very small and the space
charge model is not much relevant [176].
In GDC system maximum conductivity has been reported for 12 mol% Gd2O3 content
[118]. As mentioned above the conductivity is influenced by microstructure. From the
above examples, it seems that the literature is not definitive on the issue of the effect of
grain size on ionic conductivity. In order to address this issue, the present investigation is
aimed at studying the effect of grain size on the bulk and grain boundary ion conduction
behavior in gadolinia doped ceria. GDC containing 12 mol% Gd2O3 (12GDC) has been

68
chosen for this study. It has been reported that in heavily doped ceria samples when
measurements are taken in oxidizing atmosphere (air, 2Op = 0.2 atm.) the electronic
contribution in the conductivity is not significant and ionic transport number can be
considered close to unity [118]. For studying the effect of grain size on conductivity it is
important to produce samples with high density and at the same time with different grain
size. It has been discussed in the previous chapter that dense microstructure of gadolinia
doped ceria can be obtained by low temperature sintering of doped ceria powder
produced by gel combustion route. Grain size can be changed by post-firing the dense
samples at higher temperatures. In the present investigation different microstructures of
12 mol% gadolinia doped ceria samples have been generated by adopting different firing
schedule. The ionic conductivity has been determined from ac impedance data.
Impedance spectra of the bulk and grain boundary have been analysed in order to discuss
the influence of grain size on the ionic conductivity.
As discussed in Chapter 3, GDC nano-powders of different gadolinia content have been
synthesized by solution synthesis routes and the powders have been sintered at 1250 oC to
get near theoretical density. This low temperature sintering of electrolyte material has
added advantage in fabricating SOFC cell by co-firing route. As the conductivity
dependents on composition and microstructure it is prudent to measure the conductivities
of GDC samples of different compositions but prepared under a set of processing
condition (starting powders and processing parameters, particularly, sintering
parameters). The above investigation on optimization of composition has also been
included in the present work.

69
4.2 Experimental
Gadolinia doped ceria powders with different level of gadolinia doping, synthesized by
gel combustion method were used for this study. Pellets of 12 mm diameter were pressed
in a uniaxial die and sintered at predetermined temperatures. Few pellets of 12GDC were
sintered at 1200 oC for 3 h. Out of these pellets one set of pellets were further fired at
1400 oC and another set was fired at 1500
oC to generate microstructures of different
grain sizes. 12 GDC samples sintered at 1200, 1400 and 1500 oC are referred as GDC12,
GDC14 and GDC 15, respectively. Densities of the sintered pellets were determined by
water displacement method. The micrographs of the sintered pellet were taken by SEM
(Seron Technology, Korea). The SEM images were analyzed to estimate the average
grain size by linear intercept method. GDC pellets of different compositions (nGDC,
where n = 0, 3, 4, 6, 8, 10, 12, 15 and 18 mol% Gd2O3 doped in CeO2) were also prepared
by die pressing followed by sintering at 1250 oC. The densities of the sintered pellets
were measured by water displacement methods and recorded.
Platinum paste was applied on both the flat sides of the sintered samples and baked at
1000 oC. Electrical measurements were carried out in a frequency response analyzer
(Solatron 1260) in the frequency range 0.1 Hz to 10 MHz and in the temperature range
225 – 1000 oC in air. Resistance offered by different processes for oxygen ion conduction
has been determined from complex impedance plots (Z vs. Z). The ac electrical data
have been analyzed using Z-view software to separate the contribution of bulk and grain
boundary. Arrhenius plot for conductivity values were plotted and activation energies

70
were calculated for different samples. The impedance data are plotted in form of Bode
plots (plot of Z vs. log frequency) and oxygen ion jump frequency have been evaluated.
4.3 Results and Discussion
4.3.1 Densities and microstructures of the sintered 12GDC pellets
The densities of the 12GDC pellets obtained after sintering at 1200 oC were in the range
of 95 – 96% of theoretical density. The theoretical density of 12GDC has been taken as
7.22 g.cm-3
[177-178]. High value of sintered density is in agreement with high
sinterability of the combustion synthesized powder. On further firing at 1400 and 1500 oC
there was a marginal (less than 1.0%) increment in density. Thus in all the three samples
used in this study the densities remained in the range of 95 – 97% of theoretical density.
The SEM micrographs of the samples fired at 1200, 1400 and 1500 oC are shown in Fig.
4.1. Significant grain growth with increase in firing temperature is evident from the
micrographs. The dark/bright contrast in these microstructures is due to surface
topography. Energy dispersive X-ray spectra (EDS) do not show the presence of any
impurity element. The average grain sizes as estimated by linear intercept method are 0.2,
0.9 and 1.2 μm for the samples fired at 1200, 1400 and 1500 oC respectively.
4.3.2 Complex impedance plot: Determination of bulk, grain boundary and total
conductivity
The ac impedance data have been plotted in the form of complex impedance curve (plot
of imaginary impedance vs. real impedance) and impedance spectra (plot of imaginary
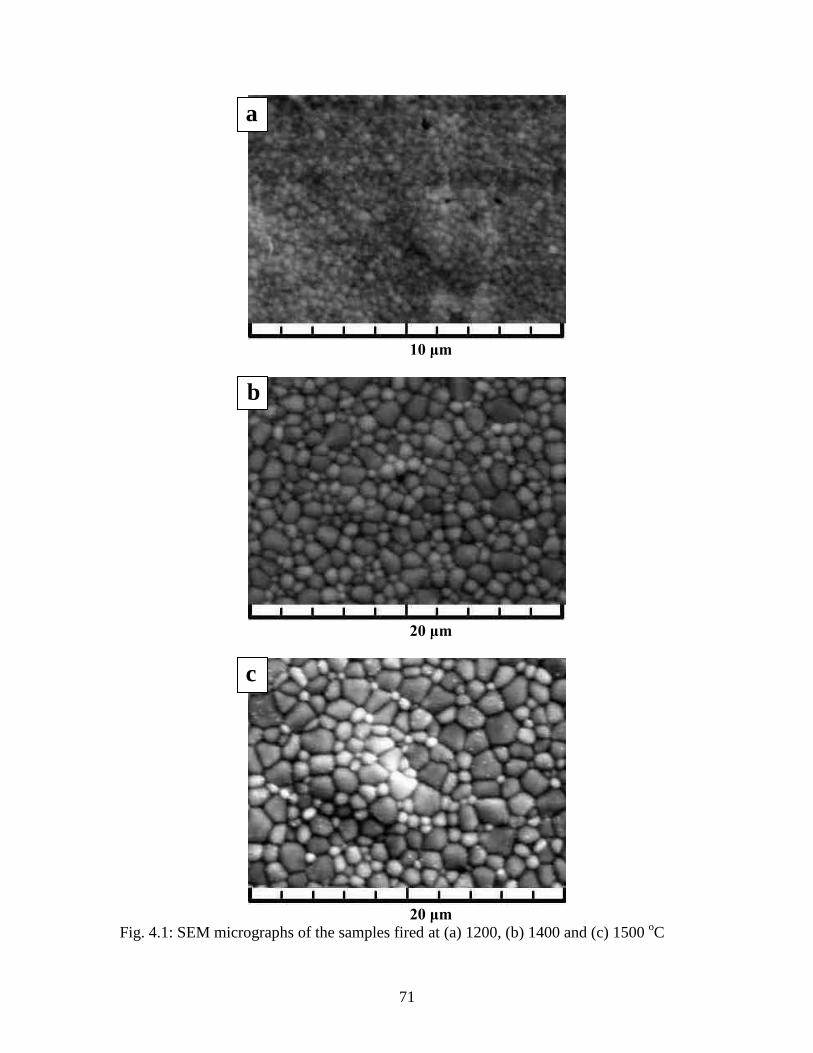
71
10 μm
20 μm
20 μm
Fig. 4.1: SEM micrographs of the samples fired at (a) 1200, (b) 1400 and (c) 1500 oC
a
c
b

72
impedance vs. frequency) in order to analyze the ion conduction behavior of bulk and
grain boundary in GDC samples. In general the relaxation time for the oxygen ion
transfer through bulk, grain boundary and electrode are well separated and hence distinct
arcs are expected for each process in the complex impedance plot [179]. In correlation
with the relaxation times the arcs correspond to bulk, grain boundary and electrode
properties are in order of decreasing frequency. Resistance of bulk or grain boundary is
calculated from the difference between the low and high frequency intercepts of the
corresponding arc (extrapolated on fitted semicircle using ZView software) with the real
impedance axis. To calculate bulk and grain boundary conductivities, total thickness of
all the grains and that of all the grain boundaries are required to be known separately. The
grain boundary thickness is considered to be of few nm. Hence, the total thickness of
grains can be approximately taken as that of the sample. However, the total thickness of
grain boundary is difficult to estimate. Hence, apparent grain boundary conductivity has
been used to compare the data. In this the total sample thickness is considered instead of
only grain boundary thickness. It may be mentioned here that all the arcs are not
necessarily to appear in the impedance plot depending on temperature and the
experimental frequency range. As the temperature increases the relaxation time for a
process decreases and the response shifts to higher frequency. Also at higher temperature
as the sample impedance decreases the inductive component of the circuit dominates at
high frequency. Because of the above two factors high frequency responses may not
appear in the impedance plots made using experimental data.

73
0 40 80 120 160 200
0
20
40
60
80
100
-Z"
(kO
hm
)
Z' (kOhm)
GDC12
GDC14
GDC15
0 200 400 600 800 1000 1200 1400 16000
200
400
600
800
-Z"
(Oh
m.c
m)
Z' (Ohm.cm)
GDC12
GDC14
GDC15
0 20 40 60 80 100 120 140 1600
20
40
60
80
-Z"
(Ohm
)
Z' (Ohm)
GDC12
GDC14
GDC15
Fig. 4.2: Complex impedance plot of different samples (GDC12, GDC14 and GDC15) at
(a) 300 oC, (b) 500
oC and (c) 1000
oC
a
b
c

74
The complex impedance plots of the three samples at temperatures 300, 500 and 1000 oC
have been presented in Fig. 4.2(a-c). As shown in Fig. 4.2(a), the impedance plots at 300
oC, bulk and grain boundary arcs are distinct along with rising electrode arcs for GDC14
and GDC15 samples. In GDC12 sample, a broad curve appears instead of two distinct
arcs for bulk and grain boundary. In this sample the low frequency intercept of the
semicircle with the real impedance axis has been taken as the total resistance. Bulk
resistances and grain boundary resistances have been determined separately for GDC14
and GDC15 samples. In the impedance plots at 500 o
C (Fig. 4.2b) the responses from the
bulk do not appear and hence, in this case only grain boundary resistances have been
determined. Total resistances have been calculated from the low frequency intercept of
the grain boundary arcs. At still higher temperature, both the responses from bulk and
grain boundary are missed out as seen from the impedance plots at 1000 oC (Fig. 4.2c). In
such cases, the high frequency intercept of electrode arc has been taken as the total
resistance.
Fig. 4.3(a) and 4.3(b) show the variation of bulk and grain boundary conductivities with
temperature in the form of Arrhenius plot for the samples GDC14 and GDC15. The bulk
conductivity is found to be higher in GDC15 sample. The apparent grain boundary
conductivities of GDC 14 and GDC15 are very close. The activation energy values for
corresponding bulk and grain boundary are given in Table 4.1.

75
15 16 17 18 19 20 211x10
-6
1x10⁻⁵
1x10⁻⁴
1x10⁻³
Co
nd
uctivity (
S.c
m-1)
10000/T (K-1)
GDC14
GDC15
12 13 14 15 16 17 18 19 20
1E-6
1E-5
1E-4
1E-3
Eff
ective
gra
in b
ou
nd
ary
co
nd
uctivity (
S.c
m-1)
10000/T (K-1)
GDC14
GDC15
Fig. 4.3 Variation of (a) bulk conductivity and (b) effective grain boundary conductivity
with temperature presented in the form of Arrhenius plot
Table 4.1 Activation energies for the bulk and the grain boundary conduction
Sample Activation energy (eV) for oxygen ion conduction
in bulk in grain boundary
GDC14 0.94 1.01
GDC15 0.94 0.99
a
b

76
13 14 15 16 17 18 19 20
10-7
10-6
1x10⁻⁵
1x10⁻⁴
10-3
a
Co
nd
ucti
vit
y (
S.c
m-1)
10000/T (K-1)
GDC12
GDC14
GDC15
7 8 9 10 11 12 13 1410
-4
10-3
10-2
10-1
100
Co
ndu
ctivity (
S. cm
-1)
10000/T (K-1)
GDC12
GDC14
GDC15
Fig. 4.4: Variation of total conductivity with temperature (a) in lower temperature range,
(b) in higher temperature range
Fig. 4.4 shows the variation of total conductivity with temperature in the form of
Arrhenius plot. In the lower temperature range, as shown in Fig. 4.4(a), the total
a
b

77
conductivity increases with decrease in grain size. In the higher temperature range, as
shown in Fig. 4.4(b), the total conductivity increases with increase in grain size. The total
conductivity remains almost unaffected with firing temperature in the measurement
temperature range 400 – 600 oC. It has been mentioned in the previous paragraph that the
bulk conductivity of GDC15 is higher than that of GDC14. Thus the bulk effect is
dominant in the higher temperature range. The reverse trend in the lower temperature
range may be attributed to higher apparent grain boundary conductivity as the grain size
decreases. As the grain size decreases the grain boundary path for ion conduction is
believed to be more. Thus the actual grain boundary conductivity increases significantly
with decrease in grain size.
4.3.3 Analysis of imaginary impedance spectra
The above observed phenomena can be better understood from the analysis of the
imaginary impedance spectra. In the impedance spectra, the frequency corresponding to a
peak of imaginary impedance (-Z”) can be correlated to successful jump frequency of the
oxygen ions [180]. This frequency is characteristics of composition and structural
arrangement of atoms. Hence analysis of impedance spectra is expected to give
information on oxygen ion hopping through the grain / grain boundary. As the relaxation
frequency of bulk is more than that of grain boundary two distinct peaks corresponding to
the bulk and grain boundary are expected to appear in the imaginary impedance spectra.
It may be mentioned here that presence of impurity phases like silica can change the

78
10 100 1000 10000 100000 1000000
0
20
40
60
80
100
-Z"
(kO
hm
)
Frequency (s-1)
GDC12
GDC14
GDC15
100 1000 10000 100000 1000000
0
100
200
300
400
500
-Z"
(Oh
m.c
m)
Frequency (s-1)
GDC12
GDC14
GDC15
10-1
100
101
102
103
104
105
106
0
10
20
30
40
50
-Z"
(Ohm
)
Frequency (s-1)
GDC12
GDC14
GDC15
Fig. 4.5 Imaginary impedance spectra of different samples (GDC12, GDC14 and
GDC15) at (a) 300 oC, (b) 500
oC and (c) 1000
oC
a
b
c

79
overall grain boundary resistance by reducing the effective conducting path across the
grain boundary. Hence, analysis of measured conductivity data may not reflect true
oxygen conduction behavior through the grain boundary. Thus, it will be interesting to
analyze the characteristic frequency from the impedance spectra to avoid the complexity
arising from partial coverage of grain boundary.
Fig. 4.5 shows the impedance spectra of the samples at 300, 500, and 1000 oC. The
characteristic frequency is found to be influenced by the microstructure. The peaks can be
distinguished for the samples GDC14 and GDC15. However, the peak is overlapped in
case of GDC12. As shown in Fig. 4.5(a) the characteristics frequency corresponding to
bulk in GDC14 is smaller than that of GDC 15 sample. However in the grain boundary
the characteristic frequency is more in case of GDC14 sample. At an intermediate
temperature, say at 500 oC as shown in Fig. 4.5(b), the bulk behavior does not appear.
Observation of the grain boundary behavior shows that the characteristic frequency of
GDC14 sample is more than that of GDC15 sample.
The variations of characteristic frequency with temperature for both bulk and grain
boundary are shown in Fig. 4.6. In the overlapped peak of the GDC12 sample (Fig.
4.5(a)) the peak does not extend to the frequency corresponding to the grain boundary
arc. Therefore, the grain boundary relaxation takes place at much higher frequency than
that of other two samples fired at higher temperature. The peak frequency is in between
the characteristic frequencies of bulk and grain boundary for GDC14 and GDC15
samples. This behavior indicates that the characteristics frequency of the bulk decreases
and that of the grain boundary increases in GDC12 in comparison with GDC14 and

80
GDC15 samples. From the above analysis it can be said that characteristics frequency of
the bulk decreases as the grain size decreases. Also the grain boundary characteristic
frequency increases with decrease in grain size.
12 13 14 15 16 17 18 19 20
102
103
104
105
106
107
Ch
ara
cte
ristic f
req
ue
ncy (
Hz)
10000/T (K)
GDC14
GDC15
17.4 18.0 18.6 19.2 19.8
104
105
106
107
ch
ara
cte
ristic f
ree
qu
en
cy(H
z)
10000/T(K)
GDC14
GDC15
Fig. 4.6 Variation of hopping frequency with temperature (a) bulk and (b) grain boundary
a
b

81
Minute observation of Figure 11 of an article by Chen et. al. [164] reveals the trend of
increase in grain boundary relaxation time (i.e. decrease in grain boundary characteristics
frequency) with increasing sintering temperature in the range of 1200 to 1500 oC. The
grain size was reported to increase with increase in sintering temperature as usually
expected.
4.3.4 Grain size effect
The change in characteristic frequency can occur due to change in composition in the
bulk / grain boundary by partitioning of solute at different firing temperatures. However
the change in characteristic frequency is very significant in case of GDC12 sample
having very fine grained structure. It is difficult to explain the significant shift of the
grain boundary characteristic frequency by compositional changes due to partitioning of
dopant. The shift towards higher frequency as the grain size decreases may be attributed
to low angle grain boundary in nanostructured material. The change in the characteristic
frequency of the bulk with grain size is also consistent. From the basic conductivity
equation it can be seen that the characteristic frequency is related to the lattice vibration
frequency. The results are indicative that the lattice vibration frequency is influenced by
the grain size. Overall the bulk characteristic frequency decreases and grain boundary
characteristic frequency increases with grain size in the fine grained structure.
4.3.5 Variation of conductivity with composition
Bulk and grain boundary ionic conductivities have been evaluated separately along with
total conductivity for GDC samples of varying gadolinia content. Fig 4.7 shows the

82
variation of bulk ionic conductivity values (g) of different compositions at various
temperatures. At lower level of gadolinia concentration the bulk conductivity is found to
increase sharply with gadolinia substitution. There is a plateau in the conductivity
maxima at a doping level of 10 to 12 mol% gadolinia. On further gadolinia doping a
regular decrease in the conductivity value is observed.
0 3 6 9 12 15 18
-15
-12
-9
-6
-3
0
ln
gi(
in
S.c
m-1)
Gd2O
3(mol %)
250 0C
300 0C
350 0C
400 0C
Fig 4.7: Variation of lattice conductivity with composition at different temperatures
Similar to the previous section in the analysis of grain boundary conductivity, ‘apparent
grain boundary’ or ‘effective grain boundary conductivity’ has been used to present the
data. While calculating the apparent grain boundary conductivity, the total thickness of
the sample is taken into consideration. Fig. 4.8 shows the variation of grain boundary
conductivity with composition. A very high grain boundary resistance is observed in the
dilute region. For pure CeO2 the apparent grain boundary resistance value is 1000 times

83
0 3 6 9 12 15 18
-16
-12
-8
-4
ln
gb(
in
S.c
m-1)
Gd2O
3(mol%)
500 0C
450 C0
400 C0
350 C0
300 C0
Fig. 4.8: Variation of grain boundary conductivity with composition at different
temperatures
higher compared to 3GDC. It has been reported that the thickness of the grain boundary
and effective grain boundary area decreases with gadolinia substitution [183]. Hence, the
resistance contribution from the grain boundary decreases with gadolinia doping. There is
a sharp increase in the grain boundary conductivity up to 6GDC and then the increase in
conductivity is not significant. A plateau in the grain boundary conductivity was
observed above 15GDC.
The variation total conductivity with composition is given in Fig. 4.9. There is a smooth
increase in conductivity value with increase in gadolinia content. In the dilute region the
conductivity was controlled by the grain boundary conductivity. The ratio of grain
boundary resistance to the total resistance decreases from 95% to 58% as gadolinium
content varies from 0 to 6 mol%. It has been observed that highest conductivity is

84
obtained in the composition range of 10GDC to 12GDC. However at higher gadolinia
concentration, defect association leads to lowering of the effective concentration of
oxygen vacancies. At higher doping level the bulk conductivity dominates. Hence,
increase in gadolinia content leads to decrease in the overall conductivity.
Fig. 4.9 Variation of total conductivity with composition
4.3.6 Activation energies for ionic conduction
The conductivity values at different temperature are represented by Arrhenius plots.
Arrhenius equation for conductivity is expressed as follows,
kT
Eexp0 … (4.2)
Taking natural logarithm of both sides, the equations (4.2) become:
8 10 12 14 16 18
0.000
0.005
0.010
0.015
0.020
0.025
0.030
0.035
0.040
0.045
i
n S
.cm
-1
Mol% Gd2O
3
400 0C
500 0C
600 0C
700 0C

85
kT
E 0lnln … (4.3)
Graph of ln() vs 1/T is plotted to calculate the value of activation energy. The variation
of activation energy for bulk and grain boundary conduction with varying composition of
gadolinia doping is shown in Fig. 4.10. It has been observed that for bulk conduction,
there is no appreciable change in the activation energy up to 5mol% Gd2O3 doping. On
further doping of Gd2O3 the activation energy increases. This increase in activation
energy is attributed to the association of the oxygen vacancy with the dopant metal
cations. The activation energy for grain boundary conduction in the dilute region is very
high. This higher activation energy is attributed to very high grain boundary thickness
[183]. There is a rapid decrease in the activation energy for grain boundary conduction
and a minimum is observed in the range 10GDC to 15GDC. Increase in activation energy
is observed on further increase of gadolinia content. From the work of Avila-Paredes et
al.[183] it has been seen that with gadolinia doping the thickness of the grain boundary
decreases and hence the activation energy decreases. At still higher doping level there is
increase in activation energy due to increased space charge layer thickness [183].
The Arrhenius plot for total conductivity is not linear over the entire temperature range.
At intermediate temperature region the activation energy has two parts namely
association enthalpy and migration enthalpy. At higher temperature region dissociation of
vacancies takes place. The activation energy at high temperature known as migration
enthalpy is not varies much with composition, whereas the association enthalpy varies

86
with composition. The curve of activation energy with composition is shown in Fig. 4.11.
This shows a minimum at around 10-12 mol% doping.
0 4 8 12 16 20
0.8
1.2
1.6
2.0
2.4
Activa
tio
n E
ne
rgy(e
V)
Gd2O
3(mol%)
Egb
Egi
Fig. 4.10 Variation of activation energy of grain and grain boundary with composition
Fig. 4.11 Variation of activation energy with composition

87
4.4 Summary
Gadolinia substituted ceria with dense and fine grained microstructure can be prepared by
low temperature sintering of combustion synthesized powder. The grain boundary
conductivity increases and bulk conductivity decreases as grain size becomes finer. As a
consequence, at lower temperature maximum conductivity is obtained with fine grained
structure and at higher temperature conductivity is more with coarse grained structure.
Thus from technological point of view fine grained microstructure is preferable for
application at lower temperatures. The analysis of impedance spectra reveals that the
relaxation frequency is influenced by the grain size. The relaxation frequency of the bulk
decreases and that of grain boundary increases with grain size in the fine grained
structure. Gadolinia doping in cerium oxide produces oxygen vacancies responsible for
the ionic conductivity. With increase in gadolinia doping conductivity increases and
reaches a maximum value at 10 to 12 mol% doping. On further substitution of gadolinia,
conductivity decreases. Lattice/ grain interior conductivity follows the same pattern as
total conductivity. However, grain boundary conductivity decreases rapidly with
gadolinia doping and remains almost same for 6GDC to 15GDC. The activation energy
for total conduction have a minimum for 10-12GDC. Activation energy for lattice
conductivity remains same up to 6GDC and increases on further substitution. Activation
energy for grain boundary conductivity decreases rapidly and attains a minimum at
10GDC.

88

88
Chapter 5
Synthesis and characterization of
NiO- GDC composite for SOFC anode
5.1 Introduction
The performance of a SOFC depends on the internal resistance of a cell during operation.
The internal resistance mainly depends on the electrolyte resistance and the polarisation
resistance at the electrode-electrolyte interface. In an electrode supported cell thin
electrolyte can be integrated to minimize the resistance coming from electrolyte. The
electrolyte resistance depends on the material and thickness of the electrolyte layer. For
dense GDC electrolyte of nominal thickness of about 20 µm the area specific resistance is
about 0.1 Ω.cm2. Anode supported cell having thin electrolyte has been reported
extensively in the literature [184-192]. Nickel has good catalytic property towards
hydrogen oxidation and is widely used in the anode structure in the form of a composite
of nickel and the electrolyte material. Nickel has higher coefficient of thermal expansion
compared to GDC electrolyte. However, in the nickel–GDC composite the thermal

89
expansion coefficient matches quite well with the electrolyte material. Also, presence of
electrolyte material in the anode structure extends the triple phase boundary area.
Therefore, Ni-GDC composite is a potential anode material for GDC electrolyte based
IT-SOFC [193-194].
Apart from the electrode composition the microstructure plays an important role. The
electrochemical reaction at the anode is heterogeneous in nature. The heterogeneous
reactions at the anode takes place at the triple phase boundary (TBP) area where the
pores, the Ni phase and the YSZ electrolyte meet. Hence the triple phase boundary should
be as large as possible for better catalytic activity. At the same time the continuity of
nickel phase need to be maintained throughout the anode structure in order to keep TBPs
active through better current collection. Fine microstructure is expected to have better
TBP area. Also fine NiO particle ensures electrical percolation in the sintered anode
structure. Therefore it is required to have ultrafine NiO powder with narrow size
distribution for effective control over latter stage processing and sintering properties i.e
control over final microstructure and performance of the fuel cell. Increase in the Ni
amount increases the conductivity, however themal expansion coefficient (TEC) also
changes drastically. Conductivity value decrease with decrease in nickel content and
there exist a threshold value below which the conductivity falls drastically. NiO was
taken as precursor for the Ni-GDC anode fabrication. At the high operating temperature
and reducing atmosphere of the anode NiO transforms into Ni. NiO-electrolyte composite
close to 1:1 weight ratio has been used by many authors [195,196]. After reduction of
NiO in the anode, there should be continuity among the nickel particle for better current
collection. The minimum amount of nickel to GDC ratio for which there will be a

90
continuous network among Ni particles is called percolation ratio which is around 30
weight %.
GDC powder for preparation of anode structure has been described in Chapter 3. Fine
NiO powders can be prepared by various wet chemical methods [197-200]. Gel
combustion method is an attractive method for preparing fine powders without
calcination. Optimization of fuel to oxidant leads to final product in a single step in many
occasions. In the present investigation ultra fine NiO has been synthesized by combustion
route and physical characterization of the powder was carried by x-ray diffraction, laser
scattering, scanning electron microscope, transmission electron microscope, and EDS.
Electrical conductivity of NiO-GDC has been measured in H2 atmosphere.
5.2 Experimental
5.2.1 Synthesis of fine NiO powder
Fine NiO has been synthesized by solution combustion route using nickel nitrate as
oxidant and citric acid as fuel. Calculated amount of Ni(NO3)2.6H2O was dissolved in
deionised water. Required amount of citric acid as calculated from propellant chemistry
was added to the metal nitrate solution with constant stirring on a hot plate. After
dehydration, a viscous gel is formed and further heating of the gel leads to an exothermic
reaction with evolution of large amount of gaseous molecules. The flowchart for the
preparation of fine NiO powder through combustion route is shown in Figure 5.1. The

91
decomposition behaviour of the dried precursor gel from combustion synthesis was
carried out on a TG-DSC instrument (SETARAM: SETSYS evolution) in flowing air
atmosphere. X-ray diffraction of the as synthesized powder was taken in an X-Ray
diffractometer (Philips, model: PW1830) in the 2θ range from 20 – 80o with a step size of
0.02o. The as-synthesized powder was calcined at 700
oC and X-ray diffraction pattern of
the calcined powder was recorded. The particle size of the calcined powder was taken in
a laser diffraction particle size analyzer (HORIBA, Model: LA500). The morphology of
the calcined powder was observed using a scanning electron microscope (Model: SERON
2000, South Korea) and a transmission electron microscope (TEM).
Fig. 5.1: Flowchart for the preparation of fine NiO powder through combustion route

92
5.2.2 Preparation of NiO-GDC powder
NiO and GDC powders were taken in weight ratio 1:1 and mixed in a ball mill in ethanol
medium for 6 h. After mixing, the powder was dried under IR lamp. Pellets of 12 mm in
diameter were prepared by uniaxial die compaction at a pressure of 180 MPa. The green
pellets were sintered at 1350 oC and the densities of the sintered pellets were measured by
water displacement method. The micrographs of the sintered pellets were taken in a
scanning electron microscope (Model: SERON 2000). Distribution of the NiO and GDC
phases in the sintered pellet was confirmed by energy dispersive X-ray spectroscopy
(EDS) (Oxford make). Rectangular bar pellets of ~20 mm length and 6×6 mm2 cross
sectional area were prepared by cold compaction in a rectangular die pressing at a
pressure of 180 MPa. The bar pellet was sintered at 1350 oC and treated in hydrogen
atmosphere to facilitate reduction of NiO into metallic Ni. Electrical conductivity
measurement of Ni-GDC bar specimen was carried out by dc four probe technique in
hydrogen environment using a source meter. Microstructure of the reduced pellet was
carried out by a SEM.
5.3 Results and Discussion
5.3.1 Synthesis and characterisation of fine NiO powder
In the synthesis of NiO powder, nickel nitrate and citric acid were taken in molar ratio
9:5 as per propellant chemistry. Nickel nitrate acts as an oxidiser and citric acid acts as

93
fuel to enable combustion reaction. TG-DSC graph of the dried gel-precursor in the
combustion route is shown in Fig. 5.2. The initial mass loss in the range 80-200 oC is
attributed to the loss of water molecules left in the gel. There was a sudden mass loss at
370 oC and an exothermic peak corresponding to the mass loss is an indicative of
combustion reaction. After the combustion there is gain in mass as reflected in the TG
pattern. The as-synthesized powder in the solution combustion route using citric acid as
fuel was calcined at different temperatures. A minimum calcination temperature of 700
oC is required for phase formation as indicated in the X-ray diffraction pattern. The X-ray
diffraction patterns of the as-synthesized powder and calcined powder are shown in Fig.
5.3. Peaks corresponding to NiO and metallic Ni phases are present in the XRD pattern of
as-synthesized powder. This is attributed to the reducing environment prevailing in the
combustion reactor. Initial Ni content in the as synthesized powder is converted to NiO
leading to a mass gain in the TG-DSC graph. It may be noted that for taking right
quantity of NiO powder to get NiO-GDC mix powder it is required to have single NiO
phase in the powder. From the XRD pattern of the calcined powder it is observed that
only NiO peaks are present. Therefore, calcination at 700 oC fully oxidises Ni particles
that were present in the as-synthesized powder. Particle size distribution of calcined
powder was measured by laser diffraction particle size analyzer and the median particle
size is found to be 0.69 micron. From XRD line broadening the crystallite size has been
calculated to be 7 nm. These results suggest that the calcined powder is agglomerates of
nm size crystallites.

94
200 400 600 800
-60
-50
-40
-30
-20
-10
0 TG
DSC
Temperature ( oC)
Mass L
oss (
%)
0
4
8
12
16
20
Heat F
low
(V
.K-1)
Fig. 5.2: TG-DSC pattern of gel precursor of NiO in the combustion method
Fig. 5.3: X-ray diffraction pattern of as-synthesized (black line) and calcined (red line)
NiO powder
2θ/degree
20 30 40 50 60 70
0
1000
2000
3000
4000
5000
6000
Intensity
(a.u)
----NiO
-----Ni

95
Fig.5.4: SEM micrograph of the calcined NiO powder
Fig. 5.5: TEM image of calcined NiO powder showing nm size primary particles
The insert show SAED pattern
The SEM micrograph of the calcined powder is shown in Fig.5.4. Submicron size
agglomerates are observed in the SEM micrograph. The size of the agglomerate

96
corroborates the results obtained from laser diffraction particle size analyser. Though
submicron size particles are observed in the SEM micrographs, finer details are not clear.
Nano size primary particles are clearly observed in the TEM micrographs as shown in
Fig. 5.5. The average size of the primary particles in the calcined powder is about 15 nm.
These nano size particles are bound by weak van-der-waals force forming agglomerates
that can break easily during compaction of powder.
5.3.2 Characterisation of NiO-GDC sintered pellet
Fig. 5.6 shows the scanning electron micrograph of the sintered NiO-GDC pellet. Two
different phases are distinctly identified in the micrograph. One phase has networked
structure of larger grains of size in the range of 1 to 2 µm. The grain size of other phase is
relatively finer (<1 µm). The finer grains also form a networked structure. At some places
the finer grains are present in agglomerated form. Pores are present in the microstructure
and the porosity is 15% as measured by water displacement method. The porosity is
expected to increase in the Ni-GDC cermet structure after reduction. In order to identify
the phases in the composite structure EDS analysis has been carried out. It is observed
from the micrograph that the GDC electrolyte particles have grown up to micron size
though fine nano size particles are used as initial material. The EDS element scan of the
NiO-GDC surface and the corresponding secondary electron micrograph is shown in Fig.
5.7. The element scans indicate that larger grains correspond to GDC phases and smaller
grains are of NiO phase.

97
Fig. 5.6: SEM micrograph of NiO-GDC pellet sintered at 1250 oC
Gd Mapping
Ce Mapping
Ni Mapping
SE image
Fig. 5.7: EDS element scan of the NiO-GDC surface and the corresponding SE image

98
5.3.3 Characterisation of Ni-GDC cermets
The electrical conductivity of the Ni-GDC bar specimen measured by four probe DC
technique is shown in Fig.5.8. Metallic behaviour is observed in the conductivity plot,
where conductivity decreases with increasing temperature. The electronic conductivity of
GDC is very low compared to Ni in the cermet composition. Hence total conductivity is
controlled by the conductivity of networked nickel phase in the anode. At temperatures
below 400 oC conductivity value more than 1500 S.cm
-1 has been obtained. The
conductivity remains around 1200 S.cm-1
even at 800 oC which is the upper temperature
limit of IT-SOFC operation. Ni coarsening has been addressed in the literature when Ni
cermet is used for prolonged time. This leads to decrease in conductivity of the anode as
well as reduces the triple phase boundary area. In the present study the conductivity has
been measured at 800 oC for 72 h continuously. No appreciable decrease in the
conductivity has been observed. Low temperature operation as well as uniform
distribution of GDC phases prevents coarsening of nickel particles. The SEM micrograph
of a sintered and reduced NiO-GDC pellet is shown in Fig. 5.9. More than 30% porosity
was observed in the reduced pellet as confirmed from the water displacement data.
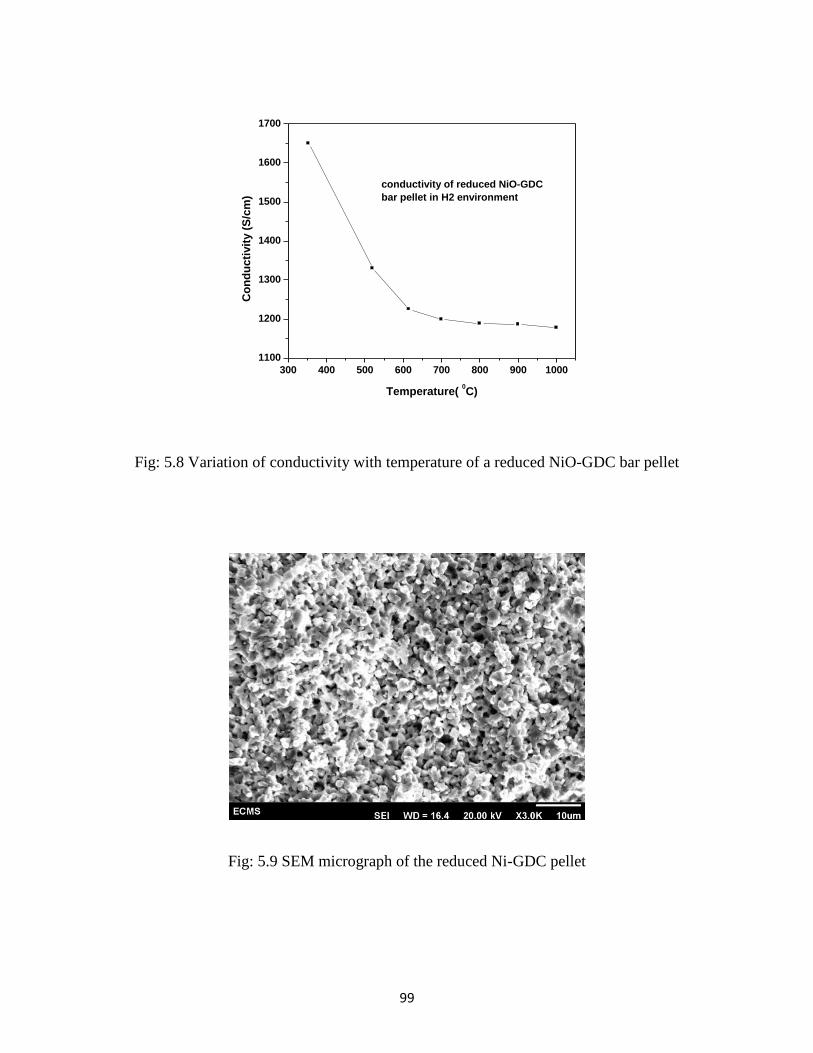
99
300 400 500 600 700 800 900 1000
1100
1200
1300
1400
1500
1600
1700
conductivity of reduced NiO-GDC
bar pellet in H2 environment
Co
nd
ucti
vit
y (
S/c
m)
Temperature( 0C)
Fig: 5.8 Variation of conductivity with temperature of a reduced NiO-GDC bar pellet
Fig: 5.9 SEM micrograph of the reduced Ni-GDC pellet

100
5.4 Summary
Phase pure nano-size NiO powder has been prepared by gel combustion and subsequent
calcination at 700 oC. NiO-GDC anode prepared by mixing combustion synthesized GDC
and NiO powders followed by sintering at 1250 oC shows networked structure of both
GDC and NiO phases. The electrical conductivity of Ni-GDC cermet is well above 1200
S.cm-1
and the electrical conductivity is found to be stable over long time. The results
suggest that Ni-GDC cermet prepared using nano-sized starting powder can form an
anode structure having long term stability.

101
Chapter 6
Synthesis and Characterization GdCoO3
based Cathode Material
6.1 Introduction
Solid Oxide Fuel Cell (SOFC) is an energy conversion device which can produce
electricity by electrochemical reaction between a fuel (e.g. hydrogen, natural gas) and
oxygen in an efficient and environment friendly manner[160,43]. SOFCs are required to
be operated at high temperatures (in the temperature range of 800 -1000 oC) and
therefore, one of the technological hurdles in SOFC technology is in getting compatible
materials with long term durability. Lowering the operating temperature suppresses
degradation of cell components and thereby increases the durability of the cell and
widens the choice of materials in stack design. However, operation of SOFC at lower
temperature implies lower electrode kinetics, resulting in large interfacial polarization
resistance and lower electrolyte conductivity. In order to maintain high efficiency of
SOFC in the intermediate temperature range (600-800°C) there is a need to develop new
materials and improved cell fabrication techniques.

102
Gadolinia doped ceria is reported to have appreciable ionic conductivity and ionic
transport number to make it a candidate electrolyte material for intermediate temperature
SOFC (IT-SOFC) [43,118,160,201]. This electrolyte material needs to be integrated with
suitable electrode materials having good electro-catalytic activities in the operating
temperature range. The electrode material must have high electronic conductivity and
thermal expansion coefficient matching with the electrolyte material. Further, the
electrode material must have chemical compatibility with electrolyte material in the
conditions prevailing during fabrication and operation.
Perovskite materials with general formula ABO3 (A = La and other rare earth metals, Ca,
Sr, Ba etc.; B = Mn, Fe, Co, Ni etc.) are widely used as cathode materials in SOFCs [202-
205]. In general, doped cobaltites are reported to have better electro-catalytic activities
for oxygen reduction reaction as well as higher electronic conductivities than other
electrode materials [204-207]. However, thermal expansion coefficient values of many
cobaltites are significantly higher than that of GDC electrolyte material. Large mismatch
in thermal expansion coefficient with the electrolyte material may result in delamination
at the electrode-electrolyte interface or cracking of the electrolyte layer [208]. Among the
different rare earths that form lanthanide cobaltite perovskites the thermal expansion
coefficients of the cobaltites decrease in the order of La, Pr, Nd, Sm and Gd [205]. Thus
GdCoO3 can be a potential electrode material. Thermal expansion coefficient of
cobaltites is also influenced by substituting ‘A’ sites or Co sites with suitable elements.
Substitution of La sites in LaCoO3 with aliovalent dopants, such as Sr, is reported to
increase oxygen vacancy in the cobaltite structure. This results in increase in ionic

103
conductivity and also increase in thermal expansion coefficient. The increase in ionic
conductivity can have a beneficial effect by way of enhancement of the triple phase
boundary area. As the reaction at the cathode is heterogeneous in nature, larger triple
phase boundary (TPB) area will lead to better reaction kinetics and consequently decrease
in area specific resistance (ASR) at the interface. The high thermal expansion coefficient
is often brought down close to the thermal expansion coefficient of the electrolyte
material by doping Co sites with Fe, Mn etc. [204-205]. However, electro-catalytic
activity is likely to be reduced by doping the Co sites. Therefore, among the lanthanide
cobaltites, gadolinium cobaltate has been taken in the present study. Sr doping has been
studied and reported by many authors. Ba has larger ionic radius and is expected to
reduce the thermal expansion coefficient. It is expected that there will be decrease in is
the TEC value and increase in the ionic conductivity with barium substitution. The TEC
of cathode material can also be tuned close to that of the electrolyte material by the
composite electrode approach [204,209-211]. This use of GdCoO3 in association with
GDC electrolyte is expected to have beneficial effect in decreasing the thermal expansion
coefficient and extending the triple phase boundary area. The triple phase boundary area
can be increased by using fine particles of electrode material and tailoring the
microstructure [212-213]. Therefore ultrafine powders of Ba doped Gd cobaltite has
been synthesized by wet chemical route and composite electrode approach has been
adopted in the present study.
There are various solution synthesis routes (e.g. co-precipitation, hydrothermal, sol–gel,
solution polymerization, solution combustion etc.) that have been used to prepare fine

104
mixed oxide powders in narrow particle size distribution. Solution polymerization is one
of these routes that uses less expensive starting materials and produces phase pure oxide
ceramic powders [214]. In the present study, GdCoO3 and barium substituted (10 and 15
mol %) GdCoO3 powders have been synthesized by solution polymerization route. The
characteristics of the synthesized powder and functional properties of the sintered
material have been evaluated.
6.2 Experimental
6.2.1 Preparation of precursor powders of GdCoO3 and Ba-doped GdCoO3
Fine powder of GdCoO3 was synthesized by solution polymerization method starting
with metal nitrates, and a mixture of sucrose and polyvinyl alcohol (PVA) as
polymerizing agents. Gd(NO3)3.6H2O (purity > 99.9%, Indian rare Earth Limited, India)
and Co(NO3)2.6H2O (purity > 99.98%, Alfa Biochem, India) were taken in 1:1 molar
ratio and dissolved in deionized water. Sucrose and PVA were added to the mixed nitrate
solution with stirring on a hot plate. The quantity of sucrose and PVA (10% W/V) were 4
moles and 0.8 moles per mole of metal nitrate. The pH of the solution was maintained at
around 1.0 by adding citric acid to the solution. Viscous gel was formed on dehydrating
the solution on a hot plate. Further heating led to charring of the gel and formation of
black precursor powder. Precursor powders of barium substituted (10 mol% and 15 mol
%) GdCoO3 powders were also prepared by solution polymerization as described above.
Ba(NO3)2 (purity > 99.0%, E-Merck, India) was used for the synthesis of doped
gadolinium cobaltite.

105
6.2.2 Thermogravimetry and Calcination of precursor powders
Thermo-gravimetry (TG) and Differential Scanning Calorimetry (DSC) of GdCoO3
precursor powder sample was carried out on a TG-DSC instrument (SETARAM Setsys
Evolution 1600). In this experiment platinum crucible was used and the sample was
heated at a rate of 10 oC/min upto 1000
oC in flowing air environment. Based on the TG
analysis the precursor powders of all three compositions were calcined at 800 oC. The
flow sheet for the preparation of GdCoO3 and Ba-doped GdCoO3 powders is given in
Fig. 6.1.
Fig. 6.1: Flow sheet for the preparation of GdCoO3 and Ba-doped GdCoO3 powders

106
6.2.3 Characterisation of calcined powders
Room-temperature X-ray diffraction (XRD) pattern of the calcined powders were
recorded with an X-ray diffractometer (model PW1830, Philips) using Ni-filtered CuKα
radiation in the 2θ range from 10 to 70o. The phase purity of the calcined powder was
confirmed by matching with standard PCPDF data. A small amount of GdCoO3 calcined
powder was dispersed in alcohol using ultrasonicator and subsequently deposited over a
copper grid by dropping a droplet of the suspension over it. The carbon coated copper
grid was used for observing the powder morphology by a transmission electron
microscope (TEM).
6.2.4 Cold compaction and sintering of calcined powders
Cylindrical pellets of 6 mm diameter × 6 mm height (approx.) were prepared by uniaxial
die pressing the calcined powders of each composition at 165 MPa. Shrinkage behavior
of the powder compacts were studied using a dilatometer (model: SETARAM, SETSYS
Evolution 1700) under a constant rate of heating (4 oC/min) upto 1300 °C. Based on the
shrinkage study the green compacts of all three compositions were sintered at 1200 oC, 3
h. Densities of the sintered pellets were determined by water displacement method. The
micrographs of the sintered pellets were taken by Scanning Electron Microscope
(SERON 2000).

107
6.2.5 Evaluation of functional properties
Coefficient of thermal expansion (CTE) of the sintered pellets of all three compositions
were determined from ambient to 1000 oC by using the same dilatometer that was used
for sintering study. Rectangular bar samples of dimension 20 mm (L) × 5 mm (W) × 5
mm (B) were prepared by compacting pure and barium doped GdCoO3 powders in a
rectangular die followed by sintering at 1200 oC, 3 h. Four probe DC technique was used
to measure conductivity of the rectangular bar shaped samples using a source meter unit.
6.3 Results and discussion
6.3.1 Synthesis of GdCoO3 and Ba-doped GdCoO3 powders
In the present work, PVA and sucrose have been used for synthesis of GdCoO3 and Ba-
doped GdCoO3 powders by solution polymerization route. The details of synthesis are
described in chapter 2. Metal nitrates in the aqueous solution are known to coordinate
with the polymer formed by the mixture of PVA and sucrose at elevated temperature. The
cation ratio is expected to be maintained in the gel network till the gel dries out and forms
a charred mass. The charred mass is black in color and contains carbonaceous materials
that need to be removed through calcination in air. To avoid the formation of hard
agglomerates the calcination temperature is required to be as low as possible.
TG-DSC of the precursor powder (charred mass) gives an insight of different steps that
occur during calcination. Fig. 6.2 shows the TG-DSC curves of the GdCoO3 powder

108
precursor when heated in air. Continuous mass loss takes place up to 730 oC and
thereafter mass gain is recorded in the temperature range from 730 to 780 oC.
0 200 400 600 800 1000
-6
-5
-4
-3
-2
-1
0
1
DSC
TG
Temperature ( oC)
Ch
an
ge in
mass (
%)
-0.5
0.0
0.5
1.0
DS
C(
V.K
-1)
Fig. 6.2: TG-DSC curves of the GdCoO3 powder precursor obtained by solution
polymerization route
In the mass loss region two distinct portions can be identified. The slope of the DSC
curve is found to change sharply at 310 oC. The mass loss upto 310
oC could be attributed
to decomposition of PVA and sucrose and loss of water molecules. Further mass loss in
the temperature range from 310 to 730 oC is due to burning of residual carbonaceous
materials. The overall mass loss upto 730 oC is only 5.5%. It may be mentioned here that
in this synthesis route metal nitrates act as oxidizer and helps in removing large quantity
of carbonaceous material during drying of the gel. The weight gain in the temperature

109
from 730 to 780 oC is attributed to oxygen pick up associated with valency state change
of Co2+
to Co3+
and formation of perovskite GdCoO3 phase. At higher temperature the
mass remains constant upto 920 oC. From the results as discussed above, the calcination
temperature of the precursor powders was fixed at 800 oC for all the three compositions.
6.3.2 XRD of GdCoO3 and Ba-doped GdCoO3 powders
The X-ray diffraction pattern of GdCoO3 powder obtained after calcinations is shown in
Fig. 6.3. All the peaks in the X-ray diffraction pattern could be indexed to perovskite
GdCoO3 phase as reported in literature [215].
20 30 40 50 60 700
50
100
150
200
250
300
13
3
22
33
12
20
41
3213
11
14
22
10
23
00
42
20
11
32
02
02
22
110
21
20
01
12
02
0
11
1
00
2
Inte
nsit
y (
arb
itra
ry u
nit
)
2 (degree)
Fig. 6.3: X-ray diffraction pattern of GdCoO3 powder (calcined at 800 oC)
The diffraction patterns of all the three compositions are shown in Fig. 6.4. The reference
patterns for barium doped samples are not available in the literature. A shift in peak

110
position is observed in the diffraction pattern with respect to pure GdCoO3. However, the
perovskite type orthorhombic structure of GdCoO3 remains unchanged in the range of
barium substitution. No extra peak has been observed in the diffraction pattern indicating
the complete solubility of barium in GdCoO3 perovskite phase in the experimental range
of substitution. As the ionic radius of Ba2+
is higher compared to Gd3+
, an increase in cell
volume is expected.
20 30 40 50 60 70
0
200
400
600
800
1000
GBC10
GBC15
GBC0
Inte
ns
ity i
n a
rb.
un
it
2 (degree)
Fig. 6.4: X-ray diffraction pattern of Ba-substituted GdCoO3 powder (calcined at 800 oC)
6.3.3 Morphology of calcined powder
The TEM micrograph of the calcined GdCoO3 powder is shown in Fig. 6.5. The powder
particles are found to be agglomerates of nano-size primary particles. The average
primary particle size is about 30 nm. These agglomerates are soft in nature and break
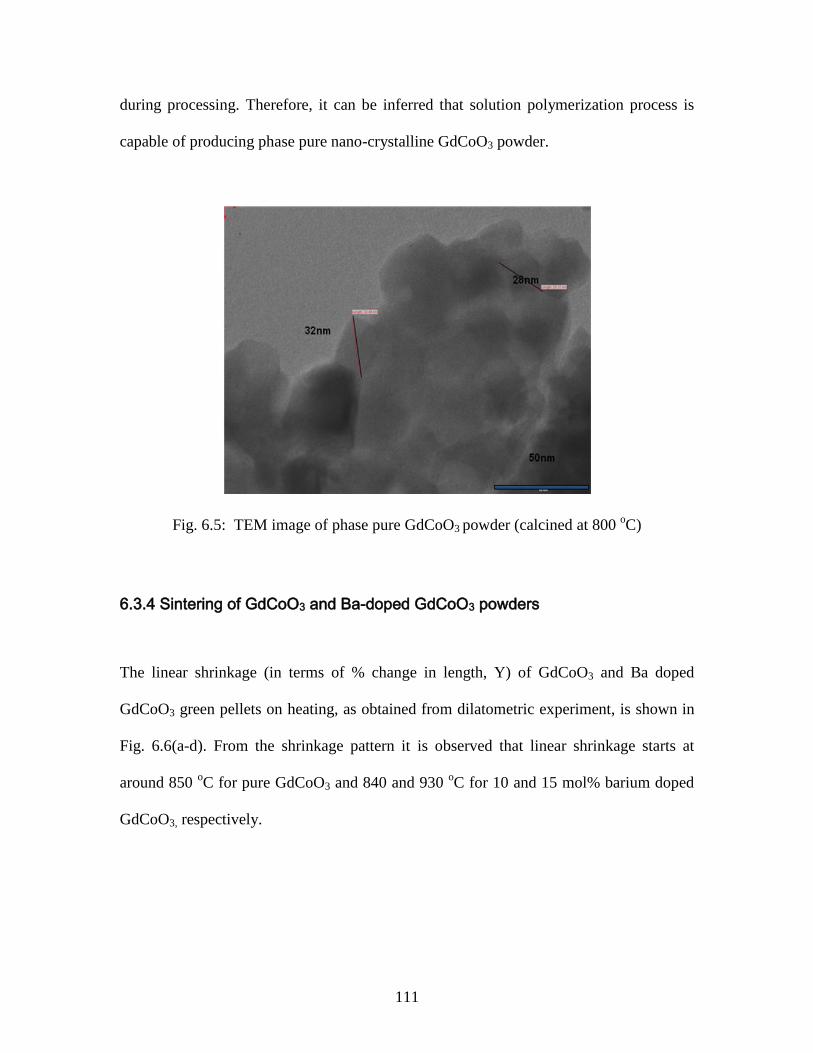
111
during processing. Therefore, it can be inferred that solution polymerization process is
capable of producing phase pure nano-crystalline GdCoO3 powder.
Fig. 6.5: TEM image of phase pure GdCoO3 powder (calcined at 800 oC)
6.3.4 Sintering of GdCoO3 and Ba-doped GdCoO3 powders
The linear shrinkage (in terms of % change in length, Y) of GdCoO3 and Ba doped
GdCoO3 green pellets on heating, as obtained from dilatometric experiment, is shown in
Fig. 6.6(a-d). From the shrinkage pattern it is observed that linear shrinkage starts at
around 850 oC for pure GdCoO3 and 840 and 930
oC for 10 and 15 mol% barium doped
GdCoO3, respectively.

112
200 400 600 800 1000 1200 1400
-20
-15
-10
-5
0
5
a
lin
ear
sh
rin
kag
e(%
)
Temperature( oC)
GdCoO3
10 % Ba doped
15 % Ba doped
Fig. 6.6 (a) Shrinkage pattern of green pellets on heating in air upto 1300 oC
The differential curves of the shrinkage pattern are shown along with the shrinkage curve,
which show the maximum shrinkage temperatures. For GdCoO3 maximum shrinkage
takes place at 1040 oC, and it is same for 15 mol% barium doped GdCoO3. However,
maximum shrinkage takes place at 990 oC for 10 mol% barium doped GdCoO3.
Therefore, GdCoO3 based powders obtained by solution polymerization method can be
sintered to full density by holding at these temperatures. For all compositions there are
two stages of shrinkage. The two stage shrinkage behavior is attributed to the change in
oxygen non-stoichiometry at higher temperatures.

113
0 200 400 600 800 1000 1200 1400
-25
-20
-15
-10
-5
0
5
Shrinkage curve
Shrinkage rate curve
Temperature (oC)
% C
han
ge i
n l
en
gth
, Y
-0.12
-0.10
-0.08
-0.06
-0.04
-0.02
0.00
0.02
b
Sh
rinka
ge
rate
(dY
/dT
)
0 200 400 600 800 1000 1200 1400
-24
-20
-16
-12
-8
-4
0
4
Shrinkage curve
Shrinkage rate curve
Temperature (oC)
% C
han
ge in
len
gth
, Y
-0.12
-0.10
-0.08
-0.06
-0.04
-0.02
0.00
0.02
c
Sh
rinkag
e ra
te (d
Y/d
T)
Fig. 6.6: Shrinkage pattern of green pellets on heating in air upto 1300 oC (b) GdCoO3
(C) 10GBC

114
0 200 400 600 800 1000 1200 1400
-14
-12
-10
-8
-6
-4
-2
0
2
Shrinkage curve
Shrinkage rate curve
Temperature (oC)
% C
han
ge in
len
gth
, Y
-0.16
-0.12
-0.08
-0.04
0.00d
Sh
rinkag
e ra
te (d
Y/d
T)
Fig. 6.6(d): Shrinkage pattern of green pellets of 15GBC on heating in air upto 1300 oC
Maximum shrinkage takes place in the first stage itself for pure and 10 mol% barium
doped samples. However for 15mol% barium doped samples only 5 % shrinkage takes
place up to 1168 o
C and overall shrinkage of 11 %. It has been observed that the overall
liner shrinkage decreases with barium doping. In the shrinkage rate curve a sudden
increase in the shrinkage rate is observed at a temperature above 1200 oC. This may be
attributed to the instability of GdCoO3 phase at higher temperature [216].
In the present study GdCoO3 has been sintered at 1200 oC for 3 h avoiding the instability
region. The XRD pattern of the sintered sample is shown in Fig. 6.7. All the peaks in the
XRD pattern could be indexed to perovskite GdCoO3 phase. This confirms the stability of
the perovskite GdCoO3 phase upto 1200 oC.

115
20 30 40 50 60 700
400
800
1200
1600
2000
Inte
nsit
y (
arb
itra
ry u
nit
)
2 (degree)
Fig.6.7: X-ray diffraction pattern of GdCoO3 sintered at 1200 oC
From the shrinkage patterns it can be concluded that, GdCoO3 based powders obtained by
solution polymerization method can be sintered by holding at 1200 oC. In the present
study all three compositions have been sintered at 1200 oC for 3 h to obtain dense
samples that have used for measuring coefficient of thermal expansion and electrical
conductivity. The sintered densities as measured by water displacement method were
found to be 94 – 96% of theoretical density. The microstructures of the three dense
GdCoO3 based pellets sintered at 1200 oC are shown in Fig. 6.8.

116
Fig. 6.8: SEM micrograph of pellet sintered at 1200 oC (a) GdCoO3 (b)10GBC (c)
15GBC

117
6.3.5 Coefficient of thermal expansion
The percentage linear thermal expansion [eT = (ΔLT-200)/L0] of sintered GdCoO3 in the
temperature range from 200 to 1000 oC is shown in Fig. 6.9. The average value of
coefficient of thermal expansion (αT) has been estimated from the slope of the thermal
expansion curve using the relationship: (αT = eT/ΔT). The average CTE is found to vary
from 16×10-6
K-1
to 25×10-6
K-1
in the temperature range from 200 to 1000 oC. The
average CTE remains on the lower side in the low temperature range. Steeper slope of the
thermal expansion curve between 350 and 600 oC indicates average CTE as high as
25×10-6
K-1
in this temperature range. This phenomenon can be explained by lattice
expansion associated with lattice oxygen loss leading to formation of oxygen vacancies.
200 400 600 800 1000
0.0
0.4
0.8
1.2
1.6
2.0
% L
inear
therm
al
exp
an
sio
n,
(
LT
-200 /
L0 )
.100
Temperature (oC)
Fig. 6.9: Linear thermal expansion curve of GdCoO3 sintered at 1200 oC

118
The TEC values of GdCoO3 are much higher compared to the GDC electrolyte material.
The GDC electrolyte material with nominal composition Ce0.8Gd0.2O1.9 has an average
TEC about 12.5 ×10⁻⁶
K-1
[217]. To avoid large mismatch in TEC a mixture of GdCoO3
and GDC electrolyte material has been used in the evaluation of its electrochemical
performance as a SOFC cathode material. The thermal expansion behavior of this
composite electrode material has been discussed later.
200 400 600 800 1000
0.0
0.5
1.0
1.5
2.0
% L
inear
therm
al exp
an
sio
n, (
LT
-20
0 / L
0 )
.100
Temperature ( oC)
GdCoO3
10GBC
15GBC
Fig. 6.10: Linear thermal expansion curve of GdCoO3, 10 and 15 mol% barium doped
samples
Fig. 6.10 shows the percentage linear thermal expansion of sintered GdCoO3 and barium
doped GdCoO3 in the temperature range from 200 to 1000 oC. With 10% and 15%
barium doping the average TEC value of GdCoO3 was decreased to 13 and 12.5 ×10⁻⁶
K-1

119
, respectively. With barium substitution the coefficient of thermal expansion as low as
10×10-6
K-1
is obtained in the intermediate temperature region (500-800 oC). Hence
barium substitution has some positive effect on the thermal expansion coefficient of
GdCoO3 for use in SOFC as a cathode material. The thermal expansion coefficient is not
linear from ambient to 1000 oC. There is a change in slope at around 600
oC. This change
in thermal expansion value is associated with the change in oxygen non-stoichiometry of
the material at higher temperature. This change in TEC is also reflected in the
conductivity value as will be discussed later.
6.3.6 GdCoO3-GDC composite
As mentioned earlier, GdCoO3-GDCcomposite electrode has been used in the present
study in order to have thermal expansion matching with GDC electrolyte. For the
evaluation of CTE of this composite electrode material, the powder mixture of GdCoO3
and GDC was sintered at 1200 oC In order to check the compatibility of these two
materials XRD of the sintered material was carried out. XRD pattern of the composite
sample sintered at 1200 oC is shown in Fig 6.11. The peaks corresponding to GDC are
most prominent in the XRD pattern. The peaks corresponding to the GdCoO3 apparently
does not appear in the pattern. However, some additional peaks of low intensity appear in
the pattern. It is observed that that there is no shift in the peak positions corresponding to
GDC. This suggests that GDC has apparently not reacted with GdCoO3. Also it was
shown earlier in Fig. 6.8 that GdCoO3 is stable on heating upto 1200 oC. Therefore,

120
suppression of GdCoO3 peaks in the XRD pattern of the composite need to be analyzed
further.
20 30 40 50 60 70
0
500
1000
1500
2000
2500
3000+ GDC peak
# GdCoO3 peak
* unknown peak
#*
+
+
+
+
+
+
*
Inte
ns
ity (
arb
itra
ry u
nit
)
2 ( in degree)
Fig. 6.11: X-ray diffraction pattern of GdCoO3 –GDC mixture sintered at 1200 oC
200 300 400 500 600 700 800
0.0
0.2
0.4
0.6
0.8
% L
ine
ar
the
rma
l e
xp
an
sio
n,
(
LT
-20
0 / L
0 )
.10
0
Temperature (oC)
Fig.6.12 Linear thermal expansion curve of GdCoO3-GDC composite sintered at 1200 oC

121
200 400 600 800 1000
0.0
0.5
1.0
1.5
2.0
% L
inear
therm
al exp
an
sio
n, (
LT
-200 / L
0 )
.100
Temperature ( oC)
GdCoO3
10GBC
15GBC
composite
Fig.6.13: Linear thermal expansion curve of Ba doped GdCoO3 and GdCoO3-GDC
composite sintered at 1200 oC
Fig. 6.12 shows the thermal expansion curve of the composite sample sintered at 1200
oC. The average value of the coefficient of thermal expansion of the composite is
calculated to be 12.9 ×10⁻⁶
K-1
in the temperature range 200-800 oC. This value is close to
the CTE of GDC electrolyte material. Fig 6.13 shows the thermal expansion curves of
gadolinium cobaltite doped with different levels of barium and compared with thermal
expansion curve of the composite (GdCoO3-GDC). TEC of barium doped samples are
lower compared to pure GdCoO3 and the composite (GdCoO3-GDC).

122
6.3.7 Electrical conductivity of GdCoO3
Fig. 6.14 shows the electrical conductivity of the sintered GdCoO3 and barium doped
GdCoO3 pellets at different temperatures in the form of Arrhenius plot. High electrical
conductivity has been observed in this material at intermediate temperatures. The
measured conductivity is about 580 S.cm-1
at 800 oC. This value is in between the
conductivity of La1-xSrxCoO3 (~1200 S.cm-1
) [218] and La1-xSrxMnO3 (~130 S.cm-1
)
[219]. This higher value of conductivity is sufficient for current collection for SOFC
cathode applications.
Fig. 6.14 Electrical conductivity of dense GdCoO3 pellet sintered at 1200 oC
There is a change in slope of the Arrhenius plot of conductivity at around 400 oC
indicating the change of conduction mechanism. The activation energies calculated from

123
the Arrhenius plot are 0.3 and 0.1 eV in the lower and higher temperature regions
respectively. Low activation energy of the order of 0.1 eV may be attributed to the Mott
type hopping conduction, i.e. small polaron hopping, between Co2+
and Co3+
. At lower
temperature range additional activated mechanism for charge disproportionation reaction
(2Co3+
→ Co2+
+ Co4+
) [220] need to be considered and hence, the activation energy is
higher. With barium doping the room temperature conductivity increases, attributed to
the formation of holes responsible for increased electrical conductivity.
.
6.3 Summary
Phase pure nanocrystalline gadolinium cobaltate (GdCoO3) powder has been synthesized
by solution polymerization method and subsequently calcining the derived precursor at
800 oC. The synthesized powder has good sinterability and could be sintered to near
theoretical density at 1200 oC. The thermal expansion coefficient of GdCoO3 remains
higher in comparison to GDC electrolyte. However, in GdCoO3–GDC composite
electrode matching CTE has been obtained. The electrical conductivity increases with
increase in temperature and conductivity above 400 S.cm-1
has been obtained at 800 oC.
The area specific resistance of the interface between composite electrode and electrolyte
material is reasonably low and the value can be further brought down through
optimization of process parameters. The results suggest that GdCoO3 is a potential
candidate material for application as SOFC cathode material.

124
Chapter 7
Evaluation of Electrode Performance by
Electrochemical Impedance
Spectroscopy (EIS)
7.1 Introduction
A significant fraction of internal resistance of a cell comes from the interfacial
polarization at the electrode-electrolyte interface. The interfacial polarisation resistance
depends on the catalytic activity of the electrode material and the length of the triple
phase boundary. The electrochemical reaction occurs at the triple phase boundary (TPB),
where the electrolyte, electrode and porosity (gas phase) co-exists. Absence of any of
these three phases leads to hindrance to this electrochemical reaction [221].
In a cathode layer oxygen is passed through the porous layer and is reduced at the
electrode-electrolyte interface as follows:
½ O2 (gas) + 2e-(cathode) O
2-(electrolyte)

125
Though this reaction is heterogeneous in nature, the catalytic reaction is quite different
from the normal reactions. The elementary reaction at the TPB is shown schematically in
Fig. 7.1. At the TPB, any scarcity of reactants or accumulation of reaction products may
lead to decrease in the rate of electrochemical reaction (concentration polarization). For
these reasons, microstructure and composition play an important role in determining the
reaction rate.
To increase this TPB two approaches are adopted. First, a mixed ionic and electronic
material is used where mobility of both ions and electrons takes place in the single phase
electrode. So the oxygen reduction reaction can also occur at the cathode surface away
from the electrolyte. In the second approach a composite electrode comprising of cathode
material and electrolyte material in definite proportion is used. The reaction sites for the
electrochemical reduction of the oxygen are enhanced with this porous composite
electrode where electrical conductivity of the cathode and ionic conductivity of the
electrolyte contributes in extending the reaction zone in contrast to a pure electronically
conducting material.
Many authors pursued a composite electrode (mixture of electrode and electrolyte in
definite ratio) approach to decrease this polarization resistance [222-225]. Several others
have gone for a mixed ionic and electronic conductor (MIEC) to improve the
performance [226-228]. In an electrode layer both composition and microstructure can be
tailored for better result.

126
Fig.7.1: Schematics of triple phase boundary area (TPB)
Fig.7.2: Schematics of the oxygen reduction reaction paths at cathode
The elementary reactions at the cathode consist of few surface reactions and bulk
phenomena. The diatomic molecule (O2) under goes several intermediate steps in the
oxygen reduction reaction. These reactions are limited to the TPB and nearby area
[229,230]. There are three elementary reactions at the cathode and these are [231,232] (a)
Adsorption of oxygen molecule on the cathode surface, dissociation of oxygen molecule
on the cathode surface, dissociation into anions and incorporation into the bulk of the
cathode, (b) Transport of the anion towards the electrolyte through the cathode, and (c)

127
Transfer of anion from cathode to electrolyte. Though there are three primary reaction
paths, several steps may be rate limiting for the oxygen reduction reaction. Since the
cathodic polarization resistance is the biggest contributor for the cell resistance,
optimization of cathode catalytic property will govern the overall performance. The
cathodic reaction path for perovskite type cathode material is explained by Fleig [233].
The three possible paths for oxygen transport namely cathode surface path, the bulk path
and the electrolyte surface path are shown in Fig. 7.2. These three paths correspond to an
electronic conductor, an MIEC conductor and a composite electrode. Reaction at the
cathode may take place through any route or combination of all the three. However the
actual reaction path depends on temperature, oxygen partial pressure at that point and
microstructure. Therefore, it is difficult to predict the exact rate limiting steps in the
oxygen reduction reaction. However, doing experiments at various oxygen partial
pressures, with well defined microstructure gives an insight of the actual reaction path
ways and limiting steps. In the present chapter, doped GdCoO3, a mixed ionic and
electronic conductor has been used as cathode material and composite electrode approach
has been adopted to decrease the polarization resistance.
In the composite cathode the electron transfer reactions is shown in Fig. 7.3. Oxygen
reduction reaction takes place whole over the MIEC cathode and addition of electrolyte
layer extends the TPB length. Hence better ASR is observed.

128
Fig. 7.3: Electrochemical reactions in a composite cathode
Nickel is a promising material for a SOFC anode because of its higher catalytic activity
for hydrogen oxidation reaction and dehydrogenation of hydrocarbons. Current research
on SOFC anode deals with development of anode material capable of operating on
natural gas, without carbon deposition resulting from catalytic cracking. Ceria based
anodes have potential to suppress carbon deposition at anode while operating with natural
gas [234-236]. For avoiding the sintering of the anode material it has been used along
with the electrolyte material (GDC). However, the amount of electrolyte has to be
optimised in the anode composition. With electrolyte addition the resistance of the anode
material increases. Again, the higher mobility of lattice oxygen and higher concentration
of vacancies in the doped ceria system increases the catalytic surface (TPB) from the
interface to whole surface of the mixed conductor [237]. The catalytic properties at the
anode side are measured by AC impedance spectroscopy and the reaction rate has been
analyzed by from the impedance graph. In the present chapter symmetric cells has been
fabricated using this anode material and characterized by impedance spectroscopy.

129
7.2 Experimental
7.2.1 Cathode symmetric cell fabrication
Symmetric cells were prepared by depositing the electrode materials on dense GDC
electrolyte. Dense GDC discs of 12 mm diameter × 2 mm thick were prepared by die
pressing fine GDC powder in a uniaxial die followed by sintering at 1250 oC. Fine GDC
powder synthesized by combustion method was used for this purpose. The final
dimensions of the sintered pellets were ~1.5 mm in thickness and ~11mm in diameter.
Slurry of the electrode materials was prepared in terpineol medium using ethyl cellulose
as binder. Slurries of the cathode materials were prepared by mixing the power with
terpinol (in weight ratio 1:1) in a ball mill for more than 24 hours for better mixing and
homogenization. In some cases graphite pore former (10 wt %) was added in the slurry
during the ball milling stage for developing porosity in the sintered body. Different
cathode compositions which have been prepared are listed in Table 7.1.
The symmetric cells were prepared by brush painting the cathode slurry on both the
parallel faces of the GDC electrolyte material. Care was taken to ensure that the cathode
layers on both the sides are not in contact with each other. After application of cathodes
on both the sides of the GDC electrolyte discs the samples were fired at 1100 °C to form
symmetric cell. In some experiments an electrolyte slurry prepared in the similar manner
in terpinol medium was applied over the dense electrolyte layer prior to the cathode
coating.
Table 7.1: Different cathode compositions used for making symmetric cells

130
Cathode
material code
Cathode material composition
GC pure GdCoO3
GB10C Gd1-xBaxCoO3-δ (x = 0.1)
GB15C Gd1-xBaxCoO3-δ (x = 0.15)
GC-GDC GdCoO3-GDC composite powder
GB10C-GDC Gd1-xBaxCoO3-δ –GDC composite; x = 0.1
GC-GDC-G GC-GDC with 10% graphite pore former
GB10C-GDC-G GB10C-GDC with 10% graphite pore former
GB15C-GDC-G GB15C-GDC with 10% graphite pore former
7.2.2 Anode symmetric cell fabrication
For characterization of NiO-GDC anode material, symmetric cells have been prepared
with GDC electrolyte material. NiO and GDC in weight ratio 1:1 was ball milled in
ethanol medium for intimate mixing. Organic slurry of the electrolyte material (GDC)
was prepared in terpinol medium. NiO-GDC powder was pre-compacted in a pellet form
at 65MPa pressure using a uniaxial die. Keeping the pellet inside the die, electrolyte
slurry was applied through a brush over the anode pellet. After drying of the electrolyte
layer, NiO-GDC powder was filled in the same die and pressed at 150 MPa pressure.
This resulted in a thin layer of electrolyte sandwiched between two thick anode layers.
The whole symmetric cell was co-pressed at 1250 oC. This type of symmetric cell

131
fabrication has been adopted to simulate the condition of a co-pressed and co- sintered
anode supported cell where electrolyte and anode are co-pressed and sintered together.
The symmetric cells prepared as mentioned above were mounted in a Probostat®
(Norweigian Electro Ceramics AS, Norway) sample holder using spring load. Both sides
of the symmetric cells were connected through platinum electrodes using platinum mesh.
Impedance measurements of the symmetrical cells were carried out in the temperature
range from 700 to 900 oC. A Solartron 1260 frequency response analyzer was used for
the impedance measurement in the frequency range 105 to 0.1 Hz. The applied ac voltage
amplitude was set at 30 mV. Cathode symmetric cell measurements were done in flowing
air atmosphere where as anode symmetric cells were tested under humidified hydrogen
atmosphere. The area specific resistance (ASR) for interfacial polarisation, Rp, was
evaluated from the complex impedance plots using Z-view software. The micrographs of
the fractured surfaces of the symmetric cells were taken using scanning electron
microscope.
7.3 Results and Discussion
As mentioned above, GdCoO3 based electrodes have been integrated with GDC
electrolyte by various approaches. The performance of electrodes has been evaluated by
electrochemical impedance spectroscopy. The complex impedance plots have been
normalized for unit cell constant in order to compare the performances of electrodes. The
results have been discussed in correlation with microstructure of the electrode-electrolyte
interface.

132
7.3.1 Symmetric cells formed using pure and Ba-doped GdCoO3
Fig.7.3 shows the complex impedance plots of symmetric cells formed using GC and
GB10C at different temperatures. The ASR values obtained at different temperatures are
given in Table 7.2. It has been observed that the ASR value decreases with increase in
temperature. This is due to increase in catalytic activity of the cathode materials with
increase in temperature. Although this trend is very clear in case of GB10C electrode, the
variation of ASR with temperature has been found to be abrupt. There is a large
difference in the thermal expansion coefficient of pure GdCoO3 and GDC electrolyte
material. This is likely to result in delamination at the interface during heating and
cooling. Fig. 7.4 shows the SEM micrographs of the electrode-electrolyte interfaces of
the symmetric cells formed using GC and GB10C electrode. Delamination at the
interface is clearly visible in the microstructures. Therefore, the contact between the
electrode and electrolyte may change in a non-predictive manner depending on applied
spring load of the sample and temperature.
At 900 oC, ASR values are as high as 6 and 3 ohm.cm
2 for GC and GB10C, respectively.
These values are too high for practical applications. Small contact area due to separation
of cathode layer at the interface is primarily responsible for the high values of ASR.

133
0 5 10 15
0
2
4
6
8
GC
-Z''(
.cm
2)
Z'(.cm2)
750 oC
800 oC
850 oC
900 oC
0 5 10 15 20 25 30
0
5
10
15
GB10C
-Z''(
.cm
2)
Z'(.cm2)
750 oC
800 oC
850 oC
900 oC
Fig 7.3 Complex impedance plots of symmetric cells of GC and GB10C.
Table 7.2: ASR values of symmetric cells of GC and GB10C at different temperatures
Temperature
(oC)
ASR of symmetric cells
(Ω.cm2)
GC electrode GB10C electrode
750 16 27
800 14 16
850 12.5 8
900 6 3

134
Fig. 7.4: SEM micrographs showing the electrode-electrolyte interfaces. (a) GC electrode
(b) GB10C electrode

135
7.3.2 Effect of electrolyte interlayer on ASR value
In the previous section it has been observed that thermal expansion plays an important
role in determining the interfacial microstructure and the ASR value. The triple phase
boundary area can be improved through better adherence of electrode material to the
electrolyte. With this objective a very thin layer of electrolyte was deposited over the
dense electrolyte pellet. After drying of this interlayer, cathode layer was applied. As the
electrolyte interlayer and the cathode layer were sintered at a temperature lower than the
sintering temperature of the electrolyte material, porosity was expected in the interlayer.
However, due to very thin layer the increase in the cell resistance is not expected to be
significant. The variation of ASR value with temperature for two cathode compositions,
GC and GB10C with an interlayer of porous thin electrolyte layer is shown in Fig 7.5. It
has been observed that with addition of inter layer of GDC, the ASR value of GC cathode
decreases from 6 to 3 ohm.cm2 at 900
oC and from12 to 7 ohm.cm
-1 at 800
oC. Similarly,
for GB10C cathode the ASR value decreases from 4 to 2 ohm.cm2 at 900
oC and from 16
to 7 ohm.cm2 at 800
oC.
SEM micrographs of the two sample interfaces are shown in Fig. 7.6. Porous interlayer
of GDC is clearly seen from both the micrographs. However, an overall decrease in
porosity is observed for the cathode layer. Both interlayer and the cathode layer are
sintered at 1150 oC for sticking of porous electrolyte layer with the sintered electrolyte
layer. Though there were some improvements in the ASR value with interlayer addition,
it was not sufficient for appreciable decrease in the polarization resistance.

136
0 4 8 12 16 20 24 28
0
5
10
15
a
-Z''(
.cm
2)
Z'(.cm2)
750 oC
800 oC
850 oC
900 oC
0 1 2 3 4 5 6 7 8 9 10 11
0
1
2
3
4
5
6
b
-Z''(
.cm
2)
Z'(.cm2)
750 oC
800 oC
850 oC
900 oC
Fig 7.5 Complex impedance plots of symmetric cells formed using electrolyte
interlayer (a) GC (b) GB10C

137
Fig. 7.6 SEM micrographs showing the electrode-electrolyte interfaces of symmetric cell
formed using GDC interlayer. (a) GC electrode (b) GB 10C electrode
7. 3.3 Symmetric cells using composite electrode
As discussed in previous chapter, mismatch in thermal expansion coefficient can be
circumvented to a large extent by composite electrode approach. In composite electrode a
mixture of cathode and electrolyte is used as cathode layer for improving the catalytic
surface. In the present investigation a mixture of cathode material and electrolyte material

138
was taken in the weight ratio 1:1. Fig. 7.7 shows the impedance plots of symmetric cells
formed using composite electrodes
0 2 4 6 8
0
1
2
3
4
GC-GDC-Z
''(
. cm
2)
Z'( .cm2)
750
800
850
900
0.0 0.5 1.0 1.5 2.0
0.0
0.5
1.0
GB10C-GDC
-Z''(
.cm
2)
Z'(.cm2)
800 oC
900 oC
Fig. 7.7: Complex impedance plots of symmetric cells formed using composite
electrodes
The ASR values for the composite cathode using pure GdCoO3 were 4.2 and 1.0
ohm.cm2 at 800 and 900
oC, respectively. The ASR value of 10mol% barium doped
composite cathode samples are 1.9 and 0.6 ohm.cm2 at 800 and 900
oC, respectively.
These lower values of ASR can be attributed to the extension of triple phase boundary in

139
the composite electrode. There are two distinct advantages of the composite cathode, one
is the enhancement of the catalytic property by way of increasing the TPB length and the
other is the matching of thermal expansion coefficient with the electrolyte material.
Fig. 7.8 SEM micrographs showing the electrode-electrolyte interfaces of symmetric cell
formed using composite electrode (a) GC-GDC electrode (b) G10BC -GDC electrode
The scanning electron micrographs of the symmetric cells with composite cathode using
GdCoO3 and Ba doped (10 mol %) GdCoO3 are shown in Fig. 7.8. At the interface, good

140
adherence of the cathode and the electrolyte is observed with fine porosity and
interconnected porosity extending to the whole cathode layer. This increased porosity
also helps in increasing the triple phase boundary area. In a composite cathode, both
materials have different shrinkage kinetics, hence uniform porosity is developed over the
entire area and better TPB is achieved.
7.3.4 Effect of pore former on interfacial polarization
As observed in the micrographs of composite electrodes pore structure develops in the
electrode without addition of pore former. Porosity in the electrode can be further
improved with addition of pore former. Very high amount of porosity leads to decrease in
the conductivity value. In the present study graphite (10 wt.%) has been used as pore
former during the slurry preparation stage. Fig. 7.9 shows the complex impedance plots
for composite cathode powders mixed with 10 wt.% graphite pore former. ASR values
for GC-GDC-G, GB10C-GDC-G and GB15C-GDC-G at 850 oC are 0.5, 0.3 and 0.3
ohm.cm2, respectively. It has been observed that with barium substitution the ASR value
decreases. However for GB10C-GDC-G and GB15C-GDC-G samples, there is no
appreciable change in the ASR value. At 900 oC the ASR value for GB10C-GDC-G
sample is as low as 0.09 ohm.cm2. The SEM micrographs of the three symmetric cells
after experiment are shown in Figure 7.10. From the micrograph it is clear that fine
cathode particles are well distributed in the network of bigger electrolyte particles and
there is continuity in the cathode network. Combinations of large and fine pores are
observed in the microstructure. The larger pores are developed due to graphite burn out

141
during firing and the finer pores are developed inherently in the composite cathode. For a
particular porosity level, well distributed fine pores are expected to provide higher TPB
area in the electrode structure. Cathode polarization resistance lower than 0.1ohm.cm2,
makes Ba-doped GdCoO3 as a candidate SOFC cathode material.
Table 7.3 ASR values of symmetric cells of GC and GB10C at different temperatures
Temperature
(oC)
ASR of symmetric cells
(Ω.cm2)
GC-GDC-G
electrode
GB10C-GDC-G
electrode
GB15C-GDC-G
electrode
800 1.0 0.7 0.8
850 0.5 0.3 0.3
900 0.25 0.09 --

142
0.0 0.5 1.0 1.5 2.0 2.5 3.0
0.0
0.5
1.0
1.5
GC-GDC-G
Z''(
.cm
2)
Z'(.cm2)
750
800
850
900
0.0 0.5 1.0 1.5 2.0 2.5
0.0
0.5
1.0
1.5
2.0
GB10C-GDC-G
-Z"(
.cm
2)
Z'(.cm2)
750 oC
800 oC
850 oC
900 oC
0.0 0.5 1.0 1.5 2.0 2.5
0.0
0.5
1.0
1.5
2.0
GB15C-GDC-G
-Z"(
cm
2)
Z'(cm2)
750 oC
800 oC
850 oC
Fig. 7.9 Complex impedance plots of symmetric cells formed using composite electrodes.

143
Fig. 7.10 SEM micrographs showing electrode-electrolyte interfaces of symmetric cells
of (a) GC-GDC-G electrode (b) GB10C-GDC-G electrode (c) GB15C-GDC-G electrode

144
7.3.5 Characterization of anode symmetric cell
Anode material comprising of NiO-GDC composite (1:1 weight ratio) was ball milled
vigorously prior to use as SOFC anode material. Here, thin electrolyte layer was
developed between two thick anode layers for symmetric cell measurement. As anode
supported single cells will be fabricated for cell testing, this approach was adopted for
developing thin electrolyte based symmetric cells, instead of conventional thick
electrolyte supported symmetric cells. Impedance measurements were carried out in
hydrogen environment to ensure the anode environment of a fuel cell. The variation in
the area specific resistance with temperature is shown in Fig 7.11. ASR value as low as
0.06ohm.cm2 was obtained at 600
oC and 0.048ohm.cm
2 at 800
oC. This very low value
of ASR is helpful for good cell performance.
0.00 0.05 0.10 0.15 0.20
0.0
0.1
0.2
0.3
0.4
ASR Measured in H2 environment
-Z'' (
oh
m)
z'(ohm)
700 0C
650 0C
600 0C
Fig.7.11 Variation of ASR with temperature for NiO-GDC/GDC symmetric cell

145
The SEM micrograph of the symmetric cell after the experiment is shown in Fig 7.12.
This shows a dense electrolyte and a porous anode layer. Since the surface nickel
particles are oxidised to NiO, there seems a decrease in porosity in the anode layer.
However, 17% porosity is developed by the reduction of NiO to Ni, as per simple
mathematics. Long term study will be carried out on to evaluate the performance of the
anode layer with aging.
Fig: 7.12 SEM micrograph NiO-GDC/GDC symmetric cell
7.4 Summary
Thermal expansion of GdCoO3 and Ba doped GdCoO3 are higher compared to GDC
electrolyte material. Hence separation of cathode layer takes place in the fabrication stage

146
of the symmetric cell using these materials alone. With addition of an interlayer of thin
electrolyte layer between the cathode and electrolyte layer improves the ASR value
compared to the pure cathode material and gives adherence of cathode to the electrolyte.
However, the ASR value of pure cathode material and cathode layer with inter layer of
electrolyte are in the higher side for practical applications. When a composite of cathode
and electrolyte material is used in the symmetric cell, a huge decrease in the ASR value is
observed. With the addition of electrolyte to the cathode composition both catalytic
property and thermal expansion co-efficient is improved. Addition of pore former in the
cathode slurry initiates large pores for better transport of reactants to the reaction site. For
the NiO-GDC/GDC symmetric cells, thin layer of electrolyte offers very low value of
polarization resistance. With respect to the total cell resistance, the contribution of anode
is negligible. Long term study on the performance anode layer should be carried out to
evaluate the ageing effect.

147
Chapter 8
Fabrication and characterization of
single cells
8.1 Introduction
SOFC single cells can be fabricated in various configurations. The two basic
configurations that have been widely used are tubular and planar. In each of these
configurations, the cell can be anode supported, cathode supported or electrolyte
supported. Anode supported planar SOFC has been widely documented in literature [238-
241]. Higher power density is normally reported in anode supported planar design mainly
due to lower internal resistance of the cell and better current collection. In anode
supported planar configuration co-firing has been reported to be an economic route to
integrate electrolyte and electrode. The interface formed by this route is reported to have
reasonably low polarization resistance [239,241,242]. In general, co-firing approach is
not suitable for fabricating cathode supported SOFC. The co-firing temperature is
primarily decided by the sintering temperature of the electrolyte material. As reported in
Chapter 3, GDC electrolyte prepared using combustion synthesized nano-powders could
be sintered to its near theoretical density at 1250 oC. However, at this temperature the

148
chemical compatibility between cobaltite cathode and GDC electrolyte materials remains
very poor [Ref. Chapter 6]. The chemical compatibility of NiO (precursor of Ni) and
GDC at the sintering temperature is proven through the innumerable works published in
the literature. Therefore, it is more practicable to fabricate a single cell by initially
integrating NiO-GDC anode support with electrolyte by co-firing followed by forming
the cathode layer by firing at a lower temperature.
Various ceramic processing techniques can be adopted to fabricate anode supported
single cell. The anode support has been fabricated by different techniques, such as, doctor
blade tape casting, pressing, coat mixing, gel casting and vacuum slip casting [240-247].
As a significant part of internal resistance of a cell comes from the electrolyte resistance,
it is desirable to have a thin and impervious electrolyte layer in order to improve the
performance of the cell. Fabrication of thin electrolyte film over electrode support can be
achieved by various processes, namely, magnetron sputtering, screen printing, wet
powder spraying, dip coating, plasma spraying, physical vapor deposition etc. [240,246-
248]. Fabrication of both anode support and thin electrolyte layer by doctor blade co-
casting has been reported in literature [249-253]. The electrolyte thickness in the half
cells formed by this route typically remains in the range of 20 to 50 µm. Although the
internal resistance of a cell increases with electrolyte thickness it has been reported that
redox stability of the cell increases with increase in electrolyte thickness. Therefore,
doctor blade co-casting route can be an attractive and economically viable approach in
fabricating planar cell. In the present work anode supported half cells have been
fabricated by two different approaches. In the first approach the anode support has been

149
fabricated by uniaxial pressing and the electrolyte layer has been integrated by brush
painting using terpinol based slurry followed by co-firing. In the second approach doctor
blade co-casting method has been adopted to fabricate anode supported half cell. The
cathode layer has been formed over the dense GDC electrolyte layer by screen printing.
Finally, the cells have been tested for their performance.
8.2 Experimental
8.2.1. Starting materials
NiO and 12 mol% GDC nano-powders both prepared by gel combustion route have been
mixed in 1:1 weight ratio and used for fabrication of anode support. The gel combustion
synthesized GDC powder has been used for making the electrolyte layer. Barium doped
gadolinium cabaltite (GBC10) powder of composition Gd0.9Ba0.1CoO3-δ prepared by
solution polymerization method has been used as the cathode material.
8.2.2 Fabrication of anode supported half cell by uniaxial pressing
Anode composition was prepared by mixing NiO and GDC powders in weight ratio 1:1
through wet ball milling using stabilised zirconia balls, ethyl alcohol solvent and 1%
polyvinyl butyral binder. The powder mixture was dried under an IR-lamp. The dry
powder mixture was compacted uniaxially in a hydraulic press at 120 MPa pressure to get

150
NiO-GDC disc of 25 mm diameter × 2 mm thick (approximately). The density of the
green compact was about 55% of theoretical density.
GDC ink was prepared by mixing GDC nano-powders and terpinol (solvent) in a Spex(®)
mill. A thin layer of GDC ink was applied on one side of NiO-GDC substrate by brush
painting. After drying of the electrolyte slurry, the bi-layer was co-sintered at 1350 oC.
8.2.3 Fabrication of anode supported half cell by co-casting
8.2.3.1 Preparation of NiO-GDC slurry for tape casting
The tape casting slurry primarily consists of powder, solvent, dispersant, binder and
plasticizer. For the preparation of anode slurry for tape casting, NiO and GDC powders
were taken in 1:1 weight ratio. The slurry composition was optimised based on
preliminary experiments. The formulation used in the preparation of the slurry in the
present study is given in Table 8.1. Initially powders, solvent and dispersant were mixed
in a ball mill for 12 h. Then the slurry was mixed with binder and plasticizers in the ball
mill for 24 h for thorough mixing of all the ingredients.
8.2.3.2 Preparation of GDC slurry for tape casting
For the preparation of tape casting slurry of GDC, the powder was taken and mixed with
other ingredients with quantity as given in Table 8.1. The mixing procedure remained
same as mentioned above.

151
Table 8.1: Formulation used for the preparation of tape casting slurries
Ingredients
Quantity (wt.%)
of ingredients for
preparation of
anode slurry
Quantity (wt.%)
of ingredients for
preparation of
electrolyte slurry
Powder Powder as mentioned 59
NiO-GDC (1:1)
50.4
GDC
Dispersant Oleic acid 3.2 3.0
Solvent Ethanol 17 21
MEK 17 21
Plastisizer PEG 400 0.6 0.6
Binder PVB 90 3.2 3.0
8.2.3.3 Co-casting using doctors blade
Doctor blade co-casting approach was adopted in the fabrication of anode-electrolyte half
cell in-planar configuration. In this approach, the second layer was cast over the first cast
layer without removing it. The doctor blade tape casting machine (EPH, Engineering
Associates INC, OREM, UTAH) used in the present study for making green tapes is
shown in Fig. 8.1. The blade is moveable on a glass plate by a motor driven machine with
controlled speed. A carrier film is generally used for easy removal of the green tape.

152
Fig. 8.1: Doctors’ Blade tape casting machine
The slurry is poured in front of the doctor blade and the moving blade spreads the slurry
over the carrier film. Silicon coated mylar carrier film was used in our experiments. Tape
was cast on the side of the film that has lower wet-ability for the slurry i.e. silicon coated
surface. The speed of the blade was adjusted to 40 cm/min in all the experiments.
Thickness of the green tape was adjusted by suitably adjusting the blade gap through a
screw gauge mounted over the casting head. Different blade gaps were used to get tapes
of different thickness. It was observed that for good adhesion, the subsequent layer need
to be cast in the time period of 1 to 2 minutes. For anode supported planar cell
fabrication, tape of electrolyte was first cast on the mylar film. Thereafter, anode slurry
was cast over the electrolyte layer. Green tapes were dried for more than 24 h at ambient
temperature. Green tapes were punched to make discs of 25 mm dia.

153
8.2.3.4 Sintering of the tapes
The green bilayer tapes (in the form of circular disc of 25 mm dia.) were placed on a
dense alumina plate. A porous alumina weight was placed over the green tapes and
sintered at 1350 oC, 6 h. A heating rate of 1
oC / min. and a cooling rate 2
oC / min. were
used during sintering. About 20% shrinkage in the lateral direction was observed in most
of the cases. The final diameters of the sintered half cells were measured to be within 20
to 21 mm.
8.2.4 Integration of anode supported half cell with cathode
GBC10-GDC composite was used as a cathode functional layer. For this, GBC10 and
GDC powders were taken in 1:1 weight ratio and mixed with 5 wt.% carbon black as
pore former. A terpineol based slurry of GBC10-GDC composite powder was prepared in
a Spex mill®. The slurry was coated over dense GDC electrolyte layer of the sintered
NiO-GDC/GDC bilayer by screen printing. Over the GBC10-GDC composite layer a
terpineol based slurry of GBC10 + 5 wt.% carbon black was coated by brush painting.
The cathode layers were sintered by heating at 1100 oC, 2 h in static air.
8.2.5 Performance testing of single cells
Single button cells of 20 mm dia were taken in the experiment. The active cathode area in
these planar cells was about 2 cm2. The performance testing of the cells were carried out

154
using ProbostatTM
(NorECs, Norway) set up. The sample fixing assembly is shown in
Fig. 8.2. The cells were fixed over an alumina tube with ceramic sealant (Aremco
CeraBond 885).
Fig. 8.2: Sample fixing assembly in the Probostat unit
The sealant was baked at desired temperature as mentioned by the supplier. Platinum
mesh was used as current collector on the cathode side and nickel mesh on the anode
side. About 2 cm2
cathode area was used for current collection. On both the anode and
cathode side electrical connections were made for current lead wire and voltage lead
wire. A vertical tubular resistance heated furnace was used for maintaining the
temperatures. Humidified hydrogen gas (composition: about 97% H2 + 3% H2O) was
passed over anode side (inside alumina tube) and oxygen in the cathode side. The flow
rates of the gases were suitably adjusted by rotameter. I-V characterization of the cells
was carried out using electronic load and a nano-voltmeter. Current to voltage response
155
of the cells were recorded at 800 oC. The cell resistance (ohmic + interfacial polarization)
was measured from the linear portion of the I-V curve. After the testing of the cells, the
microstructures of the complete cells were observed in scanning electron microscope
(Seron Technology, Korea).
8.3 Results and discussion
8.3.1 On the fabrication of anode supported half cell through doctor blade tape
casting
The electrode and electrolyte thickness in the sintered half cell depend on the
corresponding thicknesses in the green co-cast tape. The thickness of a green tape can be
controlled by the blade gap (opening between the doctor blade and the cast surface).
Table 8.2 shows the variation of thickness of the tape at different blade gap adjusted.
Based on the results a blade gap of 200 µm was used for casting the electrolyte layer.
Thereafter, anode layer was cast over the green electrolyte tape using a blade gap of 800
µm.

156
Table 8.2: Variation in the thickness of the tape in drying and at sintering stage for NiO-
GDC anode and GDC electrolyte tape
Blade gap
(m)
Thickness of green tape
(m)
Thickness of the sintered
tape (µm)
Anode 200 ~70 50
400 ~160 110
800 ~450 360
Electrolyte
200 ~90 70
400 ~230 190
800 ~580 460
.
Fig. 8.3: Anode and electrolyte layer of green tape and sintered single cell
Fig. 8.3 (a-b) shows the photographs of the green bilayer tape. The NiO-GDC anode
layer appears to be green in colour and the GDC electrolyte layer is off-white in colour.
Fig. 8.3 (c) shows the photograph of a single cell obtained after co-firing the bilayer and
subsequently integrating with cathode layers.

157
A lateral shrinkage of around 20% is observed in the sintered cell. In the sintered cell the
electrolyte layer becomes transparent. Black cathode layer was applied over the
electrolyte layer leaving a 2 mm wide rim at the periphery. The cell is fixed with the
alumina tube of test assembly by applying glass sealing material along the rim of dense
electrolyte.
Fig. 8.4 shows the SEM micrograph of anode-electrolyte half cell at low magnification.
As shown in Fig. 8.4(a) the thickness of electrolyte and anode layers are about 50 µm and
400 µm, respectively. Good adherence is observed between the anode and electrolyte
layers as seen in the SEM micrograph of Fig. 8.4(b). Fig. 8.5 (a) and (b) show the SEM
micrographs of the sintered electrolyte and anode layers at higher magnification.
Impervious electrolyte layer and porous anode layer is clearly visible in the micrographs.
Fig. 8.4: SEM micrograph of anode-electrolyte half cell at low magnification; (a) 230 X,
(b) 970 X.

158
Fig. 8.5 SEM micrographs of (a) GDC electrolyte and (b) NiO-GDC anode of the
sintered bilayer
8.3.2 I-V characteristics of anode supported cell prepared by uniaxial die
pressing
The I-V characteristics of the cell prepared though die-pressing route is shown in Fig.
8.6. A maximum power density of 80 mW/cm2 was obtained at 800
oC from this cell.
The SEM micrograph of the cell after testing is shown in Fig. 8.7. Dense electrolyte of 70
– 90 µm thickness was observed in the microstructure. The non-uniformity in thickness is
due to the defects generated during uniaxial pressing. The electrolyte layer has good
adherence with both the cathode and anode layer. The lower value of power density of
this cell may be due to deficiency in current collection.

159
0 10 20 30 40 50 60
0.4
0.5
0.6
0.7
0.8
0.9
I-V
Power Density
Current (mA)
Vo
lta
ge
(V
)
0
20
40
60
80
Po
we
r De
ns
ity (m
W/c
m2)
Fig. 8.6: I-V characteristics of single cell fabricated by tape casting
Fig. 8.7: SEM micrograph of single cell fabricated by die pressing (after cell testing)
8.3.2 I-V characteristics of anode supported cell prepared by tape casting

160
The I-V characteristics of the cell prepared by doctor blade tape casting method is shown
in Figure 8.8. A maximum power density of 85 mW/cm2 was obtained from this cell.
Figure 8.9 shows the SEM micrograph of the cell after the cell testing. Dense electrolyte
of uniform thickness (~50 µm) is observed in the microstructure. The electrolyte layer
has good adherence with both the cathode and anode layer.
-20 0 20 40 60 80 100 120 140 160 180
0.2
0.4
0.6
0.8
1.0
1.2
current density(mA/cm2)
cell
voltage
(V)
0
10
20
30
40
50
60
70
80
90
100
pow
er d
ensity
(mW
/cm
2)
Fig 8.8: I-V curve of single cell fabricated by tape casting

161
Fig. 8.9: SEM micrograph of single cell fabricated by tape casting (after cell testing)
8.4 Summary
Planar anode supported single cells have been formed by uniaxial die pressing and doctor
blade co-casting method. Electrolyte thickness could be maintained in the range of 70 to
90 µm in case of pressing technique. Dense electrolyte layer of uniform thickness around
50 µm has been obtained by tape casting. Good adherence is obtained in the cells formed
by both the techniques. The cells fabricated by pressing route and co-casting route
delivered power @ 80 mW/cm2 and 85 mW/cm
2 , respectively. As per calculation, using
the data generated on electrolyte resistance and area specific interfacial polarisation
resistance, the power density is expected to be much higher than the above values. The
low power density in the present study is primarily due to the defficiency in current
collection.
162
Chapter 9
Conclusions
Based on the work in the present thesis the following broad conclusions have been
drawn.
Phase pure and nano-crystalline GDC powder can be prepared through a single
step gel combustion route using citric acid or glycine as fuel. When urea is used as
fuel it forms weak complex with metal ions leading to instability in the gel and
consequently formation of inhomogeneous precursor powder through incomplete
combustion. In this case a calcination temperature of 700 oC is required for phase
formation.
Citric acid fuel gives optimum results in terms of preparation of fine nano-
crystalline powder in narrow particle size distribution. The powders prepared
using citric acid fuel could be sintered to near theoretical density at a temperature
as low as 1200 oC. In view of this, GDC powders with different levels of gadolinia
doping have been prepared through citric acid gel combustion route.
Combustion temperature of GDC increases with gadolinia doping because of
increase of heat of combustion. Agglomerated particle size increases with increase
in gadolinia content attributed to higher reactivity of primary particle surface.
163
In gadolinia-ceria system the sintering initiation temperature decreases with
gadolinia content. Higher reactivity of primary particle surface lead to lower
insertion temperature of sintering. However the final sintering temperature
increases with gadolinia content. Because of the formation of hard agglomerates,
shrinkage occurs over wider temperature range. Nevrtheless, GDC powders with
different gadolinia content (in the range of 0 to 19%) could be sintered to near
theoretical density (> 96%) at 1250 oC.
Conductivity of GDC increases with increase in gadolinia substitution and reaches
maximum at a level of 10-12 mol% Gd2O3. Further substitution leads to decrease
in conductivity. The initial increase in conductivity with increase in gadolinia
concentration is attributed to increase in oxygen vacancy concentration. However
at higher level of gadolinia substitution vacancies get associated with dopant
cations and lead to decrease in oxygen ion conductivity. Activation energy is found
to be lowest for 10-12 mol% gadolinia doped ceria.
Fine grained microstructure is developed in GDC electrolyte material when
prepared through low temperature sintering of combustion synthesized powder.
The grain boundary conductivity increases and bulk conductivity decreases as
grain size becomes finer. At low temperature fine grained microstructure have
higher conductivity; however conductivity increases with grain size at higher
temperature region. Thus from technological point of view fine grained
microstructure is preferable for application at lower temperatures.

164
Phase pure and nano-crystalline NiO powder has been prepared through gel
combustion route and calcining at 700 oC. NiO-GDC anode prepared by mixing
combustion synthesized GDC and NiO powders followed by sintering at 1250 oC
shows porous structure in which both GDC and NiO phases are networked. Ni-GDC
cermet obtained by hydrogen reduction of NiO-GDC showed an electrical
conductivity above 1200 S.cm-1
in the operating temperature regime and is stable
over a long period. Hence, nano-structured NiO and GDC can form an anode with
good stability over a long period.
Very low interfacial polarization resistance was obtained for NiO-GDC/GDC
symmetric cells with a thin electrolyte layer. ASR value as low as 0.06 ohm.cm2 was
obtained at 800 0C. With respect to the total cell resistance, the contribution of anode
is negligible. Long study on the performance anode layer should be carried out to
evaluate the ageing effect.
Phase pure nanocrystalline gadolinium cobaltate (GdCoO3) powder has been
synthesized by solution polymerization method and subsequently calcining the
derived precursor at 800 oC. Fine powders of gadolinium cobaltite can be sintered to
near theoretical density by sintering at 1200 oC. Thermal expansion coefficient of
GdCoO3 is higher compared to GDC electrolyte material. However, using a
composite of GDC and GdCoO3, thermal expansion coefficient can be tuned to that of
the electrolyte material. The area specific resistance of the interface between
composite electrode and electrolyte material is reasonably low and the value can be

165
further brought down through optimization of process parameters. The results suggest
that GdCoO3 forms a candidate material for application as SOFC cathode material.
Thermal expansion coefficient decreases with barium doping and matching TEC has
been obtained with 10% Ba-doped gadolinium cobaltite. In the low temperature
region electrical conductivity of GdCoO3 increases significantly with barium addition.
However, conductivity at higher temperature does not change much. Conductivity
value more than 400 S.cm-1
is obtained for pure and barium doped gadolinium
cobaltite samples in the operating temperature region.
Composite electrode prepared using 10% Ba-doped gadolinium cobaltite and GDC
shows reasonably low area specific resistance (0.6 ohm.cm2 at 900
oC). Addition of
pore former further improves the electrode performance through micro modification
of the pore structure enhancing better transport of reactants to the reaction site.
Planar anode supported single cells with dense electrolyte layer of uniform thickness
around 50 µm has been obtained by doctor blade co-casting method. Cocasting of
anode and electrolyte layer followed by co-sintering of both layers was used for
fabrication of aode supported cells. Maximum power density of 85 mW/cm2 was
obtained for such type of cells. From the property measuremet of individual
components, a high value of power density is expected, however the observed low
power density in the present study is primarily due to the defficiency in current
collection.

166
Future Scope
Evaluation of oxygen ion conductivity of GDC electrolyte in reducing
environment
Long term performance evaluation of Ni-GDC anode and optimization of
microstructure through better ceramic processing.
Long term performance evaluation of Gd0.9Ba0.1CoO3 cathode and optimization
of microstructure.
Performance evaluation of single cell after sealing and current collection.

167
References
1. REN21 (2011) Renewables 2011: Global Status Report, p. 17, 18.
2. W. Vielstich, H. A. Gasteiger, A. Lamm (Editors), Hand book of fuel cells,
Fundamentals, Technology and applications, John Wally & sons Chichester,
England, 2003, ISBN 0-471-49926-9.
3. B. Debaer, PhD Thesis, University of Twente, The Netherlands.
4. W. R Grove, Phis. Mag. 14 (1839) 127.
5. A. J. Appleby, Fuel Cell Hand Book (1989) New York : Van Nostrand Reinhold
6. M. Juhl, S. Primdahl C. Manon and, M. Mogenson, J. Power Sources 61 (1996)
173.
7. M.Brown, S. Primdahl and M.Mogenson, J. Electrochem. Soc. 147 (2000) 475.
8. G.A.Tompsett, C.Finnerty, K.Kendall, T.Alston, and N.M. Sammes, J. Power
Sources 86 (2000) 376.
9. M. Dokiya, Solid State Ionics 152 (2002) 383.
10. S. P. S. Badwal, K. Foger, Ceram. Int. 22 (1996) 257.
11. J.F. Baumard, P. Abelard, Advances in Ceramics: Edited by N. Claussen, M.
Rűhle, A. Heuer, American Ceramic Society, Columbus, OH, 12 (1984) 555.
12. C.B. Choudhary, H.S. Maiti, E.C. Subbarao, in Solid Electrolytes and Their
Applications, Edited by E.C. Subbarao, Plenum Press, New York, (1980) 1.
13. R. Ran, X. Wu, C. Quan, D. Weng, Solid State Ionics 176 (2005) 965.

168
14. M. Ellouze, W. Boujelben, A. Cheikhrouhou, H. Fuess, R. Madar, J. Alloys
Compd. 352 (2003) 41.
15. F. Ishizaki, T. Yoshida, S. Sakurada, Proc. 1st Int. Symp. On Solid Oxide Fuel
Cells, The Electrochemical Society, Pennington, NJ (1989)p. 3.
16. H. L. Tuller, A. S. Nowick, J. Electrochem. Soc. 122 (1975) 255.
17. T. Takahashi, H. Iwahara, J. Appl. Electrochem. 3 (1973) 65.
18. K. Hu, C. Chen, D. Peng, G. Meng, Solid State Ionics 28 (1988) 566.
19. T. Takahashi, H. Iwahara, Y. Nagai, J. Appl. Electrochem. 2 (1972) 97.
20. M. J. Verkerk, K. Keizer , A. J. Burggraaf, J. Appl. Electrochem. 10 (1980) 81.
21. J. Miyayama, T. Nishi, H. Yanagida, J. Mater. Sci. 22 (1987) 2624.
22. T. Takahashi, T. Esaka, H. Iwahara, J. Appl. Electrochem. 7 (1977) 303.
23.L. Brixner, J. Am. Chem. Soc. 80 (1958) 3214.
24. F. K. Patterson, C. W. Moeller, R. Ward, Inorg. Chem. 2 (1963) 196.
25. F. Forrat, G. Dauge, P. Trevoux, G. Danner, M. Christen, C. R. Acad. Sci. Paris
259 (1964) 2813.
26. R. V. Coates, J. Appl. Chem. 14 (1964) 346.
27. T. Takahashi, H. Iwahara, Energy Convers. 11 (1971) 105.
28. J. A. Kilner, P. Barrow, R. J. Brook, M. J. Norgett, J. Power Sources 3 (1978) 67.
29. T. Takahashi, H. Iwahara, in Research in Effective Use of Energy, sp. publ. of the
Ministry of Education Science and Culture of Japan 3 (1982) 727.
30. A. F. Sammells, R. L. Cook, W. L. Worrell, Rep. No. GRI-YO/O136, Gas
Research Institute, Chicago, IL, (1990).

169
31. R. L. Cook, R. C. MacDuff, A. F. Sammells, J. Electrochem. Soc. 137 (1990)
3309.
32. B. C. H. Steele, A. Heinzel, Nature 414 (2001) 345.
33. F. P. F. van Berkel, F. H. van Heuveln, J. P. P. Huijsmans, Solid State Ionics 72
(1994) 240.
34. U. Anselmi-Tamburini, G. Chiodelli, M. Arimondi, F. Maglia, G. Spinolo, Z. A.
Munir, Solid State Ionics 110 (1998) 35.
35. T. H. Etsell, S. N. Flengas, Chem. Rev. 70 (1970) 339.
36. V. N. Chebotin, M. V. Perfiliev, Electrochemistry of solid electrolytes (1978)
Technical Information Center, US Department of Energy, Oak Ridge.
37. B. Dalslet, P. Blennow, P. V. Hendriksen, N. Bonanos, D. Lybye, M. Mogensen, J.
Solid State Electrochem. 10 (2006) 547.
38. E. V. Tsipis, V. V. Kharton, J. R. Frade, J. Eur. Ceram. Soc. 25 (2005) 2623.
39. J. B. Goodenough, Y-H Huang, J. Power Sources 173 (2007) 1.
40. S. Tao, J. T. S. Irvine, J. Electrochem. Soc. 151 (2004) A252.
41. J. Liu, B. Madsen, Z. Ji, S. Barnett, Electrochem. Solid State Lett 5 (2002) A122.
42. Y-H Huang, R. I. Dass, J.C. Denyszyn, J. B. Goodenough, J. Electrochem. Soc. 153
(2006) A1266.
43. N. Q. Minh, T. Takahashi (1995) Science and technology of ceramic fuel cells.
Elsevier, Amsterdam.
44. S. C. Singhal, Mater. Res. Soc. Bull. 25 (2000) 16.
45. O. Yamamoto, Electrochim. Acta 45 (2000) 2423.
46. B. C. H. Steele, J. Mater. Sci. 36 (2001) 1053.
170
47. J. P. P. Huijsmans, Curr. Opin. Solid State Mat. Sci. 5 (2001) 317.
48. S. F. Palguev, V. K. Gilderman, V. I. Zemtsov (1990) High-temperature oxide
electronic conductors for electrochemical devices. Nauka, Moscow.
49. V. V. Kharton, E. N. Naumovich, A. A. Vecher, J. Solid State Electrochem. 3
(1999) 61.
50. R. J. Gorte, AIChE J. 51 (2005) 2377.
51. F. De Bruijn, Green Chem. 7 (2005) 132.
52. K. Kendall, Int. Mater. Rev. 50 (2005) 257.
53. C. Sun, U. Stimming, J. Power Sources 171 (2007) 247.
54. S. B. Adler, Chem. Rev. 104 (2004) 4791.
55. L. Blum, W. A. Meulenberg, H. Nabielek, R. Steinberger-Wilckens, Int. J. Appl.
Ceram. Technol 2 (2005) 482.
56. V. V. Kharton, A. A. Yaremchenko, E. N. Naumovich, J. Solid State electrochem.
3 (1999) 303.
57. Y. S. Gaiduk, V. V. Kharton, E. N. Naumovich, A. V. Nikolaev, V. V.
Samokhval, Inorg. Mater. 30 (1994) 1360.
58. Y. Takeda, H. Y. Tu, H. Sakaki, S. Watanabe, N. Imanishi, O. Yamamoto, M. B.
Phillipps, N. M. Sammes, J. Electrochem. Soc. 144 (1997) 2810.
59. Y. Takeda, Y. Sakaki, T. Ichikawa, N. Imanishi, O. Yamamoto, M. Mori, T. Abe,
Solid State Ionics 72 (1994) 257.
60. S. P. Jiang, J. Solid State Electrochem. 11 (2007) 93.
61. E. Siebert, A. Hammouche, M. Kleitz, Electrochim. Acta 40 (1995) 1741.

171
62. H. Y. Lee, W. S. Cho, S. M. Oh, H-D Wiemhöfer, W. Göpel, J. Electrochem. Soc.
142 (1995) 2659.
63. K. Yasumoto, N. Mori, J. Mizusaki, H. Tagawa, M. Dokiya, J. Electrochem. Soc.
148 (2001) A105.
64. Y. Sakaki, Y. Takeda, A. Kato, N. Imanishi, O. Yamamoto, M. Hattori, M. Iio, Y.
Esaki, Solid State Ionics 118 (1999) 187.
65. T. Ishihara, T. Kudo, H. Matsuda, Y. Takita, J. Electrochem. Soc. 142 (1995)
1519.
66. H-R Rim, S-K Jeung, E. Jung, J-S Lee, Mater. Chem. Phys. 52 (1998) 54.
67. A. J. McEvoy, S. Rambert, S. Widmer (1996), In: Thorstensen, B (eds) Proc 2nd
Eur Solid Oxide Fuel Cell Forum (Oslo, May 1996). vol. 1. European SOFC
Forum, Oberrohrdorf, Switzerland, pp 599.
68. J. A. M. van Roosmalen, E. H. P. Cordfunke, Solid State Ionics 52 (1992) 303.
69. F. H. van Heuveln, H. J. M. Bouwmeester, J. Electrochem. Soc. 144 (1997) 134.
70. H. Kamata, A. Hosaka, J. Mizusaki, H. Tagawa, Solid State Ionics 106 (1998)
237.
71. V. N. Tikhonovich, V. V. Kharton, V. V. Samokhval , A. V. Kovalevsky, Solid
State Ionics 93 (1997) 95.
72. Y. Takeda, R. Kanno, M. Noda, Y. Tomida, O. Yamamoto, J. Electrochem. Soc.
134 (1987) 2656.
73. M. A. Pena, J. L. G. Fierro, Chem. Rev. 101 (2001) 1981.
74. J. Holc, D. Kuščer, M. Hrovat, S. Bernik, D. Kolar, Solid State Ionics 95 (1997)
259.

172
75. M. B. Phillipps, N. M. Sammes, O. Yamamoto, Solid State Ionics 123 (1999)
131.
76. I. P. Marozau, V. V. Kharton, A. P. Viskup, J. R. Frade, V. V. Samakhval, J.
Eur. Ceram. Soc. 26 (2006) 1371.
77. X. D. Zhou, H. U. Anderson, SOFC-IX: solid oxide fuel cells IX, Electrochemical
Society proceedings, Quebec PQ, Canada, (2005) pp 1479.
78. V. V. Kharton, A. A. Yaremchenko, A. L. Shaula, A. P. Viskup, F. M. B.
Marques, J. R. Frade, E. N. Naumovich, J. R. Casanova, I. P. Marozau, Defect
Diffus. Forum 226 (2004) 141.
79. H. L. Lein, K. Wiik, T. Grande, Solid State Ionics 177 (2006) 1795.
80. M. Søgaard, P. V. Hendriksen,M. Mogensen, J. Solid State Chem. 180 (2007)
1489
81. W. Zajac, K. Swierczek, J. Molenda, J. Power Sources 173 (2007) 675.
82. V. V. Kharton, A. A. Yaremchenko, M. V. Patrakeev, E. N. Naumovich,F. M. B.
Marques, J. Eur. Ceram. Soc. 23 (2003) 1417.
83. J. M. Ralph, C. Rossignol, R. Kumar, J. Electrochem. Soc. 150 (2003) A1518.
84. S. P. Simner, J. F. Bonnett, N. L. Canfield , K. D. Meinhardt, V. L. Sprenkle , J.
W. Stevenson, Electrochem. Solid-state Lett. 5 (2002) A173.
85. G. Coffey, J. Hardy, O. Marina, L. Pederson, P. Rieke, E. Thomsen, Solid State
Ionics 175 (2004) 73.
86. H. J.M. Bouwmeester, A. J. Burgraaf (1996) In: A. J. Burggraaf, L. Cot, (eds)
Fundamentals of inorganic membrane science and technology. Elsevier,
Amsterdam, pp 435.

173
87. M. Al Daroukh, V. V. Vashook, H. Ullmann, F. Tietz, I. Arual Raj, Solid State
Ionics 158 (2003) 141.
88. H. Ullmann, N. Trofimenko, F. Tietz, D. Stöver, A. Ahmad-Khanlou, Solid State
Ionics 138 (2000) 79.
89. G. C. Kostogloudis, C. Ftikos, A. Ahmad-Khanlou, A. Naoumidis, D. Stöver,
Solid State Ionics 134 (2000) 127.
90. J. W. Stevenson, T. R. Armstrong, R. D. Carneim, L. R. Pederson, W. J. Weber, J.
Electrochem. Soc. 143 (1996) 2722.
91. A. N. Petrov, V. A. Cherepanov, A. Yu. Zuev, J. Solid State Electrochem. 10
(2006) 517.
92. K. Huang, H. Y. Lee, J. B. Goodenough, J. Electrochem. Soc. 145 (1998) 3220.
93. Y. Takeda, H. Ueno, N. Imanishi, O. Yamamoto, N. Sammes, M. B. Phillipps,
Solid State Ionics 86 (1996) 1187.
94. H. Y. Lee, S. M. Oh, I. Y. Seo, F. Rocholl, H. D. Wiemhöfer (1997) In: U.
Stimming, S. C. Singhal, H. Tagawa, W. Lehnert (eds) SOFC V. The
Electrochemical Society, Pennington, NJ, pp 520.
95. E. N. Naumovich, V. V. Kharton, V. V. Samokhval, A. V. Kovalevsky, Solid
State Ionics 93 (1997) 95.
96. T. Ishihara, M. Honda, T. Shibayama, H. Furutani, Y. Takita, Ionics 4 (1998) 395.
97. F. Chen, C. Xia, M. Liu, Chem. Lett. 30 (2001) 1032.
98. H. Uchida, S. Arisaka, M. Watanabe, J. Electrochem. Soc. 149 (2002) A13.
99. S. Uhlenbruck, F. Tietz Mater. Sci. Eng. B 107 (2004) 277.

174
100. E. Lust, P. Möller, I. Kivi, G. Nurk, S. Kallip, J. Solid State Electrochem. 9 (2005)
882.
101. V. V. Kharton, E. V. Tsipis, A. A. Yaremchenko, I. P. Marozau, A. P. Viskup, J.
R. Frade, E. N. Naumovich, Mater. Sci. Eng. B 134 (2006) 80.
102. F. Morin, G. Trudel, Y. Denos, Solid State Ionics 96 (1997) 129.
103. S. K. Poznyak, V. V. Kharton, J. R. Frade, A. A. Yaremchenko, E. V. Tsipis, S.
O. Yakovlev, I. P. Marozau, J. Solid State Electrochem. 12 (2008) 15.
104. E. V. Tsipis, V. V. Kharton, J. R. Frade, P. Nunez, J. Solid State Electrochem. 9
(2005) 547.
105. T. Ishihara, S. Fukui, H. Nishiguchi, Y. Takita, Solid State Ionics 152 (2002) 609.
106. F. S. Baumann, J. Fleig, G. Cristiani, B. Stuhlhofer, H-U Habermeier, J. Maier, J.
Electrochem. Soc. 154 (2007) B931.
107. J. Peña-Martinez, D. Marrero-Lopez, D. Perez-Coll, J. C. Ruiz-Morales, P. Nuñez,
Electrochim Acta 52 (2007) 2950.
108. K. Huang, H. Y. Lee, J. B. Goodenough, J. Electrochem. Soc. 145 (1998) 3220.
109. K. T. Lee, A. Manthiram, J. Electrochem. Soc. 153 (2006) A794.
110. K. Yasumoto, Y. Inagaki, M. Shiono, M. Dokiya, Solid State Ionics 148 (2002)
545.
111. T. Ishihara, T. Kudo, H. Matsuda, Y. Takita, J. Electrochem. Soc. 142 (1995) 1519.
112. C. J. Zhu, X. M. Liu, D. Xu, D. T. Yan, D. Y. Wang, W. H. Su, Solid State Ionics
179 (2008) 1470.
113. W. X. Chen, T. L. Wen, H. W. Nie, R. Zheng, Mater. Res. Bull. 38 (2003) 1319.
114. G. C. Kostogloudis, G. Tsiniarakis, C. Ftikos, Solid State Ionics 135(2000) 529.

175
115. V. Dusastre, J. A. Kilner, Solid State Ionics 126 (1999) 163.
116. B. C. H. Steele, Solid State Ionics 86–88 (1996) 1223.
117. L. Kindermann, D. Dos, H. Nickel, K. Hilpert, C. C. Appel, F. W. Poulsan, J.
Electrochem. Soc. 144 (1997) 717.
118. B. C. H. Steele Solid State Ionics 129 (2000) 95.
119. X. W. Meng, S. Q. Lv, Y. Ji, W. Tao, Y. L. Zhang, J. Power Sources 183 (2008)
581.
120. Z. P. Shao, S. M. Haile, Nature 431 (2004) 170.
121. A. Y. Yan, M. J. Cheng, Y. L. Dong, W. S. Yang, V. Maragou, S. Q. Song, P.
Tsiakaras, Appl. Catal. B 66 (2006) 64.
122. R. Chiba, F. Yoshimura, Y. Sakurai, Solid State Ionics 124 (1999) 281.
123. H. Orui, K. Watanabe, R. Chiba, M. Arakawa, J. Electrochem Soc 151 (2004)
A1412.
124. A. Endo, S. Wada, C. J. Wen, H. Komiyama, K. Yamada, J. Electrochem. Soc.
145 (1998) L35
125. C. W. Tanner, K. Z. Fung, A. V. Virkar, J. Electrochem. Soc. 144 (1997) 21
126. Y. Liu, S. W. Jha, M. L. Liu, Adv. Mater. 16 (2004) 256.
127. M. Mamak, G. S. Metraux, S. Petrov, N. Coombs, G. A. Ozin, M. A. Green, J.
Am. Chem. Soc. 125 (2003) 5161.
128. Y. J. Leng, S. H. Chan, Q. L. Liu, Int. J. Hydro. Energy 33 (2008) 3808.
129. C. W. Sun, Z. Xie, C. R. Xia, H. Li, L. Q. Chen, Electrochem. Commun. 8 (2006)
833.

176
130. T. Fukui, K. Murata, S. Ohara, H. Abe, M. Naito, K. Nogi, J. Power Sources 125
(2004) 17.
131. H. Abe, K. Murata, T. Fukui, W. J. Moon, K. Kaneko, M. Naito, Thin Solid
Films 496 (2006) 49.
132. M. Antonietti, G. A. Ozin, Chem. Eur. J 10 (2004) 28.
133. T. Z. Sholklapper, H. Kurokawa, C. P. Jacobson, S. J. Visco, L. C. De Jonghe,
Nano Lett 7 (2007) 2136.
134. Y. Huang, J. M. Vohs, R. J. Gorte, J. Electrochem. Soc. 153 (2006) A951.
135. A. Barbucci, M. Viviani, M. Panizza, M. Delucchi, G. Cerisola, J. Appl.
Electrochem. 35 (2005) 399.
136. Y. J. Leng, S. H. Chan, K. A. Khor, S. P. Jiang, J. Solid State Electrochem. 10
(2006) 339.
137. G. S. Godoi, D. P. F. de Souza, Mater. Sci. Eng. B 140 (2007) 90.
138. K. Chen, Z. Lu, N. Ai, X. Chen, J. Hu, X. Huang, W. Su, J. Power Sources 167
(2007) 84.
139. J-H Kim, R-H Song, J. H. Kim, T-H Lim, Y-K Sun, D-R Shin, J. Solid State
Electrochem. 11 (2007) 1385.
140. A. Hagiwara, N. Hobara, K. Takizawa, K. Sato, H. Abe, M. Naito, Solid State
Ionics 178 (2007) 1123.
141. C. Laberty, F. Zhao, K. E. Swider-Lyons, A. V. Virkar, Electrochem. Solid State
Lett. 10 (2007) B170.
142. E. P. Murray, S. A. Barnett, Solid State Ionics 143 (2001) 265.
143. H. Zhao, L. Huo, S. Gao, J. Power Sources 125 (2004) 149.

177
144. C. Xia, W. Rauch, F. Chen, M. Liu, Solid State Ionics 149(2002) 11.
145. N. T. Hart, N. P. Brandon, M. J. Day, N. Lapena-Rey, J. Power Sources 106
(2002) 42.
146. K. Imahara, C. P. Jacobson, S. J. Visco, L. C. De Jonghe, Solid State Ionics 176
(2005) 451.
147. S. P. Jiang, Mater. Sci. Eng. A 418 (2006) 199.
148. W. Wang, M. D. Gross, J. M. Vohs, R. J. Gorte, J. Electrochem. Soc. 154 (2007)
B439.
149. N. Q. Minh, J. Am. Ceram. Soc. 76 (1993) 563.
150. N.B. Kirk, J.V. Wood, J. Mater. Sci., 30 (1995) 2171.
151. Y. Zhou, M.N. Rahman, Acta. Mater., 45 (1997) 3635.
152. S. Zha, C. Xia, G. Meng, J. Power Source, 115 (2003) 44.
153. S. Torrens, N.M. Sammes, G. A. Tompsett, Solid State Ionics, 111 (1998) 9.
154. M. Hirano, E. Kato, J. Am. Ceram. Soc., 82 (1999) 2861.
155. B. Xia, I.W. Lenggoro, Okuyama, J. Mater. Chem., 11(2001) 2925.
156. R. D. Purohit, B. P. Sharma, K. T. Pillai, A. K. Tyagi, Mater. Res. Bull., 36 (2001)
2711.
157. S.R. Jain, K.C. Adiga, V.R. Pai Venekar, Combustion Flame, 40 (1981) 71.
158. L.A. Chick, L.R. Pederson, G.D. Maupin, J.L. Bates, L.E. Thomas, G.J. Exarhos,
Mater. Lett., 10 (1990) 6.
159. H. Inaba and H. Tagawa, Solid State Ionics 83 (1996) 1.
160. S.C. Singhal and K. Kendall, High Temperature Solid Oxide Fuel Cells:
Fundamentals, Design and Applications, Elsevier, Oxford, UK, 2003, p.92.

178
161. M. Aoki, Y.-M. Chiang, I. Kosacki, L. J.-R. Lee, H. Tuller and Y. Liu, J. Am.
Ceram. Soc. 79 (1996) 1169.
162. M.J. Verkerk, B.J. Middelhuis and A.J. Burggraaf, Solid State lonics 6 (1982) 159.
163. X. Guo, Solid State Ionics 81 (1995) 235.
164. X.J. Chen, K.A. Khor, S.H. Chan and L.G. Yu, Mater. Sci. Eng. A 341 (2003) 43.
165. X.J. Chen, K.A. Khor, S.H. Chan, et al., Mater. Sci. Eng. A 374 (2004) 64.
166. S.P.S. Badwal, Solid State Ionics 52 (1992) 23.
167. S.P.S. Badwal, F.T. Ciacchi, S. Rajendran, J. Drennan, Solid State Ionics 109
(1998) 167.
168. P. Mondal, A. Klein, W. Jaegermann, H. Hahn, Solid State Ionics 118 (1999) 331.
169. X.D. Zhou, W. Huebner, I. Kosacki and H. U. Anderson, J. Am. Ceram. Soc. 85
(2002) 1757.
170. G.M. Christie and F.P.F. van Berkel, Solid State Ionics 83 (1996) 17.
171. Y.-M. Chiang, E.B. Lavik and D.A. Blom, Nanostructured Materials 9 (1997) 633.
172. T. Suzuki, I. Kosacki and H.U. Anderson, Solid State Ionics 151 (2001) 111.
173. N. Sata, K, Eberman, K. Eberl and J. Maier, Nature 408 (2000) 946.
174. I. Kosacki, H.U. Anderson, Y. Mizutani and K. Ukai, Solid State Ionics 152 (2002)
431.
175. J. Rupp and L. Gauckler, Solid State Ionics 177 (2006) 2513.
176. M.G. Bellino, D.G. Lamas, and N.E. Walsoi de Reca, Adv. Functional Materials
16 (2006) 107.
177. T. Mahata, G. Das, R. K. Mishra and B.P. Sharma, Journal of Alloys and
Compounds 391 (2005) 129.

179
178. R.K. Lenka, T. Mahata, P.K. Sinha, and B.P. Sharma, J. Am. Ceram. Soc. 89
(2006) 3871.
179. E. Barsoukov and J.R. Macdonald, Impedance Spectoscopy, Theory, Practice and
Applications, Wiley Interscience, New Jarsey, 2005.
180. J Luo, E F Hairetdinov, D P Almond and R Stevens, Solid State Ionics 122 (1999)
205.
181. J. A. Kilner, B C H Steele, in O.Toft Sorensen (Ed), Nonstoichiometric Oxides,
Academic Press, 1981, p233
182. A S Nowick, D S Park, in G Mahan, W Roth (Eds) Super Ionic Conductors, Plenum
Press, 1976, p-395
183. Hugo J Avila-Paredes, Kwanghoon Choi, Chien-Ting Chen and Sangtae Kim, J.
Mater. Chem, 19 (2009) 4837.
184. Y. J. Leng, S. H. Chan, S. P. Jiang, K. A. Khor, Solid State Ionics 170(2004) 9.
185. J. W. Kim, A. V. Virkar, K. Z. Fung, K. Mehta, S. C. Singhal, J. Electrochem. Soc.
146(1999)69.
186. Y. J. Leng, S. H. Chan, K. A. Khor, S. P. Jiang, Int. J. Hyd. Energy 29 (2004) 1025.
187. Q. L. Liu, K. A. Khor, S. H. Chan, J. Power Sources 161 (2006) 123.
188. X. S. Xin, Z. Lu, X. Q. Huang, X. Q. Sha, Y. H. Zhang, W. H. Su, J. Power Sources
159 (2006) 1158.
189. X. Y. Xu, C. G. Xia, S.G. Huang, D. K. Peng, Ceram. Int. 31 (2006) 1061.
190. Y. Y. Chen, W .C .J. Wei, Solid State Ionics 177 (2006) 351.
191. X. S. Xin, Z. L¨u, X. Q. Huang, X. Q. Sha, Y. H. Zhang, K. F. Chen, N. Ai, R. B.
Zhu, W. H. Su, J. Power Sources 160 (2006) 1221.

180
192. L. Jia, Z. L¨u, X. Q. Huang, Z. G. Liu, K. F. Chen, X. Q. Sha, G. Q. Li, W. H. Su,
J. Alloys Compd. 424 (2006) 299.
193. M. G. Chourashiya, L. D. Jadhav, Int. J. Hyd. Energy 36 (2011) 14984.
194. C. Fu, S. H. Chan, Q. Liu, X. Ge, G. Pasciakjg, Int. J. Hyd. Energy 35 ( 2010) 301.
195. A. U. Chavan, L. D. Jadhav, A. P. Jamale, S. P. Patil, C. H. Bhosale, S. R.
Bharadwaj, P. S. Patil, Ceram. Int. 38 (2012) 3191.
196. V. Gil, J. Tartaj, C. Moure, Ceram. Int. 35 (2009) 839.
197. D. Y. Han, H. Y. Yang, C. B. Shen, X. Zhou, F. H. Wang, Powder Technology 147
(2004) 113.
198. H. Mohebbi, T. Ebadzadeh, F. A. Hesari, J. Power Sources 178 (2008) 64.
199. D. Ai, X. Dai, Q. Li, C. Deng, S. Kang, China Particuology 2 (2004) 157.
200. C. Ding, T. Hashida, Int. J. Hyd. Energy 36 (2011) 5567.
201. H. Inaba and H. Tagawa, Solid State Ionics 83 (1996) 1.
202. S.J. Skinner, Int. J. Inorg. Mater. 3 (2001) 113.
203. K.C. Wincewicz, J.S. Cooper, J. Power Sources 140 (2005) 280.
204. E.V. Tsipis, V.V. Kharton, J. Solid State Electrochem. 12 (2008) 1367.
205. C. Sun, R. Hui, J. Roller, J. Solid State Electrochem. 14 (2010) 1125.
206. H. Ullmann, N. Trofimenko, F. Tiez, D. Stover, A. Ahmad-Khanlou, Solid State
Ionics 138 (2000) 79.
207. H. Uchida, S. Arisaka, M. Watanabe, J. Electrochemical Soc. 149 (2002) A13.
208. A. Weber, E. Ivers-Tiffee, J. Power Sources 127 (2004) 273.
209. C. Xia, W. Rauch, F. Chen, M. Liu, Solid State Ionics 149 (2002) 11.
210. K. Imahara, C.P. Jacobson, S.J. Visco, L.C. De Jonghe, 176 (2005) 451.

181
211. H. Zhao, L. Huo, S. Gao, J. Power Sources 125 (2004) 149.
212. A. Hagiwara, N. Hobara, K. Takizawa, K.Sato, H. Abe, M. Naito, Solid State Ionics
177 (2006) 2967.
213. M. Asamoto, H. Yamaura, H. Yahiro, J. Power Sources 196 (2011) 1136.
214. R N Das, Materials Letter 47 (2001) 344.
215. Y Takeda, H Ueno, N Imanishi, O Yamamoto, N. Sammes, M.B. Phillipps, Solid
State Ionics 86-88 (1996) 1187.
216. A.Y. Kropanev, A.N. Petrova, Inorg. Mat. 19 (1983) 1782.
217. M. Mogensen, T. Lindegaard, U.R. Hansen, G. Mogensen J. Electrochem. Soc. 141
(1994) 2122.
218. F. Tietz, I. Arul Raj, M. Zahid, D. Stover, Solid State Ionics 177 (2006) 1753.
219. T. Kenjo, M. Nashiya, Solid State Ionics 57 (1992) 295.
220. S. Li, Z. Lu, X. Huang, W. Su, Solid State Ionics 178 (2008) 1853.
221. SB Alder, Chem. Rev. 104(2004)4791.
222. T. Kawada, N Sakai, H Yokokawa, M Mori and T Iwata, J. Electrochem. Soc.
137(1990)3042.
223. T Kenjo and M Nishiya, Solid State Ionics, 57(1992)295.
224. M J L Ostergard, C Clausen, C. Bagger, and M Mogensen, Electrochim. Acta 40
(1995)1971.
225. V. Dusastre and J A Kilner, Solid State Ionics, 126 (1999) 163.
226. S. V. Moharil, B. S. Nagrare, S. P.S. Shaikh, Int. J. Hyd. Energy, 37(2012)5208.
227. Han Chen, Kui Cheng, Fei Ye, Wenjian Weng, Ceram. Int. 37(2011)1209.

182
228. C. Endler-Schuck, A. Leonide, A. Weber, S. Uhlenbruck, F. Tietz, E. Ivers-Tiffée,
J. Power Sources 196(2011)7257.
229. L Antoni, Material Sci. Forum 461-464(2004)1073.
230. E Ivers-Tiffe, A Weber, H Schichlein (2003), Handbook of fuel cells, vol 2. Wiley,
Chichester, p-587.
231. E Siebert, A Hammouche, M Kleitz, Electrochim Acta 40(1995)1741.
232. MJ Jorgensen, M Mogensen, J Electrochem. Soc. 148(2001) A433.
233. J Fleig, Annu Rev. Mat. Res. 33(2003)361.
234. M. Mogensen, B Kindl, B malmgren-Hasen, Program and abstracts of Fuel Cell
seminar(1990), phenix, AZ, Courteesy Associates, Washington (DC) (1990) p.195
235. V D Belyaev, T I Politova, O A Marina, V A Sobyanin, Appl. Catal. A Gen.
133(1995) 47.
236. A O Stormer, P Holtappels, H Y Tu, U Stimming in J Huijsmans (ed) Processing of
the fifth European Solid Oxide Fuel Cell Foruum, Lucerne, Switzerland, (2002)p.343.
237. P Holtappels, J Bradley, J T S Irvine, A Kaiser, M Mogensen, J. Electrochem. Soc.
148(2001) A923.
238. X. Jacques-Bédard, T.W. Napporn, R. Roberge, M. Meunier, J. Power Sources 153
(2006) 108.
239. Z. Wang, M. Cheng, Y. Dong, M. Zhang, H. Zhang ,J. Power Sources 156 (2006)
306.
240. H. Wang, W. Ji, L. Zhang, Y. Gong, B. Xie, Y. Jiang, Y. Song, Solid State Ionics
192 (2011) 413.
241. H. Moon, S. D. Kim, S. H. Hyun, H. S. Kim, Int. J. Hyd. Energy 33 (2008) 1758.

183
242. Jung-Hoon Song, Sun-Il Park, Jong-Ho Lee, Ho-Sung Kim, J. Mat. Processing
Technology 198 (2008) 414.
243. T. Mahata, S.R. Nair, R.K. Lenka, P.K. Sinha, Int. J. Hyd. Energy 37 (2012) 3874.
244. D Simwonis, H Thülen, F.J Dias, A Naoumidis, D Stöver, J. Mat. Processing
Technology, 92–93 (1999) 107.
245. M.E. Navarro, X.G. Capdevila, M. Morales, J.J. Roa, M. Segarra, J. Power Sources
200 (2012) 45.
246. J. Ding, J. Liu, W. Yuan, Y. Zhang, J. Eur. Ceram. Soc. 28 (2008) 3113.
247. Y. Liu, Y. Tang, J. Ding, J. Liu, Int. J. Hyd. Energy 37 (2012) 921.
248. J. Li, Z. Lü, X. Huang, Z. Liu, Z. Zhi, X. Sha, G. Li, W. Su, Ceram. Int. 33 (2007)
631.
249. S. B. Savignat, M. Chiron, C. Barthet, J. Eur. Ceram. Soc. 27 (2007) 673.
250. Z. Shen, X. Zhu, S. Le, W. S., K. Sun, Int. J. Hyd. Energy 37 (2012) 10337.
251. N.O. Shanti, D.M. Bierschenk, S.A. Barnett, K.T. Faber, J. Power Sources 212
(2012) 43.
252. Z. Wang, J. Qian, J. Cao, S. Wang, T. Wen, J. Alloys and Comp. 437 (2007) 264.
253. R E Meistler, E R Twiname, “Tape casting theory and practice”, USA, The
American Ceramic Society (2000).

184
Publications in Journals out of the present work
1. Combustion synthesis, powder characteristics and shrinkage behavior of ceria
gadolinia system, R K Lenka,T Mahata, P K Sinha and B P Sharma, J. Am.
Ceram. Soc., 89 (2006)] 3871-3873
2. Combustion synthesis of gadolinia doped ceria using glycine and urea fuels, R K
Lenka, T Mahata, A K Tyagi, and P K Sinha J. of Alloys Comp. 466(2008) 326-
329.
3. Influence of grain size on the bulk and grain boundary ionic conduction behavior in
Gadolinia doped Ceria, R.K. Lenka, T. Mahata, A.K. Tyagi and P.K. Sinha, Solid
State Ionics, 181(2010) 262-267.
4. Synthesis and characterization of GdCoO3 as a potential SOFC cathode material,
R K Lenka, P K Patro, T Mahata, P K Sinha and A K Tyagi, J. of Alloys and Comp.537
(2012) 100-105.
5. Effect of Ba on the performance of GdCoO3 cathode
R.K. Lenka, T. Mahata, A.K. Tyagi and P.K. Sinha, Solid State Ionics (communicated).
6. Characterization of Ni-GDC SOFC anode fabricated using nano-powders
R.K. Lenka, T. Mahata, A.K. Tyagi and P.K. Sinha, J. Am. Ceram. Soc.
(communicated).
Conference Presentations
1. Effect of firing temperature on the ionic conductivity in 12 mol% gadolinia doped
ceria presented at PM-08 International Conference and Exhibition held at Chennai on
20 – 21 Feb., 2008. R.K. Lenka, T. Mahata, P.K. Sinha, and B.P. Sharma

185
2. Synthesis and characterization of GdCoO3 cathode material for SOFC
application, presented at international symposium on material chemistry (ISMC08),
during 2-6 Dec 2008, at TSH, BARC, Mumbai, R K Lenka, P K patro, P K SInha and
A K Tyagi
3. Synthesis and characterization of GdCoO3 as a cathode material for solid oxide
fuel cell, presented at International Conference on Electroceramics (ICE-2009) held at
New Delhi, during Dec. 13-17, 2009, R.K. Lenka, P.K. Patro, T. Mahata, D. Prakash,
A.K. Tyagi and P.K. Sinha.
4. Nano-electro ceramics for IT-SOFC, presented at RSM-2010, held at Parle College,
during 19-20 feb 2010, R K Lenka and A K Tyagi
5. Characterization of Electrode-electrolyte interface in SOFC, presented at national
conference on “Recent Advances in Analytical Sciences and Applications” held at
Summer Hill University, Shimla, during 12-14 April 2010, R K Lenka, T Mahata, A
K Tyagi and P K Sinha.
6. Integration of NiO-GDC Composite with GDC electrolyte by Co-sintering and
Electrochemical Characterisation for SOFC Anode Application, Presented at
ISMC-10, TSH, BARC, Mumbai, during Dec 3-8, 2010, R K Lenka, T Mahata
and P K Sinha
7. Synthesis and characterization of a novel Gd0.9Ba0.1CoO3-δ SOFC cathode
material, presented at ISMC-12 held at BARC, Mumbai, during Dec. 11-15, 2012, R.K.
Lenka, T. Mahata, P.K. Sinha and A.K. Tyagi.
8. Fabrication of GDC electrolyte based SOFC cells by tape co-casting
method, presented at ISMC-12 held at BARC, Mumbai, during Dec. 11-15, 2012, R.K.
Lenka, P. K Patro, T. Mahata, P.K. Sinha and A.K. Tyagi.