Embed Size (px)
Citation preview

FOSS Populations and Ecosystems Course© The Regents of the University of CaliforniaCan be duplicated for classroom or workshop use. 1
Name __________________________
Period ____ Date ________________
○ ○ ○ ○ ○ ○ ○ ○ ○ ○ ○ ○ ○ ○ ○ ○ ○ ○ ○ ○ ○ ○ ○ ○ ○ ○ ○ ○ ○ ○ ○ ○ ○ ○ ○ ○ ○ ○ ○ ○ ○ ○ ○ ○ ○ ○ ○ ○ ○ ○ ○ ○ ○ ○ ○ ○ ○ ○ ○ ○ ○
MILKWEED-BUG OBSERVATIONS
Part 1: Milkweed bugs are insects. Observe them carefully, then answer the questions and makeaccurate illustrations of the bugs.
1. Describe in detail the structures milkweed bugs use to get from place to place.
2. Describe in detail how milkweed bugs get information about their environment.
3. Describe the milkweed bug’s mouth.
Part 2: Milkweed bugs do not all have the same markings. Observe how they are different anddraw accurate pictures of the two different patterns.
Pattern 1 Pattern 2
Back side Belly side Back side Belly side
Investigation 1: Milkweed BugsStudent Sheet

FOSS Populations and Ecosystems Course© The Regents of the University of CaliforniaCan be duplicated for classroom or workshop use. 2
Milkweed bugs, like all living things, need a supportive environment in which to live. Theenvironment that provides for all the needs of an organism is its habitat.
There are four primary components that every terrestrial organism must have in its habitatin order to survive: air, water, food, and space.
A simple plastic bag can become a suitable habitat for milkweed bugs. Follow thesedirections.
Task 1: Assemble the twig structure
Task 2: Assemble a water fountain
a. Remove the cap from a vial. Use the holepunch to make a hole near the center of thecap.
b. Roll a 10-cm square of paper towel into atight cylinder and shove it through the holeto act as a wick. The part inside the vialshould reach to the bottom of the vial.
c. Snap the cap on the vial. Use a sharpstandard pencil to carefully poke a secondhole in the vial cap. (Don’t use the holepunch—the hole will be too big.) Twist thepencil a bit as you push it through the cap.
d. Push the flexible tubing through the secondhole until the end of the tubing is on thebottom of the vial. Store the fountain in thebag.
a. Find 3–4 thin twigs 20–30 cm long.
b. Study the illustration of a finished habitat bag (intask 6). Use rubber bands to assemble the twigsinto a climbing structure.
c. Make sure the structure will fit inside a 4-literbag, is fairly flat, and will support the foodbundles and polyester wool high above the waterfountain.
d. Label the bag with the group number.
○ ○ ○ ○ ○ ○ ○ ○ ○ ○ ○ ○ ○ ○ ○ ○ ○ ○ ○ ○ ○ ○ ○ ○ ○ ○ ○ ○ ○ ○ ○ ○ ○ ○ ○ ○ ○ ○ ○ ○ ○ ○ ○ ○ ○ ○ ○ ○ ○ ○ ○ ○ ○ ○ ○ ○ ○ ○ ○ ○ ○
A HABITAT FOR MILKWEED BUGS (1 of 3)
Investigation 1: Milkweed BugsStudent Sheet
FOSS Populations and Ecosystems Course© The Regents of the University of CaliforniaCan be duplicated for classroom or workshop use. 3
○ ○ ○ ○ ○ ○ ○ ○ ○ ○ ○ ○ ○ ○ ○ ○ ○ ○ ○ ○ ○ ○ ○ ○ ○ ○ ○ ○ ○ ○ ○ ○ ○ ○ ○ ○ ○ ○ ○ ○ ○ ○ ○ ○ ○ ○ ○ ○ ○ ○ ○ ○ ○ ○ ○ ○ ○ ○ ○ ○ ○
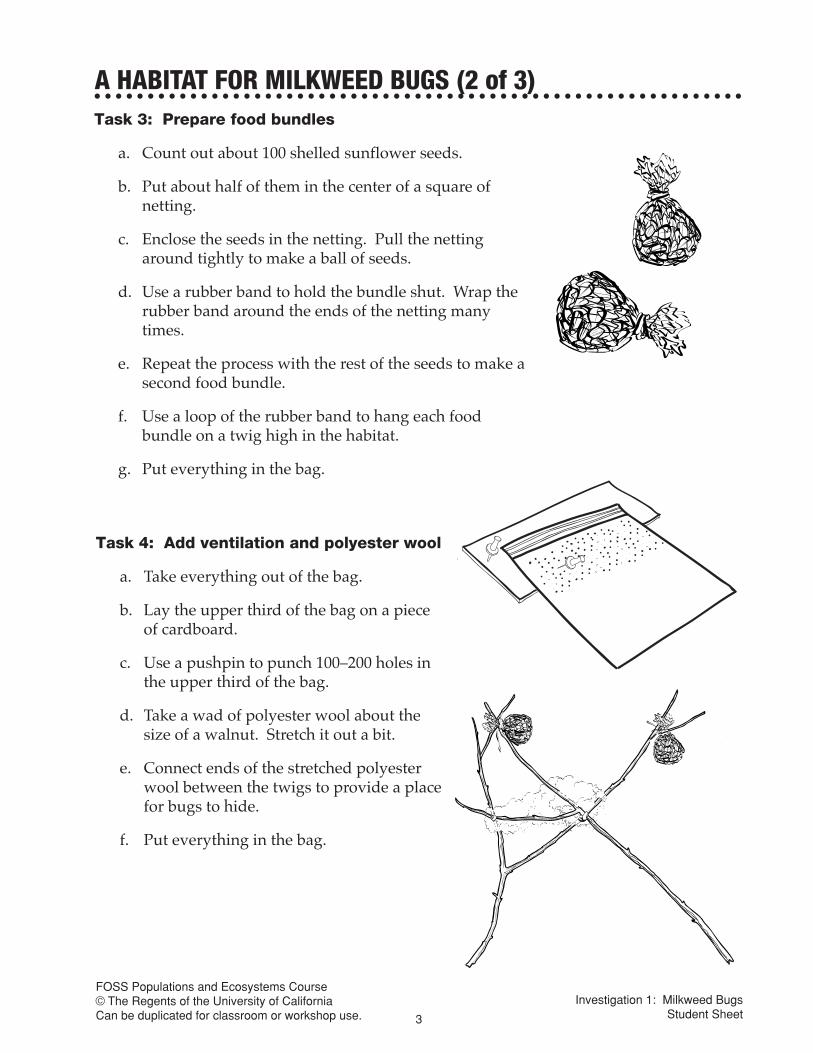
A HABITAT FOR MILKWEED BUGS (2 of 3)Task 3: Prepare food bundles
a. Count out about 100 shelled sunflower seeds.
b. Put about half of them in the center of a square ofnetting.
c. Enclose the seeds in the netting. Pull the nettingaround tightly to make a ball of seeds.
d. Use a rubber band to hold the bundle shut. Wrap therubber band around the ends of the netting manytimes.
e. Repeat the process with the rest of the seeds to make asecond food bundle.
f. Use a loop of the rubber band to hang each foodbundle on a twig high in the habitat.
g. Put everything in the bag.
Task 4: Add ventilation and polyester wool
a. Take everything out of the bag.
b. Lay the upper third of the bag on a pieceof cardboard.
c. Use a pushpin to punch 100–200 holes inthe upper third of the bag.
d. Take a wad of polyester wool about thesize of a walnut. Stretch it out a bit.
e. Connect ends of the stretched polyesterwool between the twigs to provide a placefor bugs to hide.
f. Put everything in the bag.
Investigation 1: Milkweed BugsStudent Sheet

FOSS Populations and Ecosystems Course© The Regents of the University of CaliforniaCan be duplicated for classroom or workshop use. 4
○ ○ ○ ○ ○ ○ ○ ○ ○ ○ ○ ○ ○ ○ ○ ○ ○ ○ ○ ○ ○ ○ ○ ○ ○ ○ ○ ○ ○ ○ ○ ○ ○ ○ ○ ○ ○ ○ ○ ○ ○ ○ ○ ○ ○ ○ ○ ○ ○ ○ ○ ○ ○ ○ ○ ○ ○ ○ ○ ○ ○
A HABITAT FOR MILKWEED BUGS (3 of 3)Task 5: Install the water fountain
a. Take everything out of the bag. Run thepointed dowel through the center of thebottom of the zip bag. Pull the dowel allthe way through the bag.
b. Push the water-fountain vial through thehole in the bottom of the bag from theinside. The job may be a bit of a struggle—you must stretch the plastic as you force thevial through the hole. Push hard andslowly—the plastic will yield withouttearing.
c. Rotate the vial so that the upper end of thetubing is against the inside of the bag.Make sure the end of the tubing is on thebottom of the vial.
d. Push the sharp pencil point through theside of the bag into the open end of theflexible tube.
e. Push the end of the tube through the side ofthe bag. Hold the vial in one hand and pullup on the tube to raise it severalcentimeters from the bottom of the vial.This will ensure that enough of the tubingextends outside the bag.
f. Return the twig structure with its foodbundles and wool to the bag. Zip it shut.
Task 6: Complete the habitat
a. Open a large paper clip into a C hook.
b. Find the location at the top edge of the bag(above the zip) that allows the bag to hanglevel. Use a pushpin to poke a holethrough the bag. Insert the paper-cliphook.
c. Hang the bag where your teacher hasarranged to display the habitats.
d. Use a syringe to slowly fill the waterfountain through the tube that extendsoutside the habitat bag.
Investigation 1: Milkweed BugsStudent Sheet

5

FOSS Populations and Ecosystems Course© The Regents of the University of CaliforniaCan be duplicated for classroom or workshop use. 6
Name __________________________
Period ____ Date ________________
○ ○ ○ ○ ○ ○ ○ ○ ○ ○ ○ ○ ○ ○ ○ ○ ○ ○ ○ ○ ○ ○ ○ ○ ○ ○ ○ ○ ○ ○ ○ ○ ○ ○ ○ ○ ○ ○ ○ ○ ○ ○ ○ ○ ○ ○ ○ ○ ○ ○ ○ ○ ○ ○ ○ ○ ○ ○ ○ ○ ○
MILKWEED-BUG CHANGES
Date Changes and observations
Investigation 1: Milkweed BugsStudent Sheet

FOSS Populations and Ecosystems Course© The Regents of the University of CaliforniaCan be duplicated for classroom or workshop use. 7
Name __________________________
Period ____ Date ________________
○ ○ ○ ○ ○ ○ ○ ○ ○ ○ ○ ○ ○ ○ ○ ○ ○ ○ ○ ○ ○ ○ ○ ○ ○ ○ ○ ○ ○ ○ ○ ○ ○ ○ ○ ○ ○ ○ ○ ○ ○ ○ ○ ○ ○ ○ ○ ○ ○ ○ ○ ○ ○ ○ ○ ○ ○ ○ ○ ○ ○
MILKWEED-BUG CHANGES (Continued)
Date Changes and observations
Investigation 1: Milkweed BugsStudent Sheet

FOSS Populations and Ecosystems Course© The Regents of the University of CaliforniaCan be duplicated for classroom or workshop use. 8
Name __________________________
Period ____ Date ________________
○ ○ ○ ○ ○ ○ ○ ○ ○ ○ ○ ○ ○ ○ ○ ○ ○ ○ ○ ○ ○ ○ ○ ○ ○ ○ ○ ○ ○ ○ ○ ○ ○ ○ ○ ○ ○ ○ ○ ○ ○ ○ ○ ○ ○ ○ ○ ○ ○ ○ ○ ○ ○ ○ ○ ○ ○ ○ ○ ○ ○
ECOSYSTEM GLOSSARY
Investigation 2: Sorting Out LifeStudent Sheet

FOSS Populations and Ecosystems Course© The Regents of the University of CaliforniaCan be duplicated for classroom or workshop use. 9
Name __________________________
Period ____ Date ________________
○ ○ ○ ○ ○ ○ ○ ○ ○ ○ ○ ○ ○ ○ ○ ○ ○ ○ ○ ○ ○ ○ ○ ○ ○ ○ ○ ○ ○ ○ ○ ○ ○ ○ ○ ○ ○ ○ ○ ○ ○ ○ ○ ○ ○ ○ ○ ○ ○ ○ ○ ○ ○ ○ ○ ○ ○ ○ ○ ○ ○
ECOSYSTEM GLOSSARY (Continued)
Investigation 2: Sorting Out LifeStudent Sheet

10
FOSS Populations and Ecosystems Course© The Regents of the University of CaliforniaCan be duplicated for classroom or workshop use. 11
○ ○ ○ ○ ○ ○ ○ ○ ○ ○ ○ ○ ○ ○ ○ ○ ○ ○ ○ ○ ○ ○ ○ ○ ○ ○ ○ ○ ○ ○ ○ ○ ○ ○ ○ ○ ○ ○ ○ ○ ○ ○ ○ ○ ○ ○ ○ ○ ○ ○ ○ ○ ○ ○ ○ ○ ○ ○ ○ ○ ○
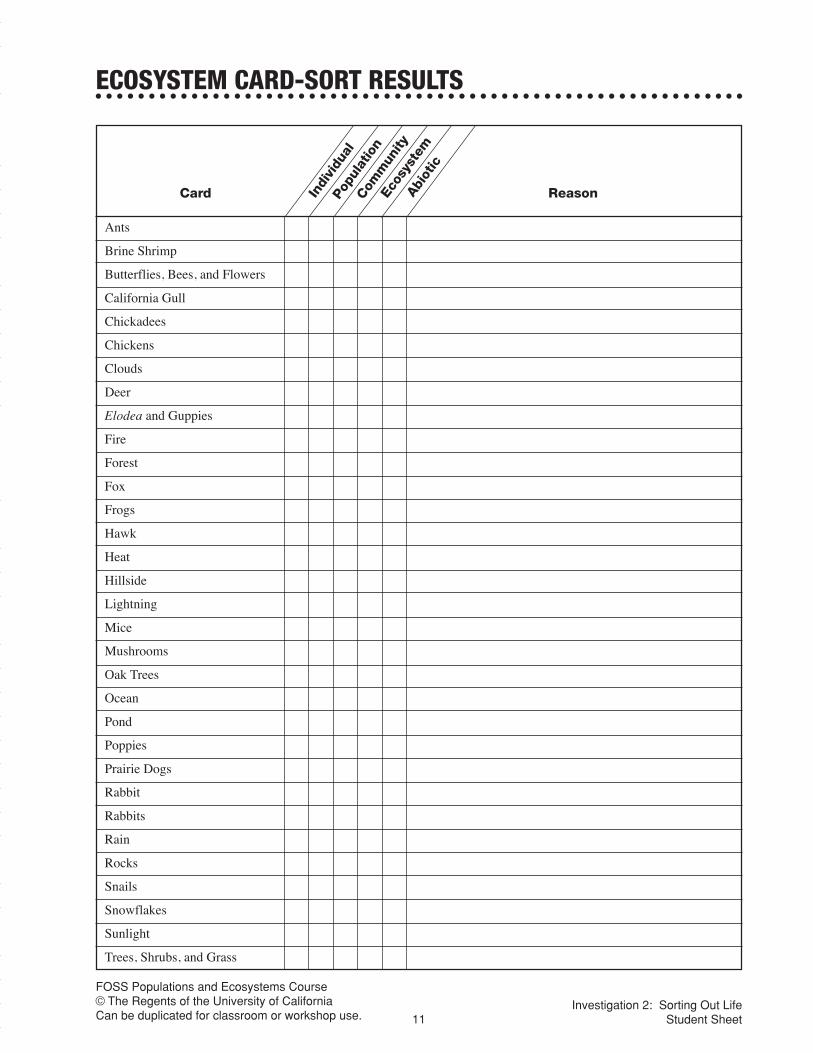
ECOSYSTEM CARD-SORT RESULTS
Indi
vidu
al
Ants
Brine Shrimp
Butterflies, Bees, and Flowers
California Gull
Chickadees
Chickens
Clouds
Deer
Elodea and Guppies
Fire
Forest
Fox
Frogs
Hawk
Heat
Hillside
Lightning
Mice
Mushrooms
Oak Trees
Ocean
Pond
Poppies
Prairie Dogs
Rabbit
Rabbits
Rain
Rocks
Snails
Snowflakes
Sunlight
Trees, Shrubs, and Grass
Card ReasonPopu
latio
nCom
mun
ityEc
osys
tem
Abio
tic
Investigation 2: Sorting Out LifeStudent Sheet

12
FOSS Populations and Ecosystems Course© The Regents of the University of CaliforniaCan be duplicated for classroom or workshop use. 13
○ ○ ○ ○ ○ ○ ○ ○ ○ ○ ○ ○ ○ ○ ○ ○ ○ ○ ○ ○ ○ ○ ○ ○ ○ ○ ○ ○ ○ ○ ○ ○ ○ ○ ○ ○ ○ ○ ○ ○ ○ ○ ○ ○ ○ ○ ○ ○ ○ ○ ○ ○ ○ ○ ○ ○ ○ ○ ○ ○ ○
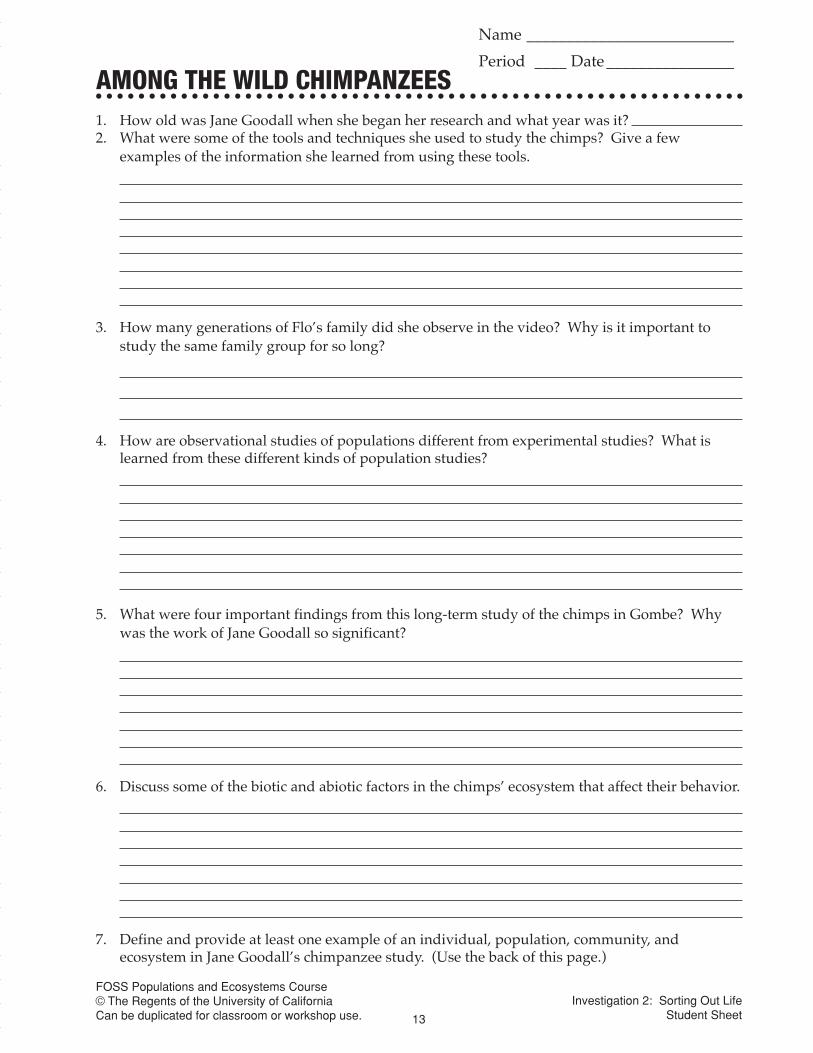
AMONG THE WILD CHIMPANZEES1. How old was Jane Goodall when she began her research and what year was it?2. What were some of the tools and techniques she used to study the chimps? Give a few
examples of the information she learned from using these tools.
3. How many generations of Flo’s family did she observe in the video? Why is it important tostudy the same family group for so long?
4. How are observational studies of populations different from experimental studies? What islearned from these different kinds of population studies?
5. What were four important findings from this long-term study of the chimps in Gombe? Whywas the work of Jane Goodall so significant?
6. Discuss some of the biotic and abiotic factors in the chimps’ ecosystem that affect their behavior.
7. Define and provide at least one example of an individual, population, community, andecosystem in Jane Goodall’s chimpanzee study. (Use the back of this page.)
Name __________________________
Period ____ Date ________________
Investigation 2: Sorting Out LifeStudent Sheet

14

FOSS Populations and Ecosystems Course© The Regents of the University of CaliforniaCan be duplicated for classroom or workshop use. 15
Part 1: After your group has studied the organisms on pages 64 to 68 in the resourcesbook, list the organisms that belong in each ecosystem.
Aquatic ecosystem Terrestrial ecosystem
_______________________________ ______________________________________________________________ ______________________________________________________________ ______________________________________________________________ ______________________________________________________________ ______________________________________________________________ ______________________________________________________________ ______________________________________________________________ ______________________________________________________________ _______________________________
Part 2: Based on the information from the resources book and other readings, make alist of the abiotic factors in the environments of the organisms in each ecosystem.
Aquatic ecosystem Terrestrial ecosystem
_______________________________ ______________________________________________________________ ______________________________________________________________ ______________________________________________________________ ______________________________________________________________ ______________________________________________________________ ______________________________________________________________ ______________________________________________________________ ______________________________________________________________ _______________________________
○ ○ ○ ○ ○ ○ ○ ○ ○ ○ ○ ○ ○ ○ ○ ○ ○ ○ ○ ○ ○ ○ ○ ○ ○ ○ ○ ○ ○ ○ ○ ○ ○ ○ ○ ○ ○ ○ ○ ○ ○ ○ ○ ○ ○ ○ ○ ○ ○ ○ ○ ○ ○ ○ ○ ○ ○ ○ ○ ○ ○
MINIECOSYSTEM NEEDS
Name __________________________
Period ____ Date ________________
Investigation 3: MiniecosystemsStudent Sheet

FOSS Populations and Ecosystems Course© The Regents of the University of CaliforniaCan be duplicated for classroom or workshop use. 16
Name __________________________
Period ____ Date ________________
Date of initial observation ___________________________________
○ ○ ○ ○ ○ ○ ○ ○ ○ ○ ○ ○ ○ ○ ○ ○ ○ ○ ○ ○ ○ ○ ○ ○ ○ ○ ○ ○ ○ ○ ○ ○ ○ ○ ○ ○ ○ ○ ○ ○ ○ ○ ○ ○ ○ ○ ○ ○ ○ ○ ○ ○ ○ ○ ○ ○ ○ ○ ○ ○ ○
AQUATIC ORGANISM OBSERVATIONS
Type oforganism
Drawing andmeasurements
Potential foodsource
Potentialpredator
Describe evidence that a population is changing.
Investigation 3: MiniecosystemsStudent Sheet

FOSS Populations and Ecosystems Course© The Regents of the University of CaliforniaCan be duplicated for classroom or workshop use. 17
Name __________________________
Period ____ Date ________________
Date of initial observation ___________________________________
○ ○ ○ ○ ○ ○ ○ ○ ○ ○ ○ ○ ○ ○ ○ ○ ○ ○ ○ ○ ○ ○ ○ ○ ○ ○ ○ ○ ○ ○ ○ ○ ○ ○ ○ ○ ○ ○ ○ ○ ○ ○ ○ ○ ○ ○ ○ ○ ○ ○ ○ ○ ○ ○ ○ ○ ○ ○ ○ ○ ○
TERRESTRIAL ORGANISM OBSERVATIONS
Type oforganism
Drawing andmeasurements
Potential foodsource
Potentialpredator
Describe evidence that a population is changing.
Investigation 3: MiniecosystemsStudent Sheet

18

FOSS Populations and Ecosystems Course© The Regents of the University of CaliforniaCan be duplicated for classroom or workshop use. 19
1. What one abiotic factor is the most important in the Mono Lake ecosystem? Why?
2. What two or three organisms are most important in the Mono Lake ecosystem?
3. What is the major issue concerning the well-being of the Mono Lake ecosystem?
4. Identify two biotic interactions that take place in the Mono Lake ecosystem.
5. Identify two examples of organisms interacting with abiotic factors in the Mono Lakeecosystem.
○ ○ ○ ○ ○ ○ ○ ○ ○ ○ ○ ○ ○ ○ ○ ○ ○ ○ ○ ○ ○ ○ ○ ○ ○ ○ ○ ○ ○ ○ ○ ○ ○ ○ ○ ○ ○ ○ ○ ○ ○ ○ ○ ○ ○ ○ ○ ○ ○ ○ ○ ○ ○ ○ ○ ○ ○ ○ ○ ○ ○
THINKING ABOUT MONO LAKE
Name __________________________
Period ____ Date ________________
Investigation 4: Mono LakeStudent Sheet

20
FOSS Populations and Ecosystems Course© The Regents of the University of CaliforniaCan be duplicated for classroom or workshop use. 21
○ ○ ○ ○ ○ ○ ○ ○ ○ ○ ○ ○ ○ ○ ○ ○ ○ ○ ○ ○ ○ ○ ○ ○ ○ ○ ○ ○ ○ ○ ○ ○ ○ ○ ○ ○ ○ ○ ○ ○ ○ ○ ○ ○ ○ ○ ○ ○ ○ ○ ○ ○ ○ ○ ○ ○ ○ ○ ○ ○ ○
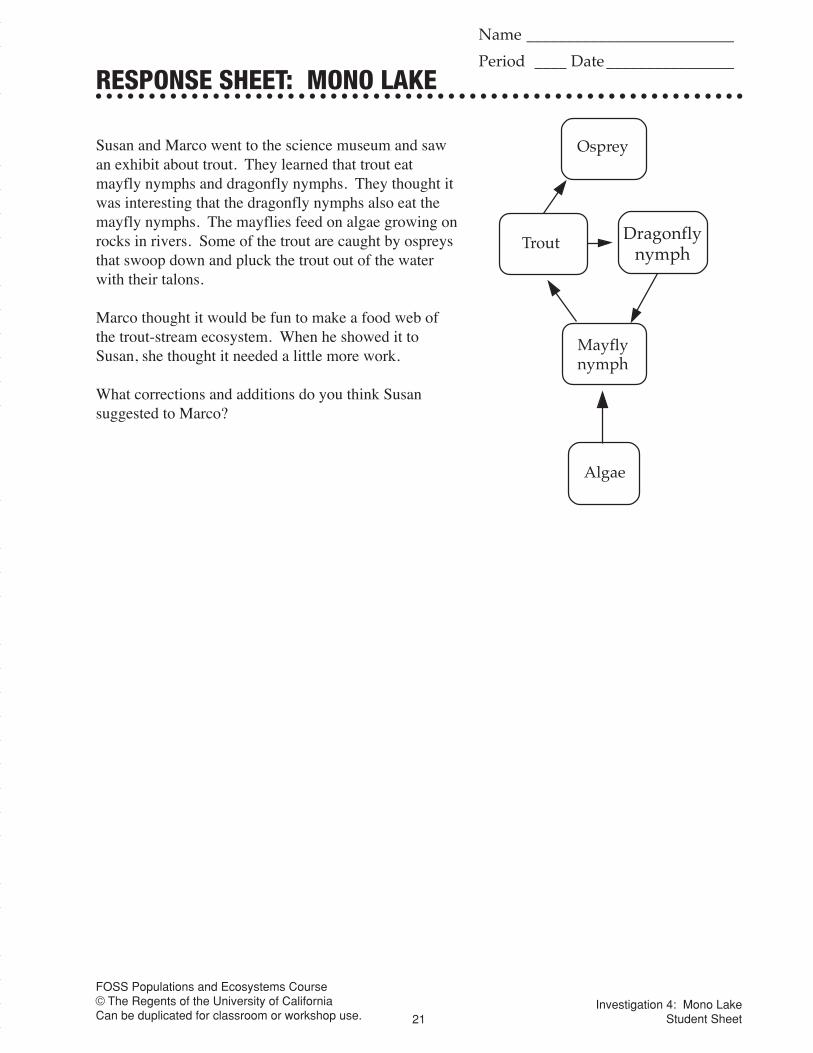
RESPONSE SHEET: MONO LAKE
Susan and Marco went to the science museum and sawan exhibit about trout. They learned that trout eatmayfly nymphs and dragonfly nymphs. They thought itwas interesting that the dragonfly nymphs also eat themayfly nymphs. The mayflies feed on algae growing onrocks in rivers. Some of the trout are caught by ospreysthat swoop down and pluck the trout out of the waterwith their talons.
Marco thought it would be fun to make a food web ofthe trout-stream ecosystem. When he showed it toSusan, she thought it needed a little more work.
What corrections and additions do you think Susansuggested to Marco?
Algae
Mayflynymph
Dragonflynymph
Trout
Osprey
Name __________________________
Period ____ Date ________________
Investigation 4: Mono LakeStudent Sheet

FOSS Populations and Ecosystems Course© The Regents of the University of CaliforniaCan be duplicated for classroom or workshop use. 22
a. Form an aluminum cup by carefullymolding the aluminum-foil squarearound a vial.
○ ○ ○ ○ ○ ○ ○ ○ ○ ○ ○ ○ ○ ○ ○ ○ ○ ○ ○ ○ ○ ○ ○ ○ ○ ○ ○ ○ ○ ○ ○ ○ ○ ○ ○ ○ ○ ○ ○ ○ ○ ○ ○ ○ ○ ○ ○ ○ ○ ○ ○ ○ ○ ○ ○ ○ ○ ○ ○ ○ ○
WATER-HEATING SETUP
Assemble this apparatus for measuring the energy in a cheese ball.
b. Squeeze the ring a bit and insert thedownward tines into the binder clip.Slide the ring down over the dowel.
c. Open the clip andclamp it all the wayonto the dowelabout 10 cm abovethe base.
d. Spread the top of thealuminum-foil cupto make a flange.Drop the cup intothe holder.
e. Slide the cheese ballon its holder underthe cup. Move theclip up or down abit until the distancebetween the cheeseball and the bottomof the cup is about1.5–2 cm.
Investigation 5: Finding the EnergyStudent Sheet
FOSS Populations and Ecosystems Course© The Regents of the University of CaliforniaCan be duplicated for classroom or workshop use. 23
Name __________________________
Period ____ Date ________________
○ ○ ○ ○ ○ ○ ○ ○ ○ ○ ○ ○ ○ ○ ○ ○ ○ ○ ○ ○ ○ ○ ○ ○ ○ ○ ○ ○ ○ ○ ○ ○ ○ ○ ○ ○ ○ ○ ○ ○ ○ ○ ○ ○ ○ ○ ○ ○ ○ ○ ○ ○ ○ ○ ○ ○ ○ ○ ○ ○ ○
MEASURING FOOD ENERGY
The snack food we burned was
Fill in the data table.
1. The unit used to measure heat energy is the calorie. One calorie (c) is the amount ofheat needed to raise the temperature of 1 ml of water 1°C. Therefore, it would take 10calories to raise the temperature of 1 ml of water 10°C. It would also take 10 calories toraise the temperature of 10 ml of water 1°C.
Calculate the number of calories your sample of snack food produced when it burned.
2. If your suggested daily intake of calories is about 2000 calories a day, how many piecesof this snack food would you have to eat each day to meet your requirement?
3. Food calories are measured in kilocalories or Calories. A food Calorie is equal to 1000calories. How many pieces of your snack food would you have to eat to get yoursuggested daily requirement of 2000 food Calories?
Volume of water
Final temperature
Starting temperature
Temperature change
Investigation 5: Finding the EnergyStudent Sheet

24

FOSS Populations and Ecosystems Course© The Regents of the University of CaliforniaCan be duplicated for classroom or workshop use. 25
Environment A 500 g 551 g
Environment B 500 g 552 g
Environment C 500 g 500 g
Environment D 500 g 549 g
Environment E 500 g 500 g
Environment F 500 g 500 g
Results. Describe the role of the five environmental factors (water, light, etc.) on plantgrowth.
Conclusions. What did you learn from the experiment about what plants need toproduce food?
Purpose. To determine if there is an increase in the mass of plants when they produce food.
Experimental design
• Five-hundred grams of bean seeds were planted in each of six planting containers filled withclean, dry sand. One gram of dry fertilizer was added to the sand in each planter.
• The six planters were placed in six identical environment chambers where water, light, and air—oxygen (O2), carbon dioxide (CO2), and nitrogen (N2)—could be controlled.
• After 3 weeks the seeds or plants were collected, dried, and weighed. The conditions and resultsof the experiment are recorded in the chart below.
○ ○ ○ ○ ○ ○ ○ ○ ○ ○ ○ ○ ○ ○ ○ ○ ○ ○ ○ ○ ○ ○ ○ ○ ○ ○ ○ ○ ○ ○ ○ ○ ○ ○ ○ ○ ○ ○ ○ ○ ○ ○ ○ ○ ○ ○ ○ ○ ○ ○ ○ ○ ○ ○ ○ ○ ○ ○ ○ ○ ○
FOOD-PRODUCERS EXPERIMENT
Water Light O2 CO2 N2
Yes
Yes
Yes
Yes
Yes
Yes
Yes
Yes
Yes
Yes
No
Yes
Yes
No
NoYes
NoYes
Yes
Yes
Yes
Yes
Yes
Yes
Yes
No Yes Yes Yes Yes
Startingmass
Endingmass
Masschange
Investigation 5: Finding the EnergyStudent Sheet
Name __________________________
Period ____ Date________________
Conditions Data

26
FOSS Populations and Ecosystems Course© The Regents of the University of CaliforniaCan be duplicated for classroom or workshop use. 27
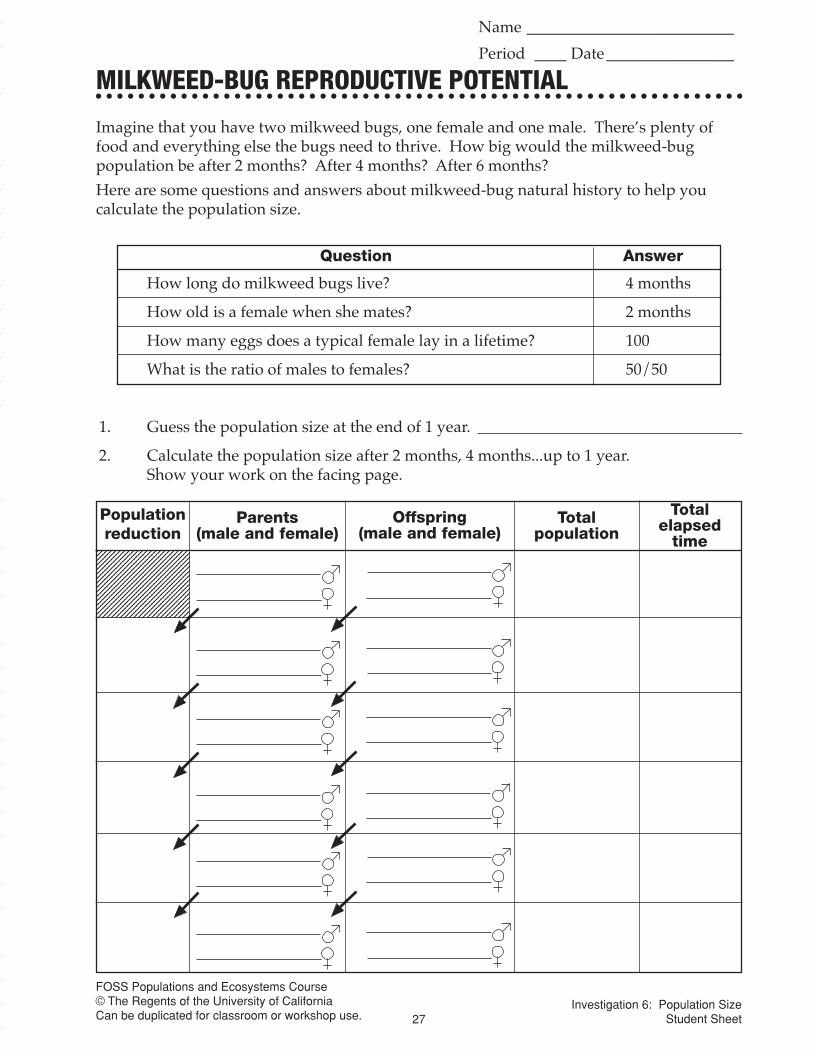
Imagine that you have two milkweed bugs, one female and one male. There’s plenty offood and everything else the bugs need to thrive. How big would the milkweed-bugpopulation be after 2 months? After 4 months? After 6 months?
Here are some questions and answers about milkweed-bug natural history to help youcalculate the population size.
○ ○ ○ ○ ○ ○ ○ ○ ○ ○ ○ ○ ○ ○ ○ ○ ○ ○ ○ ○ ○ ○ ○ ○ ○ ○ ○ ○ ○ ○ ○ ○ ○ ○ ○ ○ ○ ○ ○ ○ ○ ○ ○ ○ ○ ○ ○ ○ ○ ○ ○ ○ ○ ○ ○ ○ ○ ○ ○ ○ ○
MILKWEED-BUG REPRODUCTIVE POTENTIAL
How long do milkweed bugs live? 4 months
How old is a female when she mates? 2 months
How many eggs does a typical female lay in a lifetime? 100
What is the ratio of males to females? 50/50
1. Guess the population size at the end of 1 year.
2. Calculate the population size after 2 months, 4 months...up to 1 year.Show your work on the facing page.
Question Answer
Name __________________________
Period ____ Date ________________
Investigation 6: Population SizeStudent Sheet
1234567890123456789012123456789012345678901212345678901234567890121234567890123456789012123456789012345678901212345678901234567890121234567890123456789012123456789012345678901212345678901234567890121234567890123456789012123456789012345678901212345678901234567890121234567890123456789012123456789012345678901212345678901234567890121234567890123456789012
Populationreduction
Parents(male and female)
Offspring(male and female)
Totalpopulation
Totalelapsed
time

28

FOSS Populations and Ecosystems Course© The Regents of the University of CaliforniaCan be duplicated for classroom or workshop use. 29
The Milkweed Bugs, Limited simulation allows you to change five variables in order tofind out how each one affects the size of a milkweed-bug population. The variables are
• Volume of space available to the population (400 to 1200 cubic centimeters)
• Percentage of females in any clutch of eggs (10 to 90%)
• Clutch frequency—age at which females reach reproductive maturity (2–3.9 months)
• Number of eggs per clutch (20 to 150)
• Survival rate of eggs (50 to 100%)
Work with the simulation to answer these questions.
1. Which variable has the largest effect on population size? What is your evidence?
2. Which of the variables are biotic factors and which are abiotic factors?
3. How does each variable act as a population limiting factor?
4. Develop a question about milkweed-bug population growth and answer it using themodel simulation. On the back of this page, write the question and what you foundout.
○ ○ ○ ○ ○ ○ ○ ○ ○ ○ ○ ○ ○ ○ ○ ○ ○ ○ ○ ○ ○ ○ ○ ○ ○ ○ ○ ○ ○ ○ ○ ○ ○ ○ ○ ○ ○ ○ ○ ○ ○ ○ ○ ○ ○ ○ ○ ○ ○ ○ ○ ○ ○ ○ ○ ○ ○ ○ ○ ○ ○
MILKWEED BUGS, LIMITED
Name __________________________
Period ____ Date ________________
Investigation 6: Population SizeStudent Sheet

30

FOSS Populations and Ecosystems Course© The Regents of the University of CaliforniaCan be duplicated for classroom or workshop use. 31
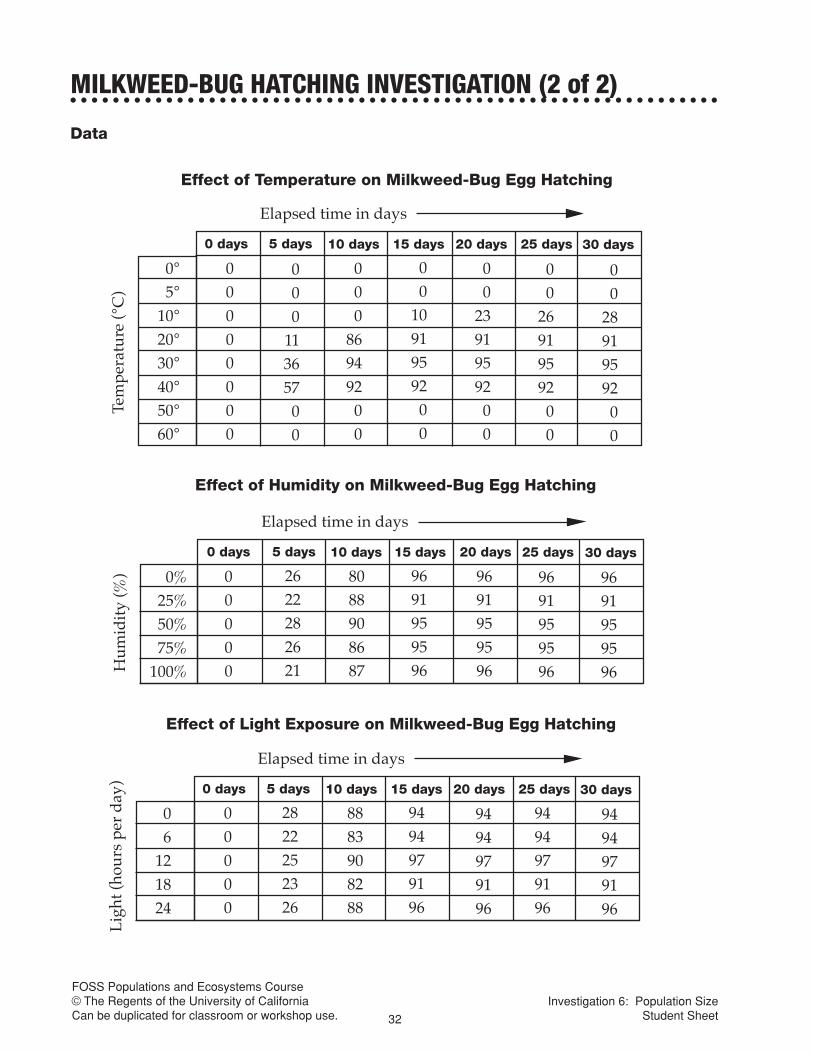
A class of high school biology students was asked to conduct some experiments to find outwhat variables affect the hatching of milkweed-bug eggs. They planned experiments thatthey thought would help them understand milkweed-bug egg hatching, gathered the data,and organized it for others to share. They did not have time to summarize the results of theexperiments or draw conclusions from those results. Here is the first part of their report.
Title. Investigation into Three Variables That Might Affect Milkweed-Bug Egg Hatching
Purpose. All organisms have limits on their populations. One limit on the population ofmilkweed bugs might be egg hatching. We identified two ways the milkweed-bugpopulation might be limited at the egg stage: the number of eggs that hatch and the lengthof time it takes eggs to hatch.
We decided to test three variables to see how they affect both the number of eggs that hatchand the length of time that elapses before eggs hatch. We tested three variables:temperature, humidity, and exposure to light.
Experimental design. A large colony of breeding milkweed bugs was available. Oneday before the experiments were scheduled to start, we put fresh pieces of polyester woolinto the colony. The next day we had several thousand new eggs to use in our experiment.Three pieces of equipment were used to control the variables for the experiments.
1. A temperature-control device to maintain precise temperatures for extendedperiods of time.
2. A humidity-control device to maintain precise humidities for extended periods of time.
3. A light-control device to maintain precise exposure to light.
The standard hatching environment was established to be 25°C, 50% humidity, and12 hours of light exposure each day.
One hundred milkweed-bug eggs were placed in each experimental setting. In thetemperature experiments, humidity was maintained at 50% and light exposure controlledat 12 hours each day. Similarly, in the humidity experiment, temperature was maintainedat 25°C and light exposure controlled at 12 hours each day. Every 5 days the eggs wereobserved, and the number of eggs that had hatched was recorded. Nymphs were removedto a supportive environment, and the unhatched eggs were returned to the experimentalconditions. The experiments continued for 30 days.
○ ○ ○ ○ ○ ○ ○ ○ ○ ○ ○ ○ ○ ○ ○ ○ ○ ○ ○ ○ ○ ○ ○ ○ ○ ○ ○ ○ ○ ○ ○ ○ ○ ○ ○ ○ ○ ○ ○ ○ ○ ○ ○ ○ ○ ○ ○ ○ ○ ○ ○ ○ ○ ○ ○ ○ ○ ○ ○ ○ ○
MILKWEED-BUG HATCHING INVESTIGATION (1 of 2)
Investigation 6: Population SizeStudent Sheet
FOSS Populations and Ecosystems Course© The Regents of the University of CaliforniaCan be duplicated for classroom or workshop use. 32
Elapsed time in days
0 days 5 days 10 days 15 days 20 days 25 days 30 days
Lig
ht (h
ours
per
day
)
06
121824
00000
2822252326
8883908288
9494979196
9494979196
9494979196
9494979196
00000000
Elapsed time in days
0 days 5 days 10 days 15 days 20 days 25 days 30 days
Tem
pera
ture
(°C
)
0°5°
10°20°30°40°50°60°
000
11365700
000
86949200
00
1091959200
00
2391959200
00
2691959200
00
2891959200
Effect of Temperature on Milkweed-Bug Egg Hatching
Effect of Humidity on Milkweed-Bug Egg Hatching
Effect of Light Exposure on Milkweed-Bug Egg Hatching
Data
○ ○ ○ ○ ○ ○ ○ ○ ○ ○ ○ ○ ○ ○ ○ ○ ○ ○ ○ ○ ○ ○ ○ ○ ○ ○ ○ ○ ○ ○ ○ ○ ○ ○ ○ ○ ○ ○ ○ ○ ○ ○ ○ ○ ○ ○ ○ ○ ○ ○ ○ ○ ○ ○ ○ ○ ○ ○ ○ ○ ○
MILKWEED-BUG HATCHING INVESTIGATION (2 of 2)
Elapsed time in days
0 days 5 days 10 days 15 days 20 days 25 days 30 days
Hum
idit
y (%
) 0%25%50%75%
100%
00000
2622282621
8088908687
9691959596
9691959596
9691959596
9691959596
Investigation 6: Population SizeStudent Sheet

FOSS Populations and Ecosystems Course© The Regents of the University of CaliforniaCan be duplicated for classroom or workshop use. 33
Name __________________________
Period ____ Date ________________
Results. Summarize what you found out about the limiting effect of the three variables studied inthe milkweed-bug hatching experiments.
Conclusions. Discuss the significance of the experimental results. What do the results suggestabout ways that milkweed-bug populations are limited in nature?
○ ○ ○ ○ ○ ○ ○ ○ ○ ○ ○ ○ ○ ○ ○ ○ ○ ○ ○ ○ ○ ○ ○ ○ ○ ○ ○ ○ ○ ○ ○ ○ ○ ○ ○ ○ ○ ○ ○ ○ ○ ○ ○ ○ ○ ○ ○ ○ ○ ○ ○ ○ ○ ○ ○ ○ ○ ○ ○ ○ ○
MILKWEED-BUG HATCHING ANALYSIS
Investigation 6: Population SizeStudent Sheet
FOSS Populations and Ecosystems Course© The Regents of the University of CaliforniaCan be duplicated for classroom or workshop use. 34
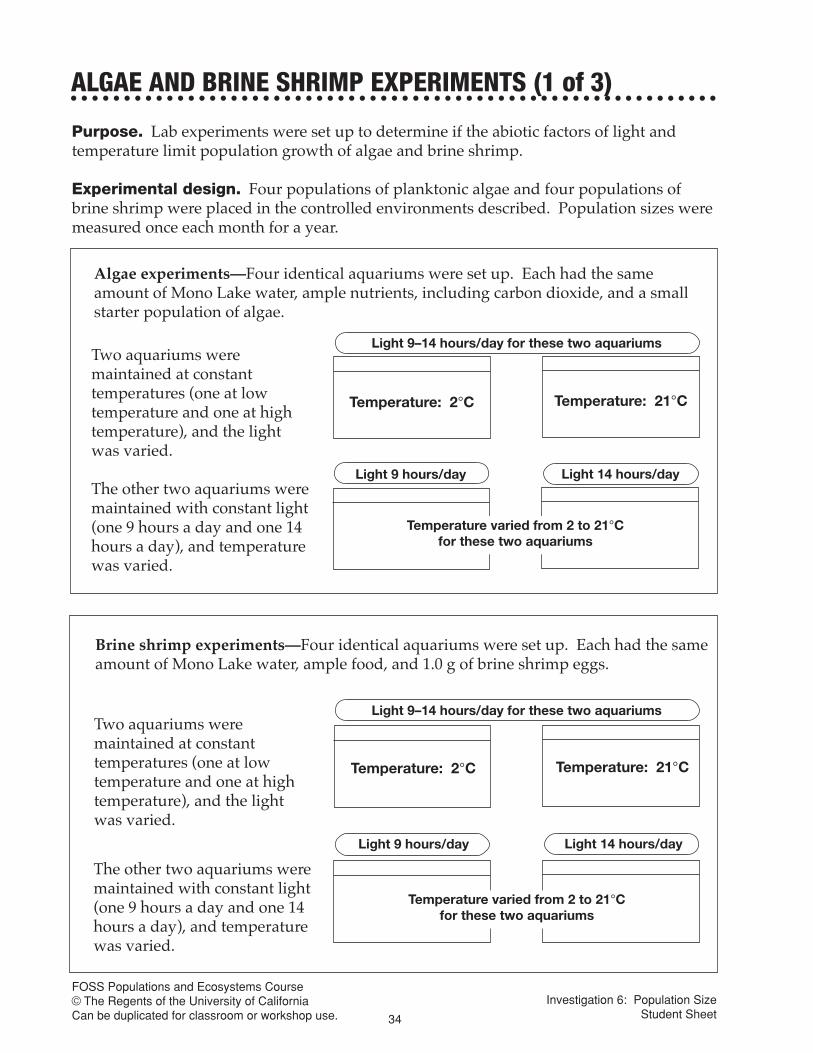
Purpose. Lab experiments were set up to determine if the abiotic factors of light andtemperature limit population growth of algae and brine shrimp.
Experimental design. Four populations of planktonic algae and four populations ofbrine shrimp were placed in the controlled environments described. Population sizes weremeasured once each month for a year.
Algae experiments—Four identical aquariums were set up. Each had the sameamount of Mono Lake water, ample nutrients, including carbon dioxide, and a smallstarter population of algae.
Temperature: 2°C Temperature: 21°C
Light 14 hours/dayLight 9 hours/day
Light 9–14 hours/day for these two aquariums
Temperature varied from 2 to 21°Cfor these two aquariums
Light 9–14 hours/day for these two aquariums
Light 14 hours/dayLight 9 hours/day
Temperature: 2°C Temperature: 21°C
Temperature varied from 2 to 21°Cfor these two aquariums
○ ○ ○ ○ ○ ○ ○ ○ ○ ○ ○ ○ ○ ○ ○ ○ ○ ○ ○ ○ ○ ○ ○ ○ ○ ○ ○ ○ ○ ○ ○ ○ ○ ○ ○ ○ ○ ○ ○ ○ ○ ○ ○ ○ ○ ○ ○ ○ ○ ○ ○ ○ ○ ○ ○ ○ ○ ○ ○ ○ ○
ALGAE AND BRINE SHRIMP EXPERIMENTS (1 of 3)
Brine shrimp experiments—Four identical aquariums were set up. Each had the sameamount of Mono Lake water, ample food, and 1.0 g of brine shrimp eggs.
Two aquariums weremaintained at constanttemperatures (one at lowtemperature and one at hightemperature), and the lightwas varied.
The other two aquariums weremaintained with constant light(one 9 hours a day and one 14hours a day), and temperaturewas varied.
Two aquariums weremaintained at constanttemperatures (one at lowtemperature and one at hightemperature), and the lightwas varied.
The other two aquariums weremaintained with constant light(one 9 hours a day and one 14hours a day), and temperaturewas varied.
Investigation 6: Population SizeStudent Sheet

FOSS Populations and Ecosystems Course© The Regents of the University of CaliforniaCan be duplicated for classroom or workshop use. 35
Experimental procedure
The eight aquariums were set up as described and allowed to develop for 1 year.
The aquariums that received constant low light got 9 hours of light each day for a year.Nine hours of light represents the shortest days at Mono Lake. The high-light aquariumsgot 14 hours of light each day for a year.
The aquariums that received variable light got the amount of light each day thatcorresponds to the length of the day at Mono Lake—9 hours in January, graduallyincreasing to 14 hours in June and July, then declining back to 9 hours in December.
The aquariums maintained at a constant low temperature were at 2°C all the time for ayear. Two degrees is the lowest temperature of Mono Lake in the winter. The high-temperature aquariums were maintained at 22°C throughout the year, Mono Lake’swarmest.
The aquariums maintained at variable temperature started out cold (2°C) in January,warmed gradually to 22°C in July and August, and then cooled to 2°C by December.
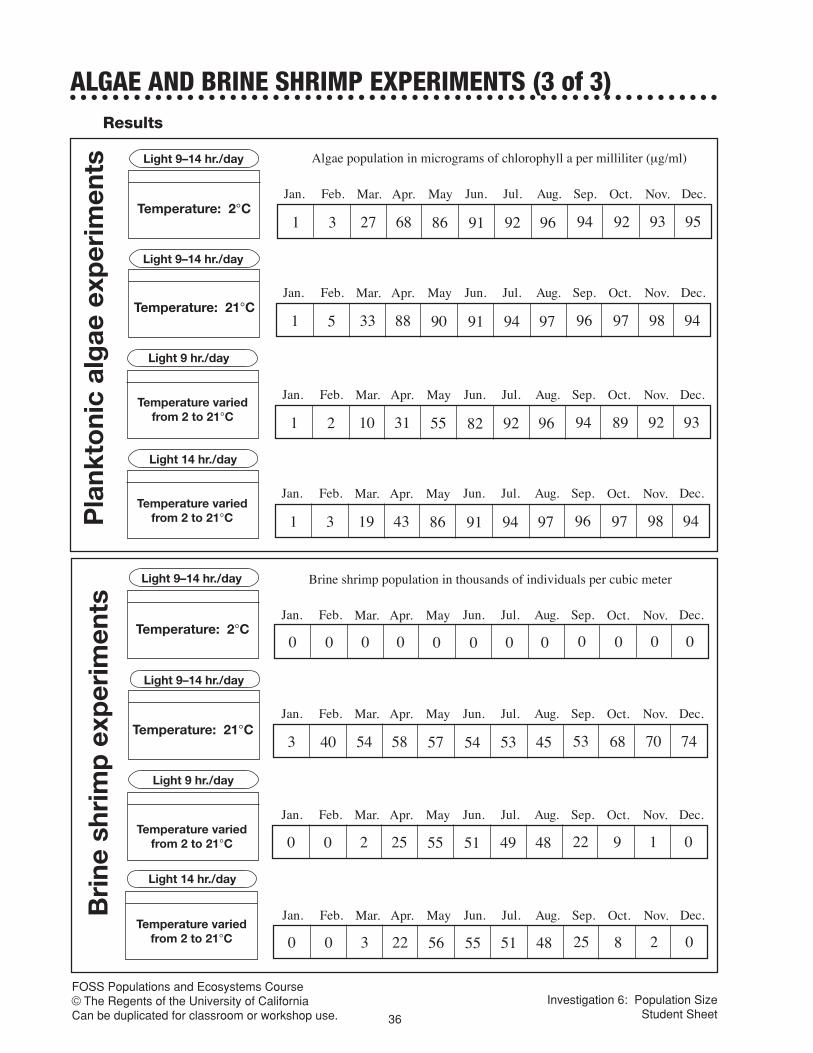
Populations were sampled once at the end of every month. A 100-ml sample of algae waterwas removed and processed to see how much chlorophyll a was present. The amount ofchlorophyll a, reported in micrograms per milliliter (µg/ml), is directly related to the sizeof the population.
Populations of brine shrimp were counted directly by placing a 5-ml sample of culturewater under a microscope and counting all the shrimp of any size (larvae, juvenile, andadult). The result was converted to the number of brine shrimp per cubic meter (m3) ofwater.
○ ○ ○ ○ ○ ○ ○ ○ ○ ○ ○ ○ ○ ○ ○ ○ ○ ○ ○ ○ ○ ○ ○ ○ ○ ○ ○ ○ ○ ○ ○ ○ ○ ○ ○ ○ ○ ○ ○ ○ ○ ○ ○ ○ ○ ○ ○ ○ ○ ○ ○ ○ ○ ○ ○ ○ ○ ○ ○ ○ ○
ALGAE AND BRINE SHRIMP EXPERIMENTS (2 of 3)
Investigation 6: Population SizeStudent Sheet
FOSS Populations and Ecosystems Course© The Regents of the University of CaliforniaCan be duplicated for classroom or workshop use. 36
Pla
nkto
nic
alg
ae e
xper
imen
tsB
rine
shr
imp
exp
erim
ents
Results
○ ○ ○ ○ ○ ○ ○ ○ ○ ○ ○ ○ ○ ○ ○ ○ ○ ○ ○ ○ ○ ○ ○ ○ ○ ○ ○ ○ ○ ○ ○ ○ ○ ○ ○ ○ ○ ○ ○ ○ ○ ○ ○ ○ ○ ○ ○ ○ ○ ○ ○ ○ ○ ○ ○ ○ ○ ○ ○ ○ ○
ALGAE AND BRINE SHRIMP EXPERIMENTS (3 of 3)
Brine shrimp population in thousands of individuals per cubic meter
0 0 0 0 0 0 0 0 0 0 0 0
3 40 54 58 57 54 53 45 53 68 70 74
0 0 2 25 55 51 49 48 22 9 1 0
0 0 3 22 56 55 51 48 25 8 2 0
Light 9–14 hr./day
Light 9–14 hr./day
Temperature: 2°C
Temperature: 21°C
Temperature variedfrom 2 to 21°C
Temperature variedfrom 2 to 21°C
Light 14 hr./day
Light 9 hr./day
Algae population in micrograms of chlorophyll a per milliliter (µg/ml)
Jan. Feb. Mar. Apr. May Jun. Jul. Aug. Sep. Oct. Nov. Dec.
1 3 27 68 86 91 92 96 94 92 93 95
Jan. Feb. Mar. Apr. May Jun. Jul. Aug. Sep. Oct. Nov. Dec.
1 5 33 88 90 91 94 97 96 97 98 94
Jan. Feb. Mar. Apr. May Jun. Jul. Aug. Sep. Oct. Nov. Dec.
1 2 10 31 55 82 92 96 94 89 92 93
1 3 19 43 86 91 94 97 96 97 98 94
Temperature: 2°C
Temperature: 21°C
Light 9–14 hr./day
Temperature variedfrom 2 to 21°C
Light 14 hr./day
Light 9 hr./day
Light 9–14 hr./day
Temperature variedfrom 2 to 21°C
Jan. Feb. Mar. Apr. May Jun. Jul. Aug. Sep. Oct. Nov. Dec.
Jan. Feb. Mar. Apr. May Jun. Jul. Aug. Sep. Oct. Nov. Dec.
Jan. Feb. Mar. Apr. May Jun. Jul. Aug. Sep. Oct. Nov. Dec.
Jan. Feb. Mar. Apr. May Jun. Jul. Aug. Sep. Oct. Nov. Dec.
Jan. Feb. Mar. Apr. May Jun. Jul. Aug. Sep. Oct. Nov. Dec.
Investigation 6: Population SizeStudent Sheet
FOSS Populations and Ecosystems Course© The Regents of the University of CaliforniaCan be duplicated for classroom or workshop use. 37
Name __________________________
Period ____ Date ________________
Conclusions1. Based on the experimental results, what factors placed limits on the algae populations?
What is your evidence?
2. Based on the experimental results, what factors placed limits on the brine shrimppopulations? What is your evidence?
3. What additional abiotic and biotic factors might limit population size in Mono Lake?
○ ○ ○ ○ ○ ○ ○ ○ ○ ○ ○ ○ ○ ○ ○ ○ ○ ○ ○ ○ ○ ○ ○ ○ ○ ○ ○ ○ ○ ○ ○ ○ ○ ○ ○ ○ ○ ○ ○ ○ ○ ○ ○ ○ ○ ○ ○ ○ ○ ○ ○ ○ ○ ○ ○ ○ ○ ○ ○ ○ ○
ALGAE AND BRINE SHRIMP EXPERIMENTS ANALYSIS
Investigation 6: Population SizeStudent Sheet
FOSS Populations and Ecosystems Course© The Regents of the University of CaliforniaCan be duplicated for classroom or workshop use. 38
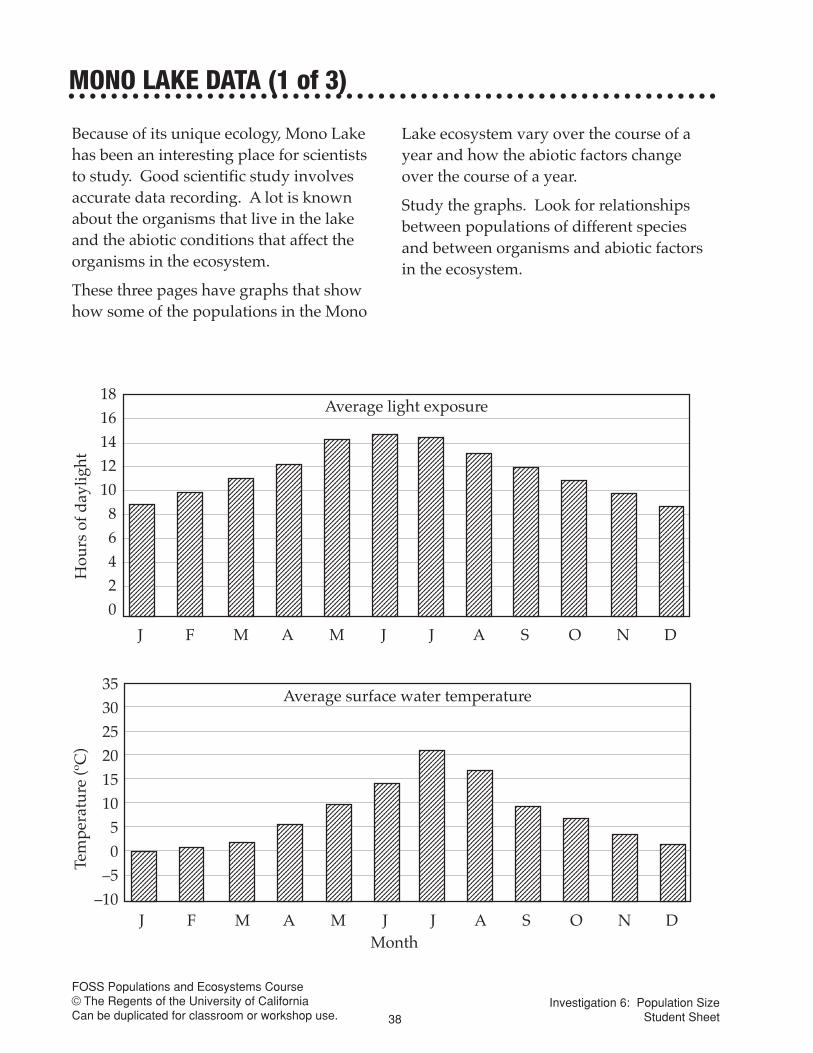
Because of its unique ecology, Mono Lakehas been an interesting place for scientiststo study. Good scientific study involvesaccurate data recording. A lot is knownabout the organisms that live in the lakeand the abiotic conditions that affect theorganisms in the ecosystem.
These three pages have graphs that showhow some of the populations in the Mono
Lake ecosystem vary over the course of ayear and how the abiotic factors changeover the course of a year.
Study the graphs. Look for relationshipsbetween populations of different speciesand between organisms and abiotic factorsin the ecosystem.
○ ○ ○ ○ ○ ○ ○ ○ ○ ○ ○ ○ ○ ○ ○ ○ ○ ○ ○ ○ ○ ○ ○ ○ ○ ○ ○ ○ ○ ○ ○ ○ ○ ○ ○ ○ ○ ○ ○ ○ ○ ○ ○ ○ ○ ○ ○ ○ ○ ○ ○ ○ ○ ○ ○ ○ ○ ○ ○ ○ ○
MONO LAKE DATA (1 of 3)
Average light exposure
J F M A M J J A S O N D
181614121086420
Hou
rs o
f day
light
123456123456123456123456123456123456123456123456123456123456123456123456123456123456123456123456123456123456123456123456123456123456123456123456123456123456
12345671234567123456712345671234567123456712345671234567123456712345671234567123456712345671234567123456712345671234567123456712345671234567123456712345671234567123456712345671234567123456712345671234567
123456123456123456123456123456123456123456123456123456123456123456123456123456123456123456123456123456123456123456123456123456123456123456123456123456123456123456123456123456123456123456123456
12345671234567123456712345671234567123456712345671234567123456712345671234567123456712345671234567123456712345671234567123456712345671234567123456712345671234567123456712345671234567123456712345671234567123456712345671234567123456712345671234567
12345671234567123456712345671234567123456712345671234567123456712345671234567123456712345671234567123456712345671234567123456712345671234567123456712345671234567123456712345671234567123456712345671234567123456712345671234567123456712345671234567123456712345671234567123456712345671234567
123456712345671234567123456712345671234567123456712345671234567123456712345671234567123456712345671234567123456712345671234567123456712345671234567123456712345671234567123456712345671234567123456712345671234567123456712345671234567123456712345671234567123456712345671234567123456712345671234567
12345671234567123456712345671234567123456712345671234567123456712345671234567123456712345671234567123456712345671234567123456712345671234567123456712345671234567123456712345671234567123456712345671234567123456712345671234567123456712345671234567123456712345671234567123456712345671234567
123456123456123456123456123456123456123456123456123456123456123456123456123456123456123456123456123456123456123456123456123456123456123456123456123456123456123456123456123456123456123456123456123456123456123456123456123456123456
12345671234567123456712345671234567123456712345671234567123456712345671234567123456712345671234567123456712345671234567123456712345671234567123456712345671234567123456712345671234567123456712345671234567123456712345671234567123456712345671234567
12345671234567123456712345671234567123456712345671234567123456712345671234567123456712345671234567123456712345671234567123456712345671234567123456712345671234567123456712345671234567123456712345671234567123456712345671234567
12345671234567123456712345671234567123456712345671234567123456712345671234567123456712345671234567123456712345671234567123456712345671234567123456712345671234567123456712345671234567123456712345671234567
12345671234567123456712345671234567123456712345671234567123456712345671234567123456712345671234567123456712345671234567123456712345671234567123456712345671234567123456712345671234567
J F M A M J J A S O N D
Average surface water temperature35302520151050
–5–10
123456123456123456123456123456123456123456123456123456123456123456123456123456
123456123456123456123456123456123456123456123456123456123456123456123456123456123456
123456123456123456123456123456123456123456123456123456123456123456123456123456123456123456
123456123456123456123456123456123456123456123456123456123456123456123456123456123456123456123456123456123456123456
123456123456123456123456123456123456123456123456123456123456123456123456123456123456123456123456123456123456123456123456123456123456123456
1234567123456712345671234567123456712345671234567123456712345671234567123456712345671234567123456712345671234567123456712345671234567123456712345671234567123456712345671234567123456712345671234567
12345671234567123456712345671234567123456712345671234567123456712345671234567123456712345671234567123456712345671234567123456712345671234567123456712345671234567123456712345671234567123456712345671234567123456712345671234567123456712345671234567
1234567123456712345671234567123456712345671234567123456712345671234567123456712345671234567123456712345671234567123456712345671234567123456712345671234567123456712345671234567123456712345671234567123456712345671234567
123456123456123456123456123456123456123456123456123456123456123456123456123456123456123456123456123456123456123456123456123456123456123456
123456123456123456123456123456123456123456123456123456123456123456123456123456123456123456123456123456123456123456123456
123456123456123456123456123456123456123456123456123456123456123456123456123456123456123456123456
12345671234567123456712345671234567123456712345671234567123456712345671234567123456712345671234567
Tem
pera
ture
(ºC
)
Month
Investigation 6: Population SizeStudent Sheet

FOSS Populations and Ecosystems Course© The Regents of the University of CaliforniaCan be duplicated for classroom or workshop use. 39
12341234
12341234
1234512345
1234512345
Average brine shrimp population
J F M A M J J A S O N D
5
4
3
2
1
0
12341234123412341234123412341234123412341234
1234123412341234123412341234123412341234
1234123412341234123412341234123412341234123412341234123412341234123412341234
123451234512345123451234512345123451234512345123451234512345123451234512345123451234512345123451234512345123451234512345
12341234123412341234123412341234123412341234123412341234123412341234123412341234
1234123412341234123412341234123412341234123412341234123412341234
12341234123412341234123412341234
1234512345123451234512345
Popu
lati
on in
trill
ions
Average planktonic algae population
J F M A M J J A S O N D
Max.
0
12341234123412341234123412341234123412341234123412341234123412341234123412341234123412341234123412341234
123412341234123412341234123412341234123412341234123412341234123412341234123412341234123412341234123412341234
1234123412341234123412341234123412341234123412341234123412341234123412341234123412341234
1234123412341234123412341234123412341234123412341234123412341234
12341234123412341234123412341234123412341234
1234512345123451234512345123451234512345
1234123412341234123412341234
12341234
12341234
123451234512345123451234512345
1234512345123451234512345123451234512345123451234512345123451234512345123451234512345
12345123451234512345123451234512345123451234512345123451234512345123451234512345123451234512345123451234512345123451234512345
Average brine fly population
J F M A M J J A S O N D
Max.
0123412341234
1234123412341234
12341234123412341234
123412341234123412341234123412341234123412341234
1234123412341234123412341234123412341234123412341234123412341234123412341234123412341234
123451234512345123451234512345123451234512345123451234512345123451234512345123451234512345123451234512345123451234512345123451234512345
12341234123412341234123412341234123412341234123412341234123412341234123412341234
123412341234123412341234123412341234123412341234
123412341234123412341234123412341234
12345123451234512345123451234512345
1234512345123451234512345
123451234512345
○ ○ ○ ○ ○ ○ ○ ○ ○ ○ ○ ○ ○ ○ ○ ○ ○ ○ ○ ○ ○ ○ ○ ○ ○ ○ ○ ○ ○ ○ ○ ○ ○ ○ ○ ○ ○ ○ ○ ○ ○ ○ ○ ○ ○ ○ ○ ○ ○ ○ ○ ○ ○ ○ ○ ○ ○ ○ ○ ○ ○
MONO LAKE DATA (2 of 3)
Month
Investigation 6: Population SizeStudent Sheet
FOSS Populations and Ecosystems Course© The Regents of the University of CaliforniaCan be duplicated for classroom or workshop use. 40
○ ○ ○ ○ ○ ○ ○ ○ ○ ○ ○ ○ ○ ○ ○ ○ ○ ○ ○ ○ ○ ○ ○ ○ ○ ○ ○ ○ ○ ○ ○ ○ ○ ○ ○ ○ ○ ○ ○ ○ ○ ○ ○ ○ ○ ○ ○ ○ ○ ○ ○ ○ ○ ○ ○ ○ ○ ○ ○ ○ ○
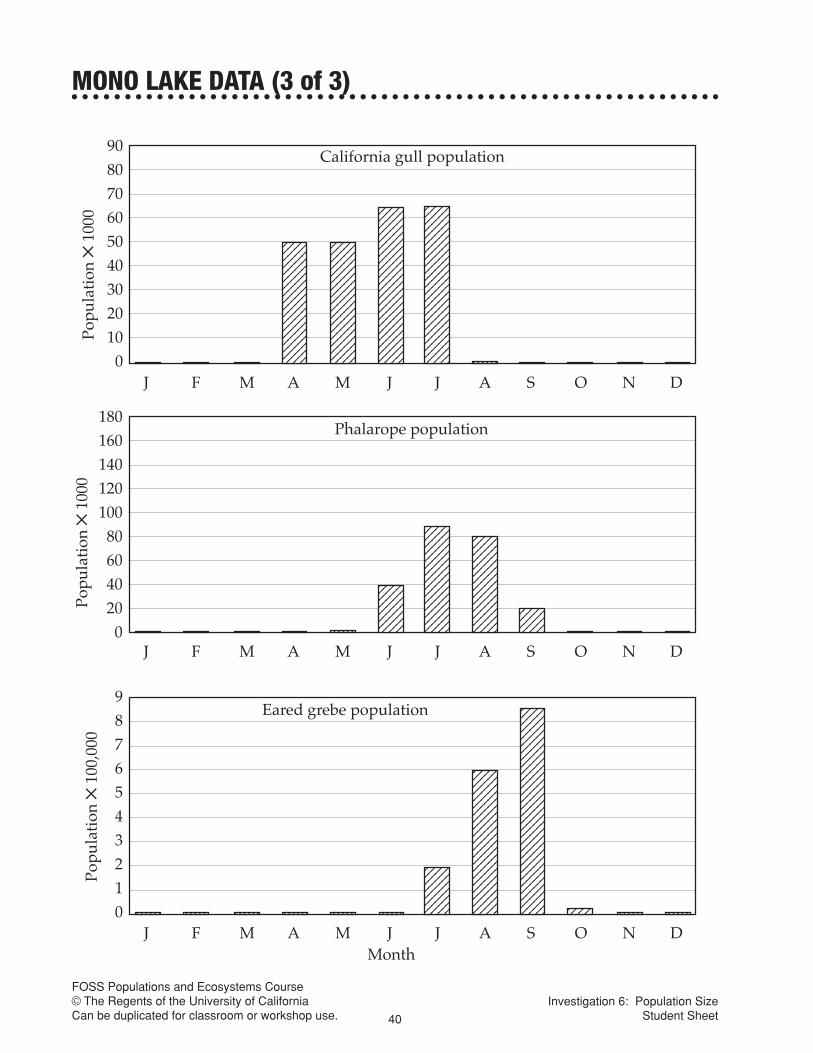
MONO LAKE DATA (3 of 3)
123456 123456 123456 1234567 123456 123456 123456 1234567
J F M A M J J A S O N D
California gull population9080706050403020100
123412341234123412341234123412341234123412341234123412341234123412341234
123412341234123412341234123412341234123412341234123412341234123412341234
1234512345123451234512345123451234512345123451234512345123451234512345123451234512345123451234512345123451234512345
12341234123412341234123412341234123412341234123412341234123412341234123412341234123412341234
Popu
lati
on ✕
100
0
123456 123456 123456 123456 1234567 123456 123456 1234567
Phalarope population
J F M A M J J A S O N D
180160140120100806040200
1234512345123451234512345123451234512345
1234123412341234123412341234123412341234123412341234123412341234
123412341234123412341234123412341234123412341234123412341234
12341234123412341234
Popu
lati
on ✕
100
0
123456 123456 1234567 123456 1234561234512345 123456 1234567
Eared grebe population
J F M A M J J A S O N D
9876543210 1234567
12341234123412341234123412341234
1234123412341234123412341234123412341234123412341234123412341234123412341234123412341234
1234123412341234123412341234123412341234123412341234123412341234123412341234123412341234123412341234123412341234123412341234
Popu
lati
on ✕
100
,000
Month
Investigation 6: Population SizeStudent Sheet

FOSS Populations and Ecosystems Course© The Regents of the University of CaliforniaCan be duplicated for classroom or workshop use. 41
Name __________________________
Period ____ Date ________________
○ ○ ○ ○ ○ ○ ○ ○ ○ ○ ○ ○ ○ ○ ○ ○ ○ ○ ○ ○ ○ ○ ○ ○ ○ ○ ○ ○ ○ ○ ○ ○ ○ ○ ○ ○ ○ ○ ○ ○ ○ ○ ○ ○ ○ ○ ○ ○ ○ ○ ○ ○ ○ ○ ○ ○ ○ ○ ○ ○ ○
ANALYSIS OF MONO LAKE DATA
1. When does the planktonic algae population peak? When does the brine shrimppopulation peak? What explanation do you have for the timing of each peak?
2. What is the relationship between water temperature and the other organisms in theMono Lake ecosystem?
3. Discuss the population graphs of the birds (gulls, phalaropes, and grebes).
4. What is the relationship between the birds and the other organisms?
5. What do you think is going on with the populations at Mono Lake in April?
Investigation 6: Population SizeStudent Sheet

FOSS Populations and Ecosystems Course© The Regents of the University of CaliforniaCan be duplicated for classroom or workshop use. 42
Research and Preparation. Working together as a group, look over the resourcesand figure out which ones will help you answer these questions.
What kind of environment is this? Where is it?(Hint: look for information about rain or other precipitation, climate, sunlight,elevation, temperatures, latitude, freshwater or seawater, etc.)
What are the main organisms that are important in this ecosystem?(Hint: look for information about the trophic levels, like primary producers orplants, what organisms eat the producers, what eats them, etc.)
What are the main abiotic factors that affect this ecosystem?(Hint: look for information about changing water levels, temperature, light levels,salinity, pollution, etc.)
What are the main ways that people affect this ecosystem?(Hint: look for information about building or construction, logging, divertingfreshwater, hunting, or anything else humans do that affects nature.)
Be sure to take notes, highlight passages, and write down the source of the informationand where you found it.
Food Web. With your group members, develop a food web of the most importantorganisms. This will help you develop your poster and your individual reports. Startby identifying the producers in your ecosystem. Next, determine what organisms arethe primary consumers. Next, identify what eats these and so on.
Include at least three producers and their consumers in your food web.
Color-code them so that producers are green and consumers are red.
Include at least 10 organisms, but no more than 15.
Draw arrows to show which organisms eat which others.
Abiotic Factors. Make a list of the most important abiotic factors that affect thisecosystem. This will help you develop your poster and your individual reports.
List the main abiotic factors in the ecosystem (no more than three).
Identify the population(s) affected by the factor.
Describe the factor’s effect on the ecosystem.
○ ○ ○ ○ ○ ○ ○ ○ ○ ○ ○ ○ ○ ○ ○ ○ ○ ○ ○ ○ ○ ○ ○ ○ ○ ○ ○ ○ ○ ○ ○ ○ ○ ○ ○ ○ ○ ○ ○ ○ ○ ○ ○ ○ ○ ○ ○ ○ ○ ○ ○ ○ ○ ○ ○ ○ ○ ○ ○ ○ ○
ECOSCENARIO PROJECT GUIDELINES (1 of 3)
Investigation 7: EcoscenariosStudent Sheet
FOSS Populations and Ecosystems Course© The Regents of the University of CaliforniaCan be duplicated for classroom or workshop use. 43
Human Impact. Make a list of the most important human effects onthis ecosystem. Add these to the food web. Color-code these in black.
Describe the human impacts (no more than two).
Identify the population(s) affected by humans.
Describe the effect on the ecosystem.
Poster. After you have done your research for your individual reports, work withyour group members to develop a poster to present to the rest of the class. Your posterwill help you tell the story of your ecosystem to the rest of the class.
Pick one population that you think will be the best to help other people understandyour ecosystem. Work together to figure out how to share the story of your ecosystemwith the rest of the class. Include diagrams, pictures, drawings, graphs, or other waysto make the information easy to understand.
Posters should include
Title and description
• Briefly describe the ecosystem.• Tell or show where the ecosystem is.
• Mention similar ecosystems in other places on Earth.
Food web
• Diagram organisms in trophic levels: producers, consumers, and so forth.
• Include 10–15 organisms in the food web.
• Draw arrows to show energy flow in the ecosystem.
Abiotic factors
• Identify two or three abiotic factors that define your ecosystem.
• Describe how these abiotic factors influence the ecosystem.
Human impact
• Identify an issue arising from human impact in your ecosystem.
• Describe the effect of humans on the populations in your ecosystem.
• Discuss possible actions that could be taken to reduce the impact.
○ ○ ○ ○ ○ ○ ○ ○ ○ ○ ○ ○ ○ ○ ○ ○ ○ ○ ○ ○ ○ ○ ○ ○ ○ ○ ○ ○ ○ ○ ○ ○ ○ ○ ○ ○ ○ ○ ○ ○ ○ ○ ○ ○ ○ ○ ○ ○ ○ ○ ○ ○ ○ ○ ○ ○ ○ ○ ○ ○ ○
ECOSCENARIO PROJECT GUIDELINES (2 of 3)
Investigation 7: EcoscenariosStudent Sheet

FOSS Populations and Ecosystems Course© The Regents of the University of CaliforniaCan be duplicated for classroom or workshop use. 44
Presentation. In your presentation, include information about one importantpopulation in this ecosystem.
Cover its role in the ecosystem.
Describe the effect of abiotic factors on the population.
Describe the effect of humans on the population.
As you tell the story of your ecosystem, use the food web on your poster, plus any otherdiagrams or visual aids that you think will help other students understand.
Individual Report. After you have completed your food web (including trophic levels,abiotic factors, and human impact) with your group, decide as a group whichpopulation each person will study for individual reports. Each group must haveindividual reports for a producer, a primary consumer, and a secondary consumer.
Individual reports will include
A description of one key population’s role in the ecosystem, including where it lives,what it eats, what eats it, and any other interactions or important behaviors.
A discussion of the population’s abiotic needs and interactions.
An example of human impact on the population.
Include diagrams, pictures, drawings, graphs, or other ways to make the informationeasy to understand. Each individual report should be about three pages long, but it maybe shorter or longer, depending on what you need to say.
Grading. Grades will be based on group work and individual work.
The group grade considers The individual grade considers• Poster • Group participation• Report • Individual report• Group assessment • Self-assessment
○ ○ ○ ○ ○ ○ ○ ○ ○ ○ ○ ○ ○ ○ ○ ○ ○ ○ ○ ○ ○ ○ ○ ○ ○ ○ ○ ○ ○ ○ ○ ○ ○ ○ ○ ○ ○ ○ ○ ○ ○ ○ ○ ○ ○ ○ ○ ○ ○ ○ ○ ○ ○ ○ ○ ○ ○ ○ ○ ○ ○
ECOSCENARIO PROJECT GUIDELINES (3 of 3)
Investigation 7: EcoscenariosStudent Sheet

45

FOSS Populations and Ecosystems Course© The Regents of the University of CaliforniaCan be duplicated for classroom or workshop use. 46
Name __________________________
Period ____ Date ________________
○ ○ ○ ○ ○ ○ ○ ○ ○ ○ ○ ○ ○ ○ ○ ○ ○ ○ ○ ○ ○ ○ ○ ○ ○ ○ ○ ○ ○ ○ ○ ○ ○ ○ ○ ○ ○ ○ ○ ○ ○ ○ ○ ○ ○ ○ ○ ○ ○ ○ ○ ○ ○ ○ ○ ○ ○ ○ ○ ○ ○
ECOSCENARIO PRESENTATION NOTES
Ecosystem
Abiotic issues
Trophic issues
Human issues
Comments
Ecosystem
Abiotic issues
Trophic issues
Human issues
Comments
Ecosystem
Abiotic issues
Trophic issues
Human issues
Comments
Ecosystem
Abiotic issues
Trophic issues
Human issues
Comments
Investigation 7: EcoscenariosStudent Sheet

FOSS Populations and Ecosystems Course© The Regents of the University of CaliforniaCan be duplicated for classroom or workshop use. 47
Name __________________________
Period ____ Date ________________
○ ○ ○ ○ ○ ○ ○ ○ ○ ○ ○ ○ ○ ○ ○ ○ ○ ○ ○ ○ ○ ○ ○ ○ ○ ○ ○ ○ ○ ○ ○ ○ ○ ○ ○ ○ ○ ○ ○ ○ ○ ○ ○ ○ ○ ○ ○ ○ ○ ○ ○ ○ ○ ○ ○ ○ ○ ○ ○ ○ ○
ECOSCENARIO PRESENTATION NOTES (Continued)
Ecosystem
Abiotic issues
Trophic issues
Human issues
Comments
Ecosystem
Abiotic issues
Trophic issues
Human issues
Comments
Ecosystem
Abiotic issues
Trophic issues
Human issues
Comments
Ecosystem
Abiotic issues
Trophic issues
Human issues
Comments
Investigation 7: EcoscenariosStudent Sheet

48

FOSS Populations and Ecosystems Course© The Regents of the University of CaliforniaCan be duplicated for classroom or workshop use. 49
Name __________________________
Period ____ Date ________________
○ ○ ○ ○ ○ ○ ○ ○ ○ ○ ○ ○ ○ ○ ○ ○ ○ ○ ○ ○ ○ ○ ○ ○ ○ ○ ○ ○ ○ ○ ○ ○ ○ ○ ○ ○ ○ ○ ○ ○ ○ ○ ○ ○ ○ ○ ○ ○ ○ ○ ○ ○ ○ ○ ○ ○ ○ ○ ○ ○ ○
STRANGERS IN PARADISE
Organism Adaptation Survival advantage
Green seaturtle
Wild pig
Carnivorouscaterpillar
Monk seal
Rat
Bananapoka
Frigate bird
‘Akiapola‘au bird
Investigation 8: AdaptationsStudent Sheet

50

FOSS Populations and Ecosystems Course© The Regents of the University of CaliforniaCan be duplicated for classroom or workshop use. 51
○ ○ ○ ○ ○ ○ ○ ○ ○ ○ ○ ○ ○ ○ ○ ○ ○ ○ ○ ○ ○ ○ ○ ○ ○ ○ ○ ○ ○ ○ ○ ○ ○ ○ ○ ○ ○ ○ ○ ○ ○ ○ ○ ○ ○ ○ ○ ○ ○ ○ ○ ○ ○ ○ ○ ○ ○ ○ ○ ○ ○
WALKINGSTICK PREDATION: BUSH ENVIRONMENT
You are a predator. You prey on walkingsticks. This is what the walkingstick looks like.
Write responses to these items on the blank page facing this one.
1. Which color of walkingstick was easiest to find? Which was hardest? Why do youthink that was the case?
2. Which color of walkingstick survived best when there was a time limit on feeding?Why do you think that color survived best?
3. Discuss the results of the walkingstick predation in terms of adaptations.
a. Open the walkingstick multimedia program toLevel 1—Eat Insects.
b. Select the 30 Clicks to Eat Insects button.
c. Use your 30 clicks to eat as many walkingsticks as you can.
d. Then click the Results button.
e. Record your results in the table below.
f. Click Start Over and select 30 Seconds to Eat Insects. Eat asmany insects as you can in 30 seconds.
g. Record your results in the table below.
Name __________________________
Period ____ Date ________________
Investigation 8: AdaptationsStudent Sheet
30 clicks
30 seconds
Eaten
Survived
Eaten
Survived
Brown Green-brown Green

FOSS Populations and Ecosystems Course© The Regents of the University of CaliforniaCan be duplicated for classroom or workshop use. 52
Name __________________________
Period ____ Date ________________
Population 1Five generations of walkingsticks living in the bush environment
○ ○ ○ ○ ○ ○ ○ ○ ○ ○ ○ ○ ○ ○ ○ ○ ○ ○ ○ ○ ○ ○ ○ ○ ○ ○ ○ ○ ○ ○ ○ ○ ○ ○ ○ ○ ○ ○ ○ ○ ○ ○ ○ ○ ○ ○ ○ ○ ○ ○ ○ ○ ○ ○ ○ ○ ○ ○ ○ ○ ○
FIVE GENERATIONS OF WALKINGSTICKS
Population 2Select a new environment (wood chips or bamboo), and find out what happens to thepopulation after five generations.
Five generations of walkingsticks living in the environment
= Green-brown walkingsticks= Green walkingsticks
= Brown walkingsticks
Graph resultsMake bar graphs to show the number of surviving walkingsticks of each color over aperiod of five generations. Graph the walkingsticks in the bush environment in the uppergraph. Graph the walkingsticks in the wood-chip or bamboo environment in the lowergraph.
Use colored pencils or pens to represent each color of walkingstick. Identify your colorcode here.
Generation 1
Generation 2
Generation 3
Generation 4
Generation 5
Brown Green-brown Green
Initial Eaten Survived
16 16 16
Initial Eaten Survived Initial Eaten Survived
Investigation 8: AdaptationsStudent Sheet
Generation 1
Generation 2
Generation 3
Generation 4
Generation 5
Brown Green-brown Green
Initial Eaten Survived Initial Eaten Survived Initial Eaten Survived
16 16 16
FOSS Populations and Ecosystems Course© The Regents of the University of CaliforniaCan be duplicated for classroom or workshop use. 53
Name __________________________
Period ____ Date ________________
○ ○ ○ ○ ○ ○ ○ ○ ○ ○ ○ ○ ○ ○ ○ ○ ○ ○ ○ ○ ○ ○ ○ ○ ○ ○ ○ ○ ○ ○ ○ ○ ○ ○ ○ ○ ○ ○ ○ ○ ○ ○ ○ ○ ○ ○ ○ ○ ○ ○ ○ ○ ○ ○ ○ ○ ○ ○ ○ ○ ○
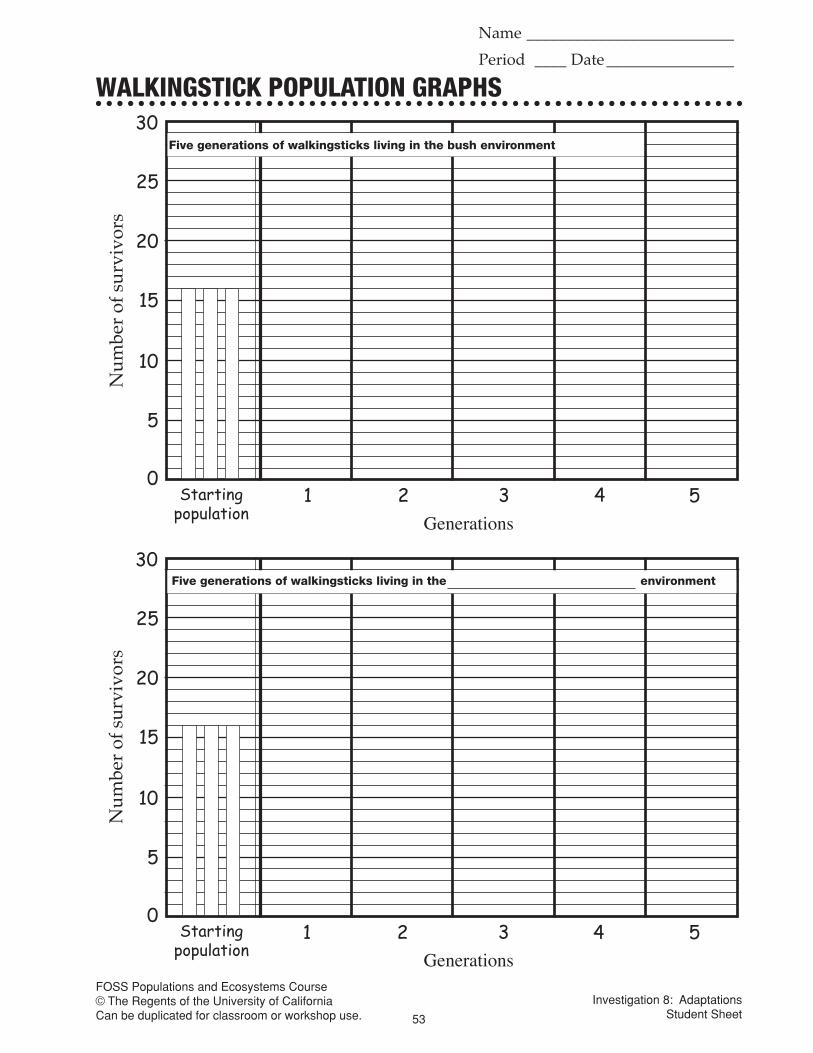
WALKINGSTICK POPULATION GRAPHS
Investigation 8: AdaptationsStudent Sheet
Generations
Startingpopulation
1 2 3 4 5
Num
ber
of s
urvi
vors
0
5
10
15
20
25
30Five generations of walkingsticks living in the environment
Generations
Startingpopulation
1 2 3 4 5
Num
ber
of s
urvi
vors
0
5
10
15
20
25
30Five generations of walkingsticks living in the bush environment

54

FOSS Populations and Ecosystems Course© The Regents of the University of CaliforniaCan be duplicated for classroom or workshop use. 55
○ ○ ○ ○ ○ ○ ○ ○ ○ ○ ○ ○ ○ ○ ○ ○ ○ ○ ○ ○ ○ ○ ○ ○ ○ ○ ○ ○ ○ ○ ○ ○ ○ ○ ○ ○ ○ ○ ○ ○ ○ ○ ○ ○ ○ ○ ○ ○ ○ ○ ○ ○ ○ ○ ○ ○ ○ ○ ○ ○ ○
GENETICS VOCABULARY
The offspring of organisms often grow up to look like one or both of their parents. This isbecause offspring inherit information from their parents that directs their development.
The inherited information is located in the of every cell in the organism. The
information is coded in the huge molecule. The huge molecules are coiled into
compact hot dog–shaped structures called . are always
present in almost identical pairs. Locations on chromosomes that affect features of
organisms are called . A gene is composed of .
An organism’s unique combination of genes is its . The traits produced
by an organism’s genes is its . Alleles that have more influence in
determining traits are alleles. Alleles that have less influence in determining
traits are alleles.
Name __________________________
Period ____ Date ________________
Investigation 9: Genetic VariationStudent Sheet

FOSS Populations and Ecosystems Course© The Regents of the University of CaliforniaCan be duplicated for classroom or workshop use. 56
○ ○ ○ ○ ○ ○ ○ ○ ○ ○ ○ ○ ○ ○ ○ ○ ○ ○ ○ ○ ○ ○ ○ ○ ○ ○ ○ ○ ○ ○ ○ ○ ○ ○ ○ ○ ○ ○ ○ ○ ○ ○ ○ ○ ○ ○ ○ ○ ○ ○ ○ ○ ○ ○ ○ ○ ○ ○ ○ ○ ○
LARKEY BREEDING RECORD
Immigrant male
Generation
GenotypePhenotypeMale
PGeneration
GenotypePhenotypeFemale
P
Generation
GenotypePhenotypeMale
Generation
GenotypePhenotypeFemale
Generation
GenotypePhenotypeMale
Immigrant male
Generation
GenotypePhenotypeMale
Generation
GenotypePhenotypeFemale
Generation
GenotypePhenotypeMale
Investigation 9: Genetic VariationStudent Sheet
Generation
GenotypePhenotypeFemale
Generation
GenotypePhenotypeMale
Generation
GenotypePhenotypeMale
Immigrant male