Embed Size (px)
Citation preview

1-1
ACTIVITY 1ACTIVITY 1ACTIVITY 1ACTIVITY 1ACTIVITY 1
Exploring LEDs and Lamps
GoalIn this activity, you will explore the effect of changing the energy suppliedto incandescent lamps and light emitting diodes, then look for similaritiesand differences among the different light sources.
Matter emits light through various processes that transform other forms of energy intolight. For example, a flame from a candle or fireplace during the burning process emitslight. The incandescent lamp — a light bulb — is a standard light source that is recogniz-able by its characteristic shape and appearance. The light bulb contains a solid tungstenfilament that emits light when energy is provided by an external energy source such as abattery or electrical power plant.
? Examine the incandescent lamp that you have been provided. Draw the locationof the filament and wires inside the lamp.
Voltage is a measure of energy being supplied to an electrical device like an incandescentlamp. Although household incandescent lamps typically require a high voltage to oper-ate, incandescent lamps such as the one that you have been supplied operate with lowvoltages from a battery.
Another modern light source that requires low voltages is the light emitting diode (LED).LEDs are typically used as on/off indicator lights in electrical appliances such as televi-sions, VCR’s, video cameras, computers, and stereos. They are also used to displaynumbers in some alarm clocks, radios, and microwave ovens. Another use is very largevideo displays at sporting events and concerts. For example, the music group U2 duringits 1997 POPMART tour was using a 56 feet x 170 feet video screen consisting of LEDs. Inthe 1997 movie, Batman & Robin, the Mr. Freeze costume worn by ArnoldSchwarzenegger consisted of 3,800 blue LEDs to illuminate his appearance. The lowvoltage requirements needed to operate LEDs as well as their small size and mass makethem an attractive light source to use for these applications.
Name: Class:
SOLIDS LIGHT & Visual Quantum MechanicsVisual Quantum MechanicsVisual Quantum MechanicsVisual Quantum MechanicsVisual Quantum Mechanics
Kansas State University
@2001, Physics Education Research Group, Kansas State University. Visual Quantum Mechanics issupported by the National Science Foundation under grants ESI 945782 and DUE 965288. Opinionsexpressed are those of the authors and not necessarily of the Foundation.

1-2
Examine the LEDs that you have been provided. Notice that the two connecting wireshave different lengths. These connecting wires are connected to the chip by very thinwires inside the LED.
In this first activity, we will connect lamps and LEDs individually to an electrical energysource and investigate the effects of changing the amount of electrical energy suppliedto them. The apparatus uses a small battery as an energy source. The amount of energyreaching the lamp or LED is controlled by a potentiometer — a small rectangular devicewith a screw on one end. Turning this screw changes the energy going to the lamp orLED in the sockets. The apparatus used for these measurements are shown below.
Check the apparatus by inserting the incandescent lamp in its socket and connect thebattery to the battery clips. Adjust the meter in the circuit so that it will have a range ofabout 0 - 9 Volts, and it will measure voltage. The incandescent lamp should come onand the meter displays the voltage. If not, turn the screw on the potentiometer in thecounterclockwise direction until the light comes on. If the lamp still does not emit light,check the connections or ask the instructor to help.
A diagram of the inside of an LED is shown in Figure 1-1. The chip at the heart of theLED consists of two different solid materials that have been joined together. It is sur-rounded by a transparent, hard plastic that protects the LED from vibration and shock.The LED is constructed in such a way that the light emitted by the chip is reflected offthe base it sits on and is focused through the top of the LED. Thus, the light is bright-est at the top of LEDs.
Figure 1-1: Schematic Diagram of an LED

1-3
To vary the energy supplied to the incandescent lamp turn the knob of the potentiometerby using the tiny screwdriver. Either end of this screwdriver can be used. However, theend where the blade of the screwdriver is recessed in a cavity is easier to use. Thediagram below shows how to increase and decrease the energy.
The voltage measured by the meter is directly related to energy, so we will use it in theobservations. As you vary the voltage record your observations about the change in theemitted light. When you have finished, you should be able to answer the followingquestions.
? What is the color of light emitted by the lamp?? How does the color of light change with voltage?? What is the voltage when the lamp barely emits light, called threshold
voltage, and the voltage at maximum brightness?? How does the brightness of the lamp change with voltage?
? In the space provided below, record your measurements, observations and an-swers to the questions.
Remove the incandescent lamp from its socket and place an LED assigned by yourinstructor in the LED holder.
With the LED in the circuit adjust the potentiometer to vary the energy supplied to theLED. Measure the voltage for the LED. Again when you are finished you should answerthe following questions:
? What is the color of light emitted by the LED?? If the color of light changes with voltage, how does it change with voltage?

1-4
In the space provided below, record your measurements and observations. (If the LEDdoes not come on for any voltage, record that information and continue to the nextexperiment.)
Remove the LED from the circuit and reverse its connection to the socket. Repeat takingvoltage measurements for the LED by focusing on the same four questions as before.
In the space provided record similarities to and differences from the previous investiga-tion.
After everyone has completed the investigation, each group should share its results withthe class. The resulting discussion should allow you to make a class table that illustratesthe threshold voltage and voltage that results in maximum brightness for the incandes-cent lamps and LEDs in order of increasing voltage.
? What are the threshold voltage of the LED and the voltage at maximumbrightness?
? How does the brightness of the LED change with voltage?
thgiLforoloCDELybdettimE )V(egatloVdlohserhT )V(egatloVmumixaM
ecruoSthgiL )V(egatloVdlohserhT )V(egatloVmumixaM

1-5
Based on the results recorded by all groups, answer the following questions:
? What patterns do you see in the observations?
? How is the incandescent lamp similar to the LEDs?
? How is the incandescent lamp different from LEDs?
From our investigations, we found that the LEDs emit individual colors of light withdifferent threshold voltages. Christmas lights are also examples of light sources thatemit individual colors of light.
Examine one of the Christmas lights furnished by your instructor. Don’t remove thelights from their sockets. The leads have a tendency to break off very easily.
? In the space provided below, describe the physical features of these Christmaslights by concentrating on what you can see inside the lamp.
Connect a Christmas light to the apparatus by using the terminals that are used for thevoltmeter. Then, adjust the potentiometer to vary the voltage applied across the Christ-mas light. When finished answer the following questions:
? What is the color of light emitted by the Christmas light?? If the color of light changes with voltage, how does it change?? What are the threshold voltage of the Christmas light and the voltage at
maximum brightness?? How does the brightness of the Christmas light change with voltage?

1-6
? In the space provided below, record your measurements, observations and an-swers to these questions.
? Compare your results with others in the class by recording threshold voltage foreach color of light.
? Based on your observations of the Christmas lights, make a prediction on whetherthe lights are incandescent lamps or LEDs. Explain your reasoning.
A final comparison between the LEDs and Christmas tree lights involve their colors.Summarize the similarities and differences in the color of light emitted by consideringthe following questions:
? Can you determine the color that will be emitted before you turn on a Christmastree light and an LED? Why or why not?

1-7
Homework Question:
Traffic lights emit their characteristic red (stop), yellow (caution), or green (go)light. Based on your observations and what you have learned, can you determineif traffic lights are incandescent lamps or LEDs? If yes, explain how. If not, de-scribe an experiment that could make the determination (even if you cannot do theexperiment).
? What property of the light source seems to determine the color?
Christmas lights, like LEDs, emit individual colors of light. However, all other physicalproperties of Christmas lights are similar to incandescent lamps. Incandescent lampstypically emit “white” light but can produce individual colors of light when a coloredfilter or coating is used. Christmas lights are examples of tiny, incandescent lamps thatproduce color due to colored coating found on the glass surrounding the tungstenfilament. LEDs, unlike Christmas lights, emit various colors of light not as a result of thefilament and a colored filter but as a result of a different process that we will learn moreabout in future activities. In the next activity, we will continue to investigate the physicalproperties of LEDs and compare these properties with an incandescent lamp and an-other light source – the gas lamp. This exploration may answer some of your questionsand will certainly raise others.


2-1
ACTIVITY 2
Exploring Light Patterns
GoalWe will continue to investigate the properties of LEDs and the incandes-cent lamp by observing and exploring the light patterns emitted by somedevices.
In the previous exploration we saw that incandescent lamps and LEDs have quite differ-ent properties when the energy supplied to them is varied. Further, LEDs that look alikeon the outside can emit different colors of light, even though they are not painted anycolor. Thus, the LED, a rather recent invention, acts quite differently from ordinary lamps.Our goal for this series of activities is to understand how these devices work. To accom-plish this understanding we need to learn about the emission of light by atoms. Becausewe cannot see atoms as they emit light, we will need to build a conceptual model of whatis happening at the atomic level and use this model to understand LEDs.
The LED is made up of a very small solid consisting of a large number of atoms whichare closely packed together and interact with one another in a complex manner. Whenenergy is supplied to the LED, these complex interactions result in the light emittingproperties that you have seen. In these solids each atom is very close to its neighbors.Just as with closely spaced people the nature of the interactions can be difficult to under-stand at first. Thus, we will begin with atoms that are far away from each other; studyhow they emit light and then work back to a situation where atoms are close together.
Atoms are relatively far apart in a gas. In fact, one of the defining properties of a gas isthat the atoms or molecules have only a few interactions with each other. So, we willsupply electrical energy to gases confined in a tube. These gas lamps, which are some-what similar to fluorescent tubes, will emit light. By investigating this light we will beable to build a conceptual model of how gas atoms emit light. We will then extend thismodel to the closely spaced atoms in a solid and, thus, to LEDs.
Name: Class:
SOLIDS LIGHT & Visual Quantum MechanicsVisual Quantum MechanicsVisual Quantum MechanicsVisual Quantum MechanicsVisual Quantum Mechanics
Kansas State University
@2001, Physics Education Research Group, Kansas State University. Visual Quantum Mechanicsis supported by the National Science Foundation under grants ESI 945782 and DUE 965288.Opinions expressed are those of the authors and not necessarily of the Foundation.
2-2
In our investigations we will be particularly interested in the energy of the lightemitted by the gas. Two factors — brightness and color — contribute in very differ-ent ways to the energy of a light. When we think about the definition of energy, thebrightness makes sense. A bright light has more energy in it than a dim light. Thisconclusion matches the observation from the first activity — as we increased theelectrical energy supplied to the lamps, they became brighter.
The color connection is not quite so obvious. Atoms emit light in small packets ofenergy . These packets are called photons. Each individual photon contains anamount of energy that is related to its color. So, if we wish to discuss the energy ofone of these photons, we need to know its color.
For light that we can see the energy ranges from red at the low energy to violet atthe high-energy end. Not visible but still a form of light are infrared photons withan energy lower than red and ultraviolet photons which have energies higher thanviolet. The order of energies for the various colors of photons is shown below.
Low energy photons: InfraredRedOrangeYellowGreenBlueViolet
Higher energy photons: Ultraviolet
Each time an atom produces light, it emits one photon. Thus, in our investigationswe will be primarily interested in the energy of individual photons. As we will see,this energy will tell us something about the atoms of a material. Thus, the color ofa light will be an important variable. Each photon of visible light carries a verysmall amount of energy. This energy ranges from about 2.56 x 10⁻¹⁹ Joules for redlight to 4.97 x 10⁻¹⁹ Joules for violet. Using these very small numbers is inconve-nient, so we will use different units – the electron volt (eV). In these units, visiblelight energies range from about 1.6 eV (red) to 3.1 eV (violet) – much easier num-bers to deal with.
The brightness of the light is related to the number of photons emitted. A dim lightwill emit fewer photons than a bright light. Thus, we have two measures of energy— brightness and color. Because color is related to the light from each individualatom, we will concentrate on it.
Most light is composed of several different colors. To separate the colors we use aspectroscope. Inside the spectroscope you will see each of the colors which arepresent in the light. If you look at white light through a spectroscope, you will seeall of the colors of the rainbow. Other light will have fewer colors. This display ofcolor is called a spectrum.

2-3
Some spectroscopes provide scales directly in eV. Others show measurements in na-nometers (nm) or Ångstroms (Å). If yours uses one of these units, recording your obser-vations on the scales provided on the following pages will enable you to determine theenergy value in eV directly.
Caution: (1) Some power supplies for gas tubes have exposed metal con-tacts. Because the gas lamp is a high voltage light source, donot touch the metal contacts that connect the gas tube to thepower supply.
(2) Never look at the sun or a tanning lamp with a spectroscope.Eye damage may occur from brightness and from high energyultraviolet photons.
On the following scales, draw the pattern of emitted light observed with the spectroscopefor three gas lamps.Hint Use colored pencils or markers to indicate the position of color(s).Add a written description to record which colors seem bright
Hint To ensure that the light patterns are clearly visible, position the vertical slit of the spectrometer(found on the end with a screen) so that it is directly facing the light source and, if possible, holdthe spectrometer less than a foot away from the light source. Dim the lights of the room so that thelight patterns may be seen. The room, however, should be lighted enough for the energy scale to beseen.
Light Patterns Emitted by Gas Lamps
Hydrogen or __________________:
Color of the light without spectroscope___________
Helium or ____________________:
Color of the light without spectroscope___________

2-4
Mercury or ___________________:
Color of the light without spectroscope___________
In the table below record the color of light emitted by each gas lamp that is related to thegreatest and least energy per photon.
? How can you tell which particular color of light emitted by each gas lampresults in the greatest number of photons emitted?
In the table below record the color(s) of light for which the greatest numbers ofphotons are emitted by each gas lamp.
Gas Greatest Energy Least Energy
Gas Greatest Number of Photons

2-5
? In terms of the color, intensity, and patterns of light emitted, how is the incandes-cent lamp similar to the gas lamps?
? How are they different?
? What are the similarities among the light patterns observed for the various gases?
? What are the differences?
Now use the spectroscope to observe the light pattern emitted by the clear incandescentlamp. Connect the incandescent lamp to the circuit that you used in Activity 1 (SeeFigure 1-2) but without the use of the voltmeter. We will observe the light emitted by theincandescent lamp with the spectroscope when it is at maximum brightness.
? On the following scale, draw the pattern of emitted light observed with the spec-troscope for the incandescent lamp. Use colored pencils or markers to indicatethe position of observed colors. Add a written description to indicate any colorsthat are brighter or dimmer than others do.
Light Emitted by the Clear Incandescent Lamp

2-6
Now look at the spectra of one colored incandescent lamp as assigned by your teacher.Record the spectrum below and indicate the portion of the spectrum with the brightestlight.
Color of light ________________.
The pattern of light emitted by gas lamps is called a discrete spectrum. These lightpatterns appear as a limited number of bright lines of certain colors. The pattern of lightobserved for the incandescent lamp is called a continuous spectrum for its broadpattern of various colors with no dark regions.
Reduce the brightness of the incandescent lamp by using the potentiometer and thetrimmer tool.
? What do you notice about the color of light that is emitted as you reduce thebrightness to the point where light is barely visible?
Use the spectroscope to observe the light emitted by the lamp when the brightness isreduced.
? How is the resulting spectrum similar to what you observed before?
? How is the resulting spectrum different from what you observed before?
? Which situation - when the incandescent lamp is bright or dim - results in thegreatest number of photons emitted?

2-7
? Which situation results in the emission of a larger number of high-energy pho-tons? Explain how you reached your answer.
We will now compare the spectrum emitted by the LED to those emitted by the gas lampsand the incandescent lamp. Carefully remove the incandescent lamp from the circuit andinsert the LED that is assigned to you by your instructor. Recall the appropriate mannerin which to connect the LED to the circuit so that it will emit light. The best way to observethe light spectrum emitted by the LED is to look at the top of the LED down from above.Recall that the LED focuses light through the top.
Spectrum emitted by a _______________ LED.
After everyone has completed the investigation, each group should share its results withthe entire class. The resulting discussion should focus on the following questions.
Compare your observations for LEDs and incandescent lamp with other students wholooked at different colors of light sources.
? How are they similar?
? How are they different?

2-8
Summarize the results of the class’s observations of the incandescent lamp.
Summarize the results of your observations of the light emitted by each source, theirspectra and their physical characteristics by completing the table below with the differ-ences and similarities among the three light sources.
Summarize the results of the class’s observations of the LEDs by completing the tablebelow.
LED Color(s) of Light ObservedEnergy (in eV) of
Brightest Light Observed
Light Source Gas Lamps Incandescent Lamps LEDs
Gas Lamps
IncandescentLamps
LEDs

2-9
As we stated above, gas atoms have fewer interactions than atoms in solids. The spectrafor gases show only a few energies while the spectra of solids contain a large number ofenergies. This observation is a hint that light emission from gases might be less complexthan emission from solids. So, we will concentrate on gases in the next activity.
Homework Questions:
Use the spectroscope to observe the light emitted by the fluorescent lights. Notice thatthe fluorescent lights emit complex spectra that consist of bright lines of several ener-gies and a continuous spectrum. The continuous spectrum is a result of high-energylight interacting with the coating found inside the lights. Based on what you have ob-served in this activity, what do you think is responsible for the discrete spectrum?
Identify the gas that creates this spectrum.
How do you know?
Spectra can be considered the fingerprints of matter. It allows us to identify not only thematerial found in artificial light sources but also natural ones like the sun and other stars.We will focus on this procedure in a later activity.


3-1
ACTIVITY 3
Introducing Energy Diagrams for Atoms
GoalNow that we have explored spectral properties of LEDs, incandescentlamps, and gas lamps, we will build a model that can be used to explainthese observations. This model will be applied first to explain the spectralproperties of gas lamps.
Observations of Light
In the previous activities we observed somewhat different patterns of light emitted by thedifferent types of light sources. We see one difference by just looking at the various lightsources. The gas lamps and LEDs are made of clear material yet they emit light of differ-ent colors. For the gas lamps the color depends on the type of gas in the tube. For LEDs,the color comes from a process that we will study later. The incandescent lamps, such asChristmas tree lights, are different; the color is contained in the glass surrounding thefilament. Understanding these differences is one of our goals.
Another difference appears when we view the spectra. Both the LEDs and incandescentlamps display parts of a continuous spectrum. Their color determines which part of thespectrum is emitted. Gas lamps are different. Each of them emits only certain colorsresulting in a spectrum that we call discrete.
In all cases matter inside the lamp emits the light. This material is made of atoms. So wemust learn something about atoms to understand the emission of light.
The attraction between the electrons and nucleus means that energy in the form of elec-trical potential energy is stored in the atom. In addition the electron’s motion contributeskinetic energy. So, each electron has a total energy that is equal to its kinetic energy plusits electrical potential energy.
Electrical potential energy occurs for attraction (opposite charges) and repulsion (samecharges). To distinguish these two situations we use positive and negative numbers. Thepositive numbers indicate potential energy associated with repulsion, while negative num-bers go with attraction. Because we will work with attraction, we will be using negativepotential energies.
Name: Class:
SOLIDS LIGHT & Visual Quantum MechanicsVisual Quantum MechanicsVisual Quantum MechanicsVisual Quantum MechanicsVisual Quantum Mechanics
@2001, Physics Education Research Group, Kansas State University. Visual Quantum Mechanics issupported by the National Science Foundation under grants ESI 945782 and DUE 965288. Opinions expressedare those of the authors and not necessarily of the Foundation.
Kansas State University

3-2
To get the total energy we add kinetic energy (a positive number) and potential energy (anegative number). For an electron in an atom the result for the total energy will alwaysbe negative. The idea of a negative energy may seem strange at first. To get an idea of itsmeaning consider an electron which is not attached to an atom, not near any other elec-trical charges, and is not moving. It is interacting with nothing and not moving, so it haszero potential energy, zero kinetic energy and zero total energy.
If this electron is attached to an atom, its energy becomes negative. The magnitude of theenergy must be added to the electron to get it back to zero energy — to get it to be nolonger attach to an atom and not moving.
For example, suppose we know that an electron has an energy of -13.6 eV. From thisinformation we know that
· the electron is attached to an atom, and· to get the electron completely free from that atom we must give it 13.6 eV of
energy.
Thus, the negative total energy can convey some valuable information about the elec-trons.
? Which energies below indicate that the electron is attached to an atom?
-1 eV 0 eV 18 eV -8.6 eV
? For each of the energies below indicate how much energy you must add to get theelectron free from the atom.
-3.4 eV -54.4 eV -11.5 eV
? An electron has an energy of -4.6 eV. An interaction occurs and it loses 5.1 eV ofenergy. What is its new energy?
? Is it still attached to the atom? Explain your answer.

3-3
? An electron is attached to an atom and has a total energy of -8.9 eV. Kevin adds12.0 eV to this atom. What will be the electron’s new energy?
? Will it be moving? Explain your answer.
A useful way to describe the energy of electrons in an atom is to use an energy diagram.The diagram plots the electron’s energy on the vertical axis of a graph. We simply draw aline at the energy of the electron. As an example the diagram in Figure 3.1 represents anenergy of -3.4 eV.
Figure 3.1: An energy diagram for an electron with -3.4 eV of energy.
In this scheme the horizontal axis has no particular meaning. We are only dealing withone variable — the electron’s energy. We could just draw dots on the energy axis, butlines are easier to see.
In our studies we will always be interested in electrons that are attached to atoms. So,we place zero energy at the top of the diagram and do not include positive energies.
Changing Energies — Transitions
To emit light an electron must change its energy. This statement reflects conservation ofenergy.
Electron energy before = Electron energy after + Light (photon) energy

3-4
Figure 3.2 (a) Before the emission of light the electron has an energy of -0.85 eV.(b) After the emission of light the electron has an energy of -3.40 eV and a photonof 2.55 eV has been emitted.
The diagrams show the before and after pictures for the electron’s energy and indicatethat a photon was emitted. To simplify our drawings we generally combine all of theinformation onto one graph as in Figure 3-3.
Figure 3-3 The interaction that was shown in the previous figure but combinedonto one graph.
Each time an electron decreases its energy it emits one photon. Thus, by looking at theenergy of photons we can learn about what is happening in an atom. From what we cansee (light) we infer about what we cannot see (the atom). This process allows us to buildmodels of the atom.
We will use energy diagrams to indicate the changes in the electron’s energy. The pro-cess is shown in Figure 3.2
0 eV
-1 eV
-2 eV
-3 eV
-4 eV
(a)
0 eV
-1 eV
-2 eV
-3 eV
-4 eV
(b)
Photon with energyof 2.55 eV (green)
-1 eV
-2 eV
-3 eV
-4 eV

3-5
The arrow in Figure 3-3 indicates that electron changed from an energy of -0.85 eV to anenergy of -3.40 eV. The sketch above the energy diagram represents what we would seein a spectroscope when the photon is emitted. (One photon is too few to see but it isrepresentative of the energy.)
The process during which an electron changes energy is called transition. Thus, Figure 3-3 represents a transition from -0.85 eV to -3.40 eV.
Draw an energy diagram which represents a transition from -2.3 eV to -4.6 eV.
0 eV
-1 eV
-2 eV
-3 eV
-4 eV
-5 eV
The energy diagram below has four possible energies for the electron. Indicate all transi-tions that could occur.
0 eV
-2 eV
-4 eV
-6 eV
-8 eV
-10eV

3-6
? Determine the energies of the photons for each transition.
Another type of transition involves the electron gaining energy rather than losing it.Sketch a diagram which indicates that an electron changed from -3.47 eV to -1.1 eV.
? Speculate about what type of process could cause such a transition. Explain youranswer.
An Energy Model for the Atom
The energy diagram provides us with a way to understand some of the processes in theatom. You will use it to understand the various spectra that you have observed. In theprocess you will learn why, in terms of energy, the spectra of incandescent lamps, LEDs,and gas lamps are different from each other. You will also learn how gas lamps and LEDscan emit certain colors even though they are clear. The first step is to build an energymodel of an individual atom. That is the topic of the next activity.
-4 eV
-3 eV
-2 eV
-1 eV
0 eV
3-7
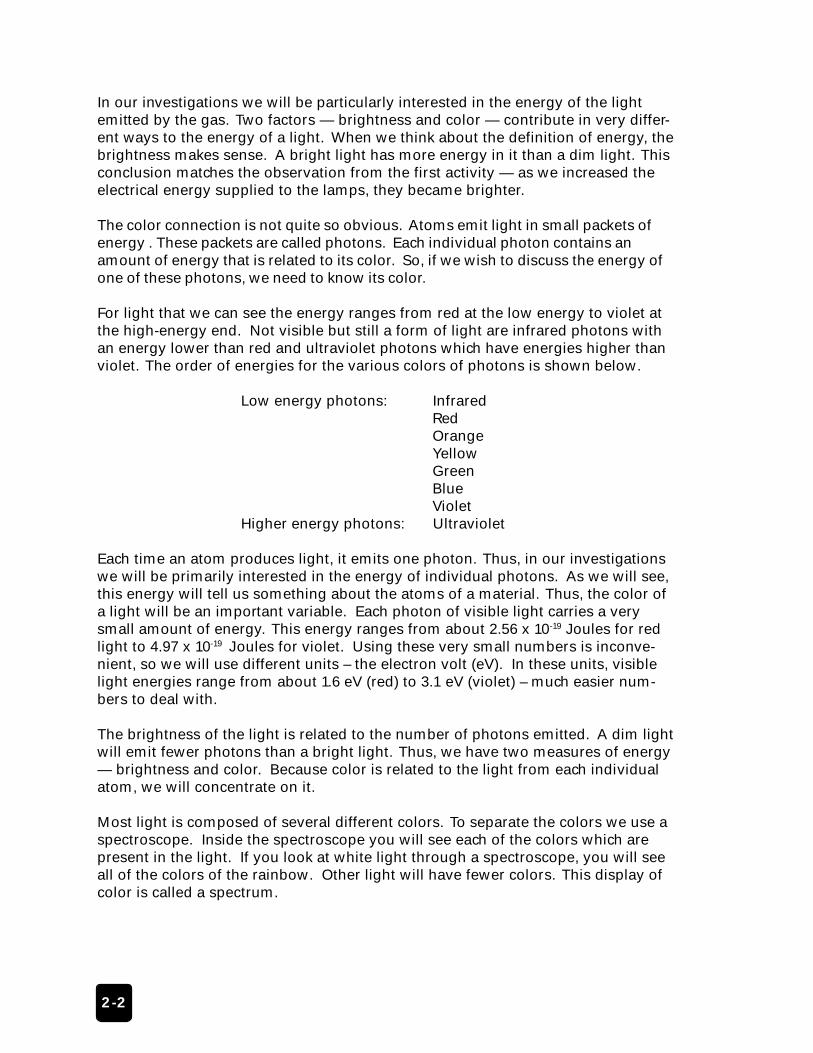
Application Question
The energy diagram below represents a set of energies for an atom.
? What electron transition(s) can exist?
? For the electron transition(s), what are the resulting energies of the emitted light?
? What are the colors of light associated with these electron transitions?
0 eV
-.5 eV
-1.0 eV
-1.5 eV
-2.0 eV
-2.5 eV
-3.0 eV
-3.5 eV

4-1
@2001, Physics Education Research Group, Kansas State University. Visual Quantum Mechanics issupported by the National Science Foundation under grants ESI 945782 and DUE 965288. Opinionsexpressed are those of the authors and not necessarily of the Foundation.
Kansas State University
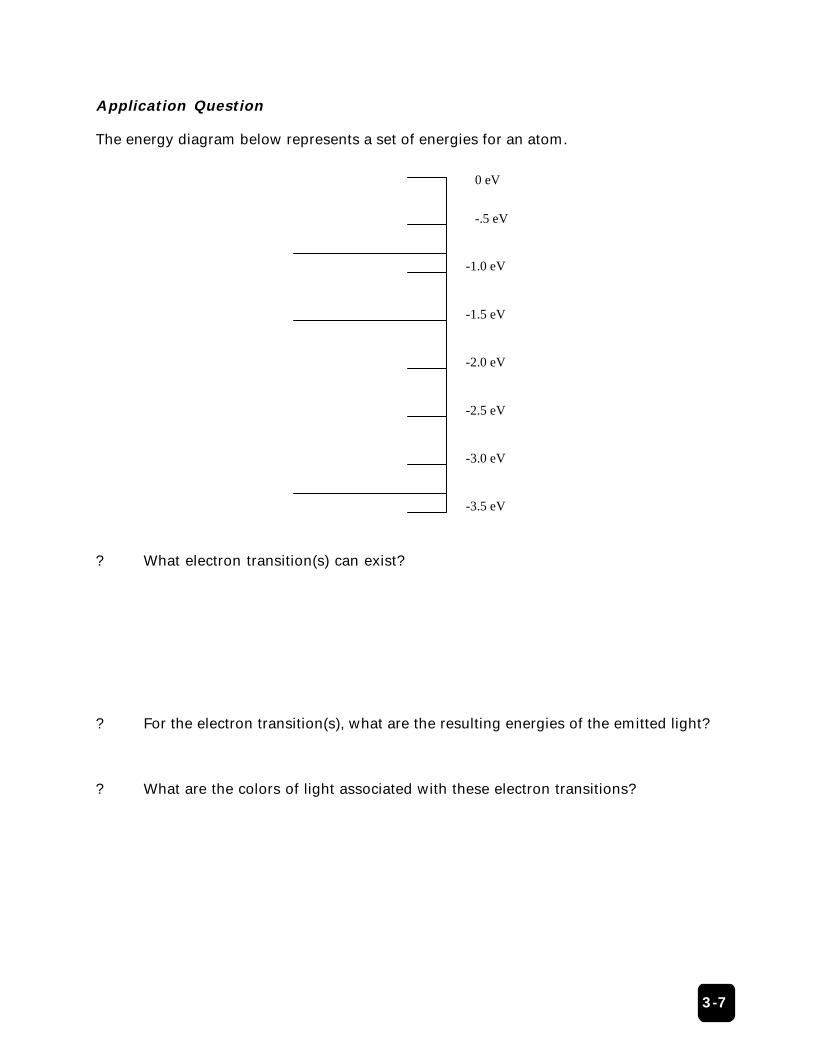
ACTIVITY 4
Understanding the Spectra Emittedby Gas Lamps
GoalYou will use your observations of gas spectra to build a model of ener-gies in an atom.
In the last activity, we learned that an electron in an atom loses energy equal to the differ-ence between two energy values. The energy lost by the electron appears in the form oflight. The energy difference determines the energy and, thus, the color of light emitted bythe atom.
We will now use Spectroscopy Lab Suite to see how the spectra of light emitted bygases can help us understand more about the energies in an atom.
In Spectroscopy Lab Suite, select Emission under Gas Lamps. Figure 4-1 shows thescreen that appears. In this program, we can
Select a gas tube and drag it to the socket that is just above the lamps.Some of the light in the spectra for that gas will appear at the top of thescreen.
Add energy levels for an electron in a potential energy diagram by usingthe Add Energy Level button.
Move the energy levels by selecting them at the left of the vertical energyscale and dragging them to the desired position.
Create transitions (represented by vertical arrow) by selecting theelectron’s initial energy on the right of the energy scale. (It turns green.)Drag the transition arrow to the electron’s final energy. When you reach thefinal energy, it will turn green.
Name: Class:
SOLIDS LIGHT & Visual Quantum MechanicsVisual Quantum MechanicsVisual Quantum MechanicsVisual Quantum MechanicsVisual Quantum Mechanics

4-2
This process will enable you to create an energy level model of the lightemitting process in an atom. From the results you will be able to learnabout energy levels in atoms. A colored spectral line on the screen abovethe potential energy diagram will indicate the light emitted by the transition.If the light is not in the visible region of the spectrum, it will not appear onthe screen.
Move any of the energy levels after you have created a transition. Beginwith hydrogen. Follow the procedure on the previous page to place thehydrogen gas tube in the socket. Some of the spectral lines for hydrogenwill appear in the top spectrum.
Figure 4-1: Gas Lamp Spectroscopy Computer Program
Begin with hydrogen. Follow the procedure on the previous page to place the hydrogengas tube in the socket. Some of the spectral lines for hydrogen will appear in the topspectrum.
Create energies and a transition that will match one of the spectral lines of hydrogen. Thespectrum that you create appears on the lower spectrum.
? How many energy levels are needed to create one spectral line?

4-3
? What is the energy of the spectral line as indicated by the eV scale?
? List the values of the energies that you created.
? What is the difference in energy between the electron’s initial total energy and itsfinal total energy?
? How is this energy difference related to the energy of the light emitted by theatom?
Move the energy levels up or down but keep the difference in energy between theelectron’s final and initial energy levels constant.
? Why does the spectral line stay at the same energy?
Now create and move energy levels until the bottom spectrum matches the spectrum ofhydrogen as shown in the top spectrum.
Sketch the resulting energy level diagram for hydrogen in the space below.
? How many energy levels are needed to create these three spectral lines?
? How many electron transitions are needed to create these three spectral lines?

4-4
? What other, if any, possible electron transitions can take place with the energylevels illustrated on your screen?
Compare your energy diagram with the diagrams created by other students.
? How are they similar?
? How are they different?
At this time none of the energy diagrams is more right or wrong than the others. We donot have enough information to distinguish exactly what transitions or initial and finalenergies occur in nature. Our model is limited by the knowledge that we have. Thus, allsets of energies and transitions that reproduce the spectrum are equally correct. (Scien-tists have more information to help distinguish the various possibilities, but that is notneeded for our purposes.)
We can create energy diagrams that provide all of the spectral lines rather easily. Weneed only a few energies to have sufficient transitions for all of the visible light. Fromthis construction we conclude that an electron in an atom can have only a few energies.Otherwise we would see light of many more colors. This conclusion is somewhat sur-prising. When an electron moves in an atom, it might seem that the electron could haveany one of many energies. But, nature does not behave that way. Instead electrons inatoms are limited to a very few discrete energies. We call these energies the allowableones.
Repeat the steps to determine the energy levels and transitions necessary to produce thespectral lines emitted by another gas that is assigned by your instructor.

4-5
Sketch the resulting energy level diagram for the second gas in the space below.
? How is the energy level diagram for the second gas similar to the diagram forhydrogen?
? How are they different?
Up to this point, we have learned that light is produced when electrons make transi-tions in atoms. If they have high energy, they naturally lose it in the form of light asthey move to a lower energy level. In a normal situation the electrons will be in a lowenergy level. They must first be given energy to attain high energies so that it cannaturally lose that energy. An external energy source, such as electricity must supplythat energy. This process is illustrated in Figure 4-2.
Figure 4-2: Gain and Loss of Energy by Electrons in an Atom
(a)Electron in lowenergy state
(b)Electron changes toa high energy state
ExternalEnergy
(c)Electron emitsenergy as light
LightEmitted

4-6
? What external energy source was necessary for the gas lamps to emit light? Whatform of energy was supplied?
The larger the external energy provided, the greater the number of electrons that willobtain higher energies. For example, suppose the energy difference between two al-lowed energies is 2.55 eV. See Figure 4-3.
Figure 4-3: Screen capture from the Gas Lamps program.
In other words, 2.55 eV must be supplied by the external source for a single electron tochange from a low energy to a higher one. Supplying a larger amount of external energydoes not change the allowed energies. Recall that the allowed energies for an electronbound to an atom depend on the type of gas atoms found in the lamp. Supplying a largeramount of external energy causes a larger number of electrons to possess the highestallowed energies. Thus, more electrons will make transitions from higher allowed energiesto lower allowed energies that result in the greater emission of photons and brighter light.

4-7
A different situation occurs if the energy supplied to the atom is not equal to the differencebetween energy levels. For the example illustrated in Figure 4-3 no transition will occur ifthe atom receives less than 2.55 eV. If the atom obtains 2.40 eV of energy, it cannot use it.No energy level exists for that transition to occur. If it gets more than 2.55 eV but less than5.10 eV of energy, only one electron can make the transition. When 3.20 eV is available, theelectron can use 2.55 eV and the remaining 0.65 eV will end up as some other form ofenergy.
In hydrogen and helium atoms, unlike the Gas Lamp Spectroscopy computer program, theallowed energies for an electron cannot be changed because the type of atom uniquelydefines them. The values for the energies are determined by electrical interactions betweenthe nucleus and the electrons.
? What differences are there between hydrogen and helium atoms that might ac-count for their electrons having different energies?
The electrical properties of an atom uniquely determine what energies its electrons areallowed to have. So, even though the Gas Lamp Spectroscopy computer program allowsyou to adjust the energies available to the electrons, these energies are fixed at veryspecific values by the electrical properties of the atom.
Because the atoms of each of the elements have a unique set of energies, the light givenoff by a material can be used to determine the type of elements present. This property isused to learn about the composition of distant stars as well as substances on earth.
Homework Problem:
1. Art historians are frequently faced with determining whether paintings are origi-nals or forgeries. Suppose an art dealer who seems a little suspicious has a paint-ing that she claims was painted in 1704. Because of its age she says that it is veryexpensive. However, one of the colors looks remarkably like pigments from cobaltblue. As an art expert you know that blue paint that used the element cobalt wasnot used by artists until 1804. How might you use the ideas presented in thisactivity to determine whether the painting contains cobalt blue?1
1 Adapted from Jacqueline D. Spears and Dean Zollman, The Fascination of Physics, (The Ben-jamin /Cummings Publishing Company, Inc., Menlo Park, CA 1985). Permission granted by theAuthors.

4-8
2. The energy level diagram below represents a possible set of energies for an atom.
a) Construct the spectrum of light emitted by a gas represented by the followingenergy level diagram.
b) Visible light ranges in energy from 1.6 eV (red) to 3.1 eV (violet). How much of theresulting spectrum lies in the visible range?
-1.0 eV
-2.8 eV
-4.9 eV
0 eV
-5.0 eV
5-1
@2001, Physics Education Research Group, Kansas State University. Visual Quantum Mechanics issupported by the National Science Foundation under grants ESI 945782 and DUE 965288. Opinionsexpressed are those of the authors and not necessarily of the Foundation.
Kansas State University
ACTIVITY 5
Applying Spectra and Energy Diagramsto Learn About Stars
GoalNow that we can use energy diagrams to describe the emission of light bygases we will apply this knowledge to see how scientists learn about thecomposition of stars.
The study of spectra in all its forms plays an important role in determining the chemicalmake-up of matter. Spectra can be considered as the fingerprints of matter. Every atomemits its own characteristic spectrum of light. The study of spectra has been an impor-tant tool for scientists to identify the chemical composition of substances isolated inchemical, biological, and astronomical research. For example, the study of spectra fromstarlight showed that the sun and some of the stars are made of hydrogen and helium.Helium was actually discovered in the analysis of solar spectra before it was discoveredon earth. In this activity we will learn how scientists were able to discover helium on thesun even though they had not yet isolated it on earth.
Warning: Never look directly at the sun. To view the sun’s spec-trum place white paper in sunlight. Look at the light reflectedfrom the paper.
The sun, and other stars, produce the light that we see by a process similar to the one usedin incandescent lamps. Material near the surface of the star becomes very hot. Some ofthe energy is emitted as a light.
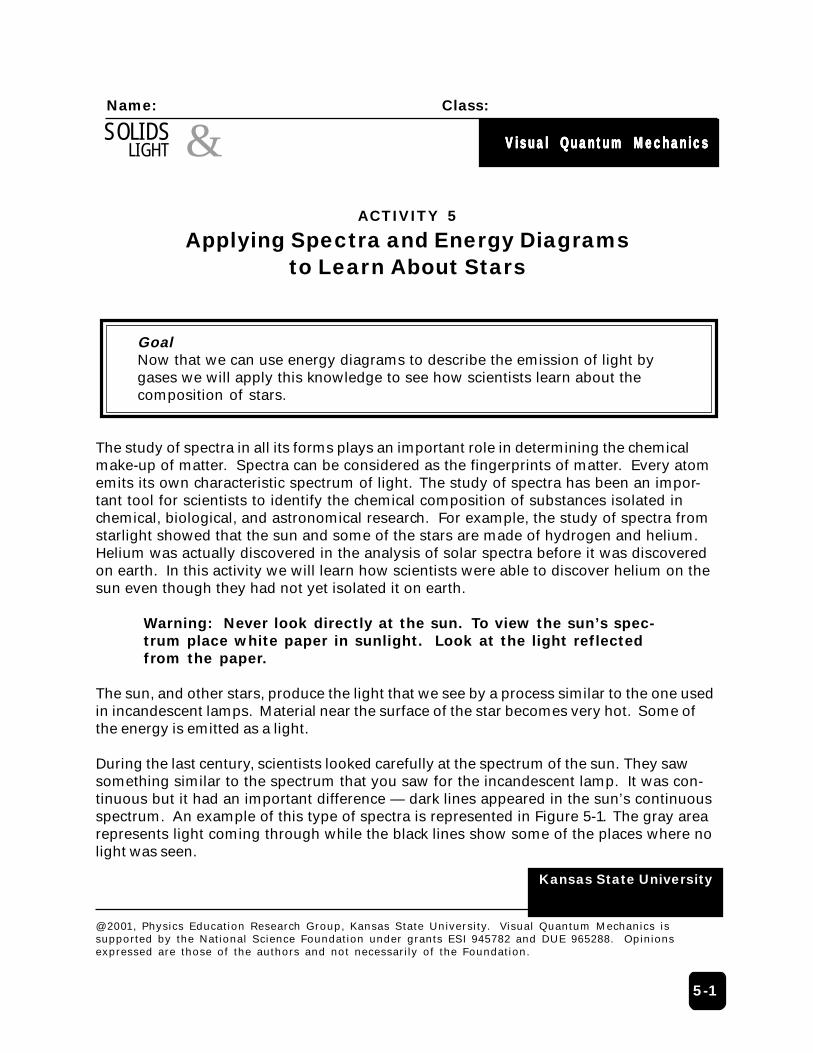
During the last century, scientists looked carefully at the spectrum of the sun. They sawsomething similar to the spectrum that you saw for the incandescent lamp. It was con-tinuous but it had an important difference — dark lines appeared in the sun’s continuousspectrum. An example of this type of spectra is represented in Figure 5-1. The gray arearepresents light coming through while the black lines show some of the places where nolight was seen.
Name: Class:
SOLIDS LIGHT & Visual Quantum MechanicsVisual Quantum MechanicsVisual Quantum MechanicsVisual Quantum MechanicsVisual Quantum Mechanics

5-2
Figure 5-1: Some of the spectrum of a sample star.
While this spectrum is similar to previous ones we have studied, it also has someunique features. As we understand it we will learn that:
These dark lines can be used to identify elements as well as the bright lines in theemission spectra of gases can.
A process that is similar, but not identical to emission creates the dark regions inthis spectrum.
Begin by comparing the dark lines in the solar spectrum with the lines of light from thegases shown in Figure 5-2.
Hydrogen:
Nitrogen:
Figure 5-2: The light emission spectrum of hydrogen and nitrogen.
? What similarities do you see between the hydrogen and nitrogen spectra and thespectrum of the star?

5-3
? Do you think that you see evidence for the presence of hydrogen or nitrogen onthe sun? Explain your answer.
We see a rather close match of the energies in the gas spectra with some of the energiesof the dark lines of the star’s spectrum. These observations are a hint that the processthat produced the dark lines is related to the one that produced light in gases.
A sign which photographers sometimes have on darkroom doors reads “Keep the doorclosed so the dark will not escape.” This joke plays on the idea that dark is the absence oflight (or energy), so it cannot escape. We will use the same idea with the star’s spec-trum. The dark lines are energies that are missing from its spectrum. Each of theseenergies has been removed while other energies are present.
To understand the processes we need to think about energy in the light. In the previousactivity we saw how light is produced by energy changes in atoms. Now think aboutwhat needs to happen for one energy of light to be removed from a beam containing allenergies of visible light.
? Can you use the energy level diagram to describe how a photon of light can beremoved from a beam of light?
A spectrum with dark lines in it is called an absorption spectrum. To help understandhow absorption spectra occur we will use the Spectroscopy Lab Suite computer soft-ware.
In Spectroscopy Lab Suite, select Absorption under Gas Lamps.
Drag the figure of the hydrogen gas tube to the gas lamp socket. Figure 5-3 illustrateswhat should appear on the screen.

5-4
Figure 5-3: A screen from the Spectroscopy Absorption Computer Program
The dark (absorption) lines appear in the spectrum at the top of the screen.
To duplicate this spectrum, create and move energy levels and then put in the transitions.
An absorption transition, unlike an emission transition (which we constructed in theprevious activity) is created by starting with a lower energy level (largest negative energyvalue) and ending with a higher energy level (smallest negative energy value). Notice thatthe arrows that represent the allowed transitions point upward. The arrows point upwardto represent that the hydrogen gas absorbs these energies emitted by the light source. Asa result, electrons acquire enough energy (equal to the difference of the allowed totalenergies) to move up to the higher allowed energies.
Sketch below the energy levels and transitions.

5-5
Once you have completed your diagram compare it to others in your class.
? How are the diagrams similar?
? How are they different?
Now, compare these energy levels and transitions to those of the emission spectrum forhydrogen that you created in Activity 4.
? How are the emission and absorption spectrum different?
Now, use energy considerations to describe how an atom absorbs a photon from a lightsource containing all visible energies.
? Suppose that we create a beam of light that has photons of energies only in regionof 2.0 to 2.4 eV. That beam passes through a tube with hydrogen. Would you seedark lines in the resulting spectrum? Why or why not?
? Suppose this light (2.0 - 2.4 eV) passes through nitrogen. Would the resultingspectrum have dark lines? Why or why not? (The nitrogen spectrum is shown inFigure 5-2.)

5-6
Now that we can use energy levels to explain absorption spectra, we can return to thespectrum of our sample star. In a star a continuous spectrum is created as a result of anextremely hot environment. (More about this process will be discussed in a later activity.)A layer of relatively cool gases surrounds the star. Light emitted by the star passes throughthese gases. Atoms of the gases absorb photons and move from a lower energy state to ahigher one. Then, photons of certain energies are no longer present in the light. Thus, wesee dark lines — the absence of certain energies — in the spectrum of our star.
An important conclusion from this analysis is that absorption spectra can be used toidentify elements in much the same way as emission spectra. 19th Century scientistsused this identification process when they looked at the spectrum of the sun.
? Are both hydrogen and nitrogen present in the gases surrounding the star?
? Do you have any lines that are not accounted for by either hydrogen or nitrogen?
The 19th Century scientists went through this same process. The full solar spectrum hadmany more absorption lines than shown in Figure 5-1. The scientists were able to iden-tify elements that could have absorbed photons associated with almost all of them. Theyeven identified metals such as iron in the gases surrounding the sun. But, when they gotdone, they had some lines that they could not associate with any atom. These lines werethe same ones that you had left over.
They knew that absorption of certain energies meant the presence of a certain type ofatom. But, they had never seen either emission or absorption at these energies. So, anelement not detected (in the 19th Century) on Earth must be in the gases around the Sun.They named the element helium after the Greek word helios, which means sun.

6-1
ACTIVITY 6
Using Spectra to Search for an Earth-like Planet
GoalNow that we can explain why gas lamps emit their characteristic spectraand how absorption spectra are related to emission, we will apply ourknowledge in a science fiction type scenario. The purpose will be toidentify the gases present on a mythical planet and determine whetherconditions similar to earth exist there.
To continue the study of spectra imagine we are a group of scientists in a star ship. Ourjob is to look for planets that might be hospitable for humans. These plants are calledClass M on Star Trek. Lots of planets exist around other stars so it is a big job. If wewere to take the time needed to travel to each one – even at warp speed – and transportdown, we might never finish the job. In fact, we would not want to transport down untilwe knew something about the atmosphere. So we need to investigate the gases in theatmosphere from afar.
Fortunately, we have the perfect tool for learning about the atmosphere without needingto get close to the planet. We can look at the light that passes through the atmosphere ofthe planet and see what energy photons are absorbed by it. The basic arrangement isshown in Figure 6-1.
@2001, Physics Education Research Group, Kansas State University. Visual Quantum Mechanics issupported by the National Science Foundation under grants ESI 945782 and DUE 965288. Opinionsexpressed are those of the authors and not necessarily of the Foundation.
Kansas State University
Figure 6-1: The arrangement of the starship, planet and a nearby star.
Name: Class:
SOLIDS LIGHT & Visual Quantum MechanicsVisual Quantum MechanicsVisual Quantum MechanicsVisual Quantum MechanicsVisual Quantum Mechanics

6-2
? Our starship is equipped with very good spectroscopes. How would this arrange-ment allow us to investigate the elements in the atmosphere of the planet?
The astronomers on our starship team bring data showing the spectra absorbed by theplanet’s atmosphere, as observed through a telescope that has a spectroscope attached.
Our task is to use the recorded spectra and compare them with those of some com-monly known terrestrial gases. Then we can determine what gases are present in theplanet’s atmosphere. The spectra of various known gases are illustrated in Figure 6-2.
Hydrogen:
Helium:
Carbon Dioxide:
Oxygen:

6-3
Ozone:
Nitrogen:
Figure 6-2: The Visible Spectra of Various Gases
? Looking at the list of gases found in Figure 6-2, what other gas(es) or substances,if any, would you add to this list if we were looking for conditions on a planet thatcould support life? Explain.
? Could any of the gases in our list on the previous page be omitted? Why or whynot?

6-4
? Your teacher will give you a copy of the planet’s spectrum. Compare the spectraof the planet’s atmosphere with that of the other gases. Which of these gases arepresent in the planet’s atmosphere? Support your conclusions.
? Are there any gas(es) other than the ones listed above present in the planet’satmosphere? Explain how you reached your conclusion. List the energies of anylight that cannot be accounted for in gases listed on the previous page.
? Based on the information and your analysis describe and justify your conclusionsabout the similarity of this distant planet’s atmosphere and earth’s.
If other solar systems in the universe do contain Earthlike worlds they must have a planetat a distance from a star so that water can exist in liquid form. If the planet is too faraway, it will only contain ice. Too close and all the water will be steam. Planets such asearth are very fortunate to be located where water can exist as gas, liquid and solid.Scientists use the term, “habitable zone” (defined as the planet’s distance from its star inwhich water exists in liquid form rather than as a solid or a gas) in describing the prob-ability of whether conditions could support life. The Galileo space probe launched byNASA passed over Jupiter and found that the atmosphere not only contained hydrogen,neon, helium, and noxious gases such as ammonia and methane but also had higherwinds and less lightning and water than scientists had predicted.

6-5
The Galileo probe also found that Europa, one of Jupiter’s moons, has an icy whitesurface and shows evidence of water and oxygen. Some scientists speculate that thesurface could conceal oceans of water and perhaps some sort of living organisms.Europa was the focus of the science fiction movie, 2010, in which the humans witnessedthe birth of a cosmic event and were given a second chance to reconcile their nationaldifferences. NASA is making plans to possibly send three spacecraft to Europa to deter-mine if it does have a water ocean.
Our neighboring planet, Mars, has also been the focus of science fiction movies like Warof the Worlds and Total Recall. The thin atmosphere of Mars (less than 1% of Earth’s) ismade almost entirely of carbon dioxide with traces of nitrogen and argon. As a result offinding evidence of massive floods, scientists speculate that Mars, now a bone-drysalmon-colored surface, had water 1 to 4 billion years ago. If that is the case, scientistsare optimistic in that one-cell microorganisms may still be surviving or at least fossilevidence may exist somewhere under the Martian landscape.
The Mars Pathfinder spacecraftN ote, was launched by NASA in December of 1996 andarrived on Mars in July of 1997. The project involved the landing of a spacecraft (calledPathfinder) that contains a miniature ground-roving vehicle (called Sojourner) withseveral instruments on board. As Sojourner moved across the surface of Mars at aspeed of 2 feet per minute, the instruments on board identified and analyzed a widevariety of surface materials from the heavily cratered terrain to the ridged plains tochannel deposits. The rover has a life span of about a month while the lander has alifespan of a year. During these times, data will continue to be collected, analyzed, andreported back to Earth. Up to 10 missions are being planned by NASA by 2005, includinga rock-gathering round trip.
One of the instruments is a circular spectrometer that is mounted near the front ofSojourner (See Figure 6-3.). By shooting electrically charged particles at objects on Marsit causes the atoms in the materials to emit energy. The spectrometer records the spec-trum and sends the data back to earth. The instrument not only acquires spectra fromMartian dust, but more importantly, is deployed to distinct rocks where it analyzes thenative rock composition for the first time. The spectrometer determines the chemicalmake-up of surface materials and can find most major elements except hydrogen. Theapproach used is to expose the Martian rock to high-energy particles with a knownenergy and to analyze the resulting energy spectra emitted by the sample.
Figure 6-3: Front View of Spectrometer Mounted on the Rover
Note For more information about the Mars Pathfinder Mission, check out the following web page:http://mpfwww. jpl.nasa.gov/default1.html

6-6
Initial analyses of the spectra from rocks have identified a rock rich in silica — a quartzmaterial found in sand. Such a rock could have been brought to the surface by volcanicactivity or by a meteorite impact. A rock rich in silica could only be formed by repeatedheating in an active crust of a planet. A second type of rock may be andesite - one of themost common types of lava found on Earth. Since some types of andesite only form inthe presence of water, scientists are speculating that Mars may have had water in itsinterior about the same time life began on Earth about 4 billion years ago.
We have learned that spectra can be used to determine some of the properties of theatoms of a gas. The spectrum from each type of atom is unique, somewhat like theuniqueness of human fingerprints. Just as fingerprints can be used to identify people,spectra are used to identify atoms in materials. For example,
· Astronomers determine the elements in a distant star by analyzing itsspectra.
· Crime labs use spectra to match samples of paint on hit-and-run victimsand suspected cars.
· Historians and archeologists use spectra to determine the elements used inpainting and pottery. By knowing when different cultures started usingsubstances containing certain elements they can determine the age andorigin of the object.
· Biologists use spectra to identify the presence and concentration of sub-stances.
These differences in spectra are, in turn, related to the energy levels of electrons in theatoms. These energy levels are related to the interactions between electrical charges.Thus, the spectra and our representation of atoms with the energy diagram are veryclosely related. Much of our knowledge of the universe, ranging from the enormousscale of galaxies to the small scale of atoms, is built on the study of spectra and ourknowledge of the energy transition in atoms.
Planet’s Atmosphere Spectrum
The study of spectra includes energy that is outside the visible region such as infraredand radio (less than 1.6 eV) and ultraviolet and x-rays (greater than 3.1 eV). TheSojouner uses x-ray spectra in many of its analysis.

7-1
Kansas State University
ACTIVITY 7
Using Gas Lamps to Understand LEDs
GoalWith the help of computer programs, we have been able to use the en-ergy level diagram to explain the spectra emitted by gas lamps. We willnow apply what we have learned to explain the spectra emitted by LEDs.
Our study of gas spectra has led us to the conclusion that only certain energy levels canexist in a gas atom. Now, we wish to extend our investigation to solids so that we under-stand how LEDs emit light. As a first step we will explore how we might create a spec-trum similar to that of an LED.
Open the Emission version of the Gas Lamp Spectroscopy computer program and placethe unknown gas tube in the gas lamp socket.
When the unknown is in the socket, you can create your own spectrum by dragging thelines near the top of the screen. Edit the energy values for the computer-generated spectrallines so that the spectrum is similar to the spectrum of one LED that you observed in Activ-ity 2.
Create an energy level diagram for an atom that could produce this spectrum.
In the space below sketch this energy level diagram.
@2001, Physics Education Research Group, Kansas State University. Visual Quantum Mechanics issupported by the National Science Foundation under grants ESI 945782 and DUE 965288. Opinionsexpressed are those of the authors and not necessarily of the Foundation.
Name: Class:
SOLIDS LIGHT & Visual Quantum MechanicsVisual Quantum MechanicsVisual Quantum MechanicsVisual Quantum MechanicsVisual Quantum Mechanics
7-2
Compare your results with other students who observed different LEDs in Activity 2. Theresulting discussion should focus on answering the following questions.
? How are the allowed energies in your diagram similar to the others?
? How are they different?
? How are the energy level diagrams for the LED similar to ones for a gas lamp?
? How are they different?
This exploration shows us that we could get a spectrum similar to that of an LED byhaving several closely spaced energy levels. When we look at the spectrum of an LED,we see a broad spectrum with no dark regions in it. So, atoms in an LED must havemany energy states that are extremely close together. No real gas has the energy levelsto create this type of spectrum. We can create it only on a computer with our “un-known” gas. So, we must look beyond gas atoms to explain the spectra of LEDs. Thisconclusion is not surprising because LEDs are made of small bits of solids.
Solids have many atoms that are close together and interact with each other. Theseinteractions create very closely spaced energy levels. In addition to having energylevels which are very close together, a solid has an extremely large number of levels –literally billions and billions. Because of the large number and the close spacing wetreat each group as a band of energy level. When you tried to match an LED spectrumwith the Emission Spectroscopy program, you created something similar to an energyband with just a few levels. A solid may have several bands of energy. However, onlytwo of the bands are involved in light emissions. (So, it works just like the model youcreated with closely spaced spectral lines.) The band with the highest energy containselectrons that cannot leave the solid but are not firmly attached to any atom. They canmove throughout the solid. This freedom of motion allows these electrons to carry (orconduct) energy through the solid. So, we call this band the conduction band.

7-3
Electrons that have energies in the next lower band are bound to their respective atomsmore strongly and are unable to break free from the atoms. This lower energy band iscalled the valence band. Electrons with these low energies have large negative valuesbecause they require more energy to escape their respective atoms.
Figure 7-1: Energy diagram with a Very Large Number of Solid Atoms
The space between the conduction band and valence band has no allowed electronenergies. This region is called the energy gap.
Now let’s look at how energy bands are related to the spectra of LEDs.
At the beginning of this activity, we used Gas Lamp Spectroscopy to get an idea abouthow the energy level diagram must look to explain the spectrum emitted by an LED. Atthat time we created a pseudo-band by putting several energy levels close together.Now, we will look specifically at the energy bands in LEDs.
In the Spectroscopy Lab Suite software package, select LEDs from the main menu.Figure 7-2 illustrates how the screen should appear and provides basic instruction forusing the program.

7-4
Figure 7-2: LED Spectroscopy Computer Program
Drag the LED assigned to you to the LED socket found on the left of the screen. Thecomputer-generated spectrum emitted by the LED will appear on the top screen.
Click the Add Conduction Band button. A red rectangle that represents the conduc-tion band for the LED should appear near the top of the energy scale.
Click on the Add Valence Band button. A faded-red rectangle that represents thevalence band for the LED should now appear near the bottom of the energy scale.
The broad, orange vertical arrow represents the allowed transitions for electrons as theymove from any energy in the conduction band to any energy level in the valence band.As these electrons make transitions, they emit energy in the form of light.
Place the cursor in the center of one of the bands. The band turns green and a handsymbol appears. You can now change the energy of the band by dragging it up anddown.
Place the cursor on the top or bottom edges of one of the bands. The band turns greenand up-down arrows appear. You can change the range of energies allowed in the band.
As you change the location of or range in a band, you will see the spectrum. Now ma-nipulate the location and range of both energy bands until the spectra described by theenergy level matches.
7-5
After all groups have sketched the energy band diagram for his/her LED, they shouldshare their results with the class. The resulting discussion should focus on answeringthe following questions.
? How is the size of the energy gap related to the color of light emitted by the LED?
? How are the ranges of energies for the conduction and valence bands important?
We are now able to apply energy diagrams to explain the spectra of LEDs. However, tobe successful we needed to extend the concept of individual allowed energies to allowedenergy bands. The spectra emitted by LEDs is the result of electrons making transitionsfrom a number of energy levels in the conduction band to a number of energy levels inthe valence band. The electron transitions that are allowed can range from the highestenergy level of the conduction band to anywhere between the lowest and highest energylevels of the valence band (See A on the left side of Figure 7-3.). Other electronic transitionsthat are allowed can range from the lowest energy level of the conduction band to any-where between the highest and lowest energy levels of the valence band (See B of Figure7-3.). These electronic transitions result in the emission of a broad continuous spectrumthat is concentrated on a particular color (and thus energy) of light. The size of the energygap in solids inside an LED determines the color of light emitted by the LED. Thus, if weknow the spectra of light emitted by an LED we can predict its energy gap.
In the space below sketch the resulting energy band diagram and indicate the range ofenergy values (in eV) for each band and the resulting energy gap.

7-6
Figure 7-3: Ranges of Allowed Transitions for a Solid that Makes Up an LED
Homework Problem:
An LED is created with a semiconductor that has the energy bands and gaps
a) What is the energy gap of the semiconductor?
b) Determine, using the diagram above, the range of energies emitted byelectrons in this solid.
c) Describe the spectrum of visible light emitted by this LED.H int
d) Use the LED Spectroscopy computer program to check your answers.
Hint The range of visible light ranges from 1.6 eV (red) to 3.1 eV (violet).
7-7
Appendix: Conductors and Insulators
If you have studied the movement of either thermal or electrical energy through solids,you may be interested in how the energy bands are related to conduction and insulation.
The electric current that flows through a solid consists of electrons with energies asso-ciated with the conduction band. Solids that conduct heat or electric current (calledconductors) will have many electrons with energies in the conduction band. Solids thatdo not readily conduct heat or electric current (called insulators) will have few electronsin the conduction band. Thus, the electrons in insulators are found mostly in the valenceband. Solids that are good conductors will have many electrons in the valence bandbecause these materials have enough electrons to fill all available energies in the va-lence band and many left over in the conduction band. Further, these two bands overlapin conductors.
In addition to the difference in the number of electrons found in their respective conduc-tion bands, conductors and insulators also differ in the size of their respective energygaps. For conductors, the two bands either overlap or are so close together that elec-trons with energies in the valence band can easily acquire enough energy to have ener-gies associated with the conduction band. Insulators, on the other hand, have energygaps that are so large that thermal or light energy is not sufficient for electrons to moveto the conduction band from the valence band.
The solids that make up LEDs are called semiconductors. As the name implies, a semi-conductor is a solid whose physical properties place it somewhere between conductorsand insulators. In semiconductors the energy gap is small enough that when sufficientenergy (i.e. thermal, electrical, or light) is supplied, electrons gain enough energy tobecome the conduction band electrons.
The electrons in the conduction band carry the energy. Materials that have electrons inthis band can transmit easily both thermal and electrical energy. The good electricalconductors are also good thermal conductors.


8-1
@2001, Physics Education Research Group, Kansas State University. Visual Quantum Mechanics issupported by the National Science Foundation under grants ESI 945782 and DUE 965288. Opinionsexpressed are those of the authors and not necessarily of the Foundation.
Kansas State University
ACTIVITY 8
Applying Energy Bands to Incandescent Lamps
GoalWe will apply what we have learned about energy bands and gaps toexplain the physical properties of the incandescent lamp which weobserved earlier.
In the previous activity, we developed the energy diagram representation of a solid (likethe one inside an LED) starting from our observation of the LED spectrum and theenergy level diagrams of gases. We concluded that energy bands must be present toobtain the characteristic broad spectra emitted by LEDs. We also found that the size ofenergy gap and the energy range of the two bands determine the color of light emittedby the LED.
The energy level model has successfully described the spectra emitted by gas lampsand LEDs. So, we will apply our model to explain the light emitted by incandescentlamps.
Open the LED Spectroscopy computer program and place any one of the LEDs in thesocket.
Do not try to match the LED spectrum. Instead, use the program to construct an energyband diagram that would produce the spectrum emitted by an incandescent lamp whenit is at maximum brightness.
? What is the range of energies (and colors) for the spectrum emitted by the incan-descent lamp?
Name: Class:
SOLIDS LIGHT & Visual Quantum MechanicsVisual Quantum MechanicsVisual Quantum MechanicsVisual Quantum MechanicsVisual Quantum Mechanics

8-2
? How does the spectrum emitted by the incandescent lamp compare with thespectrum emitted by an LED?
In the space below sketch the resulting energy band diagram for your incandescent lamp.
? How does energy band diagram for the light emitted by the incandescent lampcompare with the energy band diagram for an LED?
The energy band diagram that we just constructed represents the diagram for a “white”(mixture of all colors) light LED. Although incandescent lamps emit “white” light, typicalLEDs only emit light of a single color. Incandescent lamps are also different from LEDs inthat when the electrical energy supplied to the lamp is increased, the color (and energies)of light emitted by the tungsten filament (a solid) changes from the red region of thespectrum to “white” light as the filament heats up.

8-3
The energy diagram in Figure 8-1 represents the bands and gaps for tungsten, the mate-rial in the filament of most incandescent lamps.
Figure 8-1: Energy Band Diagram of an Incandescent Lamp Filament
Since electrons seek lower energy levels, the electrons of the tungsten filament haveenergies associated with the valence energy band. When the battery provides sufficientelectrical energy, electrons in the valence band make the transition to an energy level ofthe conduction band. (See Figure 8-1.) These electrons will then lose the energy theyrecently acquired when photons of light are emitted. As a result, the electrons make atransition back to the valence band of the filament. The light energy emitted can rangefrom infrared to ultraviolet.
If the supplied energy is great enough, electrons from the valence band can make atransition to the highest energy level of the conduction band. These electrons make thetransition back to the valence band by losing energy as photons of violet light (3.1 eV).Since enough electrical energy is being supplied to move electrons from the valenceband to the highest energy level of the conduction band, the energy is more than suffi-cient for electrons to make a transition from the valence band to any energy level foundbetween the lowest and highest energy levels of the conduction band. As a result, pho-tons of light ranging from red (1.6 eV) to violet (3.1 eV) are also emitted.
When the energy supplied to the incandescent lamp is low, the color of the light has alarge red component. At low voltages many of the electrons will receive just enoughenergy to reach lower energies in the conduction band. So, they can only emit light inthe low energy end of the spectrum. Infrared light, which has a lower energy than visiblelight, is also emitted. This energy causes the lamp to be hot.

8-4
As the energy increases, the color of the light becomes “white.” The number of transi-tions that result in the release of photons in the middle or high energy end of the visiblespectrum increases. Thus, the color of the light shifts from reddish to white.
Use this discussion to draw energy level diagrams that explain the color shift in an incan-descent lamp. Draw one diagram for low voltages and another for higher voltages. Thendescribe the differences.
Unlike the incandescent lamp, the colors (and energies) of light emitted by the LED donot change with voltage. This difference is a reflection of the range of energies availablein the conduction band of the materials that compose the devices. Incandescent lampsare made of electrical conductors that have a wide range of energies available in theconduction band. Semiconductors, which make up LEDs, have only a narrow range ofenergies in this band. This difference is displayed in the behaviors as the voltage (inputenergy) is changed.
An additional difference is the method by which the light-emitting electrons gain energy.In an LED electrical interactions directly transfer energy to these electrons. The incan-descent process works differently. The energy to electrons comes from heating thematerial. In the incandescent lamp electricity causes the wire to become hot. The ther-mal energy is transferred to the electrons, and then they emit energy in the form of light.Incandescence is the process by which thermal energy is converted to light.

8-5
Homework
1. Electric cooking stoves emit heat and light from their burners. The heat that wefeel is infrared radiation. The light that we see is always in the red end of thespectrum. With this information create an approximate energy level diagram forthe material in the burners of an electric stove. Explain how you reached youranswer.
2. Another example of incandescence is a glowing piece of metal in a fire. Useenergy diagrams to explain why very hot metal emits light.


9-1
@2001, Physics Education Research Group, Kansas State University. Visual Quantum Mechanics issupported by the National Science Foundation under grants ESI 945782 and DUE 965288. Opinionsexpressed are those of the authors and not necessarily of the Foundation.
Kansas State University
ACTIVITY 9
Creating an Energy Level for Model LEDs
GoalThe model we developed with energy bands and gaps explained why wesee a partial continuous spectrum for LEDs. They even allowed us tounderstand why we needed some minimal energy (voltage) to turn oneach LED and why that energy depended on color. The model does not,however, explain how electrons get into the conduction band so they canemit light. To understand this process we must expand our model of theLED energy levels.
We have used energy bands and gaps to explain the spectral properties of an incandes-cent lamp and LEDs. Recall that the conduction and valence energy bands and the result-ing energy gap result from interactions of numerous atoms that are very close together -a situation that occurs in solids. As we have seen, the energy gap of the solid materials(called semiconductors) that make up the LED determine the energies (and thus, colors)of light emitted by the LEDs.
A solid can be a pure material in which all atoms are the same element. As a result, eachnucleus of the atom contained in this solid has the same electrical charge. Thus, eachatom in this solid has identical properties. The interactions among these atoms createthe energy bands and gaps that we have studied. Modern technology can create materi-als that are very close to being all identical atoms. These pure materials have light emit-ting properties much like we have studied in previous activities.
For today’s technology pure materials are not the most valuable. Instead, a wide range ofdevices — from LEDs to computer chips — use almost pure materials into which a smallquantity of a different element — an impurity has been introduced. Then materials withdifferent impurities are joined.
Suppose we start with a pure material and add atoms of a different element. These differ-ent elements will have a different number of electrons than the atoms of the originalmaterial. We place the impurities into two groups:
Name: Class:
SOLIDS LIGHT & Visual Quantum MechanicsVisual Quantum MechanicsVisual Quantum MechanicsVisual Quantum MechanicsVisual Quantum Mechanics
9-2
Donors have more electrons than the material’s pure elements. They donateelectrons to the solid.
Acceptors have fewer electrons than the material’s pure element. They acceptelectrons from the solid.
Both the donors and acceptors have zero electrical charge. They have more or lesscharge in the nucleus to balance the more or fewer electrons.
The LED chip consists of two solids – a material that has been supplied with donor atomsand the same material that has been supplied acceptor atoms. We will now use the LEDConstructor computer program to understand how these two materials are combined toconstruct a simulation of an LED. Begin the process by opening the LED Constructorcomputer program.
Notice that on the left of the screen is an illustration of 6 different LEDs and a version ofthe circuit apparatus that we used in the first activity when we explored the properties ofLEDs. On the right of the screen are the two blocks of material that make up the LEDchip with an energy scale and output spectrum illustrated below the blocks.
In this program, we can: Select an LED and drag it to the power supply (LED socket). Create an energy band diagram for each of the two semiconductor blocks that
make up each LED. Add donors or acceptors to each semiconductor block with a click of the mouse
inside each block and thus create the LED chip. Control the voltage applied across the LED by moving the slider.
When the voltage is appropriate, transitions (represented by a vertical arrow) will occurand light will be emitted. A spectrum will appear below the energy scale.
Drag the LED assigned to you by the instructor to the LED socket. The energy bands thatappear on both sides of the energy scale represent the bands and gap for materialsassociated with these LEDs.
Notice that the valence bands of both semiconductor materials are shaded darker thanthe conduction band. This shading indicates that the majority of electrons have energiesassociated with the valence bands. Electrons are naturally found in these bands becausethey seek the lowest possible energies. Also notice that energy of the energy gaps ofboth blocks are the same to represent that the LED is constructed of two blocks of thesame semiconductor.

9-3
? Record the color of the LED you were assigned and the energy (in eV) of theenergy gap.
Now, click on the Add Impurities button. This places acceptors in the left block anddonors in the right block.
? How does adding acceptors — atoms with fewer electrons — affect the energybands of the left block?
? What is the effect on the energy bands of adding donor atoms to the right block?
? Do the sizes of the energy gaps for either semiconductor block change as donoror acceptor atoms are added?
? A material that has donor atoms has more electrons than one with acceptors.When these two materials are joined together, the electrons can move from onematerial to the other. Which way would you expect the electrons to move? Why?

9-4
To see the effect of this process on the energy bands, click the Merge button to bring thetwo semiconductor blocks together and, thus, create a “chip” that makes up the LED.Figure 9-1 illustrates the screen that should appear.
Figure 9-1: The screen of the LED Constructor after merging two semiconductorblocks.
As you see, the bands and gaps shift from their usual energies. This shift is a result ofthe movement of electrons from one material to the other.
Compare the energy diagram for your LED with the diagrams of other students who useddifferent LEDs.
? How are they similar?
? How are they different?
The situation that is now represented on the screen is equivalent to an LED that is notconnected to an energy source. The energy diagram for the merged material is similar toFigure 9-2.

9-5
energy
Material withDonors
Material withAcceptors
Figure 9-2: Energy level diagram for a chip made of a material with acceptorsand a material with donors.
In this situation extra electrons are still available on the right (donor) side. However, theycannot change energies from the conduction band to valence band in the donor side. Allof the valence energies are already filled with electrons. We must move the electrons tothe other material where the change in energy is easy. In the next activity we will use abattery for this purpose.


10-1
ACTIVITY 10
Applying Energy Level Models to LEDs
GoalThe energy levels of two joined materials showed some additional proper-ties that we had not seen previously. By looking at the response of theselevels to an applied voltage we will see how light is emitted. As a bonuswe will learn why an LED only emits light when the battery is connected inone way.
We will begin where we ended in Activity 9. Start the LED Constructor. Then, add accep-tors and donors, and merge the materials to create an LED.
Now, we wish to apply a voltage to the LED and see what happens to
the energy levels in both materials, and the light emitted.
Use the slider control (upper left) to vary the voltage (input energy) applied the LED. Theenergy diagrams show how the energy level responds to the voltage.
? What is the effect on the energy bands as the applied voltage changes from 0.0Volts to +1.0 Volts?
To apply a negative voltage we need to flip the LED and place it in the circuit with thewires reversed (long lead on the right). Use the flip button to reverse the LED.
? What is the effect on the energy bands as the applied voltage changes from +1.0Volts to -1.0 Volts by flipping the LED?
Name: Class:
SOLIDS LIGHT & Visual Quantum MechanicsVisual Quantum MechanicsVisual Quantum MechanicsVisual Quantum MechanicsVisual Quantum Mechanics
@2001, Physics Education Research Group, Kansas State University. Visual Quantum Mechanics issupported by the National Science Foundation under grants ESI 945782 and DUE 965288. Opinionsexpressed are those of the authors and not necessarily of the Foundation.
Kansas State University

10-2
? For which of the two applied voltages (-1.0 Volts or +1.0 Volts) would it be morelikely for the electrons to move from the conduction band of the right block to theconduction band of the left block? Explain.
Reverse the LED again by flipping it so that the long lead is on the left.
Move the slider to the minimum voltage necessary for the LED to begin emitting light.Recall we defined this voltage as the threshold voltage.
? What happens to the energy bands of the two semiconductor blocks when thethreshold voltage is applied to the LED?
Record the threshold voltage displayed on the voltmeter. Indicate the LED that you wereassigned.
Record the range of color(s) and energies (in eV) of the output spectrum of your LED.
Compare your results with others in the class.
? How are all results similar?

10-3
How are they different?
Since the energy bands on the material with acceptor atoms are higher than the bands ofthe material with donor atoms, the excess, free electrons found in the conduction band ofthe right block must be supplied additional energy to move to the conduction band of theleft block which has a deficiency of electrons. Electrons cannot flow from the left block tothe right block because there are not many free electrons on the left block.
When a battery is properly connected across an LED and when the electrical energy(voltage) supplied by the battery is increased, the difference in energy between the rightand left energy bands decreases. As the difference in energy decreases, the likelihood ofthe free electrons moving from the right block to the junction between the blocks increases.When the appropriate voltage (threshold voltage) is applied, the right and left energy bandsreach the same energy level, and the free, energetic electrons of the conduction band of thedonor material move toward the acceptor material which has fewer electrons. Once there,the energetic free electrons combine with atoms and lose their energy in the form of lightemitted by the LED while making the transition to the valence band as shown in Figure 10-1.
LEDThreshold Voltage
(V) Energy Gap (eV)
Output Spectral ofRange of Energies
(eV)
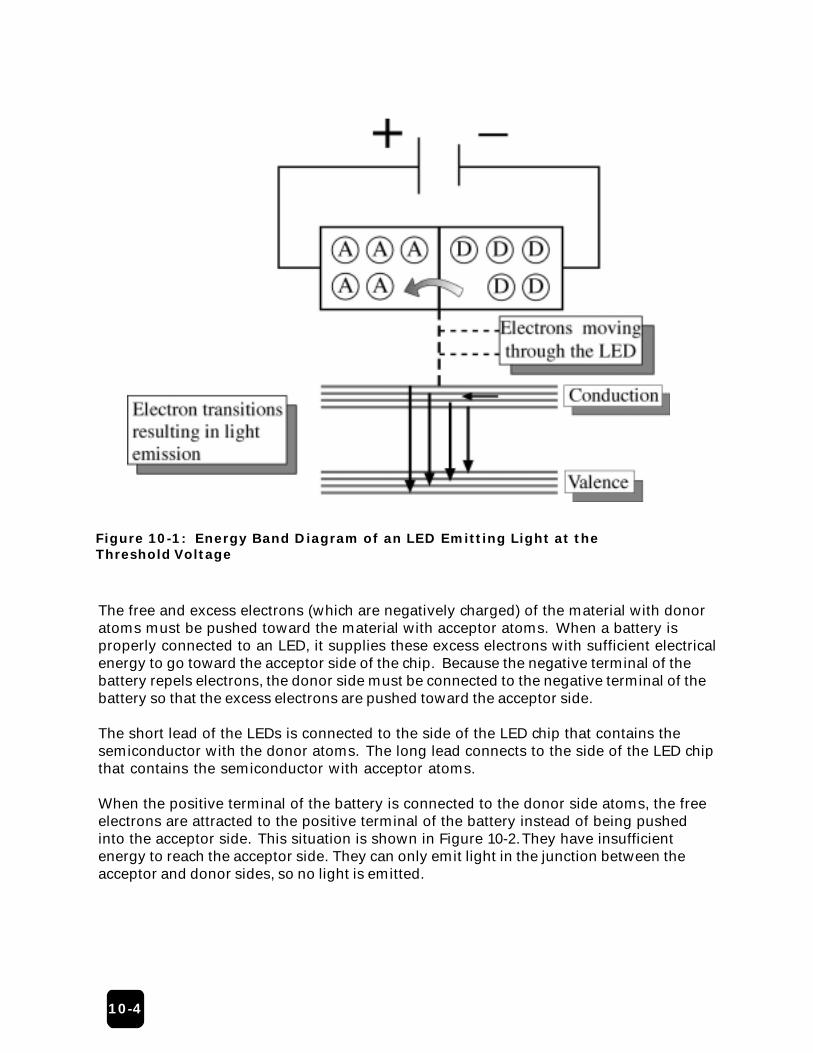
10-4
Figure 10-1: Energy Band Diagram of an LED Emitting Light at theThreshold Voltage
The free and excess electrons (which are negatively charged) of the material with donoratoms must be pushed toward the material with acceptor atoms. When a battery isproperly connected to an LED, it supplies these excess electrons with sufficient electricalenergy to go toward the acceptor side of the chip. Because the negative terminal of thebattery repels electrons, the donor side must be connected to the negative terminal of thebattery so that the excess electrons are pushed toward the acceptor side.
The short lead of the LEDs is connected to the side of the LED chip that contains thesemiconductor with the donor atoms. The long lead connects to the side of the LED chipthat contains the semiconductor with acceptor atoms.
When the positive terminal of the battery is connected to the donor side atoms, the freeelectrons are attracted to the positive terminal of the battery instead of being pushedinto the acceptor side. This situation is shown in Figure 10-2. They have insufficientenergy to reach the acceptor side. They can only emit light in the junction between theacceptor and donor sides, so no light is emitted.

10-5
Figure 10-2: Placing the LED in backwards results in the available electrons onthe donor side having insufficient energy to move to the acceptor side. No lightis emitted.
In our energy level model we have assumed that electrons in a solid acquire and loseenergy. Our energy level model of how an LED works, like all models, has limitations.Our energy level model is not perfect and should not be considered a description of allprocesses that occur in an LED. The model, however, does enable us to explain thegeneral nature of the phenomena that we observed and gives us a general idea of how anLED works at the atomic scale.
We now have gone full circle from exploring the properties of LEDs to constructing anenergy level model that explains these properties. The development of this comprehen-sive model began with atoms of gases to explain the spectral properties of gas lampsand ended with atoms of solids to explain the physical properties of incandescent lampsand LEDs. Along the way we have also learned about gas lamps and the limited numberof energies available to an electron in an atom. Knowledge of the energies has beenimportant in almost every area of modern science and technology. One example, the LEDand its applications, are important to our daily lives and will play a bigger role as alter-nate light sources in our future. We could say that the LED and the quantum model thatexplains how this tiny device works provide us with an “illuminating” experience thatallow us to see everyday phenomena in a new “light”.
10-6
Homework:
One active research area involves using LEDs for plant growth, especially for spaceapplications where low weight and low power consumption are critical. LEDs are apromising light source for plant-growth experiments in space due to their high intensi-ties and electrical efficiencies, small size and mass, long life, and excellent record ofsafety and reliability. Several crops – lettuce, spinach, wheat, and potatoes have beensuccessfully grown when illuminated by an array of LEDs supplemented with fluorescentlight.
Assume we are members of a group of NASA scientists working on a project that fo-cuses on using LEDs to grow plants in a space station currently orbiting Earth. We mustmake a decision on what types of LEDs should be used and what the electrical require-ments for the batteries to power these LEDs should be. A NASA botanist on our teamhas collected the following information on the light spectra that would be most condu-cive for photosynthesis (the process by which plants use light energy to manufacturefood). Plants reflect green light but absorb energy in the blue and red regions.
1. What would be the energy gap(s) of the material(s) you would choose to make thetwo LEDs that would produce the required spectrum? Explain.
2. NASA has to provide batteries to supply the minimal electrical power to theseLEDs. If the batteries are too large they will weigh more than necessary and wastevaluable fuel. NASA, like any government agency, must be very specific in theirrequest so that bids could be taken on the contract to provide these batteries.What would be the minimum voltage the battery must supply in order to makeboth LEDs emit light simultaneously? Assume that the LEDs will be connected insuch a way that the battery would have to provide a voltage equal to the sum ofthe threshold voltages for each LED. Explain.

10-7
3. Based on our observations using these LEDs, what types of problems canoccur when using this set-up?


11-1
ACTIVITY 11
Can Ohm’s Law Explain Your Observations?
GoalIn the first activity, we investigated the electrical and light emitting prop-erties of LEDs and the incandescent lamp. In this activity, we will attemptto explain the electrical properties of the incandescent lamp and the LED.
Because the incandescent lamp and the LEDs are electrical devices, we might assume thatthese devices obey Ohm’s law. For simple electrical components, such as resistors, Ohm’slaw states that the current flowing through a device is directly proportional to the voltageapplied to it. This law is represented by the equation,
Voltage = Current x Resistance
where for many devices the resistance (R) is a constant. We will determine whetherOhm’s law with a constant resistance can explain the electrical properties exhibited bythe incandescent lamp and the various LEDs investigated in the previous activity.
The best way to determine if an electrical device obeys Ohm’s law with constant resis-tance is by graphing the variation of current (I) with the variation of voltage (V) acrossthe device. A device that obeys Ohm’s law exhibits a very characteristic I-V graph. Forexample, a graph of current (I) versus voltage (V) for a resistor with a given resistanceexhibits typical Ohmic behavior as shown in Figure 11-1.
Name: Class:
SOLIDS LIGHT & Visual Quantum MechanicsVisual Quantum MechanicsVisual Quantum MechanicsVisual Quantum MechanicsVisual Quantum Mechanics
@2001, Physics Education Research Group, Kansas State University. Visual Quantum Mechanics issupported by the National Science Foundation under grants ESI 945782 and DUE 965288. Opinionsexpressed are those of the authors and not necessarily of the Foundation.
Kansas State University

11-2
Note that the current-voltage graph is linear - that is, the slope (change in I divided by achange in V) of the graph is constant. A constant slope indicates that the electricalresistance is constant. Since the slope of the current-voltage graph is equal to 1/R, theresistance can be determined by calculating the reciprocal of the slope.
Voltage
Current
Figure 11-1: I-V Graph of a Resistor
? If you made measurements of current and voltage of a 33 Ω resistor and made acurrent-voltage graph, is the resulting graph consistent with the general shapeof Figure 11-1?
Figure 11-1 can be explained in terms of the electrons in a material. When a voltage isapplied to the devices, electrons are attracted to the positive and repelled by the nega-tive side of the battery. They move through the material, and we measure that motionas current.
Because current is directly related to the number of electrons passing a certain loca-tion in the circuit in one second, it is related to both the number of electrons and theirspeeds. The resistance is a property of the material and is related to the availability ofelectrons and the ease with which they can move.
To determine if incandescent lamps and LEDs behave as simple resistors do, measurethe current as a function of voltage of one LED and a Christmas tree light of the samecolor. Record and plot your data below.

11-3
Based on the current-voltage graph for the incandescent lamp, state whether this deviceappears to obey Ohm’s law with constant resistance. Explain your answer.
? How about the LEDs? Do they appear to obey Ohm’s law with constant resis-tance? Explain your answer.
As a starting point in understanding the current-voltage characteristics of the LED, wecompare the relation between current and voltage with that of a device that obeys Ohm’slaw. We find that the LED’s and incandescent lamp’s variation in current with a change involtage is quite different from the devices that obey Ohm’s law with constant resistance.Our task for the remaining activities in the unit is to understand these differences.


12-1
ACTIVITY 12
Using LEDs to Measure Planck’s Constant
GoalIn this activity, we will use the electrical and spectral data that we havecollected from LEDs and apply the concepts we have learned to deter-mine a fundamental constant.
In the previous activities, we learned that the energy gap of the semiconductor that makesup the LED is related to the threshold voltage of the LED and to the energy of the brightestcolor of light emitted by the LED. An equation expressing this result is:
Egap
= Elight
= eVthreshold
(12-1)
where Egap is the energy (in eV) of the energy gap of the semiconductor, Elight is the energy(in eV) of the brightest color of light emitted by the LED, e is the charge of an electron(1.6x 10⁻¹⁹ Coulombs), and Vthreshold is the threshold voltage (in Volts) of the LED. Althoughthese energies are actually approximately equal to one another, we will assume they areequal.
Recall that visible light consists of photons which are small packets of energy. The en-ergy of these photons is related to the color of light emitted. The energy of a photon (Elight)associated with brightest color of light emitted by the LED is related to its frequency bythe Planck-Einstein equation:
Elight
= hflight
(12-2)
where h is Planck’s constant and f is the frequency (in Hz or 1/s) of the photon of light.We will not go into the details here, but frequency is a property that allows us to under-stand the nature of light and is also related to visible light’s color.
Name: Class:
SOLIDS LIGHT & Visual Quantum MechanicsVisual Quantum MechanicsVisual Quantum MechanicsVisual Quantum MechanicsVisual Quantum Mechanics
@2001, Physics Education Research Group, Kansas State University. Visual Quantum Mechanics issupported by the National Science Foundation under grants ESI 945782 and DUE 965288. Opinionsexpressed are those of the authors and not necessarily of the Foundation.
Kansas State University

12-2
Another property that is important in understanding the nature of light is its wavelength.The frequency of the light emitted by the LED is related to its wavelength by the equation:
(12-3)
where c is the speed of light (3.0 x 10 8 m/s), and λ is the wavelength (in meters). Whenequation (3) is substituted into equation (2), the following equation results:
(12-4)
Recall from our earlier investigations in recording spectra that the bottom of the spectralscales that were used had units of nanometers (nm). One nanometer equals 1 x 10⁻⁹
meters. This unit is frequently used to describe the wavelengths of visible light. Thewavelength of light is just another way to indicate the energy (and color) of a photon thatis emitted.
In our investigations with LEDs, we also measured the Vthreshold for each LED in addition toElight. Since equations (12-1) and (12-2) are related by Elight , the relationship between thefrequency of the brightest color of light emitted by the LED and the threshold voltage isrepresented by the equation:
Solving for Planck’s constant (h), the following equation results:
(12-5)
where e is 1.6 x 10⁻¹⁹ Coulombs, Vthreshold is in Volts, and f is in 1/seconds. When theseunits are used, Planck’s constant will be in units of Joules x seconds (Js).
Using the data that we collected in the first two activities and the equations found above,record and determine the values for each LED indicated in the following table provided.
lightlight
cf
λ=
lightlight
hcE
λ=
lightlightthreshold
hc hf eVλ
==
feV
hthreshold=

12-3
Now use equation (12-4) and our measurements to determine Planck’s constant. Constructa graph of the measured threshold voltage versus the peak emission frequency for eachLED. Determine the slope of the resulting graph (∆V/∆F). Planck’s constant can be calcu-lated by multiplying the resulting slope times the electronic charge, e, (1.6 x 10⁻¹⁹).
? What is your measured value for Planck’s constant?
LED Elight (eV) λλλλlight(x 10-9 m) flight (1/s) Vthreshold (Volts)

12-4
? The accepted value for the Planck’s constant is 6.626 x 10 -34 Js. How does yourmeasured value of Planck’s constant compare with the accepted value? Use thefollowing equation to compare these values,
%Errorh h
hx
accepted measured
accepted=
−100%
? What can explain the difference found between the measured and accept values ofh?
Planck’s constant is a very important number that helps us determine the quantum natureof both light and matter. German physicist Max Planck who used it to develop a modelthat explained the photons of light (visible and invisible) emitted first introduced theconstant in 1900 by a warm (or hot) body like the sun or the filament of an incandescentlamp. Albert Einstein in 1905 used the constant to develop a theory that explained thephenomenon of electrons being ejected from a metal with kinetic energies determine bythe energy of photons of light shined on the metal. Today, Planck’s constant is fundamen-tal to any equation of quantum science.