Embed Size (px)
Citation preview

Adapted from L. Miriello by S. Sharp
Page 1 of 4
Name __________________________ AP Biology Chapter 53 - Population Ecology Guided Reading Assignment Campbell’s 10th Edition Essential Knowledge 2.D.1 All biological systems from cells and organisms to populations, communities, and ecosystems are affected by complex biotic and abiotic interactions involving exchange of matter and free energy 4.A.5 Communities are composed of populations of organisms that interact in complex ways 2.D.1 All biological systems from cells and organisms to populations, communities, and ecosystems are affected by complex biotic and abiotic interactions involving exchange of matter and free energy 2.A.1 All living systems require constant input of free energy LO 1.8 The student is able to make predictions about the effects of genetic drift, migration and artificial selection on the genetic makeup of a population. LO 2.3 The student is able to predict how changes in free energy availability affect organisms, populations, and/or ecosystems. LO 4.19 The student is able to use data analysis to refine observations and measurements regarding the effect of population interactions on patterns of species distribution and abundance. 1. Define the following terms:
a. Population
b. Density
c. Dispersion
d. Mark-recapture method
e. Immigration
f. Emigration
g. Territoriality
2. Using the diagram, label two factors
that increase population and two factors that decrease population
Adapted from L. Miriello by S. Sharp
Page 2 of 4
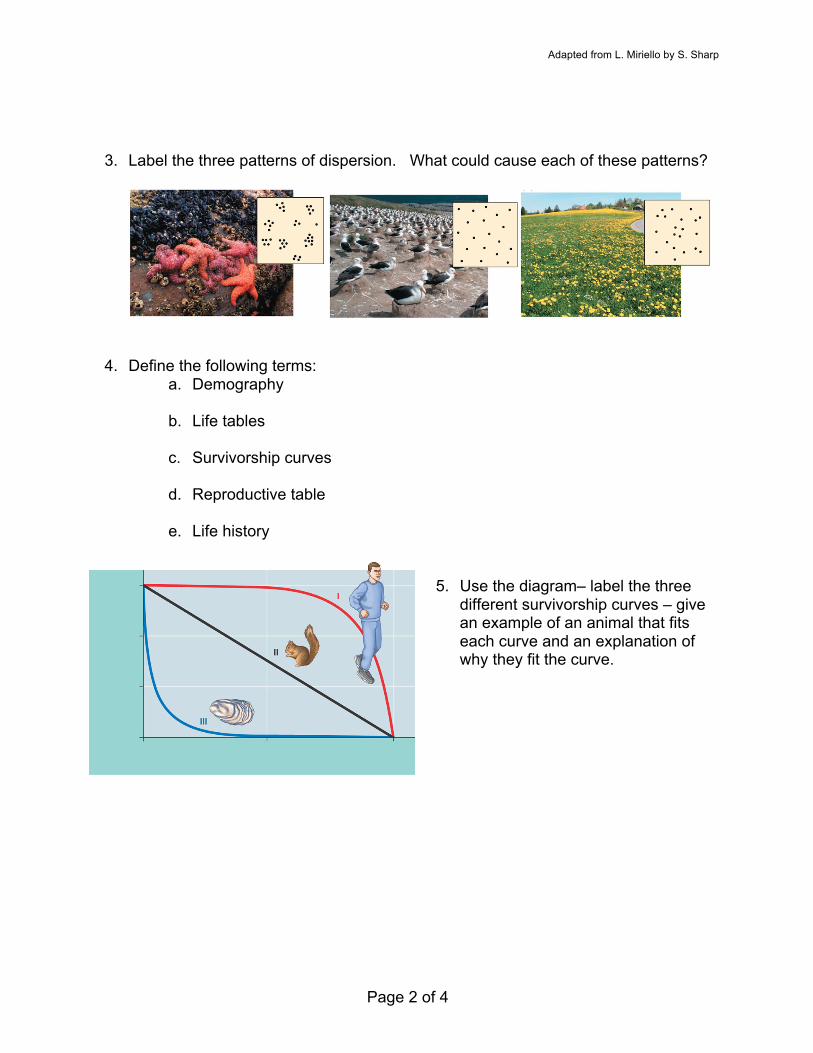
3. Label the three patterns of dispersion. What could cause each of these patterns?
4. Define the following terms: a. Demography
b. Life tables
c. Survivorship curves
d. Reproductive table
e. Life history
5. Use the diagram– label the three different survivorship curves – give an example of an animal that fits each curve and an explanation of why they fit the curve.

Adapted from L. Miriello by S. Sharp
Page 3 of 4
6. What information is used to construct a reproductive table 7. Label exponential population growth on
the diagram.
8. When is this type of growth seen?
9. Label logistic population growth on the
diagram. 10. When is this type of growth seen?
11. You will practice using the equations for logistic and exponential growth curves
during this unit. Take a look at the equations and explain how they differ
12. Define and label two types of parity and give
advantages and disadvantages of each
13. Compare and contrast r and k selection – this is a key concept – do some
additional research and try to come up with at lease six points of comparison.

Adapted from L. Miriello by S. Sharp
Page 4 of 4
14. What is the difference between density-dependent and density-independent factors as a general term?
15. What generalizations can be made by the graphs below?
16. Describe six density-dependent factors in population regulation.
17. What is population dynamics?
18. Describe human population growth using the diagram.
19. What kinds of information do age structure pyramids provide and what inferences
can be made from these?
20. How can an ecological footprint be useful?


![AP* Biology: Ecology Practice MC [Version Map] Biology Ecology... · AP* Biology: Ecology Practice MC [Version Map] 1 ABCD MC 1 8 9 7 ... AP* Biology: Ecology Practice MC ... which](https://img.dokumen.tips/doc/110x75/5b449d207f8b9ae0668bd35b/ap-biology-ecology-practice-mc-version-map-biology-ecology-ap-biology.jpg)