Embed Size (px)
Citation preview

J. Chil. Chem. Soc., 56, Nº 4 (2011)
848
IN-VITRO INTERACTION STUDIES OF VERAPAMIL WITH FLUOROQUINOLONES USING FIRST ORDER DERIVATIVE UV SPECTROPHOTOMETRY AND RP-HPLC
NAJMA SULTANA1, MUHAMMAD SAEED ARAYNE1 AND ABDUL WAHEED*2
1United Biotechnologies, Karachi-75270, PAKISTAN2Department of Pharmaceutical Chemistry, Faculty of Pharmacy, University of Karachi, Karachi.
(Received: September 27, 2010 - Accepted: May 30, 2011)
ABSTRACT
Verapamil, a calcium channel blocker, is classified as a class IV anti-arrhythmic agent. It is used in the treatment of hypertension, as an important therapeutic agent for angina pectoris, ischemic heart disease, hypertension and hypertrophic cardiomyopathy. Many in-vivo studies have been carried out to find out the effects on concurrent use of calcium channel blocker with various groups of drugs. In the present paper an in-vitro approach was adapted to study the interaction of verapamil with commonly administered fluoroquinolones i.e. ciprofloxacin, levofloxacin, norfloxacin and sparfloxacin.
The interaction studies were carried out in different simulated body fluids pH ranges from 1-9 at 37 oC. To perform these studies first-derivative UV spectrophotometric (using zero-crossing technique) and simultaneous RP-HPLC methods were developed and validated. HPLC analysis was conducted on Shim-pack CLC-ODS (6.0 X 150 mm) column. The mobile phase constituted of acetonitrile: water (45:55), whose pH was adjusted to 2.8 and pumped at a flow rate of 1.2 mL min-1 at 230 nm. The results obtained from both methodologies indicated that the availability of verapamil was not affected by simultaneous administration of fluoroquinolones. Hence the two drugs could be safely administered concomitantly.
Key words: Verapamil, anti-arrhythmic agent, angina pectoris, hypertrophic cardiomyopathy, fluoroquninolone, HPLC and UV spectrophotometry.
email: [email protected]
INTRODUCTION
Verapamil HCl (Figure 1) is a synthetic papaverine derivative, which belongs to phenylalkylamine class. Verapamil is a calcium blocker and is classified as a class IV anti-arrhythmic agent.1 It is used in the control of supra ventricular tachyarrhythmias and in the management of classical and variant angina pectoris. It is also used in the treatment of hypertension.2 It has been used an important therapeutic agent for angina pectoris, ischemic heart disease, hypertension and hypertrophic cardiomyopathy.3
derivative UV spectrophotometric and HPLC methods have been developed and validated. There is no method reported for in-vitro interaction studies of these drugs as well simultaneous determination by either HPLC or UV spectrophotometry.
EXPERIMENTAL
Material and reagentsVerapamil was supplied by Searle Pakistan Limited, ciprofloxacin by
Bayer Pakistan Private Limited, levofloxacin by Getz Pharma (Pvt) Limited, norfloxacin by Merck Sharp & Dhome and sparfloxacin by Abbott Laboratories. Calan (verapamil) tablets 40 mg, Ciproxin (ciprofloxacin) tablets 250 mg (Bayer Pakistan), Leflox (levofloxacin) tablets 250 mg (Getz Pharma), Noroxin (norfloxacin) 400 mg tablets (MSD) and Sparaxin (sparfloxacin) tablets 100 mg (Abbott Laboratories) have been purchased from the market. All reagents and solvents were of analytical grade. HPLC grade acetonitrile (Merck) and water were used in the preparation of mobile phase.
ApparatusElectrical balance (Mettler Toledo # AB54), pH meter (Mettler Toledo
MP 220), UV- Visible 1601 Shimadzu double beam spectrophotometer, 1 cm rectangular quartz cells, Deionizer (Stedec CSW- 300), distillation unit (GFL Type 2001/2) were used during the experiment.
A liquid chromatograph Shimadzu Corporation (Model LC-20AD) with Rheodyne manual injector fitted with a 20 µL loop. The chromatographic system was integrated with CBM-102 Communication Bus Module. Analysis was performed on CLC-ODS (6.0 x 150 mm) Shim-Pack reverse phased column.
MethodsFirst derivative UV methodSolution preparationsIndividual primary solutions of 1 mMole concentration of verapamil and
fluoroquinolones (ciprofloxacin, levofloxacin, norfloxacin and sparfloxacin) were prepared in methanol (shake and sonicate if required to assure dissolution). The 0.1 mM stock solution was prepared by diluting primary solution in buffers ranging from pH 1-9. Working standard solutions of each drug were prepared by further diluting the amount of stock solution in the same buffers. The final concentration of the solutions were 4.9-49.0 µgmL-1 (0.01-0.1 mM) for verapamil, 3.7-20.2 µgmL-1 (0.010-0.055 mM) for ciprofloxacin, 1.9-18.5 µgmL-1 (0.005-0.05 mM) for levofloxacin, 3.2-11.8 µgmL-1 (0.01-0.037 mM) for norfloxacin and 17.2-24.4 µgmL-1 (0.044-0.062 mM)for sparfloxacin. These solutions were scanned in the region 200-700 nm and the maxima were found for each drug.
Figure 1. Verapamil HCl.
Literature survey revealed that verapamil has been determined by spectrophotometry,4,5 gas chromatography (GC),6,7 capillary electrophoresis8
and high-performance liquid chromatographic (HPLC).9-22 More sensitive and specific approaches to measure plasma verapamil are mass spectrometry (MS) with isotope dilution (mass fragmentography)23 and HPLC/MS.24 But, these techniques have limitations including requirement of expensive instruments and spacious laboratory.
The fluoroquinolones are widely use in the treatment of severe infection. These drugs can interact with different agents like food, H2-receptor antagonists, anticholinergic drugs and metallic cation-containing compounds. Antacids, ferrous sulfate and other metallic cation-containing compounds affect the bioavailability of the fluoroquinolones. These interactions are due to chelation between quinolone molecule and the metallic cations, resulting in insoluble complexes. However, food, H2-receptor antagonists and anticholinergic drugs do not have any major effect on the bioavailability of the fluoroquinolones.25
The co-administration of fluoroquinolones and calcium channel blockers is very common. This study has been carried out to determine the possible in-vitro interaction between verapamil with commonly used fluoroquinolones like ciprofloxacin, levofloxacin, norfloxacin and sparfloxacin for which first
J. Chil. Chem. Soc., 56, Nº 4 (2011)
849
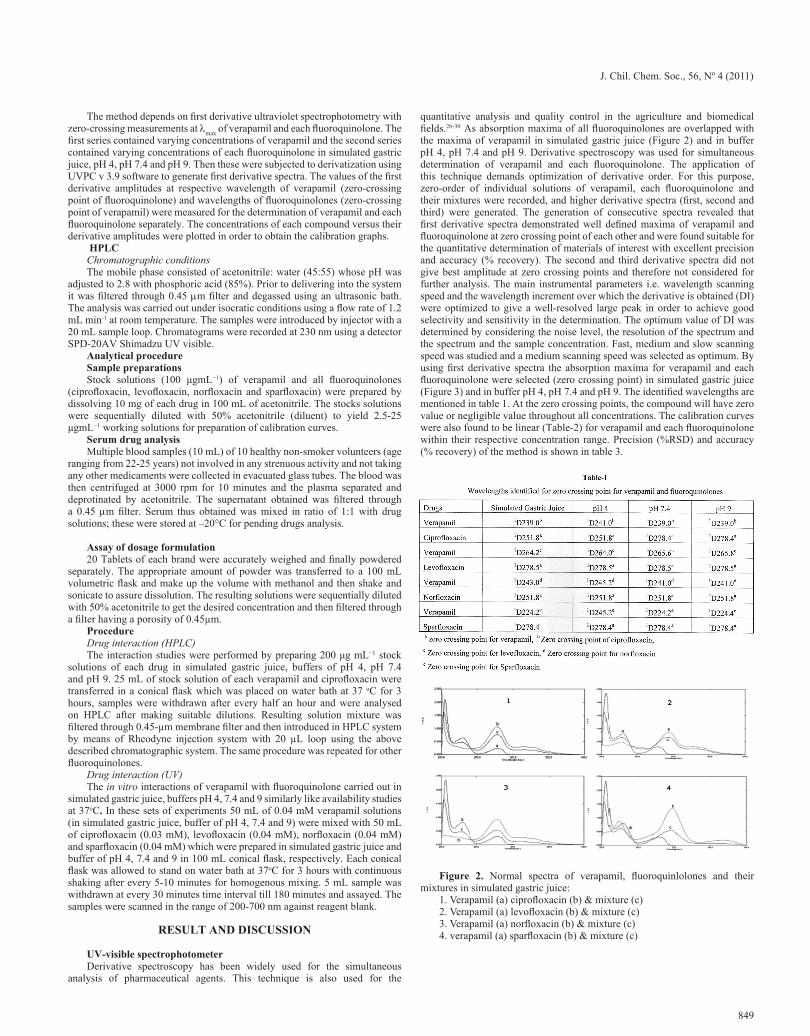
The method depends on first derivative ultraviolet spectrophotometry with zero-crossing measurements at lmax of verapamil and each fluoroquinolone. The first series contained varying concentrations of verapamil and the second series contained varying concentrations of each fluoroquinolone in simulated gastric juice, pH 4, pH 7.4 and pH 9. Then these were subjected to derivatization using UVPC v 3.9 software to generate first derivative spectra. The values of the first derivative amplitudes at respective wavelength of verapamil (zero-crossing point of fluoroquinolone) and wavelengths of fluoroquinolones (zero-crossing point of verapamil) were measured for the determination of verapamil and each fluoroquinolone separately. The concentrations of each compound versus their derivative amplitudes were plotted in order to obtain the calibration graphs.
HPLCChromatographic conditionsThe mobile phase consisted of acetonitrile: water (45:55) whose pH was
adjusted to 2.8 with phosphoric acid (85%). Prior to delivering into the system it was filtered through 0.45 mm filter and degassed using an ultrasonic bath. The analysis was carried out under isocratic conditions using a flow rate of 1.2 mL min-1 at room temperature. The samples were introduced by injector with a 20 mL sample loop. Chromatograms were recorded at 230 nm using a detector SPD-20AV Shimadzu UV visible.
Analytical procedureSample preparationsStock solutions (100 μgmL−1) of verapamil and all fluoroquinolones
(ciprofloxacin, levofloxacin, norfloxacin and sparfloxacin) were prepared by dissolving 10 mg of each drug in 100 mL of acetonitrile. The stocks solutions were sequentially diluted with 50% acetonitrile (diluent) to yield 2.5-25 μgmL−1 working solutions for preparation of calibration curves.
Serum drug analysisMultiple blood samples (10 mL) of 10 healthy non-smoker volunteers (age
ranging from 22-25 years) not involved in any strenuous activity and not taking any other medicaments were collected in evacuated glass tubes. The blood was then centrifuged at 3000 rpm for 10 minutes and the plasma separated and deprotinated by acetonitrile. The supernatant obtained was filtered through a 0.45 mm filter. Serum thus obtained was mixed in ratio of 1:1 with drug solutions; these were stored at –20°C for pending drugs analysis.
Assay of dosage formulation20 Tablets of each brand were accurately weighed and finally powdered
separately. The appropriate amount of powder was transferred to a 100 mL volumetric flask and make up the volume with methanol and then shake and sonicate to assure dissolution. The resulting solutions were sequentially diluted with 50% acetonitrile to get the desired concentration and then filtered through a filter having a porosity of 0.45µm.
ProcedureDrug interaction (HPLC)The interaction studies were performed by preparing 200 μg mL−1 stock
solutions of each drug in simulated gastric juice, buffers of pH 4, pH 7.4 and pH 9. 25 mL of stock solution of each verapamil and ciprofloxacin were transferred in a conical flask which was placed on water bath at 37 oC for 3 hours, samples were withdrawn after every half an hour and were analysed on HPLC after making suitable dilutions. Resulting solution mixture was filtered through 0.45-µm membrane filter and then introduced in HPLC system by means of Rheodyne injection system with 20 µL loop using the above described chromatographic system. The same procedure was repeated for other fluoroquinolones.
Drug interaction (UV)The in vitro interactions of verapamil with fluoroquinolone carried out in
simulated gastric juice, buffers pH 4, 7.4 and 9 similarly like availability studies at 37oC. In these sets of experiments 50 mL of 0.04 mM verapamil solutions (in simulated gastric juice, buffer of pH 4, 7.4 and 9) were mixed with 50 mL of ciprofloxacin (0.03 mM), levofloxacin (0.04 mM), norfloxacin (0.04 mM) and sparfloxacin (0.04 mM) which were prepared in simulated gastric juice and buffer of pH 4, 7.4 and 9 in 100 mL conical flask, respectively. Each conical flask was allowed to stand on water bath at 37oC for 3 hours with continuous shaking after every 5-10 minutes for homogenous mixing. 5 mL sample was withdrawn at every 30 minutes time interval till 180 minutes and assayed. The samples were scanned in the range of 200-700 nm against reagent blank.
RESULT AND DISCUSSION
UV-visible spectrophotometerDerivative spectroscopy has been widely used for the simultaneous
analysis of pharmaceutical agents. This technique is also used for the
quantitative analysis and quality control in the agriculture and biomedical fields.26-30 As absorption maxima of all fluoroquinolones are overlapped with the maxima of verapamil in simulated gastric juice (Figure 2) and in buffer pH 4, pH 7.4 and pH 9. Derivative spectroscopy was used for simultaneous determination of verapamil and each fluoroquinolone. The application of this technique demands optimization of derivative order. For this purpose, zero-order of individual solutions of verapamil, each fluoroquinolone and their mixtures were recorded, and higher derivative spectra (first, second and third) were generated. The generation of consecutive spectra revealed that first derivative spectra demonstrated well defined maxima of verapamil and fluoroquinolone at zero crossing point of each other and were found suitable for the quantitative determination of materials of interest with excellent precision and accuracy (% recovery). The second and third derivative spectra did not give best amplitude at zero crossing points and therefore not considered for further analysis. The main instrumental parameters i.e. wavelength scanning speed and the wavelength increment over which the derivative is obtained (DI) were optimized to give a well-resolved large peak in order to achieve good selectivity and sensitivity in the determination. The optimum value of DI was determined by considering the noise level, the resolution of the spectrum and the spectrum and the sample concentration. Fast, medium and slow scanning speed was studied and a medium scanning speed was selected as optimum. By using first derivative spectra the absorption maxima for verapamil and each fluoroquinolone were selected (zero crossing point) in simulated gastric juice (Figure 3) and in buffer pH 4, pH 7.4 and pH 9. The identified wavelengths are mentioned in table 1. At the zero crossing points, the compound will have zero value or negligible value throughout all concentrations. The calibration curves were also found to be linear (Table-2) for verapamil and each fluoroquinolone within their respective concentration range. Precision (%RSD) and accuracy (% recovery) of the method is shown in table 3.
Figure 2. Normal spectra of verapamil, fluoroquinlolones and their mixtures in simulated gastric juice:
1. Verapamil (a) ciprofloxacin (b) & mixture (c)2. Verapamil (a) levofloxacin (b) & mixture (c)3. Verapamil (a) norfloxacin (b) & mixture (c)4. verapamil (a) sparfloxacin (b) & mixture (c)

J. Chil. Chem. Soc., 56, Nº 4 (2011)
850
Figure 3. First derivative spectra of verapamil and fluoroquinolones in simulated gastric juice:
1. Verapamil (a) & ciprofloxacin (b)2. Verapamil (a) & levofloxacin (b)3. Verapamil (a) & norfloxacin (b)4. Verapamil (a) & sparfloxacin (b)
Method validation (HPLC)Optimization of mobile phase
To optimize the operating conditions, number of parameters such as column type, mobile phase composition, pH and flow rate was varied. In the present investigation the best separation of verapamil and different fluoroquinolones was achieved using a Shim-pack CLC-ODS (6.0 X 150 mm) column. By using other type of column under similar experimental condition, the separation lasted about 15 minutes. Different ratios of acetonitrile and water were tried for simultaneous determination of verapamil and each quinolone (ciprofloxacin, levofloxacin, norfloxacin and sparfloxacin). The best separation was obtained in acetonitrile: water (45:55) mobile phase. At pH 2.8, well resolved and symmetrical peaks for all drugs were produced. Optimal retention times (verapamil-4.04, ciprofloxacin-2.10, levofloxacin-2.11, norfloxacin-2.09 and sparfloxacin-2.29 minutes) were achieved at pH 2.8 (adjusted with 85 % phosphoric acid). Small changes in pH of the mobile phase had a great influence to the chromatographic behavior of these substances. The higher pH of the mobile phase also results in peak tailing of verapamil and other fluoroquinolones. In addition, the UV spectra of individual drugs were recorded in the wavelength range from 200 to 400 nm and compared. The choice to use a common wavelength set at 230 nm was considered satisfactory, permitting the detection of all drugs with adequate sensitivity.
SpecificityRepresentative chromatograms were generated to show that each
fluoroquinolone which were present in the sample matrix are resolved from the parent analyte which clearly indicated the specificity of the method in raw material as well as serum (Figure 4 and 5).
Figure 5. A typical chromatograms showing verapamil + ciprofloxacin (1), verapamil + levofloxacin (2), verapamil + norfloxacin (3) and verapamil + sparfloxacin (4) peaks in serum
Range and linearityFor linearity studies 5 different concentrations of a mixture of each drug.
Linearity was demonstrated at five concentrations over the range of 2.5-25 mgmL-1 for four consecutive days. The linearity study was also carried out in serum over the concentration range of 2.5-25 mgmL-1. Standard curve, slope, intercept and the correlation coefficient were determined. For calculation of the standard curve plots of peak areas against concentration were used. The regression statistics are shown in table 2.
Precision and accuracy (Recovery)The precision of the assay was determined by (repeatability) intra and
inter-day (intermediate precision) analysis. Accuracy was determined by analyzing independently prepared solutions of verapamil and fluoroquinolones at different concentration levels. In serum, the relative recoveries of verapamil and all fluoroquinolones were calculated by comparing the concentrations obtained from drug supplemented plasma to the actual added concentrations. Precision and accuracy were expressed in %RSD as shown in table 3 and 4.
Limit of detection (LOD) and quantitation (LOQ)LOD and LOQ for each standard were determined form the calibration
curves, by using following formulae,LOD = (3.3 ×s)/m LOQ = (10×s)/m Where s is the standard deviation of y-intercept of regression line and m is
the slope of the regression line. The LOD and LOQ for verapamil and different fluoroquinolones in raw material and serum are given in table 5.
Assay of dosage formulationAvailable brands of verapamil, ciprofloxacin, levofloxacin, norfloxacin
and sparfloxacin tablets were assayed, the results of % assay and % error are shown in table 6.
Ruggedness & robustnessRuggedness of this method was evaluated in Lab 1 located at Research
Institute of Pharmaceutical Sciences, Faculty of Pharmacy University of Karachi, while Lab 2 was in the Department of Chemistry, Faculty of Science, University of Karachi. The method did not show any notable deviations in results from acceptable limits. Robustness was evaluated by slight changes in pH levels of mobile phase and it was found that the %R.S.D. values did not exceed more than 2%.
Drug InteractionA linear equation (y=mx+c) was used for the estimation of verapamil
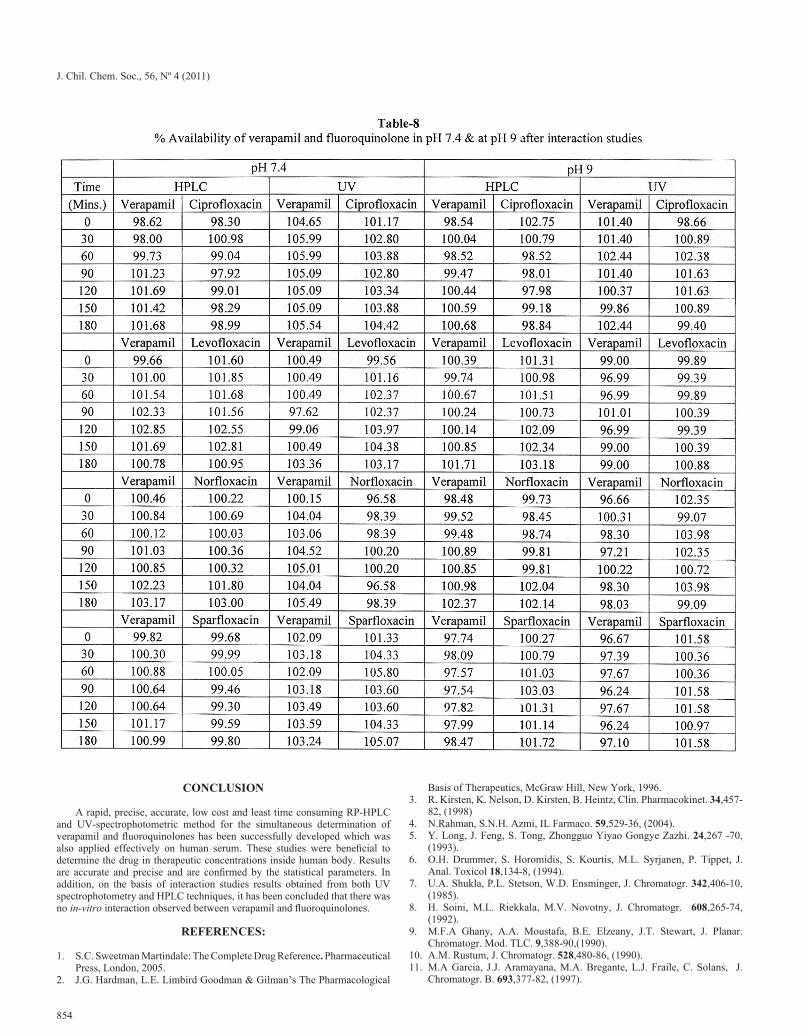
and interacting fluoroquinolones in simulated gastric juice, pH 4, pH 7.4 and pH 9. The results obtained from verapamil and fluoroquinolones interaction studies clearly shown that there is no interaction taken place as the availability of verapamil and quinolone were not affected in presence of each other in all of the buffers studied. To verify the results obtained from spectrophotometric technique the same study was performed on HPLC and similar results were obtained as shown in table 7 and 8.
Figure 4. A typical chromatograms showing verapamil + ciprofloxacin (1), verapamil + levofloxacin (2), verapamil + norfloxacin (3) and verapamil + sparfloxacin (4) peaks

J. Chil. Chem. Soc., 56, Nº 4 (2011)
851

J. Chil. Chem. Soc., 56, Nº 4 (2011)
852

J. Chil. Chem. Soc., 56, Nº 4 (2011)
853
J. Chil. Chem. Soc., 56, Nº 4 (2011)
854
CONCLUSION
A rapid, precise, accurate, low cost and least time consuming RP-HPLC and UV-spectrophotometric method for the simultaneous determination of verapamil and fluoroquinolones has been successfully developed which was also applied effectively on human serum. These studies were beneficial to determine the drug in therapeutic concentrations inside human body. Results are accurate and precise and are confirmed by the statistical parameters. In addition, on the basis of interaction studies results obtained from both UV spectrophotometry and HPLC techniques, it has been concluded that there was no in-vitro interaction observed between verapamil and fluoroquinolones.
REFERENCES:
1. S.C. Sweetman Martindale: The Complete Drug Reference. Pharmaceutical Press, London, 2005.
2. J.G. Hardman, L.E. Limbird Goodman & Gilman’s The Pharmacological
Basis of Therapeutics, McGraw Hill, New York, 1996.3. R. Kirsten, K. Nelson, D. Kirsten, B. Heintz, Clin. Pharmacokinet. 34,457-
82, (1998)4. N.Rahman, S.N.H. Azmi, IL Farmaco. 59,529-36, (2004).5. Y. Long, J. Feng, S. Tong, Zhongguo Yiyao Gongye Zazhi. 24,267 -70,
(1993).6. O.H. Drummer, S. Horomidis, S. Kourtis, M.L. Syrjanen, P. Tippet, J.
Anal. Toxicol 18,134-8, (1994).7. U.A. Shukla, P.L. Stetson, W.D. Ensminger, J. Chromatogr. 342,406-10,
(1985).8. H. Soini, M.L. Riekkala, M.V. Novotny, J. Chromatogr. 608,265-74,
(1992).9. M.F.A Ghany, A.A. Moustafa, B.E. Elzeany, J.T. Stewart, J. Planar.
Chromatogr. Mod. TLC. 9,388-90,(1990).10. A.M. Rustum, J. Chromatogr. 528,480-86, (1990).11. M.A Garcia, J.J. Aramayana, M.A. Bregante, L.J. Fraile, C. Solans, J.
Chromatogr. B. 693,377-82, (1997).

J. Chil. Chem. Soc., 56, Nº 4 (2011)
855
12. E. Brandsteterova, I.W. Wainer, J. Chromatog. B. 732,395-404,(1999).13. M. Hedeland, E. Fredriksson, H. Lennernäs, U. Bondesson, J.
Chromatog.B. 804,303-11, (2004).14. S. Li, G, Liu, J. Jia, Y. Liu, C. Pan, C. Yu, Y. Cai, J. Ren, J. Chromatog. B.
847,174-81, (2007).15. L. Kristoffersen, E.L. Øiestad, M.S. Opdal, M. Krogh, E. Lundanesb, A.S.
Christophersen, J. Chromatog. B. 850,147-60,(2007).16. V. Ivanova, D. Zendelovska, N. Stefova, T. Stafilov, J. Biochem. Biophys.
Meth. 70,1297-1303,(2008).17. M. Rambla-Alegre, M.T. Gil-Agusti, M.E. Capella-Peiro, S. Carda-Broch,
J.S. Esteve-Romero, Journal of Chromatography B. 839,89-94, (2006).18. W. Sawicki, Journal of Pharmaceutical and Biomedical Analysis. 25,689-
695,(2001).19. A. Sioufi, F. Marfil, J. Godbillon, J. Liq. Chromatogr. 17,2179-86, (1994).
20. A. Ceccato, P. Chiapi, P. Hubert, B. Toussaint, J. Crommen, J. Chromatogr. A. 750,351-60, (1996).
21. C. Koppel, A. Wagemann, J. Chromatogr. 570,229-34, (1991).22. I. Jane, A. McKinnon, R.J.Flanagan, J. Chromatogr. 323,191-225,(1985).23. B. Spiegelhalder, M. Eichelbaum, Arzneimittelforschung. 27,94-7,(1977).24. V. Richter, M. Elchelbaum, F. Schonberger, U. Hofmann, J. Chromatogr.
B: Biomed. Sci. Appl. 738,137-47, (2000).25. K.M. Deppermann, H. Lode, Drugs. 45,65-72, (1993).26. C.B. Ojeda, F.S. Rajas, J.M.C. Pavon, Talanta. 42,1195-1214, (1995).27. Y. El-Sayed Abdel-Aziz, A. El-Salem Najeb, Analytical Sciences. 21,595-
614, (2005).28. A. Gursoy, E. Kut, S. Ozkirimli, Int.J. Pharm. 271,115-123, (2004).29. L. Wang, M. Asgharnejad, J. Pharm Biomed Anal. 21,1243-48,(2000).30. M. Kazemipour, E. Noroozian, M.S. Tehrani, M. Mahmoudian, J. Pharm
Biomed Anal. 30, 1379-1384, (2002).