Embed Size (px)
Citation preview

NAICS 32312
Support Activities for Printing (Prepress, Postpress, Other Finishing Services)
Exclusive Commentary from Dr. Joe Webb and Richard Romano
1

NAICS 32312
Exclusive Commentary
Support Activities for Printing (Prepress, Postpress, Other Finishing Services) NAICS 32312
The Bureau of the Census definition for this business classification:
This industry comprises establishments primarily engaged in performing prepress and postpress services in support of printing activities. Prepress services may include such things as platemaking, typesetting, trade binding, and sample mounting. Postpress services include such things as book or paper bronzing, die cutting, edging, embossing, folding, gilding, gluing, and indexing.
Geographic Distribution • California (13.4%), New York (7.8%), and Illinois (6.7%) are the three biggest states for
pre- and postpress and other printing support establishments. Pennsylvania, New Jersey, and Georgia include some of the larger establishments in this classification.
• New York-Newark-Jersey City (9.5%), Los Angeles-Long Beach-Anaheim (7.2%), and Chicago-Naperville-Elgin (5.9%) are the top three metro areas for printing support establishments.
• In general, Metropolitan Statistical Areas (MSAs) are urbanized areas that have at least
50,000 people. Combined Statistical Areas (CSAs) are much larger metropolitan population
regions that include MSAs as well as associated bordering areas. For more details, please
refer to the “Key Terms and Definitions” beginning on page 5 of this report.
• The top two combined statistical areas (CSAs) are:
Combined Statistical Area New York Los Angeles % of All Establishments 10.8% 8.0%
Establishments 173 128
Employees 2,295 1,475
Payroll $111 Million $65 Million
Sales $288 Million $189 Million
Capital Expenditures $9 Million $6 Million
Demographics
Establishments
• In 2015, there were 1,598 establishments in this business category.
• Two-thirds of printing support activity establishments have under 10 employees.
More than 90% of establishments have under 50 employees.
2

NAICS 32312
Commentary (continued)
• Since at least 2010, establishments in this classification have been declining (down -23.3% from 2010 to 2015).
The decline has slowed in recent years (-2.4% from 2014 to 2015).
• The declines are spread among all size classifications, especially 50- to 99-employee (-15.7%) and 10- to 19-employee (-9.6%).
Employees
• Employment in this classification is also declining.
• In 2015, there were a total of 26,378 employees in this business category.
• From 2014 to 2015, total employment among printing support activities declined by -4.8%.
Particularly in the 50- to 99- (-19.3%) and 10- to 19-employee ranges (-9.9%).
• From 2014 to 2015, payroll for printing support activity businesses declined -3.5%.
Among smaller businesses there were some increases: +4.8% in both 1- to 9- and 10- to 19-employee establishments.
• Establishments in the 10- to 19-employee range saw payrolls decline by -6.1% and in the 50- to 99-employee range decline by -18.7%.
Revenues/Value of Shipments
• In 2015, printing support establishments reported sales of $3.4 billion.
• Large establishments accounted for 59% of sales, mid-size shops accounted for 32%, and small shops accounted for 9% of sales—despite the latter having the greatest number of establishments.
• Regionally, the Great Lakes states accounted for about one-third of sales (33.5%).
• The South Western region only accounted for 4.0% of printing support activity sales.
Capital Expenditures
• In 2015, printing support activity establishments spent $103 million on capital expenditures.
The majority of those outlays (59%) were by large (50+-employee) establishments.
3

NAICS 32312
Commentary (continued)
Technology Impacts and Competitive Trends
Technology Impacts
• The combination of both pre- and postpress services in this classification obscures overall trends.
Prepress services as a business class have been declining since the 1990s, thanks to in-house prepress and growth of digital printing.
• Desktop publishing software, digital photography, and other advances in imaging shifted previous pre-press tasks to designers and content creators, and commercial photographers.
Postpress services such as binding and finishing are faring better thanks to better automation and therefore productivity.
• As well as the growth of “digital embellishments” (Scodix, MGI, Highcon).
Competitive Trends
• Competition for businesses in this category comes from printers insourcing these abilities.
• Prepress is the most susceptible to insourcing—if not complete elimination—although some film output likely still exists.
• As printers adopt digital printing—especially production inkjet—complementary finishing capabilities, inline or nearline, are becoming top considerations.
• Offering digital embellishment services is perhaps the best competitive advantage for businesses specializing in finishing.
4

NAICS 32312
Key Terms and Definitions
Annual Survey of Manufactures (Source) - The Annual Survey of Manufactures (ASM) provides key intercensal measures of manufacturing activity, products, and
location for the public and private sectors. The ASM provides the best measure of current U.S. manufacturing industry
outputs, inputs, operating status, and is the primary basis for updates of the Longitudinal Research Database (LRD). Census
Bureau staff and academic researchers use the LRD for micro data analysis.
Statistics are available on a sample universe of manufacturing establishments with one or more paid employees at any time
during the year for manufacturing classified in NAICS sectors 31–33. Employment, payroll, hours, cost of materials, receipts,
value added, capital expenditures, and relative standard errors data are available for the U.S. and states at the 2- through 4-
digit NAICS levels. Product shipments value data are available at the 6-digit North American Industry Classification System
(NAICS) level and 7-digit NAICS product class levels based on NAICS.
The ASM is conducted annually, except for years ending in 2 and 7, at which time ASM data are included in the manufacturing
sector of the Economic Census.
Consolidated (or Combined) Statistical Area (CSA) - Consolidated Statistical Areas are a combination of metropolitan areas that have significant economic interaction and
dependency. PrintStats includes the top five CSAs in each report based on total population, without regard to the number of
industry establishments. These CSAs are very large, and in fact, larger than many countries. These are the details of their
composition:
• New York CSA is the combination of these Metropolitan and Micropolitan Statistical Areas: New York-Newark-
Jersey City, Bridgeport-Stamford-Norwalk, New Haven-Milford, Allentown-Bethlehem-Easton, Trenton,
Torrington, Kingston, East Stroudsburg
• Los Angeles CSA includes: Los Angeles-Long Beach-Anaheim, Riverside-San Bernardino-Ontario, Oxnard-
Thousand Oaks-Ventura
• Chicago CSA includes: Chicago-Naperville-Elgin, Ottawa-Peru, Kankakee, Michigan City-La Porte
• Washington D.C. CSA includes: Washington-Arlington-Alexandria, DC-VA-MD-WV, Baltimore-Columbia-
Towson, Hagerstown-Martinsburg, Chambersburg-Waynesboro, Winchester, California-Lexington Park, Easton,
Cambridge
• San Francisco CSA includes: San Francisco-Oakland-Hayward, San Jose-Sunnyvale-Santa Clara, Stockton-Lodi,
Santa Rosa, Vallejo-Fairfield, Santa Cruz-Watsonville, Napa
(see also Metropolitan Statistical Area)
Content Creation (Source) - The contribution of information to any medium/media, especially to digital media for an end-user/audience in specific
contexts. “Content” can be text, photographic images, illustrations, graphic design, video, or any other intellectual property.
Typical forms of modern content creation include maintaining and updating web sites, blogging, photography, videography,
online commentary, the maintenance of social media accounts, and editing and distribution of digital media.
County Business Patterns [CBP] (Source) - CBP is an annual series that provides subnational economic data by industry. This series includes the number of
establishments, employment during the week of March 12, first quarter payroll, and annual payroll.
5

NAICS 32312
Key Terms and Definitions (continued)
Demographics (Source) - The statistical characteristics of human populations (such as age or income) used especially to identify markets. In business, a
particular market or segment of the population.
Economic Census (Source) - The Economic Census is the U.S. Government's official five-year measure of American business and the economy. It is
conducted by the U.S. Census Bureau, and response is required by law.
Employee (Source) - An individual hired by another individual or business usually for wages or salary and in a position below the executive level.
Establishment (Source) - An establishment is a single physical location at which business is conducted or where services or industrial operations are
performed. It is not necessarily identical with a company or enterprise, which may consist of one or more establishments.
Estimate (Source) - A value that is usable for some purpose even if input data may be incomplete, uncertain, or unstable. The value is nonetheless
usable because it is derived from the best information available. Typically, deriving an estimate involves using the value of a
statistic derived from a sample to estimate the value of a corresponding population parameter. The sample provides
information that can be projected, through various formal or informal processes, to determine a range most likely to describe
the missing information.
Forecast (Source) - Forecasting is the use of historic data to determine the direction of future trends. Businesses use forecasting to determine
how to allocate their budgets or plan for anticipated expenses for an upcoming period of time. This is typically based on the
projected demand for the goods and services they offer.
In terms of PrintStats, the forecasts are limited to statistical trends based on past statistical data. They are not forecasts based
on industry surveys or assessment of economic, social, or technological changes. The PrintStats forecast data should be
viewed only as a starting point for a formal forecast process.
M3 Manufacturing Survey (Source) - The Manufacturers’ Shipments, Inventories, and Orders (M3) survey provides broad-based, monthly statistical data on
economic conditions in the domestic manufacturing sector. The survey measures current industrial activity and provides an
indication of future business trends.
Metropolitan Area (Source) - A metropolitan area, sometimes referred to as a metro area or commuter belt, is a region consisting of a densely populated
urban core and its less-populated surrounding territories, sharing industry, infrastructure, and housing. A metro area usually
comprises multiple jurisdictions and municipalities: neighborhoods, townships, boroughs, cities, towns, exurbs, suburbs,
counties, districts, states, and even nations like the eurodistricts. As social, economic, and political institutions have changed,
metropolitan areas have become key economic and political regions. Metropolitan areas include one or more urban areas, as
well as satellite cities, towns, and intervening rural areas that are socio-economically tied to the urban core, typically
measured by commuting patterns.
6

NAICS 32312
Key Terms and Definitions (continued)
Metropolitan Statistical Area [MSA] (Source) - In the United States, a metropolitan statistical area (MSA) is a geographical region with a relatively high population density at
its core and close economic ties throughout the area. Such regions are neither legally incorporated as a city or town would
be, nor are they legal administrative divisions like counties or separate entities such as states. As such, the precise definition
of any given metropolitan area can vary with the source. A typical metropolitan area is centered on a single large city that
wields substantial influence over the region (e.g., Chicago or Atlanta). However, some metropolitan areas contain more than
one large city with no single municipality holding a substantially dominant position (e.g., Dallas–Fort Worth metroplex,
Norfolk-Virginia Beach [Hampton Roads], Riverside–San Bernardino [Inland Empire], or Minneapolis–Saint Paul).
MSAs are defined by the Office of Management and Budget (OMB) and used by the Census Bureau and other Federal
government agencies for statistical purposes.
(See also Consolidated Statistical Area)
NAICS (Source) - The North American Industry Classification System (NAICS) is the standard used by Federal statistical agencies in classifying
business establishments for the purpose of collecting, analyzing, and publishing statistical data related to the U.S. business
economy.
Nonemployer Statistics (Source) - Nonemployer Statistics is an annual series that provides subnational economic data for businesses that have no paid
employees and are subject to Federal income tax. The data consist of the number of businesses and total receipts by industry.
Most nonemployers are self-employed individuals operating unincorporated businesses (known as sole proprietorships),
which may or may not be the owner's principal source of income.
The majority of all business establishments in the United States are nonemployers, yet these firms average less than 4
percent of all sales and receipts nationally. Due to their small economic impact, these firms are excluded from most other
Census Bureau business statistics (the primary exception being the Survey of Business Owners). The Nonemployers Statistics
series is the primary resource available to study the scope and activities of nonemployers at a detailed geographic level. For
complementary statistics on the firms that do have paid employees, refer to the County Business Patterns. Additional sources
of data on small businesses include the Economic Census, and the Statistics of U.S. Businesses.
Packaging (Source) - Packaging is the technology of enclosing or protecting products for distribution, storage, sale, and use. Packaging also refers
to the process of designing, evaluating, and producing packages. Packaging can be described as a coordinated system of
preparing goods for transport, warehousing, logistics, sale, and end use. In the graphic arts, packaging refers to the design,
manufacturing, and decoration (usually via printing and related technologies) of corrugated paperboard containers, folding
cardboard cartons and containers, paper bags, flexible plastic packaging, and other paper, paperboard, and plastic materials.
Payroll (Source) - Payroll is the sum total of all compensation a business must pay to its employees for a set period of time or on a given date.
Payroll is reported before deductions for social security, income tax, insurance, union dues, etc. This definition of payroll is
the same as that used by the Internal Revenue Service.
7

NAICS 32312
Key Terms and Definitions (continued)
Quarterly Census of Employment and Wages [QCEW] (Source) - The Quarterly Census of Employment and Wages (QCEW) program publishes a quarterly count of employment and wages
reported by employers covering more than 95 percent of U.S. jobs, available at the county, MSA, state, and national levels by
industry.
Quarterly Services Survey (Source) - The Quarterly Services Survey (QSS) is the only source of service industry indicator performance providing timely estimates
of revenue and expenses for selected service industries. The QSS is a principal economic indicator series that produces, for
selected service industries, quarterly estimates of total operating revenue and the percentage of revenue by class of
customer (government, business, consumers, and individuals). The survey also produces estimates of total operating
expenses from tax-exempt firms in industries that have a large not-for-profit component. In addition, for hospital services,
the survey estimates the number of inpatient days and discharges.
Region (Source) - Census Regions are groupings of states and the District of Columbia that subdivide the United States for the presentation of
Census data. There are four Census regions—Northeast, Midwest, South, and West. Each of the four Census regions is
divided into two or more Census divisions. Each Census region is identified by a single-digit Census code. Puerto Rico and
the Island Areas are not part of any Census region or Census division.
PrintStats uses eight regions based on industrial economic activity rather than the Census regions. The 50 U.S. states and
District of Columbia are allocated as follows:
• New England: Connecticut, Maine, Massachusetts, New Hampshire, Rhode Island, Vermont
• Mid-Eastern: Delaware, District of Columbia, Maryland, New Jersey, New York, Pennsylvania, West Virginia
• South Eastern: Alabama, Florida, Georgia, Kentucky, Mississippi, North Carolina, South Carolina, Tennessee,
Virginia
• Great Lakes: Illinois, Indiana, Michigan, Minnesota, Ohio, Wisconsin
• North Central: Idaho, Iowa, Kansas, Missouri, Montana, Nebraska, North Dakota, South Dakota, Wyoming
• South Central: Arkansas, Louisiana, Oklahoma, Texas
• South Western: Arizona, Colorado, Nevada, New Mexico, Utah
• Western: Alaska, California, Hawaii, Oregon, Washington
8

Support Activities For Printing (prepress, Postpress, Other Finishing Services) (NAICS 32312)
Baseline data from County Business Patterns
This workbook contains the following datasheets (click to open)
Establishments 2015 (Summarized Size Classes)Establishments 2013 (Summarized Size Classes)Establishments 2015 Changes (Summarized Size Classes)Establishments 2015 (Detailed Size Classes)Establishments 2013 (Detailed Size Classes)Establishments 2015 Changes (Detailed Size Classes)Employees 2015 (Summarized Size Classes)Employees 2015 (Detailed Size Classes)Payrolls 2015 (Summarized Size Classes)Payrolls 2015 (Detailed Size Classes)Sales 2015 (Summarized Size Classes)Sales 2015 (Detailed Size Classes)Capital Expenditures 2015 (Summarized Size Classes)Capital Expenditures 2015 (Detailed Size Classes)Top 15 States 2015 Top 25 Metros 2015 Top 5 Major Metropolitan Areas (Combined Statistical Areas)Estimates and Statistical Trend 2016-2022
email: [email protected]
Produced exclusively for NPESCopyright 2017, Non-Routine LLC and Strategies for Management, Inc.
9

% of Total Region Rank and State Rank All Sizes Small: 1-9
Empls.Medium: 10-49
Empls.Large: >50+
Empls.
Avg. Employees/
Estab.
U.S. states + DC 100.0% - 1,598 1,072 408 118 16.5
New England 4.6% 8 74 46 21 7 15.7 Connecticut 1.0% 25 16 9 6 1 15.4 Maine 0.4% 36 6 5 1 7.8 Massachusetts 2.4% 15 39 24 10 5 19.7 New Hampshire 0.3% 38 5 3 2 9.2 Rhode Island 0.3% 38 5 3 2 10.8 Vermont 0.2% 43 3 2 1
Mid-Eastern 18.1% 3 289 180 89 20 19.4 Delaware 48 Washington DC 0.1% 46 1 1 Maryland 2.1% 17 34 24 8 2 13.0 New Jersey 5.0% 6 80 48 26 6 15.8 New York 7.8% 2 124 84 36 4 11.5 Pennsylvania 3.1% 10 49 22 19 8 50.8 West Virginia 0.1% 46 1 1
South Eastern 18.1% 2 290 196 71 23 15.7 Alabama 0.6% 32 9 7 2 5.6 Florida 5.4% 5 87 78 8 1 5.3 Georgia 2.9% 12 46 19 20 7 33.5 Kentucky 1.0% 25 16 9 6 1 21.8 Mississippi 0.3% 38 5 3 2 8.8 North Carolina 3.1% 10 49 29 14 6 16.6 South Carolina 0.9% 27 14 8 5 1 13.3 Tennessee 1.9% 19 30 17 8 5 20.2 Virginia 2.1% 17 34 26 6 2 14.4
Great Lakes 24.3% 1 389 231 121 37 22.1 Illinois 6.7% 3 107 68 25 14 27.2 Indiana 2.2% 16 35 20 11 4 23.7 Michigan 4.4% 8 70 49 19 2 12.5 Minnesota 3.6% 9 58 25 29 4 24.7 Ohio 4.9% 7 78 54 17 7 19.4 Wisconsin 2.6% 13 41 15 20 6 25.6
North Central 5.4% 6 87 64 14 9 13.6 Idaho 0.5% 33 8 7 1 8.6 Iowa 0.6% 31 10 8 1 1 11.1 Kansas 0.8% 28 12 9 3 6.3 Missouri 2.6% 13 41 27 8 6 19.5 Montana 0.3% 38 5 5 2.6 Nebraska 0.5% 33 8 5 2 1 12.0 North Dakota 48 South Dakota 0.2% 43 3 3 5.7 Wyoming 48
South Central 7.6% 5 121 91 24 6 11.6 Arkansas 0.5% 33 8 6 2 8.4 Louisiana 0.8% 28 12 10 2 5.1 Oklahoma 0.8% 28 12 11 1 4.3 Texas 5.6% 4 89 64 19 6 13.7
South Western 5.1% 7 82 58 20 4 13.4 Arizona 1.6% 21 26 16 6 4 25.8 Colorado 1.4% 22 23 18 5 6.3 Nevada 0.4% 36 6 5 1 6.2 New Mexico 0.3% 38 5 5 3.4 Utah 1.4% 23 22 14 8 10.3
Western 16.6% 4 266 206 48 12 9.8 Alaska 0.1% 45 2 2 California 13.4% 1 214 168 35 11 10.2 Hawaii 48 Oregon 1.4% 23 22 16 6 8.2 Washington 1.8% 20 28 20 7 1 9.1
US States + District of Columbia Ranked by Number of
Establishments
Support Activities For Printing (prepress, Postpress, Other Finishing Services) (NAICS 32312), 2015Number of Establishments
10

% of Total Region Rank and State Rank All Sizes Small: 1-9
Empls.Medium: 10-49
Empls.Large: >50+
Empls.
Avg. Employees/
Estab.
U.S. states + DC 100.0% - 1,681 1,110 446 125 16.5
New England 4.7% 8 79 51 20 8 14.1 Connecticut 1.0% 27 17 10 6 1 13.3 Maine 0.4% 35 6 5 1 Massachusetts 2.4% 15 40 24 10 6 21.0 New Hampshire 0.3% 39 5 3 2 9.2 Rhode Island 0.4% 35 6 5 1 Vermont 0.3% 39 5 4 1
Mid-Eastern 19.4% 2 326 204 99 23 18.3 Delaware 0.1% 46 1 1 Washington DC 0.1% 46 1 1 Maryland 2.2% 16 37 23 13 1 13.6 New Jersey 5.5% 4 92 58 29 5 14.0 New York 8.1% 2 136 88 39 9 13.3 Pennsylvania 3.5% 10 58 32 18 8 40.8 West Virginia 0.1% 46 1 1
South Eastern 17.7% 3 298 196 84 18 13.6 Alabama 0.6% 32 10 8 2 5.6 Florida 4.7% 7 79 68 10 1 5.8 Georgia 2.9% 12 48 19 22 7 29.0 Kentucky 1.1% 26 18 10 6 2 26.8 Mississippi 0.3% 39 5 3 2 10.6 North Carolina 3.2% 11 54 32 19 3 15.6 South Carolina 1.1% 24 19 11 8 11.5 Tennessee 2.0% 19 34 22 9 3 16.7 Virginia 1.8% 21 31 23 6 2
Great Lakes 23.6% 1 396 228 123 45 21.0 Illinois 6.5% 3 110 65 30 15 28.8 Indiana 2.1% 18 35 20 11 4 24.7 Michigan 3.8% 8 64 48 13 3 Minnesota 3.6% 9 60 26 25 9 27.7 Ohio 4.9% 6 83 52 23 8 19.5 Wisconsin 2.6% 13 44 17 21 6 22.8
North Central 5.5% 6 92 67 16 9 9.2 Idaho 0.5% 33 8 7 1 Iowa 0.7% 30 11 8 2 1 Kansas 1.0% 28 16 12 4 5.6 Missouri 2.6% 14 43 28 9 6 17.7 Montana 0.3% 39 5 5 Nebraska 0.4% 35 6 4 1 1 North Dakota 50 South Dakota 0.2% 44 3 3 Wyoming 50
South Central 6.8% 5 115 83 26 6 12.5 Arkansas 0.4% 35 6 4 2 Louisiana 0.7% 30 11 10 1 Oklahoma 0.7% 29 12 10 2 5.5 Texas 5.1% 5 86 59 21 6 16.0
South Western 5.4% 7 91 66 21 4 12.4 Arizona 1.9% 20 32 21 7 4 21.6 Colorado 1.6% 22 27 21 6 6.0 Nevada 0.5% 33 8 7 1 4.6 New Mexico 0.3% 39 5 5 3.4 Utah 1.1% 24 19 12 7 11.6
Western 16.9% 4 284 215 57 12 9.5 Alaska 0.1% 45 2 2 California 13.1% 1 221 167 43 11 10.2 Hawaii 0.1% 46 1 1 Oregon 1.4% 23 24 18 6 7.2 Washington 2.1% 17 36 27 8 1 7.5
US States + District of Columbia Ranked by Number of
Establishments
Support Activities For Printing (prepress, Postpress, Other Finishing Services) (NAICS 32312), 2013Number of Establishments
11

Region Rank and State Rank All Sizes Small: 1-9
Empls.Medium: 10-49
Empls.Large: >50+
Empls.
Avg. Employees/
Estab.
U.S. states + DC - (83) (38) (38) (7) 0.0
New England 2 (5) (5) 1 (1) 1.7 Connecticut 7 (1) (1) 2.1 Maine 6 7.8 Massachusetts 8 (1) (1) (1.2)New Hampshire 7 Rhode Island 8 (1) (2) 1 10.8 Vermont 8 (2) (2)
Mid-Eastern 7 (37) (24) (10) (3) 1.2 Delaware 8 (1) (1)Washington DC 7 Maryland 9 (3) 1 (5) 1 (0.6)New Jersey 16 (12) (10) (3) 1 1.8 New York 17 (12) (4) (3) (5) (1.8)Pennsylvania 15 (9) (10) 1 10.0 West Virginia 7
South Eastern 4 (8) (13) 5 2.0 Alabama 8 (1) (1) (0.0)Florida 1 8 10 (2) (0.4)Georgia 9 (2) (2) 4.5 Kentucky 9 (2) (1) (1) (5.1)Mississippi 7 (1.8)North Carolina 11 (5) (3) (5) 3 1.1 South Carolina 12 (5) (3) (3) 1 1.8 Tennessee 10 (4) (5) (1) 2 3.5 Virginia 3 3 3 14.4
Great Lakes 3 (7) 3 (2) (8) 1.1 Illinois 10 (3) 3 (5) (1) (1.6)Indiana 7 (1.0)Michigan 2 6 1 6 (1) 12.5 Minnesota 9 (2) (1) 4 (5) (3.0)Ohio 12 (5) 2 (6) (1) (0.1)Wisconsin 10 (3) (2) (1) 2.8
North Central 3 (5) (3) (2) 4.3 Idaho 7 8.6 Iowa 8 (1) (1) 11.1 Kansas 11 (4) (3) (1) 0.7 Missouri 9 (2) (1) (1) 1.8 Montana 7 2.6 Nebraska 4 2 1 1 12.0 North Dakota 7 South Dakota 7 5.7 Wyoming 7
South Central 1 6 8 (2) (0.9)Arkansas 5 2 2 8.4 Louisiana 5 1 1 5.1 Oklahoma 7 1 (1) (1.3)Texas 4 3 5 (2) (2.2)
South Western 5 (9) (8) (1) 1.0 Arizona 12 (6) (5) (1) 4.3 Colorado 11 (4) (3) (1) 0.3 Nevada 9 (2) (2) 1.5 New Mexico 7 Utah 4 3 2 1 (1.3)
Western 6 (18) (9) (9) 0.3 Alaska 7 California 13 (7) 1 (8) (0.0)Hawaii 8 (1) (1)Oregon 9 (2) (2) 1.1 Washington 14 (8) (7) (1) 1.6
US States + District of Columbia Ranked by Change in Number of
Establishments
Support Activities For Printing (prepress, Postpress, Other Finishing Services) (NAICS 32312), 2015
Change in Number of Establishments
12
% of TotalRegion Rank
and State Rank
All Sizes 1-4Empls.
5-9 Empls.
10-19Empls.
20-49Empls.
50-99Empls.
100-249Empls.
250-499Empls.
500+Empls.
Avg. Employees/
Estab.
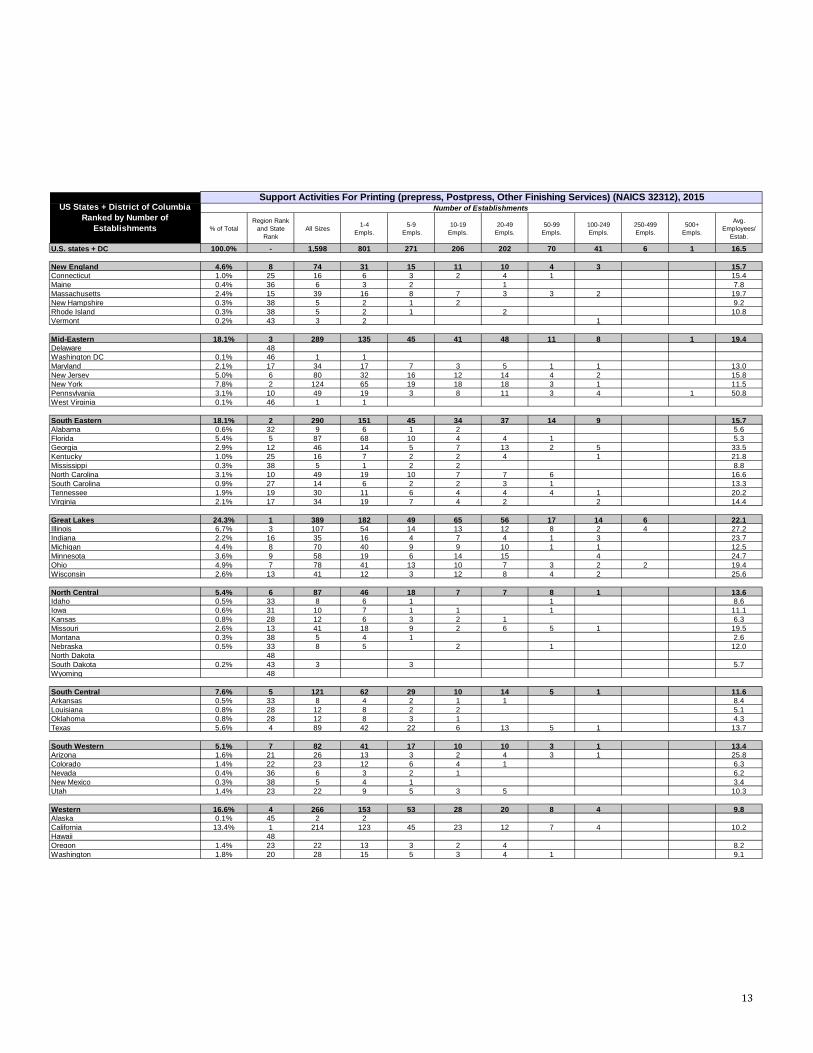
U.S. states + DC 100.0% - 1,598 801 271 206 202 70 41 6 1 16.5
New England 4.6% 8 74 31 15 11 10 4 3 15.7 Connecticut 1.0% 25 16 6 3 2 4 1 15.4 Maine 0.4% 36 6 3 2 1 7.8 Massachusetts 2.4% 15 39 16 8 7 3 3 2 19.7 New Hampshire 0.3% 38 5 2 1 2 9.2 Rhode Island 0.3% 38 5 2 1 2 10.8 Vermont 0.2% 43 3 2 1
Mid-Eastern 18.1% 3 289 135 45 41 48 11 8 1 19.4 Delaware 48 Washington DC 0.1% 46 1 1 Maryland 2.1% 17 34 17 7 3 5 1 1 13.0 New Jersey 5.0% 6 80 32 16 12 14 4 2 15.8 New York 7.8% 2 124 65 19 18 18 3 1 11.5 Pennsylvania 3.1% 10 49 19 3 8 11 3 4 1 50.8 West Virginia 0.1% 46 1 1
South Eastern 18.1% 2 290 151 45 34 37 14 9 15.7 Alabama 0.6% 32 9 6 1 2 5.6 Florida 5.4% 5 87 68 10 4 4 1 5.3 Georgia 2.9% 12 46 14 5 7 13 2 5 33.5 Kentucky 1.0% 25 16 7 2 2 4 1 21.8 Mississippi 0.3% 38 5 1 2 2 8.8 North Carolina 3.1% 10 49 19 10 7 7 6 16.6 South Carolina 0.9% 27 14 6 2 2 3 1 13.3 Tennessee 1.9% 19 30 11 6 4 4 4 1 20.2 Virginia 2.1% 17 34 19 7 4 2 2 14.4
Great Lakes 24.3% 1 389 182 49 65 56 17 14 6 22.1 Illinois 6.7% 3 107 54 14 13 12 8 2 4 27.2 Indiana 2.2% 16 35 16 4 7 4 1 3 23.7 Michigan 4.4% 8 70 40 9 9 10 1 1 12.5 Minnesota 3.6% 9 58 19 6 14 15 4 24.7 Ohio 4.9% 7 78 41 13 10 7 3 2 2 19.4 Wisconsin 2.6% 13 41 12 3 12 8 4 2 25.6
North Central 5.4% 6 87 46 18 7 7 8 1 13.6 Idaho 0.5% 33 8 6 1 1 8.6 Iowa 0.6% 31 10 7 1 1 1 11.1 Kansas 0.8% 28 12 6 3 2 1 6.3 Missouri 2.6% 13 41 18 9 2 6 5 1 19.5 Montana 0.3% 38 5 4 1 2.6 Nebraska 0.5% 33 8 5 2 1 12.0 North Dakota 48 South Dakota 0.2% 43 3 3 5.7 Wyoming 48
South Central 7.6% 5 121 62 29 10 14 5 1 11.6 Arkansas 0.5% 33 8 4 2 1 1 8.4 Louisiana 0.8% 28 12 8 2 2 5.1 Oklahoma 0.8% 28 12 8 3 1 4.3 Texas 5.6% 4 89 42 22 6 13 5 1 13.7
South Western 5.1% 7 82 41 17 10 10 3 1 13.4 Arizona 1.6% 21 26 13 3 2 4 3 1 25.8 Colorado 1.4% 22 23 12 6 4 1 6.3 Nevada 0.4% 36 6 3 2 1 6.2 New Mexico 0.3% 38 5 4 1 3.4 Utah 1.4% 23 22 9 5 3 5 10.3
Western 16.6% 4 266 153 53 28 20 8 4 9.8 Alaska 0.1% 45 2 2 California 13.4% 1 214 123 45 23 12 7 4 10.2 Hawaii 48 Oregon 1.4% 23 22 13 3 2 4 8.2 Washington 1.8% 20 28 15 5 3 4 1 9.1
US States + District of Columbia Ranked by Number of
Establishments
Support Activities For Printing (prepress, Postpress, Other Finishing Services) (NAICS 32312), 2015Number of Establishments
13

% of TotalRegion Rank
and State Rank
All Sizes 1-4Empls.
5-9 Empls.
10-19Empls.
20-49Empls.
50-99Empls.
100-249Empls.
250-499Empls.
500+Empls.
Avg. Employees/
Estab.
U.S. states + DC 100.0% - 1,681 823 287 229 217 80 39 5 1 16.5
New England 4.7% 8 79 31 20 13 7 5 3 14.1 Connecticut 1.0% 27 17 6 4 3 3 1 13.3 Maine 0.4% 35 6 3 2 1 Massachusetts 2.4% 15 40 12 12 8 2 4 2 21.0 New Hampshire 0.3% 39 5 2 1 2 9.2 Rhode Island 0.4% 35 6 4 1 1 Vermont 0.3% 39 5 4 1
Mid-Eastern 19.4% 2 326 158 46 50 49 15 7 1 18.3 Delaware 0.1% 46 1 1 Washington DC 0.1% 46 1 1 Maryland 2.2% 16 37 16 7 5 8 1 13.6 New Jersey 5.5% 4 92 42 16 16 13 3 2 14.0 New York 8.1% 2 136 71 17 23 16 7 2 13.3 Pennsylvania 3.5% 10 58 26 6 6 12 4 3 1 40.8 West Virginia 0.1% 46 1 1
South Eastern 17.7% 3 298 149 47 39 45 10 8 13.6 Alabama 0.6% 32 10 5 3 2 5.6 Florida 4.7% 7 79 56 12 6 4 1 5.8 Georgia 2.9% 12 48 14 5 7 15 3 4 29.0 Kentucky 1.1% 26 18 7 3 3 3 2 26.8 Mississippi 0.3% 39 5 3 1 1 10.6 North Carolina 3.2% 11 54 24 8 8 11 3 15.6 South Carolina 1.1% 24 19 8 3 4 4 11.5 Tennessee 2.0% 19 34 16 6 5 4 2 1 16.7 Virginia 1.8% 21 31 16 7 3 3 1 1
Great Lakes 23.6% 1 396 169 59 61 62 25 15 5 21.0 Illinois 6.5% 3 110 54 11 14 16 7 4 4 28.8 Indiana 2.1% 18 35 13 7 4 7 1 3 24.7 Michigan 3.8% 8 64 35 13 5 8 2 1 Minnesota 3.6% 9 60 17 9 10 15 5 4 27.7 Ohio 4.9% 6 83 40 12 14 9 5 3 19.5 Wisconsin 2.6% 13 44 10 7 14 7 5 1 22.8
North Central 5.5% 6 92 48 19 9 7 9 9.2 Idaho 0.5% 33 8 5 2 1 Iowa 0.7% 30 11 8 1 1 1 Kansas 1.0% 28 16 9 3 4 5.6 Missouri 2.6% 14 43 19 9 3 6 6 17.7 Montana 0.3% 39 5 4 1 Nebraska 0.4% 35 6 3 1 1 1 North Dakota 50 South Dakota 0.2% 44 3 3 Wyoming 50
South Central 6.8% 5 115 56 27 12 14 3 3 12.5 Arkansas 0.4% 35 6 3 1 1 1 Louisiana 0.7% 30 11 7 3 1 Oklahoma 0.7% 29 12 5 5 2 5.5 Texas 5.1% 5 86 41 18 8 13 3 3 16.0
South Western 5.4% 7 91 53 13 9 12 3 1 12.4 Arizona 1.9% 20 32 18 3 2 5 3 1 21.6 Colorado 1.6% 22 27 18 3 5 1 6.0 Nevada 0.5% 33 8 5 2 1 4.6 New Mexico 0.3% 39 5 4 1 3.4 Utah 1.1% 24 19 8 4 1 6 11.6
Western 16.9% 4 284 159 56 36 21 10 2 9.5 Alaska 0.1% 45 2 2 California 13.1% 1 221 119 48 28 15 9 2 10.2 Hawaii 0.1% 46 1 1 Oregon 1.4% 23 24 13 5 3 3 7.2 Washington 2.1% 17 36 24 3 5 3 1 7.5
US States + District of Columbia Ranked by Number of
Establishments
Support Activities For Printing (prepress, Postpress, Other Finishing Services) (NAICS 32312), 2013Number of Establishments
14

Region Rank and State Rank All Sizes 1-4
Empls.5-9
Empls.10-19
Empls.20-49
Empls.50-99
Empls.100-249Empls.
250-499Empls.
500+Empls.
Avg. Employees/
Estab.
U.S. states + DC - (83) (22) (16) (23) (15) (10) 2 1 0.0
New England 2 (5) (5) (2) 3 (1) 1.7 Connecticut 7 (1) (1) (1) 1 2.1 Maine 6 7.8 Massachusetts 8 (1) 4 (4) (1) 1 (1) (1.2)New Hampshire 7 Rhode Island 8 (1) (2) 1 10.8 Vermont 8 (2) (2)
Mid-Eastern 7 (37) (23) (1) (9) (1) (4) 1 1.2 Delaware 8 (1) (1)Washington DC 7 Maryland 9 (3) 1 (2) (3) 1 (0.6)New Jersey 16 (12) (10) (4) 1 1 1.8 New York 17 (12) (6) 2 (5) 2 (4) (1) (1.8)Pennsylvania 15 (9) (7) (3) 2 (1) (1) 1 10.0 West Virginia 7
South Eastern 4 (8) 2 (2) (5) (8) 4 1 2.0 Alabama 8 (1) 1 (2) (0.0)Florida 1 8 12 (2) (2) (0.4)Georgia 9 (2) (2) (1) 1 4.5 Kentucky 9 (2) (1) (1) 1 (1) (5.1)Mississippi 7 (2) 2 1 (1) (1.8)North Carolina 11 (5) (5) 2 (1) (4) 3 1.1 South Carolina 12 (5) (2) (1) (2) (1) 1 1.8 Tennessee 10 (4) (5) (1) 2 3.5 Virginia 3 3 3 1 (1) (1) 1 14.4
Great Lakes 3 (7) 13 (10) 4 (6) (8) (1) 1 1.1 Illinois 10 (3) 3 (1) (4) 1 (2) (1.6)Indiana 7 3 (3) 3 (3) (1.0)Michigan 2 6 5 (4) 4 2 (1) 1 (1) 12.5 Minnesota 9 (2) 2 (3) 4 (5) (3.0)Ohio 12 (5) 1 1 (4) (2) (2) (1) 2 (0.1)Wisconsin 10 (3) 2 (4) (2) 1 (1) 1 2.8
North Central 3 (5) (2) (1) (2) (1) 1 4.3 Idaho 7 1 (1) 8.6 Iowa 8 (1) (1) 1 (1) 11.1 Kansas 11 (4) (3) (2) 1 0.7 Missouri 9 (2) (1) (1) (1) 1 1.8 Montana 7 2.6 Nebraska 4 2 2 (1) 1 12.0 North Dakota 7 South Dakota 7 5.7 Wyoming 7
South Central 1 6 6 2 (2) 2 (2) (0.9)Arkansas 5 2 1 1 8.4 Louisiana 5 1 1 (1) 1 5.1 Oklahoma 7 3 (2) (1) (1.3)Texas 4 3 1 4 (2) 2 (2) (2.2)
South Western 5 (9) (12) 4 1 (2) 1.0 Arizona 12 (6) (5) (1) 4.3 Colorado 11 (4) (6) 3 (1) 0.3 Nevada 9 (2) (2) 1.5 New Mexico 7 Utah 4 3 1 1 2 (1) (1.3)
Western 6 (18) (6) (3) (8) (1) (2) 2 0.3 Alaska 7 California 13 (7) 4 (3) (5) (3) (2) 2 (0.0)Hawaii 8 (1) (1)Oregon 9 (2) (2) (1) 1 1.1 Washington 14 (8) (9) 2 (2) 1 1.6
US States + District of Columbia Ranked by Change in Number of
Establishments
Support Activities For Printing (prepress, Postpress, Other Finishing Services) (NAICS 32312), 2015Change in Number of Establishments
15

% of TotalRegion Rank
and State Rank
All Sizes Small: 1-9 Empls.
Medium: 10-49 Empls.
Large: >50+ Empls.
U.S. states + DC 100.0% - 26,378 3,198 9,124 14,056
New England 5.0% 6 1,319 152 475 693 Connecticut 0.9% 23 246 30 154 62 (3)Maine 0.2% 38 47 16 31 (3)Massachusetts 2.9% 15 769 82 210 477 (4)New Hampshire 0.2% 39 46 12 34 (3)Rhode Island 0.2% 35 54 7 47 (3)Vermont 0.6% 27 157 4 154 (3)
Mid-Eastern 21.3% 2 5,622 556 2,091 2,975 Delaware 48 Washington DC 0.0% 46 2 2 (3)Maryland 1.7% 20 442 80 197 165 (4)New Jersey 4.8% 8 1,264 169 558 537 (4)New York 5.4% 7 1,425 234 867 324 (4)Pennsylvania 9.4% 2 2,487 69 469 1,949 (4)West Virginia 0.0% 46 2 2 (3)
South Eastern 17.2% 3 4,547 579 1,670 2,298 Alabama 0.2% 37 50 22 28 (3)Florida 1.8% 19 464 187 227 50 (4)Georgia 5.8% 4 1,543 54 509 980 (4)Kentucky 1.3% 21 348 28 146 174 (3)Mississippi 0.2% 40 44 15 29 (3)North Carolina 3.1% 13 814 105 325 384 South Carolina 0.7% 25 186 21 97 68 (3)Tennessee 2.3% 17 607 62 189 356 (4)Virginia 1.9% 18 491 84 120 287 (3)
Great Lakes 32.6% 1 8,612 636 2,587 5,389 Illinois 11.0% 1 2,911 179 522 2,210 (4)Indiana 3.1% 12 829 64 225 540 (4)Michigan 3.3% 11 874 116 429 329 (4)Minnesota 5.4% 6 1,435 61 710 664 Ohio 5.7% 5 1,514 165 318 1,031 (4)Wisconsin 4.0% 10 1,049 51 383 615 (4)
North Central 4.5% 7 1,182 187 324 671 Idaho 0.3% 32 69 15 54 (3)Iowa 0.4% 29 111 21 15 75 (3)Kansas 0.3% 31 75 26 49 (4)Missouri 3.0% 14 801 83 235 483 (3)Montana 0.0% 44 13 13 (4)Nebraska 0.4% 30 96 12 24 60 (3)North Dakota 48 South Dakota 0.1% 42 17 17 Wyoming 48
South Central 5.3% 5 1,400 308 576 516 Arkansas 0.3% 33 67 17 50 (3)Louisiana 0.2% 34 61 31 30 (3)Oklahoma 0.2% 36 51 38 13 (4)Texas 4.6% 9 1,221 222 483 516 (4)
South Western 4.2% 8 1,097 177 454 466 Arizona 2.5% 16 672 40 166 466 (3)Colorado 0.5% 28 145 56 89 (4)Nevada 0.1% 41 37 22 15 (3)New Mexico 0.1% 42 17 17 (4)Utah 0.9% 24 226 42 184
Western 9.9% 4 2,620 610 960 1,050 Alaska 0.0% 45 4 4 (3)California 8.3% 3 2,180 514 686 980 Hawaii 48 Oregon 0.7% 26 181 40 141 (4)Washington 1.0% 22 255 52 133 70 (4)
US States + District of Columbia Ranked by Number of Employees
Support Activities For Printing (prepress, Postpress, Other Finishing Services) (NAICS 32312), 2015
Number of Employees
3: One or more entries were estimated using national averages. Stated US totals may not match exactly. ESTIMATED entries shown in italics and underlined.
4: One datum was not provided by Census Dept. but was inferred from other data
16

% of TotalRegion Rank
and State Rank
All Sizes 1-4Empls.
5-9 Empls.
10-19Empls.
20-49Empls.
50-99Empls.
100-249Empls.
250-499Empls.
500+Empls.
U.S. states + DC 100.0% - 26,378 1,463 1,735 2,799 6,325 4,696 6,306 1,985 1,069
New England 5.0% 6 1,319 59 93 168 307 297 396 Connecticut 0.9% 23 246 9 21 25 129 62 (3)Maine 0.2% 38 47 4 12 31 (3)Massachusetts 2.9% 15 769 35 47 109 101 235 242 (4)New Hampshire 0.2% 39 46 5 8 34 (3)Rhode Island 0.2% 35 54 3 5 47 (3)Vermont 0.6% 27 157 4 154 (3)
Mid-Eastern 21.3% 2 5,622 253 303 556 1,535 737 1,169 1,069 Delaware 48 Washington DC 0.0% 46 2 2 (3)Maryland 1.7% 20 442 33 47 43 154 50 115 (3)New Jersey 4.8% 8 1,264 60 109 153 405 241 296 (4)New York 5.4% 7 1,425 108 126 249 618 224 100 (4)Pennsylvania 9.4% 2 2,487 48 21 111 358 222 658 1,069 (4)West Virginia 0.0% 46 2 2 (3)
South Eastern 17.2% 3 4,547 275 304 495 1,174 887 1,411 Alabama 0.2% 37 50 16 6 28 (3)Florida 1.8% 19 464 118 69 61 166 50 (4)Georgia 5.8% 4 1,543 20 34 92 417 154 826 (4)Kentucky 1.3% 21 348 14 14 31 115 174 (3)Mississippi 0.2% 40 44 2 13 29 (3)North Carolina 3.1% 13 814 38 67 99 226 384 South Carolina 0.7% 25 186 8 13 27 70 68 (3)Tennessee 2.3% 17 607 22 40 67 122 231 125 (4)Virginia 1.9% 18 491 37 47 62 58 287 (3)
Great Lakes 32.6% 1 8,612 327 309 857 1,730 1,149 2,242 1,998 Illinois 11.0% 1 2,911 91 88 167 355 534 264 1,412 (4)Indiana 3.1% 12 829 35 29 96 129 72 468 (4)Michigan 3.3% 11 874 66 50 107 322 100 229 (3)Minnesota 5.4% 6 1,435 27 34 192 518 664 Ohio 5.7% 5 1,514 77 88 139 179 173 272 586 (3)Wisconsin 4.0% 10 1,049 31 20 156 227 270 345 (4)
North Central 4.5% 7 1,182 84 103 83 241 555 116 Idaho 0.3% 32 69 10 5 54 (3)Iowa 0.4% 29 111 14 7 15 75 (3)Kansas 0.3% 31 75 7 19 23 26 (3)Missouri 3.0% 14 801 34 49 20 215 367 116 (3)Montana 0.0% 44 13 7 6 (4)Nebraska 0.4% 30 96 12 24 60 (3)North Dakota 48 South Dakota 0.1% 42 17 17 Wyoming 48
South Central 5.3% 5 1,400 125 183 127 449 353 163 Arkansas 0.3% 33 67 3 14 15 35 (3)Louisiana 0.2% 34 61 17 14 30 (3)Oklahoma 0.2% 36 51 20 18 13 (4)Texas 4.6% 9 1,221 85 137 69 414 353 163 (4)
South Western 4.2% 8 1,097 69 108 151 303 231 235 Arizona 2.5% 16 672 20 20 41 125 231 235 (3)Colorado 0.5% 28 145 21 35 53 36 (4)Nevada 0.1% 41 37 8 14 15 (3)New Mexico 0.1% 42 17 10 7 (4)Utah 0.9% 24 226 10 32 42 142
Western 9.9% 4 2,620 271 339 375 585 514 536 Alaska 0.0% 45 4 4 (3)California 8.3% 3 2,180 220 294 312 374 444 536 Hawaii 48 Oregon 0.7% 26 181 25 15 24 117 (4)Washington 1.0% 22 255 22 30 39 94 70 (4)
US States + District of Columbia Ranked by Number of Employees
Support Activities For Printing (prepress, Postpress, Other Finishing Services) (NAICS 32312), 2015Number of Employees
3: One or more entries were estimated using national averages. Stated US totals may not match exactly. ESTIMATED entries shown in italics and underlined.
4: One datum was not provided by Census Dept. but was inferred from other data
17

% of TotalRegion Rank
and State Rank
All Sizes Small: 1-9 Empls.
Medium: 10-49 Empls.
Large: >50+ Empls.
U.S. states + DC 100.0% - $1,231 $125 $409 $697
New England 4.9% 5 $60 $7 $25 $28Connecticut 1.1% 23 $14 $2 $9 $3 (3)Maine 0.2% 36 $2 $1 $1 (3)Massachusetts 2.5% 15 $31 $3 $10 $18 (4)New Hampshire 0.1% 37 $2 $0 $1 (3)Rhode Island 0.4% 29 $4 $1 $4 (3)Vermont 0.6% 27 $8 $0 $8 (3)
Mid-Eastern 21.2% 2 $261 $22 $95 $143Delaware 48 Washington DC 0.0% 46 $0 $0 (3)Maryland 1.4% 20 $17 $3 $7 $7 (4)New Jersey 4.7% 7 $58 $7 $27 $24 (4)New York 5.3% 6 $65 $10 $41 $15 (4)Pennsylvania 9.8% 2 $120 $2 $20 $97 (4)West Virginia 0.0% 46 $0 $0 (3)
South Eastern 15.3% 3 $189 $20 $64 $104Alabama 0.2% 34 $2 $1 $1 (3)Florida 1.3% 21 $16 $6 $8 $1 (4)Georgia 4.4% 9 $54 $1 $16 $36 (4)Kentucky 1.5% 19 $19 $1 $7 $11 (3)Mississippi 0.1% 41 $1 $0 $1 (3)North Carolina 2.8% 13 $34 $3 $12 $19South Carolina 0.7% 26 $8 $1 $5 $3 (3)Tennessee 2.2% 17 $27 $3 $8 $17 (4)Virginia 2.2% 18 $27 $3 $7 $16 (3)
Great Lakes 35.8% 1 $440 $24 $120 $296Illinois 12.0% 1 $148 $8 $29 $112 (4)Indiana 2.3% 16 $28 $2 $9 $17 (4)Michigan 3.8% 10 $47 $4 $18 $25 (4)Minnesota 6.7% 4 $83 $2 $33 $47Ohio 6.4% 5 $79 $7 $13 $59 (4)Wisconsin 4.5% 8 $55 $2 $18 $35 (4)
North Central 4.1% 7 $51 $6 $14 $31Idaho 0.2% 32 $3 $1 $2 (3)Iowa 0.2% 31 $3 $0 $0 $2 (3)Kansas 0.3% 30 $4 $1 $3 (4)Missouri 3.1% 12 $38 $3 $11 $25 (3)Montana 0.0% 44 $0 $0 (4)Nebraska 0.2% 33 $3 $0 $1 $2 (3)North Dakota 48 South Dakota 0.0% 42 $1 $1Wyoming 48
South Central 4.3% 6 $52 $10 $26 $16Arkansas 0.1% 38 $2 $0 $1 (3)Louisiana 0.2% 35 $2 $1 $1 (3)Oklahoma 0.1% 40 $1 $1 $0 (4)Texas 3.8% 11 $47 $7 $24 $16 (4)
South Western 4.0% 8 $50 $6 $19 $25Arizona 2.7% 14 $33 $1 $7 $25 (3)Colorado 0.4% 28 $5 $2 $4 (4)Nevada 0.1% 39 $1 $1 $1 (3)New Mexico 0.0% 43 $0 $0 (4)Utah 0.7% 24 $9 $2 $7
Western 10.6% 4 $130 $31 $45 $53Alaska 0.0% 45 $0 $0 (3)California 8.7% 3 $107 $26 $31 $50Hawaii 48 Oregon 0.7% 25 $9 $2 $7 (4)Washington 1.1% 22 $14 $3 $7 $3 (4)
US States + District of Columbia Ranked by Payrolls
Support Activities For Printing (prepress, Postpress, Other Finishing Services) (NAICS 32312), 2015
Total Payrolls ($Millions)
3: One or more entries were estimated using national averages. Stated US totals may not match exactly. ESTIMATED entries shown in italics and underlined.
4: One datum was not provided by Census Dept. but was inferred from other data
18

% of TotalRegion Rank
and State Rank
All Sizes 1-4Empls.
5-9 Empls.
10-19Empls.
20-49Empls.
50-99Empls.
100-249Empls.
250-499Empls.
500+Empls.
U.S. states + DC 100.0% - $1,231 $58 $67 $119 $289 $223 $311 $112 $52
New England 4.9% 5 $60 $3 $4 $8 $17 $13 $16Connecticut 1.1% 23 $14 $0 $1 $1 $8 $3 (3)Maine 0.2% 36 $2 $0 $0 $1 (3)Massachusetts 2.5% 15 $31 $1 $2 $5 $4 $10 $8 (4)New Hampshire 0.1% 37 $2 $0 $0 $1 (3)Rhode Island 0.4% 29 $4 $0 $0 $4 (3)Vermont 0.6% 27 $8 $0 $8 (3)
Mid-Eastern 21.2% 2 $261 $11 $12 $25 $71 $37 $54 $52Delaware 48 Washington DC 0.0% 46 $0 $0 (3)Maryland 1.4% 20 $17 $1 $2 $1 $6 $2 $5 (3)New Jersey 4.7% 7 $58 $3 $4 $9 $18 $9 $15 (4)New York 5.3% 6 $65 $4 $5 $10 $31 $12 $3 (4)Pennsylvania 9.8% 2 $120 $2 $1 $5 $16 $14 $31 $52 (4)West Virginia 0.0% 46 $0 $0 (3)
South Eastern 15.3% 3 $189 $9 $11 $21 $43 $42 $62Alabama 0.2% 34 $2 $1 $0 $1 (3)Florida 1.3% 21 $16 $4 $2 $2 $6 $1 (4)Georgia 4.4% 9 $54 $1 $1 $4 $12 $5 $31 (4)Kentucky 1.5% 19 $19 $0 $1 $2 $5 $11 (3)Mississippi 0.1% 41 $1 $0 $0 $1 (3)North Carolina 2.8% 13 $34 $1 $2 $3 $9 $19South Carolina 0.7% 26 $8 $0 $0 $1 $4 $3 (3)Tennessee 2.2% 17 $27 $1 $2 $3 $4 $13 $4 (4)Virginia 2.2% 18 $27 $1 $2 $4 $3 $16 (3)
Great Lakes 35.8% 1 $440 $13 $12 $34 $86 $52 $132 $113Illinois 12.0% 1 $148 $4 $4 $8 $21 $21 $15 $76 (4)Indiana 2.3% 16 $28 $1 $1 $4 $6 $1 $16 (4)Michigan 3.8% 10 $47 $2 $2 $4 $14 $7 $17 (3)Minnesota 6.7% 4 $83 $1 $1 $8 $25 $47Ohio 6.4% 5 $79 $3 $3 $5 $8 $7 $15 $37 (3)Wisconsin 4.5% 8 $55 $1 $1 $6 $12 $15 $21 (4)
North Central 4.1% 7 $51 $3 $3 $3 $11 $26 $4Idaho 0.2% 32 $3 $0 $0 $2 (3)Iowa 0.2% 31 $3 $0 $0 $0 $2 (3)Kansas 0.3% 30 $4 $0 $1 $1 $1 (3)Missouri 3.1% 12 $38 $1 $1 $1 $10 $21 $4 (3)Montana 0.0% 44 $0 $0 $0 (4)Nebraska 0.2% 33 $3 $0 $1 $2 (3)North Dakota 48 South Dakota 0.0% 42 $1 $1Wyoming 48
South Central 4.3% 6 $52 $4 $6 $4 $22 $12 $4Arkansas 0.1% 38 $2 $0 $0 $0 $1 (3)Louisiana 0.2% 35 $2 $0 $1 $1 (3)Oklahoma 0.1% 40 $1 $0 $1 $0 (4)Texas 3.8% 11 $47 $3 $5 $3 $21 $12 $4 (4)
South Western 4.0% 8 $50 $3 $4 $6 $13 $9 $15Arizona 2.7% 14 $33 $1 $1 $2 $5 $9 $15 (3)Colorado 0.4% 28 $5 $1 $1 $2 $2 (4)Nevada 0.1% 39 $1 $0 $0 $1 (3)New Mexico 0.0% 43 $0 $0 $0 (4)Utah 0.7% 24 $9 $1 $1 $1 $6
Western 10.6% 4 $130 $15 $16 $19 $26 $36 $18Alaska 0.0% 45 $0 $0 (3)California 8.7% 3 $107 $12 $14 $16 $15 $32 $18Hawaii 48 Oregon 0.7% 25 $9 $1 $1 $1 $6 (4)Washington 1.1% 22 $14 $2 $1 $2 $5 $3 (4)
US States + District of Columbia Ranked by Payrolls
Support Activities For Printing (prepress, Postpress, Other Finishing Services) (NAICS 32312), 2015Total Payrolls ($Millions)
3: One or more entries were estimated using national averages. Stated US totals may not match exactly. ESTIMATED entries shown in italics and underlined.
4: One datum was not provided by Census Dept. but was inferred from other data
19

% of Total Region Rank and State Rank All Sizes Small: 1-9
Empls.Medium: 10-49
Empls.Large: >50+
Empls.
U.S. states + DC 100.0% - $3,444 $316 $1,108 $2,020
New England 4.9% 6 $170 $15 $57 $97Connecticut 0.9% 23 $30 $3 $19 $8Maine 0.2% 36 $5 $2 $4Massachusetts 2.9% 15 $99 $8 $25 $66New Hampshire 0.1% 39 $5 $1 $4Rhode Island 0.2% 34 $7 $1 $6Vermont 0.7% 25 $23 $0 $23
Mid-Eastern 22.0% 2 $758 $55 $255 $448Delaware 48 Washington DC 0.0% 46 $0 $0Maryland 1.6% 19 $56 $8 $24 $24New Jersey 4.6% 8 $160 $17 $68 $75New York 5.0% 7 $173 $23 $106 $44Pennsylvania 10.7% 2 $369 $7 $57 $305West Virginia 0.0% 46 $0 $0
South Eastern 17.0% 3 $585 $57 $203 $324Alabama 0.2% 37 $5 $2 $3Florida 1.5% 20 $52 $18 $28 $7Georgia 6.1% 4 $210 $5 $63 $142Kentucky 1.3% 21 $46 $3 $18 $26Mississippi 0.1% 40 $5 $2 $3North Carolina 2.9% 14 $100 $10 $39 $50South Carolina 0.7% 26 $23 $2 $12 $9Tennessee 2.3% 17 $78 $6 $23 $49Virginia 1.9% 18 $65 $8 $14 $42
Great Lakes 33.5% 1 $1,154 $63 $313 $778Illinois 11.6% 1 $400 $18 $63 $319Indiana 3.2% 11 $112 $6 $27 $79Michigan 3.2% 12 $111 $11 $52 $47Minnesota 5.5% 6 $191 $6 $87 $98Ohio 5.9% 5 $204 $16 $38 $150Wisconsin 4.0% 10 $137 $5 $46 $86
North Central 4.3% 7 $148 $18 $40 $90Idaho 0.2% 31 $9 $1 $7Iowa 0.4% 29 $14 $2 $2 $10Kansas 0.2% 32 $8 $3 $6Missouri 3.0% 13 $103 $8 $29 $65Montana 0.0% 44 $1 $1Nebraska 0.3% 30 $12 $1 $3 $8North Dakota 48 South Dakota 0.1% 42 $2 $2Wyoming 48
South Central 5.0% 5 $171 $31 $71 $70Arkansas 0.2% 33 $8 $2 $6Louisiana 0.2% 35 $6 $3 $3Oklahoma 0.2% 38 $5 $4 $1Texas 4.4% 9 $152 $22 $60 $70
South Western 4.0% 8 $137 $18 $55 $65Arizona 2.6% 16 $89 $4 $20 $65Colorado 0.5% 28 $16 $6 $10Nevada 0.1% 41 $4 $2 $2New Mexico 0.0% 43 $2 $2Utah 0.8% 24 $27 $4 $23
Western 9.4% 4 $322 $60 $116 $146Alaska 0.0% 45 $0 $0California 7.8% 3 $270 $51 $82 $137Hawaii 48 Oregon 0.6% 27 $21 $4 $17Washington 0.9% 22 $30 $5 $16 $9
US States + District of Columbia Ranked by Sales
Support Activities For Printing (prepress, Postpress, Other Finishing Services) (NAICS 32312), 2015
Value of Sales/Shipments ($Millions)
20

% of Total Region Rank and State Rank All Sizes 1-4
Empls.5-9
Empls.10-19
Empls.20-49
Empls.50-99
Empls.100-249Empls.
250-499Empls.
500+Empls.
U.S. states + DC 100.0% - $3,444 $139 $176 $314 $795 $615 $931 $295 $179
New England 4.9% 6 $170 $6 $9 $19 $39 $39 $58Connecticut 0.9% 23 $30 $1 $2 $3 $16 $8Maine 0.2% 36 $5 $0 $1 $4Massachusetts 2.9% 15 $99 $3 $5 $12 $13 $31 $36New Hampshire 0.1% 39 $5 $0 $1 $4Rhode Island 0.2% 34 $7 $0 $0 $6Vermont 0.7% 25 $23 $0 $23
Mid-Eastern 22.0% 2 $758 $24 $31 $62 $193 $96 $173 $179Delaware 48 Washington DC 0.0% 46 $0 $0Maryland 1.6% 19 $56 $3 $5 $5 $19 $7 $17New Jersey 4.6% 8 $160 $6 $11 $17 $51 $32 $44New York 5.0% 7 $173 $10 $13 $28 $78 $29 $15Pennsylvania 10.7% 2 $369 $5 $2 $12 $45 $29 $97 $179West Virginia 0.0% 46 $0 $0
South Eastern 17.0% 3 $585 $26 $31 $55 $148 $116 $208Alabama 0.2% 37 $5 $2 $1 $3Florida 1.5% 20 $52 $11 $7 $7 $21 $7Georgia 6.1% 4 $210 $2 $3 $10 $52 $20 $122Kentucky 1.3% 21 $46 $1 $1 $3 $14 $26Mississippi 0.1% 40 $5 $0 $1 $3North Carolina 2.9% 14 $100 $4 $7 $11 $28 $50South Carolina 0.7% 26 $23 $1 $1 $3 $9 $9Tennessee 2.3% 17 $78 $2 $4 $8 $15 $30 $18Virginia 1.9% 18 $65 $4 $5 $7 $7 $42
Great Lakes 33.5% 1 $1,154 $31 $31 $96 $217 $150 $331 $297Illinois 11.6% 1 $400 $9 $9 $19 $45 $70 $39 $210Indiana 3.2% 11 $112 $3 $3 $11 $16 $9 $69Michigan 3.2% 12 $111 $6 $5 $12 $40 $13 $34Minnesota 5.5% 6 $191 $3 $3 $22 $65 $98Ohio 5.9% 5 $204 $7 $9 $16 $22 $23 $40 $87Wisconsin 4.0% 10 $137 $3 $2 $17 $29 $35 $51
North Central 4.3% 7 $148 $8 $10 $9 $30 $73 $17Idaho 0.2% 31 $9 $1 $1 $7Iowa 0.4% 29 $14 $1 $1 $2 $10Kansas 0.2% 32 $8 $1 $2 $3 $3Missouri 3.0% 13 $103 $3 $5 $2 $27 $48 $17Montana 0.0% 44 $1 $1 $1Nebraska 0.3% 30 $12 $1 $3 $8North Dakota 48 South Dakota 0.1% 42 $2 $2Wyoming 48
South Central 5.0% 5 $171 $12 $19 $14 $56 $46 $24Arkansas 0.2% 33 $8 $0 $1 $2 $4Louisiana 0.2% 35 $6 $2 $1 $3Oklahoma 0.2% 38 $5 $2 $2 $1Texas 4.4% 9 $152 $8 $14 $8 $52 $46 $24
South Western 4.0% 8 $137 $7 $11 $17 $38 $30 $35Arizona 2.6% 16 $89 $2 $2 $5 $16 $30 $35Colorado 0.5% 28 $16 $2 $4 $6 $5Nevada 0.1% 41 $4 $1 $1 $2New Mexico 0.0% 43 $2 $1 $1Utah 0.8% 24 $27 $1 $3 $5 $18
Western 9.4% 4 $322 $26 $34 $42 $73 $67 $79Alaska 0.0% 45 $0 $0California 7.8% 3 $270 $21 $30 $35 $47 $58 $79Hawaii 48 Oregon 0.6% 27 $21 $2 $2 $3 $15Washington 0.9% 22 $30 $2 $3 $4 $12 $9
US States + District of Columbia Ranked by Sales
Support Activities For Printing (prepress, Postpress, Other Finishing Services) (NAICS 32312), 2015Value of Sales/Shipments ($Millions)
21

% of Total Region Rank and State Rank All Sizes Small: 1-9
Empls.Medium: 10-49
Empls.Large: >50+
Empls.
U.S. states + DC 100.0% - $103.3 $9.5 $33.2 $60.6
New England 4.9% 6 $5.1 $0.5 $1.7 $2.9Connecticut 0.9% 23 $0.9 $0.1 $0.6 $0.2Maine 0.2% 36 $0.2 $0.0 $0.1Massachusetts 2.9% 15 $3.0 $0.2 $0.7 $2.0New Hampshire 0.1% 39 $0.1 $0.0 $0.1Rhode Island 0.2% 34 $0.2 $0.0 $0.2Vermont 0.7% 25 $0.7 $0.0 $0.7
Mid-Eastern 22.0% 2 $22.7 $1.6 $7.7 $13.4Delaware 48 Washington DC 0.0% 46 $0.0 $0.0Maryland 1.6% 19 $1.7 $0.2 $0.7 $0.7New Jersey 4.6% 8 $4.8 $0.5 $2.0 $2.3New York 5.0% 7 $5.2 $0.7 $3.2 $1.3Pennsylvania 10.7% 2 $11.1 $0.2 $1.7 $9.2West Virginia 0.0% 46 $0.0 $0.0
South Eastern 17.0% 3 $17.5 $1.7 $6.1 $9.7Alabama 0.2% 37 $0.2 $0.1 $0.1Florida 1.5% 20 $1.6 $0.5 $0.8 $0.2Georgia 6.1% 4 $6.3 $0.2 $1.9 $4.3Kentucky 1.3% 21 $1.4 $0.1 $0.5 $0.8Mississippi 0.1% 40 $0.1 $0.0 $0.1North Carolina 2.9% 14 $3.0 $0.3 $1.2 $1.5South Carolina 0.7% 26 $0.7 $0.1 $0.4 $0.3Tennessee 2.3% 17 $2.3 $0.2 $0.7 $1.5Virginia 1.9% 18 $1.9 $0.2 $0.4 $1.3
Great Lakes 33.5% 1 $34.6 $1.9 $9.4 $23.4Illinois 11.6% 1 $12.0 $0.5 $1.9 $9.6Indiana 3.2% 11 $3.4 $0.2 $0.8 $2.4Michigan 3.2% 12 $3.3 $0.3 $1.6 $1.4Minnesota 5.5% 6 $5.7 $0.2 $2.6 $2.9Ohio 5.9% 5 $6.1 $0.5 $1.1 $4.5Wisconsin 4.0% 10 $4.1 $0.1 $1.4 $2.6
North Central 4.3% 7 $4.4 $0.6 $1.2 $2.7Idaho 0.2% 31 $0.3 $0.0 $0.2Iowa 0.4% 29 $0.4 $0.1 $0.1 $0.3Kansas 0.2% 32 $0.3 $0.1 $0.2Missouri 3.0% 13 $3.1 $0.2 $0.9 $2.0Montana 0.0% 44 $0.0 $0.0Nebraska 0.3% 30 $0.4 $0.0 $0.1 $0.2North Dakota 48 South Dakota 0.1% 42 $0.1 $0.1Wyoming 48
South Central 5.0% 5 $5.1 $0.9 $2.1 $2.1Arkansas 0.2% 33 $0.2 $0.1 $0.2Louisiana 0.2% 35 $0.2 $0.1 $0.1Oklahoma 0.2% 38 $0.2 $0.1 $0.0Texas 4.4% 9 $4.6 $0.7 $1.8 $2.1
South Western 4.0% 8 $4.1 $0.5 $1.7 $1.9Arizona 2.6% 16 $2.7 $0.1 $0.6 $1.9Colorado 0.5% 28 $0.5 $0.2 $0.3Nevada 0.1% 41 $0.1 $0.1 $0.1New Mexico 0.0% 43 $0.0 $0.0Utah 0.8% 24 $0.8 $0.1 $0.7
Western 9.4% 4 $9.7 $1.8 $3.5 $4.4Alaska 0.0% 45 $0.0 $0.0California 7.8% 3 $8.1 $1.5 $2.5 $4.1Hawaii 48 Oregon 0.6% 27 $0.6 $0.1 $0.5Washington 0.9% 22 $0.9 $0.2 $0.5 $0.3
US States + District of Columbia Ranked by CapEx
Support Activities For Printing (prepress, Postpress, Other Finishing Services) (NAICS 32312), 2015
Value of Capital Expenditure ($M)
22

% of Total Region Rank and State Rank All Sizes 1-4
Empls.5-9
Empls.10-19
Empls.20-49
Empls.50-99
Empls.100-249Empls.
250-499Empls.
500+Empls.
U.S. states + DC 100.0% - $103.3 $4.2 $5.3 $9.4 $23.8 $18.4 $27.9 $8.9 $5.4
New England 4.9% 6 $5.1 $0.2 $0.3 $0.6 $1.2 $1.2 $1.8Connecticut 0.9% 23 $0.9 $0.0 $0.1 $0.1 $0.5 $0.2Maine 0.2% 36 $0.2 $0.0 $0.0 $0.1Massachusetts 2.9% 15 $3.0 $0.1 $0.1 $0.4 $0.4 $0.9 $1.1New Hampshire 0.1% 39 $0.1 $0.0 $0.0 $0.1Rhode Island 0.2% 34 $0.2 $0.0 $0.0 $0.2Vermont 0.7% 25 $0.7 $0.0 $0.7
Mid-Eastern 22.0% 2 $22.7 $0.7 $0.9 $1.9 $5.8 $2.9 $5.2 $5.4Delaware 48 Washington DC 0.0% 46 $0.0 $0.0Maryland 1.6% 19 $1.7 $0.1 $0.1 $0.1 $0.6 $0.2 $0.5New Jersey 4.6% 8 $4.8 $0.2 $0.3 $0.5 $1.5 $0.9 $1.3New York 5.0% 7 $5.2 $0.3 $0.4 $0.8 $2.3 $0.9 $0.4Pennsylvania 10.7% 2 $11.1 $0.1 $0.1 $0.4 $1.3 $0.9 $2.9 $5.4West Virginia 0.0% 46 $0.0 $0.0
South Eastern 17.0% 3 $17.5 $0.8 $0.9 $1.7 $4.4 $3.5 $6.3Alabama 0.2% 37 $0.2 $0.0 $0.0 $0.1Florida 1.5% 20 $1.6 $0.3 $0.2 $0.2 $0.6 $0.2Georgia 6.1% 4 $6.3 $0.1 $0.1 $0.3 $1.6 $0.6 $3.7Kentucky 1.3% 21 $1.4 $0.0 $0.0 $0.1 $0.4 $0.8Mississippi 0.1% 40 $0.1 $0.0 $0.0 $0.1North Carolina 2.9% 14 $3.0 $0.1 $0.2 $0.3 $0.9 $1.5South Carolina 0.7% 26 $0.7 $0.0 $0.0 $0.1 $0.3 $0.3Tennessee 2.3% 17 $2.3 $0.1 $0.1 $0.2 $0.5 $0.9 $0.6Virginia 1.9% 18 $1.9 $0.1 $0.1 $0.2 $0.2 $1.3
Great Lakes 33.5% 1 $34.6 $0.9 $0.9 $2.9 $6.5 $4.5 $9.9 $8.9Illinois 11.6% 1 $12.0 $0.3 $0.3 $0.6 $1.3 $2.1 $1.2 $6.3Indiana 3.2% 11 $3.4 $0.1 $0.1 $0.3 $0.5 $0.3 $2.1Michigan 3.2% 12 $3.3 $0.2 $0.2 $0.4 $1.2 $0.4 $1.0Minnesota 5.5% 6 $5.7 $0.1 $0.1 $0.6 $2.0 $2.9Ohio 5.9% 5 $6.1 $0.2 $0.3 $0.5 $0.7 $0.7 $1.2 $2.6Wisconsin 4.0% 10 $4.1 $0.1 $0.1 $0.5 $0.9 $1.1 $1.5
North Central 4.3% 7 $4.4 $0.2 $0.3 $0.3 $0.9 $2.2 $0.5Idaho 0.2% 31 $0.3 $0.0 $0.0 $0.2Iowa 0.4% 29 $0.4 $0.0 $0.0 $0.1 $0.3Kansas 0.2% 32 $0.3 $0.0 $0.1 $0.1 $0.1Missouri 3.0% 13 $3.1 $0.1 $0.1 $0.1 $0.8 $1.4 $0.5Montana 0.0% 44 $0.0 $0.0 $0.0Nebraska 0.3% 30 $0.4 $0.0 $0.1 $0.2North Dakota 48 South Dakota 0.1% 42 $0.1 $0.1Wyoming 48
South Central 5.0% 5 $5.1 $0.4 $0.6 $0.4 $1.7 $1.4 $0.7Arkansas 0.2% 33 $0.2 $0.0 $0.0 $0.1 $0.1Louisiana 0.2% 35 $0.2 $0.0 $0.0 $0.1Oklahoma 0.2% 38 $0.2 $0.1 $0.1 $0.0Texas 4.4% 9 $4.6 $0.2 $0.4 $0.2 $1.6 $1.4 $0.7
South Western 4.0% 8 $4.1 $0.2 $0.3 $0.5 $1.1 $0.9 $1.0Arizona 2.6% 16 $2.7 $0.1 $0.1 $0.1 $0.5 $0.9 $1.0Colorado 0.5% 28 $0.5 $0.1 $0.1 $0.2 $0.1Nevada 0.1% 41 $0.1 $0.0 $0.0 $0.1New Mexico 0.0% 43 $0.0 $0.0 $0.0Utah 0.8% 24 $0.8 $0.0 $0.1 $0.1 $0.5
Western 9.4% 4 $9.7 $0.8 $1.0 $1.3 $2.2 $2.0 $2.4Alaska 0.0% 45 $0.0 $0.0California 7.8% 3 $8.1 $0.6 $0.9 $1.0 $1.4 $1.7 $2.4Hawaii 48 Oregon 0.6% 27 $0.6 $0.1 $0.0 $0.1 $0.4Washington 0.9% 22 $0.9 $0.1 $0.1 $0.1 $0.4 $0.3
US States + District of Columbia Ranked by CapEx
Support Activities For Printing (prepress, Postpress, Other Finishing Services) (NAICS 32312), 2015Value of Capital Expenditure ($M)
23

% of Total Rank All Sizes Small: 1-9 Empls.
Medium: 10-49 Empls.
Large: >50+ Empls.
Employees/Estab. Employees Payrolls ($MM) Sales ($MM) CapEx ($MM)
U.S. states + DC 100.0% - 1,598 1,072 408 118 16.5 26,378 $1,231 $3,444 $103California 13.4% 1 214 168 35 11 10.2 2,180 $107 $270 $8New York 7.8% 2 124 84 36 4 11.5 1,425 $65 $173 $5Illinois 6.7% 3 107 68 25 14 27.2 2,911 $148 $400 $12Texas 5.6% 4 89 64 19 6 13.7 1,221 $47 $152 $5Florida 5.4% 5 87 78 8 1 5.3 464 $16 $52 $2New Jersey 5.0% 6 80 48 26 6 15.8 1,264 $58 $160 $5Ohio 4.9% 7 78 54 17 7 19.4 1,514 $79 $204 $6Michigan 4.4% 8 70 49 19 2 12.5 874 $47 $111 $3Minnesota 3.6% 9 58 25 29 4 24.7 1,435 $83 $191 $6Pennsylvania 3.1% 10 49 22 19 8 50.8 2,487 $120 $369 $11North Carolina 3.1% 10 49 29 14 6 16.6 814 $34 $100 $3Georgia 2.9% 12 46 19 20 7 33.5 1,543 $54 $210 $6Wisconsin 2.6% 13 41 15 20 6 25.6 1,049 $55 $137 $4Missouri 2.6% 13 41 27 8 6 19.5 801 $38 $103 $3Massachusetts 2.4% 15 39 24 10 5 19.7 769 $31 $99 $3
Top 15 US States Ranked by Number of Establishments
Support Activities For Printing (prepress, Postpress, Other Finishing Services) (NAICS 32312), 2015Employees, Payrolls ($MM), Sales ($MM), CapEx ($MM)
24

% of Total Rank All Sizes Small: 1-9 Empls.
Medium: 10-49 Empls.
Large: >50+ Empls.
Employees/Estab. Employees Payrolls ($MM) Sales ($MM) CapEx ($MM)
US Total 100.0% - 1,598 1,072 408 118 16.5 26,378 $1,231 $3,444 $103New York-Newark-Jersey City 9.5% 1 152 98 45 9 13.6 2,074 $98 $261 $8Los Angeles-Long Beach-Anaheim 7.2% 2 115 90 20 5 10.0 1,146 $55 $142 $4Chicago-Naperville-Elgin 5.9% 3 95 59 24 12 26.0 2,472 $130 $334 $10Minneapolis-St. Paul-Bloomington 3.2% 4 51 21 27 3 25.1 1,278 $77 $168 $5
Miami-Fort Lauderdale-West Palm Beach 2.6% 5 41 39 1 1 4.1 168 $5 $19 $1
San Francisco-Oakland-Hayward 2.4% 6 38 31 4 3 9.9 376 $28 $46 $1Dallas-Fort Worth-Arlington 2.4% 7 38 23 10 5 21.8 829 $34 $107 $3Detroit-Warren-Dearborn 1.9% 8 31 23 8 7.2 222 $10 $26 $1Boston-Cambridge-Newton 1.8% 9 28 17 7 4 20.9 585 $22 $78 $2Philadelphia-Camden-Wilmington 1.7% 10 27 14 9 4 58.7 1,585 $83 $247 $7Cleveland-Elyria 1.6% 11 26 19 4 3 14.7 383 $17 $50 $2Atlanta-Sandy Springs-Roswell 1.6% 12 25 13 11 1 18.0 451 $19 $58 $2Washington-Arlington-Alexandria 1.4% 13 23 19 4 6.1 141 $6 $15 $0Cincinnati 1.4% 14 23 12 6 5 48.8 1,122 $68 $161 $5St. Louis 1.4% 15 22 13 5 4 21.9 482 $28 $61 $2Phoenix-Mesa-Scottsdale 1.3% 16 21 11 6 4 31.0 652 $33 $86 $3Houston-The Woodlands-Sugar Land 1.3% 17 21 16 5 10.0 209 $8 $24 $1Milwaukee-Waukesha-West Allis 1.3% 18 20 8 10 2 19.5 389 $20 $51 $2Baltimore-Columbia-Towson 1.3% 19 20 11 7 2 19.6 391 $15 $51 $2Portland-Vancouver-Hillsboro 1.2% 20 19 13 6 9.2 174 $9 $21 $1Seattle-Tacoma-Bellevue 1.1% 21 18 10 7 1 12.6 227 $13 $28 $1Kansas City 1.1% 22 18 14 3 1 11.2 201 $8 $27 $1Denver-Aurora-Lakewood 1.1% 23 17 13 4 5.6 96 $3 $10 $0
Nashville-Davidson--Murfreesboro--Franklin 1.0% 24 16 9 3 4 23.7 379 $17 $50 $2
Tampa-St. Petersburg-Clearwater 0.9% 25 15 13 2 5.2 78 $4 $9 $0
Top 25 US MSAs Ranked by Number of Establishments
Support Activities For Printing (prepress, Postpress, Other Finishing Services) (NAICS 32312), 2015Employees, Payrolls ($MM), Sales ($MM), CapEx ($MM)
A Metropolitan Statistical Area (MSA) is a geographic entity defined by the Office of Management and Budget for use by federal statistical agencies. An MSA consists of the county or counties (or equivalent entities) that are associated with at least one urbanized area of at least 50,000 population, plus adjacent counties that have a high degree of social and economic integration with the core as measured through studies of worker and other commuting in the area.
25

% of Total Estabs Rank (Popn.) All Sizes Small: 1-9
Empls.Medium: 10-49
Empls.Large: >50+
Empls.Employees/
Estab. Employees Payrolls ($MM) Sales ($MM) CapEx ($MM)
US Total 100.0% - 1,598 1,072 408 118 16.5 26,378 $1,231 $3,444 $103New York 10.8% 1 173 114 49 10 13.3 2,295 $111 $288 $9Los Angeles 8.0% 2 128 99 22 7 11.5 1,475 $65 $189 $6Chicago 6.0% 3 96 60 24 12 25.8 2,474 $130 $334 $10Washington D.C. 2.9% 4 47 34 11 2 11.3 548 $22 $68 $2San Francisco 3.2% 5 51 42 6 3 8.5 446 $31 $53 $2
Chicago CSA includes: Chicago-Naperville-Elgin, Ottawa-Peru, Kankakee, Michigan City-La PorteWashington D.C. CSA includes: Washington-Arlington-Alexandria, DC-VA-MD-WV, Baltimore-Columbia-Towson, Hagerstown-Martinsburg, Chambersburg-Waynesboro, Winchester, California-Lexington Park, Easton, CambridgeSan Francisco CSA includes: San Francisco-Oakland-Hayward, San Jose-Sunnyvale-Santa Clara, Stockton-Lodi, Santa Rosa, Vallejo-Fairfield, Santa Cruz-Watsonville, Napa
Top 5 Combined Statistical Areas (CSA) ranked by Population
Support Activities For Printing (prepress, Postpress, Other Finishing Services) (NAICS 32312), 2015Employees, Payrolls ($MM), Sales ($MM), CapEx ($MM)
New York CSA is the combination of these Metropolitan and Micropolitan Statistical Areas: New York-Newark-Jersey City, Bridgeport-Stamford-Norwalk, New Haven-Milford, Allentown-Bethlehem-Easton, Trenton, Torrington, Kingston, East StroudsburgLos Angeles CSA includes: Los Angeles-Long Beach-Anaheim, Riverside-San Bernardino-Ontario, Oxnard-Thousand Oaks-Ventura
26

Total Small Medium Large Total Small Medium Large Total Small Medium Large Total Small Medium LargeNew England 74 46 21 7 74 46 21 7 71 45 20 7 60 39 16 5Mid-Eastern 289 180 89 20 278 174 85 19 262 165 79 18 196 130 55 11South Eastern 290 196 71 23 289 196 70 23 288 197 69 23 282 201 62 19Great Lakes 389 231 121 37 365 217 112 35 365 219 110 35 339 217 96 26North Central 87 64 14 9 83 61 13 9 84 62 13 9 78 60 11 7South Central 121 91 24 6 116 87 23 6 116 88 22 6 116 90 21 5South Western 82 58 20 4 83 59 20 4 81 58 19 4 74 55 16 3Western 266 206 48 12 263 204 47 12 255 199 45 11 226 181 36 9
Total 1,598 1,072 408 118 1,550 1,044 391 115 1,523 1,034 377 112 1,372 973 313 85
Total Small Medium Large Total Small Medium Large Total Small Medium Large Total Small Medium LargeNew England 1,319 152 475 693 1,283 147 459 677 1,269 146 453 669 1,154 140 416 598Mid-Eastern 5,622 556 2,091 2,975 5,073 496 1,861 2,716 4,743 462 1,716 2,565 3,418 441 1,567 1,410South Eastern 4,547 579 1,670 2,298 4,341 552 1,585 2,204 4,472 573 1,629 2,269 4,472 606 1,636 2,230Great Lakes 8,612 636 2,587 5,389 7,840 572 2,317 4,950 7,416 539 2,152 4,725 5,090 456 1,713 2,921North Central 1,182 187 324 671 2,184 343 592 1,250 1,576 251 428 897 1,576 278 454 844South Central 1,400 308 576 516 1,338 293 547 498 1,184 261 484 438 567 133 238 197South Western 1,097 177 454 466 1,167 187 481 499 1,135 184 467 484 1,135 193 472 470Western 2,620 610 960 1,050 2,232 518 813 901 2,239 524 813 902 1,602 396 583 623
Total 26,399 3,205 9,136 14,057 25,458 3,108 8,655 13,695 24,033 2,940 8,143 12,950 19,014 2,642 7,079 9,293
Total Small Medium Large Total Small Medium Large Total Small Medium Large Total Small Medium LargeNew England $60.2 $6.8 $25.1 $28.4 $58.5 $6.6 $24.2 $27.7 $57.9 $6.5 $23.9 $27.4 $52.6 $6.2 $22.0 $24.4Mid-Eastern $260.8 $22.4 $95.5 $142.9 $235.5 $20.0 $85.0 $130.5 $220.3 $18.7 $78.4 $123.3 $156.7 $17.9 $71.6 $67.2South Eastern $188.5 $20.1 $64.4 $104.1 $180.1 $19.1 $61.1 $99.8 $185.4 $19.9 $62.8 $102.7 $184.5 $21.0 $62.9 $100.6Great Lakes $440.2 $24.3 $120.0 $295.9 $401.0 $21.8 $107.5 $271.7 $380.2 $20.6 $99.9 $259.7 $258.1 $17.4 $79.8 $160.9North Central $50.6 $5.7 $14.3 $30.7 $93.6 $10.4 $26.1 $57.2 $67.4 $7.6 $18.9 $41.0 $66.8 $8.4 $20.1 $38.3South Central $52.5 $9.7 $26.4 $16.4 $50.1 $9.2 $25.0 $15.9 $44.3 $8.2 $22.2 $13.9 $21.2 $4.1 $10.9 $6.1South Western $49.5 $6.2 $18.8 $24.6 $52.7 $6.5 $19.9 $26.3 $51.3 $6.4 $19.3 $25.6 $51.7 $6.8 $19.5 $25.4Western $129.9 $31.1 $45.3 $53.5 $110.9 $26.4 $38.4 $46.1 $111.1 $26.8 $38.4 $45.9 $78.4 $20.4 $27.5 $30.5
Total $1,232.2 $126.2 $409.7 $696.4 $1,182.4 $120.1 $387.2 $675.2 $1,117.9 $114.6 $363.8 $639.5 $870.0 $102.2 $314.3 $453.5
Total Small Medium Large Total Small Medium Large Total Small Medium Large Total Small Medium LargeNew England $169.7 $15.1 $57.4 $97.3 $169.5 $15.0 $56.9 $97.6 $162.2 $14.4 $54.4 $93.4 $128.7 $11.9 $43.6 $73.2Mid-Eastern $758.1 $54.8 $255.1 $448.1 $734.0 $52.3 $243.1 $438.5 $696.9 $49.3 $227.0 $420.6 $366.2 $36.5 $161.2 $168.5South Eastern $584.5 $57.1 $203.0 $324.4 $580.5 $56.5 $200.5 $323.4 $572.3 $56.2 $197.3 $318.8 $522.2 $54.0 $180.9 $287.3Great Lakes $1,154.3 $62.5 $313.4 $778.4 $1,091.2 $58.3 $291.1 $741.7 $1,098.0 $58.3 $287.3 $752.4 $820.8 $54.4 $253.4 $512.9North Central $147.8 $18.5 $39.6 $89.7 $140.6 $17.4 $37.2 $86.0 $139.8 $17.5 $37.1 $85.1 $116.2 $16.2 $32.9 $67.1South Central $171.4 $30.5 $70.6 $70.3 $164.2 $29.0 $67.2 $67.9 $162.0 $28.9 $66.4 $66.7 $148.6 $28.1 $62.7 $57.8South Western $137.4 $17.5 $55.0 $64.9 $138.6 $17.6 $55.2 $65.8 $133.9 $17.1 $53.3 $63.5 $112.9 $15.1 $45.5 $52.3Western $322.1 $60.2 $115.5 $146.4 $316.9 $59.0 $113.0 $144.9 $303.7 $57.0 $108.0 $138.7 $246.4 $48.7 $88.1 $109.5
Total $3,445.4 $316.3 $1,109.6 $2,019.5 $3,335.5 $305.2 $1,064.3 $1,966.0 $3,268.8 $298.8 $1,030.7 $1,939.3 $2,461.9 $264.9 $868.3 $1,328.6
Total Small Medium Large Total Small Medium Large Total Small Medium Large Total Small Medium LargeNew England $5.1 $0.5 $1.7 $2.9 $5.1 $0.4 $1.7 $2.9 $4.9 $0.4 $1.6 $2.8 $3.9 $0.4 $1.3 $2.2Mid-Eastern $22.7 $1.6 $7.7 $13.4 $22.0 $1.6 $7.3 $13.2 $20.9 $1.5 $6.8 $12.6 $11.0 $1.1 $4.8 $5.1South Eastern $17.5 $1.7 $6.1 $9.7 $17.4 $1.7 $6.0 $9.7 $17.2 $1.7 $5.9 $9.6 $15.7 $1.6 $5.4 $8.6Great Lakes $34.6 $1.9 $9.4 $23.4 $32.7 $1.7 $8.7 $22.3 $32.9 $1.7 $8.6 $22.6 $24.6 $1.6 $7.6 $15.4North Central $4.4 $0.6 $1.2 $2.7 $4.2 $0.5 $1.1 $2.6 $4.2 $0.5 $1.1 $2.6 $3.5 $0.5 $1.0 $2.0South Central $5.1 $0.9 $2.1 $2.1 $4.9 $0.9 $2.0 $2.0 $4.9 $0.9 $2.0 $2.0 $4.5 $0.8 $1.9 $1.7South Western $4.1 $0.5 $1.7 $1.9 $4.2 $0.5 $1.7 $2.0 $4.0 $0.5 $1.6 $1.9 $3.4 $0.5 $1.4 $1.6Western $9.7 $1.8 $3.5 $4.4 $9.5 $1.8 $3.4 $4.3 $9.1 $1.7 $3.2 $4.2 $7.4 $1.5 $2.6 $3.3
Total $103.4 $9.5 $33.3 $60.6 $100.1 $9.2 $31.9 $59.0 $98.1 $9.0 $30.9 $58.2 $73.9 $7.9 $26.1 $39.9
Shipments 2015 $MM Estimate 2016 $MM Estimate 2017 $MM Estimate 2022 $MM Forecast
Capex 2015 $MM Estimate 2016 $MM Estimate 2017 $MM Estimate 2022 $MM Forecast
Employment 2015 Actual 2016 Estimate 2017 Estimate 2022 Forecast
Payrolls 2015 $MM Actual 2016 $MM Estimate 2017 $MM Estimate 2022 $MM Forecast
Support Activities For Printing (prepress, Postpress, Other Finishing Services) (NAICS 32312), 20152015 Summary Data, 2016 and 2017 Estimated Data, 2022 Statistical Trend Forecast
Establishments 2015 Actual 2016 Estimate 2017 Estimate 2022 Forecast
27

Support Activities For Printing (Prepress, Postpress, Other Finishing Services) (NAICS 32312)Establishments by State: All
28

Support Activities For Printing (Prepress, Postpress, Other Finishing Services) (NAICS 32312)Establishments by MSA: All
29

Support Activities For Printing (Prepress, Postpress, Other Finishing Services) (NAICS 32312)Total Establishments by Region
30

6. Support Activities For Printing
(Prepress, Postpress, Other Finishing Services) (NAICS 32312)
Available Reports
31

Available Reports (continued)
32