Embed Size (px)
DESCRIPTION
Draft of Naga City's 10-year Comprehensive Development Plan covering the period 2011-20
Citation preview
CITY GOVERNMENT OF NAGA City Planning and Development Office
Comprehensive Development Plan, 2011-20

ii
RESOLUTION ADOPTING THE CDP
Resolution No. 2011-___
“ADOPTING THE 10-YEAR COMPREHENSIVE DEVELOPMENT PLAN OF THE CITY OF NAGA”
Whereas, the Comprehensive Development Plan (CDP) sets the city government’s strategic directions for the next 10 year action and details its priority sectoral and cross-sectoral programs and projects consistent with the vision for “Maogmang Naga”; Whereas, the formulation of the CDP involved the participation of various stakeholders in the community in its various stages, from visioning, situational analysis, and the development of policy responses and interventions to development challenges facing city; Whereas, the CDP represents the collective aspiration, needs and priorities of the local society and therefore enjoys broad-based support; Whereas, the CDP is the city government’s call to all its constituents, resource institutions and stakeholders, both in and out of Naga, to be its proactive partner in the city’s continuing progress and sustainable development; Now therefore, on motion duly seconded, be it Resolved, as it is hereby resolved, to adopt the Comprehensive Development Plan, 2011-20, of the City of Naga.

iii
FOREWORD Naga, the “Heart of Bicol” that aspires to become a happy place for its people, is at the crossroads. The fastest growing city in Bicolandia, it faces the internal challenge of maintaining high level of human development even as its population is projected to double within the next two decades. Externally, it must, as has been over the last 20 years, continue to outdo itself and rise above limitations and constraints to build a livable and competitive city which can stand alongside other urban centers in the Asia-Pacific region. In the face of these challenges, it can opt to take the path of least resistance and approach urban governance with a business-as-usual attitude. Or, it can be a little more ambitious, dream a little bigger and come up with a more audacious plan that will position Naga as the Philippines’ best little city that not only does things right, but also does them well. This Comprehensive Development Plan, 2011-20, has chosen the second option. Tapping its internationally-recognized participatory planning processes, which welcomed and debated both official and unofficial indicators of city development in a serious effort to define Naga’s sectoral and cross-sectoral development challenges more fully and accurately, and informed by available good urban development practices in the Philippines and abroad, it addresses four fundamental challenges: (1) reducing poverty incidence, (2) Improving access to basic services, (3) enhancing quality of life thru livable communities, and (4) promoting good governance and responsible citizenship. Fully confident that this plan enjoys broad-based support of Nagueños, having captured the collective aspiration, needs and priorities of our society, I am calling on call our people, partners and stakeholders of Naga’s continuing progress and sustainable development to join us in making it work. John G. Bongat City Mayor

iv
ACKNOWLEDGEMENTS The long overdue completion of this planning document was made possible through the invaluable support of the following: • City Mayor John G. Bongat who provided the City Planning and Development Office (CPDO) staff
with both the resources and moral support required by the planning process; • The Sangguniang Panlungsod, led by Vice Mayor Gabriel H. Bordado, Jr., who provided the
sense of urgency and exhibited exceptional patience and understanding when finalization of the draft was taking unexpected twists and turns;
• The various departments of the Naga City Government who willingly shared their data that helped
build up the sectoral white papers. These papers helped anchor the debates and deliberations during the five key sectoral workshops that helped flesh out the draft plan;
• The following institutions whose indicators and performance management programmes have been
essential in defining a richer and more meaningful state of development in the city, as well as the unique challenges it faces during the planning period: the United Nation’s Millennium Development Goals (MDGs), the World Health Organization’s Urban Urban Health Equity Assessment and Response Tool (Urban HEART), the Institute for Solidarity in Asia’s Public Governance System (PGS), and the Department of the Interior and Local Government’s Local Governance Performance Management System (LGPMS); and
• The following public and private agencies who answered our invites for the workships, without
whose vital presence and valuable inputs the plan would never have materialized at all:
o City government agencies: Individual city councillors, City Engineer’s Office, Public Safety Office, Liga ng mga Barangay, Task Force Tubig, City Environment and Natural Resource Office, City Population and Nutrition Office; Arts, Culture and Tourism Office; Metro PESO, City Agriculturist’s Office, City Veterinary Office, Naga City Visitors Center, City Health Office, Naga City Hospital, City Social Welfare and Development Office, Naga City School Board, City Budget Office, City Accounting Office, City Treasurer’s Office, City Human Resources and Management Office, City Assessor’s Office, and the City Mayor’s Office.
o Other local and national government government agencies (NGAs) in Naga: 2nd
Engineering District, Department of Public Works and Highways; Philippine National Railways, Land Transportation Office, Metro Naga Water District; Department of the Interior and Local Government - Naga City; DepEd Division of City Schools - Naga City; National Statistics Office - Camarines Sur; Naga City Police Office; Camarines Sur Provincial Environment and Natural Resources Office; Department of Trade and Industry - Camarines Sur; Department of Agrarian Reform; Naga City Fire Station, and Department of the Interior and Local Government - Camarines Sur.
o Regional offices of NGAs: Department of Agriculture, Department of Education,
Commission on Higher Education, Department of Social Welfare and Development, Technical Education and Skills Development Authority, Department of Health, Civil Service Commission, and the Department of the Interior and Local Government.
o Local and non-local civil society organizations: Naga City People’s Council; Kapisanan ng
mga Brodkaster sa Pilipinas - Camarines Sur; Ladies in Green Foundation, Inc.; Materials Recovery Facility Cooperative, Metro Naga Chamber of Commerce and Industry, Naga City Tourism Council, Camarines Sur Medical Society, Mother Seton Hospital; St. John Hospital; Naga City Women’s Council, Naga City Senior Citizens Federation, Naga City Federation of Persons with Disability; COPE Foundation, Inc.; Camarines Sur Council of Personnel Officers;

v
Ateneo Institute for Environmental Conservation and Research; Ateneo Social Science Research Center; Central Bicol State University for Agriculture; and the University of Nueva Caceres, On the other hand, a representative from ICLEI - Local Governments for Sustainability also attended as an observer.
• And finally, the hardworking CPDO staff who toiled to push the planning process towards their
logical conclusion. In particular, I would like to acknowledge the work of in-house specialists Norman Posugac (social), Rosario Reodique (economic), Cecile Daplin (infrastructure), Angel Gonzales (environment), Rose Ciudadano (institutional), Nephtali Pabines and Job Oliva (demographic) for their critical role in crafting the sectoral plans, eventually making this key planning document a reality.
Wilfredo B. Prilles, Jr. City Planning and Development Coordinator January 31, 2011

vi
THE CDP PLANNING PROCESS Preparation of the 2011-20 CDP went through the following steps: • Ecological profiling. It started late in the 2nd quarter of 2010 when the CPDO drafted an updated
ecological profile for Naga, using data from various agencies, local and national; results of the 2007 national census and local surveys; as well as annual operating reports prepared by the executive department.
• Preparation of sectoral white papers. From June to mid-August, CPDO sectoral specialists
prepared white papers for their respective sectors, drawn mainly from the ecological profile and the 2000 Comprehensive Land Use Plan and the PGS Naga City Roadmap for 2015. These white papers contain a situationer and preliminary SWOT analysis for the sector.
• Sectoral planning workshops. Skipping the visioning phase of CDP preparation, anchored on
the fact that the city still has a compelling and valid vision statement crafted under the 2015 City Roadmap, five sectoral planning workshops were held from August to September 2010, right before the busy Penafrancia festivities. o These workshops, aimed at generating foundational inputs to the plan, covered the following
sectors: Local Government (August 26); Demographic and Environment (September 1); Infrastructure (September 3); Economic (September 7); and Social (September 9).
o Participants to the workshop were drawn from members of the five sectoral committees of the City Development Council (CDC), augmented by representatives of City Government departments and offices, concerned National Government agencies, and additional representatives from Civil Society, particularly the academe and other interest groups.
o Inputs to the workshops included the following: (a) the Naga City Roadmap 2015; (b) the sectoral white papers which were attached to the letter-invitation; (c) researches, studies and other reference materials; (d) the LGPMS e-reports for Naga (covering local governance, financial performance, and state of development); (e) the initial SWOT analysis prepared by CPDO staff, and (f) the local knowledge, perceptions and expertise by the invited workshop participants themselves.
o Through a streamlined yet responsive event design, the workshops covered Steps 2 to 5 of CDP preparation – from determination of vision-reality gaps; to formulation of sectoral goals, objectives and/or targets; to the development of policy responses. Each followed the same structure: (a) preliminaries; (b) overview on the LGPMS; (c) overview of the planning process; (d) inputs based on the sectoral paper and LGPMS indicators; (e) workshop; (f) presentation and critiquing of workshop outputs; and (g) closing.
o Finally, an important factor that enlivened proceedings, enhanced the quality of outputs and differentiated it from other similar activities was the critical need for validation of baseline data. The facilitator emphasized the need for truth-telling and encouraged participants to challenge the data by offering better information, whether from official or unofficial sources. In regard to the initial SWOT analysis prepared by CPDO staff, they were given the option to (a) throw it away, (b) affirm, or (c) revise and enhance the analysis.
• Consolidation of workshop outputs. This took place in October, delayed by the Penafrancia
festivities and other subsequent activities that followed. • Drafting of the CDP. This phase was underestimated, and actually took two full months to
complete. • Initial presentation to the CDC. On January 25, 2011, the plan was then formally presented
during a regular, full-council meeting of the CDC.

vii
TABLE OF CONTENTS Title Page .................................................................................................................................. i Resolution Adopting the CDP ................................................................................................... ii Foreword .................................................................................................................................... iii Acknowledgments ..................................................................................................................... iv The CDP Planning Process ...................................................................................................... vi Table of Contents ...................................................................................................................... vii List of Tables ............................................................................................................................. viii List of Figures ........................................................................................................................... viii Chapter 1. Quick Facts about Naga City ............................................................................. 1
Brief Historical Background ......................................................................................... 1 Geophysical Characteristics ........................................................................................ 1 Population and Demographic Profile ........................................................................... 2 Social Services ............................................................................................................ 4 Economy ...................................................................................................................... 6 Infrastructure ................................................................................................................ 8 Environment ................................................................................................................. 10 Institutional Machinery ................................................................................................. 11
Chapter 2. Matrix of Local Development Indicators ............................................................ 14 Chapter 3. Comprehensive Development Plan .................................................................... 21
Vision ............................................................................................................................ 21 Vision-Reality Gap Analysis ......................................................................................... 23 Cross-Sectoral Challenges .......................................................................................... 24 Sectoral Development Plans ....................................................................................... 25
Social .............................................................................................................. 25 Economic ........................................................................................................ 33 Infrastructure and Physical Development ....................................................... 36 Environmental Management ........................................................................... 40 Institutional Development ............................................................................... 43
Chapter 4. Local Development Investment Program .......................................................... 45
Sectoral Investments ................................................................................................... 45 Social .............................................................................................................. 45 Economic ........................................................................................................ 46 Infrastructure and Physical Development ....................................................... 47 Environmental Management ........................................................................... 49 Institutional Development ............................................................................... 49
Projected Cost of the CDP ........................................................................................... 50 Financing the Plan ....................................................................................................... 51 Conclusion ................................................................................................................... 53
viii
LIST OF TABLES Table 1 Historical Population of Naga City, 1903-2007 ....................................................... 13 2 Projected Population of Naga City, 2010-30 Using Low, Medium
And High Growth Scenarios .................................................................................. 13 3 Comparative Bed Capacity of Hospitals in Naga City, 2010 .................................. 13 4 Projected Food Production and Requirement of Naga City, 2011-
13 ............................................................................................................................. 13 5 Registered Vehicles in Naga City, 2010 ................................................................. 13 6 Matrix of Local Development Indicators, Naga City ............................................... 15 7 Compatibility Map Between City Vision, Agenda, PGS Roadmap
and CDP Structure, Naga City ................................................................................ 22 8 Matrix of Vision-Reality Gap Analysis, Naga City ................................................... 23 9 Social Sector Investment Program, 2011-20 .......................................................... 46 10 Economic Sector Investment Program, 2011-20 .................................................... 47 11 Infrastructure Sector Investment Program, 2011-20 .............................................. 48 12 Environment Sector Investment Program, 2011-20 ............................................... 50 13 Institutional Development Sector Investment Program, 2011-20 ........................... 50 14 Local Development Investment Program, 2011-20, By Sector and
Source of Fund ....................................................................................................... 51 15 Historical Revenues of Naga City By Source, 2006-10 .......................................... 51 16 Projected Revenues of Naga City By Source, 2011-20 ......................................... 51 17 Projected Capital Expenditure Funds of Naga City By Source,
2011-20 ................................................................................................................... 52 18 Projected Share of Budgetary Resources By Type of Expenditure,
2011-20 ................................................................................................................... 53 LIST OF FIGURES Figure 1 Location Map of Naga City ..................................................................................... 1 2 Historical and Projected Population of Naga City ................................................... 2 3 Age Structure in Naga City, 2007 ........................................................................... 3 4 Gender Data ........................................................................................................... 3 5 Comparative share of Public and Private Schools across
education levels in Naga City ................................................................................ 4 6 Share of Preschool, Elementary and High School to total school-
age population ........................................................................................................ 5 7 Structure of Naga's economy ................................................................................. 6 8 Historical air quality readings in Naga .................................................................... 11 9 Educational attainment of Naga City Government employees ............................... 11 10 Strategy Map of the Naga City Government, 2011-20 ........................................... 21 11 The Proposed C-2 and South CBD II Development. ............................................... 49 LIST OF BOXES Naga City’s Vision Statement from the PGS Roadmap 2015 ................................................... 21 The 12 Elements of ‘Maogmang Lugar’ .................................................................................... 22

Chapter 1 Quick Facts about Naga City This chapter presents the basic statistical facts and figures about Naga City. Brief Historical Background • Even before the coming of the Spaniards, Naga was already a flourishing community off the
riverbanks of Naga River. The name “Naga” is said to have derived its origin from the narra trees, which were then in abundance. The late Fr. Raul Bonoan, S.J. however advanced an alternative theory linking the name to the Nagas, a serpent-worshipping northern Indian tribe that settled near or around water springs,
• In 1573, Spanish troops led by Capt. Juan de Salcedo were amazed to find a community with a fairly well-advanced culture. “Naga was then a premier village with a comparatively sophisticated weaponry and surprisingly advanced technology,” the book Naga City—From Epic to History said. The following year, Captain Pedro de Chaves founded Ciudad de Nueva Caceres in honor of Don Francisco de Sande, then governor of the province and a native of Caceres in Extramadura, Spain.
• Nueva Caceres served as capital of Ambos Camarines and later of Camarines Sur province. In 1919, the Americans reclassified the city into a town and restored it to its former name. It regained its status as an independent component city by virtue of Republic Act No. 305 on December 15, 1948 sponsored by Rep. Juan Q. Miranda. On June 6, 1955, it ceased to become provincial capital when the Camarines Sur provincial government moved its seat to neighboring Pili pursuant to RA 1336.
Geophysical Characteristics LOCATION AND AREA • Naga City is centrally located in the province of Camarines Sur, about 377 kames south of Manila
and 100 kames north of Legazpi City, Albay, Nestled at the foot of Mt. Isarog, the city has a total land area of 8,448 hectares.
Figure 1. Location Map of Naga City. Base map from Google Maps, city boundaries from Comprehensive Land use Plan 2000.

2
• On the Philippine Map, it is placed between 13 to 14° North Latitude and between 123 to 124° East Longitude. It is bounded on the North by the towns of Canaman and Magarao; on the East by Mt. Isarog and the capital town of Pili; on the South, by the town of Milaor; and on the West by the town of Camaligan. (See Fig. 1)
TOPOGRAPHY • The city’s terrain generally slopes upward from west to east. Its city center, trisected by the Bicol
and Naga rivers which are fed by creeks and riverines that crisscross the city, is located near its lowest point, making it susceptible to flooding when heavy rainfall causes these waterways to overflow.
• The low flatlands from the city center up to the upper barangays of Pacol and San Isidro at foot of Mt. Isarog, which accounts for 58% of the total land area, have slopes of 0-3 percent (almost level) to 3-8 percent (nearly level to slightly sloping). On the other hand, the easternmost part covering barangay Carolina has slopes of 8-18 percent while Panicuason, which includes the Forest and Parks Reserve (under NIPAS) has the steepest from 18-30 percent and above.
CLIMATE AND RAINFALL • Naga’s climatic type falls under Type II. This condition is characterized by a definite absence of
dry season and a very pronounced maximum rain period from November to January. The city had an average annual rainfall of 2,104 mm, although this has increased by around 12% to 2,361 mm over the last five years. September and October are usually the wettest, while February and April are the driest. During the same period, average temperature ranged between 26.5 to 27.0º C.
Population and Demographic Profile POPULATION COUNT AND TREND • According to the 2007 Census, Naga City has a population of 160,516. Of the total, 49% are male
0
50,000
100,000
150,000
200,000
250,000
300,000
350,000
400,000
450,000
1903
1918
1939
1948
1960
1970
1980
1990
2000
2007
2010
2015
2020
2030
1.65% 2.04% 2.43%
Figure 2. Historical and Projected Population of Naga City.
3
0-24 25-64 65 and over
Figure 3. Age Structure in Naga City, 2007.
85
90
95
100
105
110
Male Female
1995 2007 Working age
Figure 4. Gender Data. Women are inching ahead of men
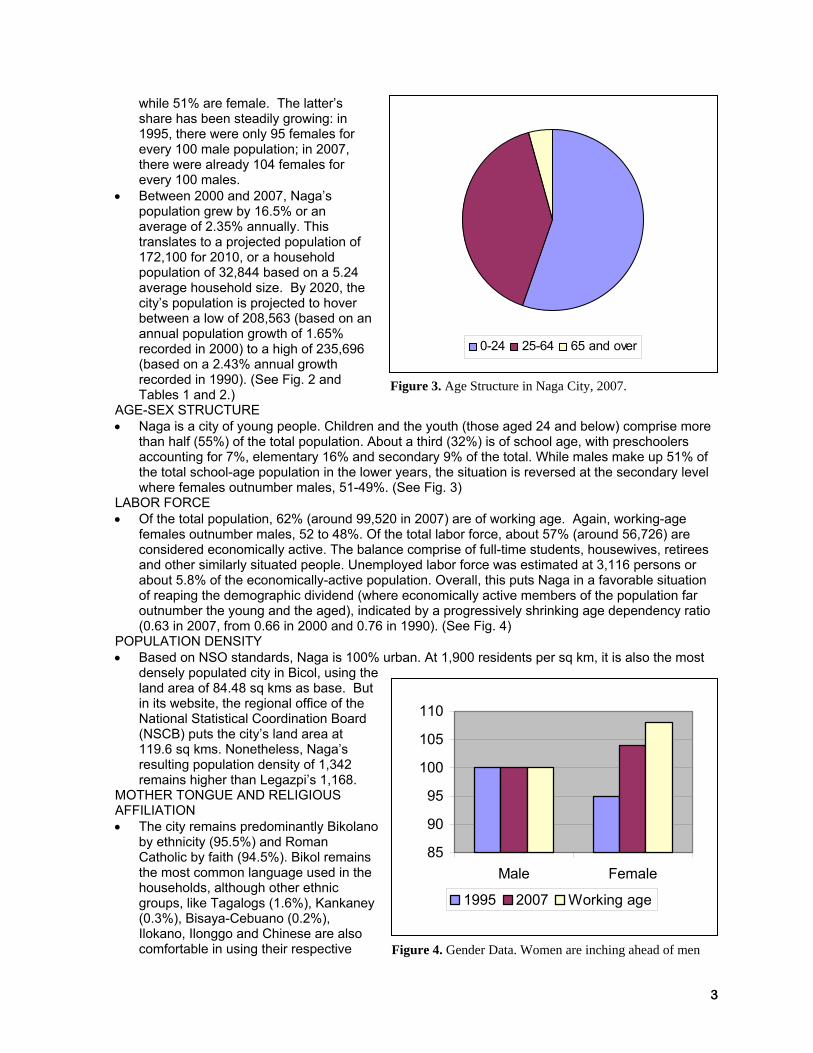
while 51% are female. The latter’s share has been steadily growing: in 1995, there were only 95 females for every 100 male population; in 2007, there were already 104 females for every 100 males.
• Between 2000 and 2007, Naga’s population grew by 16.5% or an average of 2.35% annually. This translates to a projected population of 172,100 for 2010, or a household population of 32,844 based on a 5.24 average household size. By 2020, the city’s population is projected to hover between a low of 208,563 (based on an annual population growth of 1.65% recorded in 2000) to a high of 235,696 (based on a 2.43% annual growth recorded in 1990). (See Fig. 2 and Tables 1 and 2.)
AGE-SEX STRUCTURE • Naga is a city of young people. Children and the youth (those aged 24 and below) comprise more
than half (55%) of the total population. About a third (32%) is of school age, with preschoolers accounting for 7%, elementary 16% and secondary 9% of the total. While males make up 51% of the total school-age population in the lower years, the situation is reversed at the secondary level where females outnumber males, 51-49%. (See Fig. 3)
LABOR FORCE • Of the total population, 62% (around 99,520 in 2007) are of working age. Again, working-age
females outnumber males, 52 to 48%. Of the total labor force, about 57% (around 56,726) are considered economically active. The balance comprise of full-time students, housewives, retirees and other similarly situated people. Unemployed labor force was estimated at 3,116 persons or about 5.8% of the economically-active population. Overall, this puts Naga in a favorable situation of reaping the demographic dividend (where economically active members of the population far outnumber the young and the aged), indicated by a progressively shrinking age dependency ratio (0.63 in 2007, from 0.66 in 2000 and 0.76 in 1990). (See Fig. 4)
POPULATION DENSITY • Based on NSO standards, Naga is 100% urban. At 1,900 residents per sq km, it is also the most
densely populated city in Bicol, using the land area of 84.48 sq kms as base. But in its website, the regional office of the National Statistical Coordination Board (NSCB) puts the city’s land area at 119.6 sq kms. Nonetheless, Naga’s resulting population density of 1,342 remains higher than Legazpi’s 1,168.
MOTHER TONGUE AND RELIGIOUS AFFILIATION • The city remains predominantly Bikolano
by ethnicity (95.5%) and Roman Catholic by faith (94.5%). Bikol remains the most common language used in the households, although other ethnic groups, like Tagalogs (1.6%), Kankaney (0.3%), Bisaya-Cebuano (0.2%), Ilokano, Ilonggo and Chinese are also comfortable in using their respective

4
0
20
40
60
80
100
120
Preschool Elementary High School Tertiary
Public Private
Figure 5. Comparative share of Public and Private Schools across education levels in Naga City.
languages, especially at home. Other religious affiliations include Iglesia ni Kristo (1.3%), Evangelicals (1.1%). Adventists (0.4%) and other smaller denominations which account for the balance.
MIGRATION • In 1990, 39% of the city’s population were considered migrants. In the 2007 Ateneo de Naga
University SSRC survey, results showed that 43% of city residents are born in Naga, 38% are from Camarines Sur, 9% are from other Bikol provinces, and 11% from outside Bikol. Their average length of stay in Naga is 28 years.
• The pace of migration can be inferred from the 2000 census, which showed that only 6.7% of the household population aged five years old and above moved their place of residence: almost all (93.3%) remained within the city. Of the migrant population, 2.1% moved in from other cities or towns of Camarines Sur, 1.8% from other provinces, and 0.2% percent from other countries; the remaining 3.5% did not indicate their former place of residence.
• According to OWWA data, there were around 2,588 overseas Filipino workers (OFWs) who are from Naga in 2008; after some adjustments, it is estimated that around for 8.5% of the city household population have an OFW member. This is higher than the 2009 NSO data placing the share of Bikolano OFWs to the Philippine total at only around 3%. The figure, however, is closer to results of the 2007 ASSRC survey which says that 11% of the city’s household population relies on “remittances, pensions, retirement” as source of income.
POVERTY INCIDENCE • According to NSCB estimates, poverty incidence in Naga ranged between 19-23% using its 2000
and 2003 family income and expenditure surveys. These official figures represent the lower limit of the city’s poverty situation. The higher limit is represented by the 61% who rated themselves as poor in the 2007 Ateneo SSRC survey, which used the self-rated approach to measuring poverty.
Social Services EDUCATION • As a center of education in Bicol,
Naga offers quality education from preschool to graduate courses. In 2009, its educational institutions, including day care centers which provide preschool training, totaled 181. Of these, 112 are public and 69 private. (See Fig. 5.)
• Both government and the private sector in Naga provide preschool services. For school year 2009-10, the city government’s 73 EduCare Centers (including its flagship SEED school) accommodated 2,853 preschoolers; DepEd-Naga’s 27 preschools admitted 2,874; and 20 private preschools enrolled 2,485, for a total of 8,212. This translates to a 67% participation rate when measured against the 12,166 projected preschool age (3-5 years old) population.
• Elementary education is being provided by 29 public and 21 private schools. For school-year 2009-2010, public elementary schools admitted 25,530 enrollees while private schools had 5,249 for a total of 30,779 pupils. Against the projected elementary school age (6-12 years old) population of 27,686, this translates to a 111% participation rate.
• Secondary education is provided by 8 public and 12 private schools. Last school year, public secondary schools accommodated 12,783 enrollees while private schools welcomed 5,330 for a total of 18,113. Against the projected high school age (13-16) population of 15,305, this translates
5
to an even higher 118% participation rate. These data however includes enrolment of non-city residents, which can mask access issues, especially at the secondary school level. (See Fig. 6.)
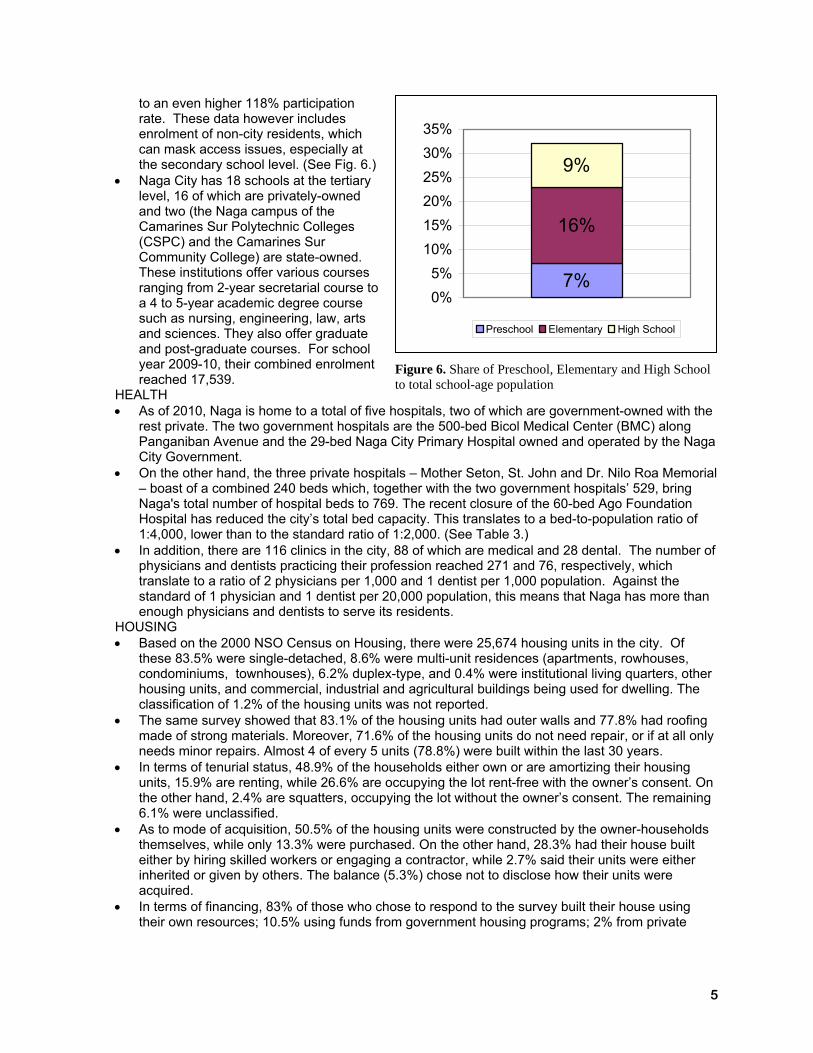
• Naga City has 18 schools at the tertiary level, 16 of which are privately-owned and two (the Naga campus of the Camarines Sur Polytechnic Colleges (CSPC) and the Camarines Sur Community College) are state-owned. These institutions offer various courses ranging from 2-year secretarial course to a 4 to 5-year academic degree course such as nursing, engineering, law, arts and sciences. They also offer graduate and post-graduate courses. For school year 2009-10, their combined enrolment reached 17,539.
HEALTH • As of 2010, Naga is home to a total of five hospitals, two of which are government-owned with the
rest private. The two government hospitals are the 500-bed Bicol Medical Center (BMC) along Panganiban Avenue and the 29-bed Naga City Primary Hospital owned and operated by the Naga City Government.
• On the other hand, the three private hospitals – Mother Seton, St. John and Dr. Nilo Roa Memorial – boast of a combined 240 beds which, together with the two government hospitals’ 529, bring Naga's total number of hospital beds to 769. The recent closure of the 60-bed Ago Foundation Hospital has reduced the city’s total bed capacity. This translates to a bed-to-population ratio of 1:4,000, lower than to the standard ratio of 1:2,000. (See Table 3.)
• In addition, there are 116 clinics in the city, 88 of which are medical and 28 dental. The number of physicians and dentists practicing their profession reached 271 and 76, respectively, which translate to a ratio of 2 physicians per 1,000 and 1 dentist per 1,000 population. Against the standard of 1 physician and 1 dentist per 20,000 population, this means that Naga has more than enough physicians and dentists to serve its residents.
HOUSING • Based on the 2000 NSO Census on Housing, there were 25,674 housing units in the city. Of
these 83.5% were single-detached, 8.6% were multi-unit residences (apartments, rowhouses, condominiums, townhouses), 6.2% duplex-type, and 0.4% were institutional living quarters, other housing units, and commercial, industrial and agricultural buildings being used for dwelling. The classification of 1.2% of the housing units was not reported.
• The same survey showed that 83.1% of the housing units had outer walls and 77.8% had roofing made of strong materials. Moreover, 71.6% of the housing units do not need repair, or if at all only needs minor repairs. Almost 4 of every 5 units (78.8%) were built within the last 30 years.
• In terms of tenurial status, 48.9% of the households either own or are amortizing their housing units, 15.9% are renting, while 26.6% are occupying the lot rent-free with the owner’s consent. On the other hand, 2.4% are squatters, occupying the lot without the owner’s consent. The remaining 6.1% were unclassified.
• As to mode of acquisition, 50.5% of the housing units were constructed by the owner-households themselves, while only 13.3% were purchased. On the other hand, 28.3% had their house built either by hiring skilled workers or engaging a contractor, while 2.7% said their units were either inherited or given by others. The balance (5.3%) chose not to disclose how their units were acquired.
• In terms of financing, 83% of those who chose to respond to the survey built their house using their own resources; 10.5% using funds from government housing programs; 2% from private
7%
16%
9%
0%5%
10%15%20%25%30%35%
Preschool Elementary High School
Figure 6. Share of Preschool, Elementary and High School to total school-age population
6
banks and other financial institutions; 1% with the help of employers; and 3.6% from private persons and other sources.
• Many of the new housing stock in the city were built in the 77 subdivisions covering a combined area of 643.2 hectares that were issued development permits by the City Government and completed over the last 10 years.
• On the other hand, according to the Naga City Disaster Mitigation Plan, areas that are considered as danger zones for housing are those located along the Naga and Bicol Rivers and those areas that are perennially flooded during heavy rains and typhoons. Severely flooded areas, which cover approximately 60 hectares, can be found in low-lying parts of barangays Abella, Calauag, Dayangdang, Igualdad Interior, Peñafrancia, Sabang, San Francisco, Sta. Cruz, Triangulo and Tinago. Records of the Urban Poor Affairs Office (UPAO) also indicate that about 55% of urban poor families covered by its Kaantabay sa Kauswagan (KSK) Program are located in these flood-prone barangays.
• To address the needs of Naga's urban poor, the city government has been implementing the Naga Kaantabay sa Kauswagan (KSK) which focuses on helping urban poor communities obtain security of tenure either by helping them acquire their homelots on-site or providing them new ones in off-site government-owned relocation sites. Twenty years after its launching in 1989, KSK program beneficiaries have reached 8,285 (representing 25.8% of the projected household population for 2009), more than twice the 4,000 households originally targeted for coverage.
PROTECTIVE • The 218 person-strong Naga City Police Office handles the daily peace and order situation of the
city. Protective services in Naga, though, is further enhanced by the presence of 50 police aides and 26 volunteers hired by the city government through the Public Safety Office (PSO), as well as 24 private security agencies.
• In keeping the peace, the local police force has two finger-printing equipment, one intra-station radiocom system; five police vehicles; six motorcycles and assorted PNP-issued firearms at its disposal. These are complemented by Closed Circuit Television (CCTVs) equipment installed throughout the city which are being monitored by the PSO.
• For more effective response time in case of emergency, two sub-stations and four police assistance centers were established in different strategic places in Naga. These stations are located in Barlin Street (which houses the NCPO headquarters) and in Concepcion Pequeña (near the intersection of Panganiban Drive and Magsaysay Avenue). PACs are located in Peñafrancia Avenue, Tabuco, Cararayan and Carolina.
• On the other hand, fire protection services in Naga are provided mainly by the local branch of the Bureau of Fire Protection (BFP) which falls under the operational control and supervision of the BFP Regional Office. As of 2009, the local firefighting force is composed of 108 personnel. The BFP unit is complemented by 40 volunteers from the Progressive Mason Club (Chin Po Tong) Fire Brigade and 18 from Naga White.
• Firefighting facilities and equipment being used by the local fire bureau consist of 4 fire engines, 2 emergency transport vehicles, and 1 service vehicle. On the other hand, Chin Po Tong has 2 pumper tankers and 1 super tanker while Naga White has 2 fire trucks.
• The Naga City District Jail (NCDJ) located in barangay Del Rosario houses all inmates of MTC and RTC and detainees/prisoners of the third and fourth districts of the province. As of 2009, there were 263 inmates at the NCDJ, 25 of which are female and 2 are juvenile delinquents. During the same year, 37 were transferred to the national penitentiary in Muntinlupa while 20 were convicted. To date, the NCDJ has only one serviceable vehicle.
Economy STRUCTURE • According to the 2000 ADB Cities Databook, Naga has a primarily trading and service-driven
economy. “The service sector employs the bulk of the city’s labor force, accounting for 71% of the total. The secondary and infrastructure sector (manufacturing, utilities and construction at 14%) and others (agriculture and government at 15%) account for the rest.” The service sector is further broken down into wholesale and retail trade (32%), consumer services (15%), financial and real estate services (9%), and social services (15%). (See Fig. 7.)

7
TRADE, COMMERCE AND SERVICES • As of December 2009, Naga City has a total of 5,754
business establishments (1,091 new and 4,663 renewals). This is 43% higher than the 4,025 firms registered in 2000 (889 new, 3,136 renewals), which translates to a 4.8% annual growth of the formal business sector for the last decade. Major types of business or trade comprise wholesale and retail trade, banking and finance, insurance, real state and services. Wholesale and retail trading firms account for 52.9% of the total businesses registered.
• Records from the Business License Division of the City Treasurer’s Office (CTO) show that there are 64 business establishments that are engaged in wholesale trading while 2,979 are engaged in retail trading.
• The business registry of the Metro Naga Chamber of Commerce and Industry (MNCCI) however shows that the local economy is in fact more robust than what official figures show. In 2007, a total of 1,217 new firms opened (49% higher than the 817 recorded by the City Treasury), bringing the registry’s total to 8,303. Compared to the 5,013 businesses listed with City Hall, it shows that 40% of the firms in Naga belong to the informal sector, indicating a thriving underground economy.
• In 2010, 46 banks were operating in Naga – six more than the 40 recorded ten years ago -- making it the regional financial center of Bicol. Of these, 23 are commercial banks, 15 thrift banks, 5 rural banks and 3 government banks. Joining them in the financial services subsector are 37 insurance firms of varying sizes, as well as recent entrants in the growing money remittance industry like M Lhuillier, Cebuana Lhuillier, Smart Padala, Globe G-Cash, Western Union and LBC Padala.
AGRICULTURE • In terms of land use, Naga remains primarily an agricultural city. Of the city’s total land area of
8,448 hectares, 4,550 hectares (54%) are allocated to agriculture. Data from the City Agriculturist’s Office show that the sector employs a total of 4,447 individuals, 31% of which are into farming while 69% work for the livestock and poultry industry. This means that on the whole, the sector provides employment for as much as 14% of the city’s household population.
• In terms of crops being planted, 52% of the local farming subsector is into rice production, 27% corn, 7% sugarcane, 6% vegetable, 4% abaca and 3% coconut farming. Nonetheless, Naga’s projected food requirements over the next five years (2011-15) show that the city will register a surplus only in corn, and will be deficient in the 10 other major food commodities, including rice, vegetable, fruits, rootcrops, livestock and poultry meat, eggs and fish. (See Table 4.)
• On the other hand, Naga has a thriving livestock industry where 8 commercial farms are the main players together with 2,040 backyard swine, cattle, carabao, goat and sheep raisers. In 2009, the City Abattoir processed a total of 62,863 heads, with hogs comprising 92%, cow and carabao had 4% each, with goats accounting for the remaining 1%.
MANUFACTURING • Naga has a relatively small industrial base. In 2009, 876 manufacturing firms were registered,
representing 12.5% of the total number of business establishments in the formal sector. • While a handful of specialized manufacturing activities such as bottling (Pepsi and Coca Cola),
chicken dressing and cooking oil processing exist, most other firms are engaged in small to cottage-scale food processing, metalworks, furniture manufacturing, jeepney bodybuilding, auto shops, warehousing and storage that fall under one of 17 key industry classifications in the city.
TOURISM • The local tourism industry in Naga continues to grow side by side with the province of Camarines
Sur, which is evident notwithstanding the absence of disaggregated data from the Department of Tourism. In 2009, the Naga-Camarines Sur tandem posted a total of 1.56 million foreign and domestic tourist arrivals, a 117% increase over the comparable period in 2008. Domestic visitors
Consumer Services, 47%
Others, 15%
Secondary and Infrastructure,
14%
Social Services, 15%
Product Services, 9%
Figure 7. Structure of Naga's economy. Based on 2000 ADB Cities Data Book.

8
increased by 140% while foreign arrivals rose by 146%. A NSCB fact sheet issued in December 2009 said that six of every ten tourists visiting Bicol go to Camarines Sur, with the remaining four divided among the remaining other five provinces.
• The city’s accommodation facilities have increased substantially over the last 10 years, from only 22 hotels, lodging and pension houses and resorts in 2000 to a total of 34 as of 2010 – an increase of 54%. In terms of combined room capacity, the expansion is more pronounced, reaching 112% from only 551 in 2000 to 1,169 in 2010.
• On top of the 13 socio-cultural and 3 historical tourism assets, including the renowned devotion to the Lady of Peñafrancia which celebrated its tercentenary in 2010 and continues to draw millions of pilgrims to Naga every year, another emerging draw is the City Government’s governance innovations that regularly attract both domestic and foreign visitors. In 2009, it welcomed delegations from 6 provincial, 10 city and 15 municipal governments; one barangay council, and one provincial civil society federation.
HOUSING AND PROPERTY DEVELOPMENT • Another key driver of local economic growth in the city is its vibrant construction and property
development subsector. In 2009, building construction grew by 125% in terms of volume (from 86 to 193) compared to 2008, although a 15% reduction in the aggregate project cost was also booked, mainly due to the construction of SM City Naga mall that inflated the 2008 figures.
• Six new subdivision permits were also issued within that year, twice the number approved for 2008 and 123% higher in terms of project cost (from P376 to P840 million). Combined, the subsector accounts for 79% of new investments infused into the local economy.
Infrastructure ROADS AND BRIDGES • As of December 2009, Naga’s road network has expanded to 184.1 kms, 19.8 more than the
164.3 kms recorded in 2000 – an increase of 12%. Of these roads, a total of 31.8 kms (17%) were built by the national government.
• In terms of road type, 147.7 kms (or 80% of the total) are concreted; 14.6 kms (8%) are concreted with asphalt overlay, 4.1 kms (2%) are asphalted; 11.9 kms (7%) are gravel surfaced; while 5.8 kms (3%) are still earth road/unsurfaced.
• Within Naga City are 11 city bridges spanning 223 meters, five national bridges with a total length of 272 meters, and two barangay bridges with a total length of 31 meters. Most of these bridges are found in the city center which is trisected by the Bicol and Naga Rivers.
LAND TRANSPORT • Naga’s public transportation system is mainly provided by some 5,007 units, broken down into the
following: o Around 300 aircon and non-airconditioned buses that ply inter-provincial routes within Bicol,
as well as trips between Naga and Metro Manila. They account for 6% of the total; o 291 Filcab vans, 203 of which cover intra-provincial routes while the remaining 88 ply inter-
provincial routes, mainly to Camarines Norte and Albay. These vans account for 6% of the total;
o 931 public utility jeepneys (PUJs) and multicabs, 608 of which cover routes to other towns in Camarines Sur, with the remaining 323 plying intra-city routes. PUJs and multicabs account for 19% of the total;
o 1,500 trimobiles serving mainly intra-city routes, whose number is fixed by a city ordinance, representing 30% of the total;
o 50 taxi units, which resumed operating in Naga after the opening of SM City Naga mall, accounting for 1% of the total;
o 1,925 units of pedicabs, more popularly known as “padyaks,” which are supposed to cover only barangay and subdivision roads but have contributed to congestion by entering certain city and national roads. This is the biggest form of public transport in terms of number, accounting for 38% of the total; and
o Around 10 units of calesas, mostly operating in Barangay Abella, which account for 0.2% of the total.
9
• As of June 2010, the total number of registered vehicles in Naga reached 19,740 units, 19.7% higher than the 16,494 registered in 1998. Of these, 17,947 (91%) are private, 1,522 (8%) are public utility, and 271 (1%) are government-owned vehicles. (See Table 5.)
• In terms of vehicle type, motorcycles dominate city roads, accounting for 57% or almost 3 of every 5 registered in the city. Utility vehicles, which are mostly jeepneys, comprise the next biggest group at 24%, followed by cars and SUVs at 10%, trucks and buses at 5%, and trimobiles at 4%.
AIR TRANSPORT • By plane, Naga is about 45-55 minutes away from Metro Manila via Naga Airport which is located
in the capital town of Pili, Camarines Sur, about 12 kilometers from the city proper. Air Philippines and Cebu Pacific field regular morning and afternoon flights to and from the national capital. Every week, around 30 flights serve the Naga-Manila route which allows greater flexibility to connect with other national and international destinations.
• Legazpi Airport, which is about two hours drive from Naga, can also be utilized in going to Manila or Cebu, largely because of the availability of jet service to and from the national capital.
RAIL AND WATER TRANSPORT • Daily commuter trains of the Philippine National Railways (PNR) have resumed operations and
are now plying the Naga-Ligao and Naga-Sipocot routes for as low as P33 to P66 per trip. Presently, revitalization activities are being undertaken by the PNR which may soon restore the regular Bicol-Manila run, all the way to Legazpi City.
• At present, only one motorized banca provides water transport services, handling the Naga- Libmanan route.
COMMUNICATION • Bayantel and Digitel are the two major telecommunication companies that provide basic and
advanced fixed-line telecommunication services in the city. Their combined subscriber base of almost 11,500 subscribers has pushed the city's fixed line telephone density to one for every three households.
• The entry of the wireless telecommunication companies led by Smart, Globe and Sun Cellular has accelerated growth of the local telecommunication industry. The 2007 Ateneo SSRC research shows that Nagueños have greater access to cellular service than landline, with every household owning two mobile phones on the average.
• Internet access has also been increasing, powered by more accessible and affordable broadband services being offered by Smart, Globe, Bayantel, Digitel and Sun Cellular, as well as bundled offerings by local cable TV operators Skycable and Caceres Cable. Cybercafes offering cheap internet services and games have also been mushrooming in the city, further enhancing greater access by local residents and visitors alike. Some service and commercial establishments, particularly hotels and restaurants, even offer free wi-fi internet service to customers as a value-added amenity.
• The broadcast media in Naga has continued to grow over the decade. These are being provided by 20 AM and FM radio stations, and four local television stations, ABS-CBN, GMA, PTV and UNTV. Also, two local cable TV companies provide up-to-date news, relevant information and entertainment to Nagueños. National dailies and local weekly newspapers are also available in the city.
• Postal services are being provided by the Philippine Postal Corporation (PhilPost) whose 42 staff and personnel handle a monthly average of 42,560 outgoing and 742 incoming mails and packages, and 2,000 foreign and domestic printed matters. It also operates a mailing station located at EMall along Penafrancia Avenue. Complementing it are seven messengerial companies namely JRS Express, LBC Air Cargo, DHL, Daily Overland Express, FedEx, OCS and 2Go (formerly Aboitiz Express). However, the advent of internet-based technologies and social networking sites like Yahoo, Hotmail, Gmail, MSN, Skype, Facebook, Twitter and Friendster have affected these traditional communication services.
WATER • The waterworks system run by the Metro Naga Water District (MNWD) supplies the requirements
of Naga and their four neighboring towns of Canaman, Camaligan, Gainza and Magarao. Its main water source comes from 3 springs located in Pili, Camarines Sur—the Anayan, Kalinisan and
10
Rumangrap springs--and 21 deep well pumping stations located in strategic sites within its service area.
• As of 2010, the MNWD water system has a total of 32,769 active connections, which is continuously growing at the rate of 153.3 average new connections per month. Average daily consumption of residential, commercial and government users are 24.51, 54.55 and 110.62 cubic meters, respectively. A cause for concern is a relatively high systems loss estimated at 24.4%, mainly due to pilferage and illegal connections.
• Complementing the MNWD is city government’s own Task Force Tubig (TFT) that installs Levels I and II water systems in key areas of the city. Recently, the city government has institutionalized the TFT by incorporating it as a new division of the City Engineer’s Office.
POWER • Electric power services in the city is being provided by the Camarines Sur II Electric
Cooperative (CASURECO II), one of the four electric cooperatives engaged in power retail in Camarines Sur. Power is sourced mainly from newly privatized generating plants connected to the Luzon Grid leased to and operated by the National Grid Corporation of the Philippines (NGCP).
• Data from the National Electrification Administration (NEA) show that as of June 30, 2010, CASURECO II has achieved 100% energization of all barangays, 69% of all sitios and 86% of all potential households within its coverage area. In Naga, it has energized all 27 barangays of the city.
• Its finances, as of late, have improved. In 2009, CASURECO II registered a P39.2 million net margin out of P1.37 billion sales, equivalent to 2.8% of the total.
• A lingering cause of concern is its 15.5% systems loss--7th highest among the 11 electric cooperatives in Bicol–which is only marginally lower than 16.8% registered in 2006. As a result, the electric cooperative failed to meet the 14.8% systems loss target for the year under the DOE Power Development Plan, putting it in danger of missing the 8.8% systems loss level targeted for 2010 and beyond.
• The same NEA data show that in 2009, CASURECO II has the 4th highest average power rate in Bicol – and highest among the four electric cooperatives in Camarines Sur – in spite of being the second biggest market next to Albay Electric Cooperative (ALECO). Naga is said to account for at least 60% of this market.
ADMINISTRATIVE INFRASTRUCTURE • Aside from being the regional trade, finance and services center of Bicol, Naga is also a key
government center, hosting city, provincial and regional units of 28 national government agencies. • This list includes the regional offices of the National Irrigation Authority (NIA), the Cooperative
Development Authority (CDA), the National Bureau of Investigation (NBI), as well as the pension funds GSIS and SSS. The presence of the latter, combined with the choice of the country’s major government and private banks to put up their regional operations in Naga, further underscores the city’s role as Bicol’s finance center.
Environment SOLID WASTE MANAGEMENT • Total garbage collection by the city government over the last three years has been going down
substantially, from 72,275 tons in 2008 to 48,009 in 2009 and recently to only 20,767 for 2010 – an average annual reduction of 36% over the last two years. This was made possible by decentralized waste segregation at the barangay, subdivision and institutional levels, in the process reducing volume being processed at the Balatas MRF.
• A profiling done on solid waste generated in the city shows that agricultural waste makes up close to a quarter (24%) of the total volume. Food wastes account for slightly smaller share at 23%. Paper-based materials and plastics each comprise 12%, followed by ash and dirt at 10, while the other materials are spread out in smaller percentages.
• Solid wastes are collected via the city’s government’s fleet of 12 garbage trucks which traverses ten routes on a daily basis. Collected wastes are then dumped at the 3.6-hectare Balatas Controlled Dumpsite where they are segregated according to type, i.e. biodegradable and non-biodegradable.

11
• Recently however, the 50-year old Balatas facility has almost reached full capacity, necessitating interventions like the waste-to-energy power plant (which will be fed by solid waste, including those in the dumpsite), and the rehabilitation and expansion of the materials recovery facility (MRF) within the compound – both aimed at extending its life and serviceability.
AIR QUALITY • As the Pilot Airshed Area of the Bicol
Region, weekly air quality monitoring through Hi-volume Sampling were made at Concepcion Pequeña, Magsaysay, and Panganiban crossing beside PNP Substation-1 to measure particulates that go with the air.
• In 2009, air quality reading worsened by 20% from 80 to 96 microgram per cubic meter (μg/m³). This reversed the gain registered in 2008 when the volume of atmospheric pollutants went down from 99 to 80 μg/m³, sending back the city’s air quality rating from Good to Fair. (See Fig. 8.)
WATER QUALITY • At present, the current environmental situation of the Naga River is quite challenging. Along the
urban center, it is classified as Class C, based on intended Water Use Stream Classification Scheme of the Philippine government.
• This qualifies its waters for irrigation of agricultural crops, the propagation and growth of fish and other aquatic resources; boating for recreation; and industrial water supply for manufacturing processes after treatment.
Institutional Machinery COMPONENT BARANGAYS • Naga has a total of 27 barangays of varying sizes. In terms of population, Dinage is the smallest
with 371 inhabitants as of 2007 while Concepcion Pequeña is the largest with 20,555. In terms of land area, Lerma is the smallest with 5.1 hectares while Carolina is the biggest with 1,777.4. Lerma is also the most dense at 444 persons per hectare while Carolina and Panicuason are the least dense at only 2 persons per hectare.
ORGANIZATIONAL STRUCTURE • More than 60 years after it was created
a chartered city, the Naga City Government has evolved an organizational structure that departs significantly from what was originally provided for under its charter, RA 305. The city had only 15 departments/offices in 1978. This later grew to 25 in 1999, and to 30 in 2009.
• As of December 2009, the city government has 988 employees, broken into 14 elective (1%), 469 permanent (47%), 391 casuals (40%), 95 contract of services including consultancy (10%), 18 job orders and one coterminous employee (2%). This translates to roughly one employee per 170 population.
• In terms of educational qualification, 2% have masteral/law degrees, 75% graduated from college, 6% are college undergraduates, 8% finished vocational courses, 7% finished high school, and 2% are elementary graduates. (See Fig. 9.)
Figure 8. Historical air quality readings in Naga
Educational Attainment2%
75%
6%
8%
7% 2%
Masteral/Law College College Undergrad
Vocational High School Elementary
Figure 9. Educational attainment of Naga City Government employees.

12
GOVERNANCE INNOVATIONS • Naga is also renowned for its governance innovations and best practices, for which it received
more than 150 national and international awards. It is the first city in the Philippines to institutionalize people participation and sectoral representation in policymaking with the enactment of the Empowerment Ordinance in 1996. As a result, the Naga City People’s Council (the federation of civil society organizations in city) identifies its own representatives, which account for at least 25% of the total membership, to all local special bodies and the 31 standing committees of the city government.
• It also pioneered the development of the Naga City Citizen’s Charter, a guidebook on 130 key city government services, having already produced three editions of the Charter pursuant to a local ordinance. These documents predated by at least seven years a national law that mandates the development of citizen’s charters by all national and local government agencies (RA 9485, more popularly known as the “Anti-Red Tape Act of 2007”).
FINANCIAL MANAGEMENT • Over the decade, Naga has consistently topped all Bicol cities in total locally sourced income,
business and real property tax collections. This performance enabled the city government to achieve a 50%-50% locally sourced-to-nationally source income ratio, higher than the 33%-67% national standard for cities.
• The city government also remains very liquid. By the end of 2009, it had total of P367.5 million in cash resources, enough to cover 72% of its 2010 budget of P508.9 million.
• In 2009, Naga received a credit rating of “B+,” the highest among eight cities initially rated by Standard and Poor’s, a reputable international rating agency, under a World Bank technical assistance program. It said: “Naga City’s overall financial management assessment (FMA) score is the highest among assessed Philippines LGUs to date, reflecting the city’s more balanced developments in its FMA practices for most key areas, as opposed to some local peers who may demonstrate sound practices in certain elements such as revenue management, but at the same time scoring poorly in other areas like debt management, budgeting etc.”
13
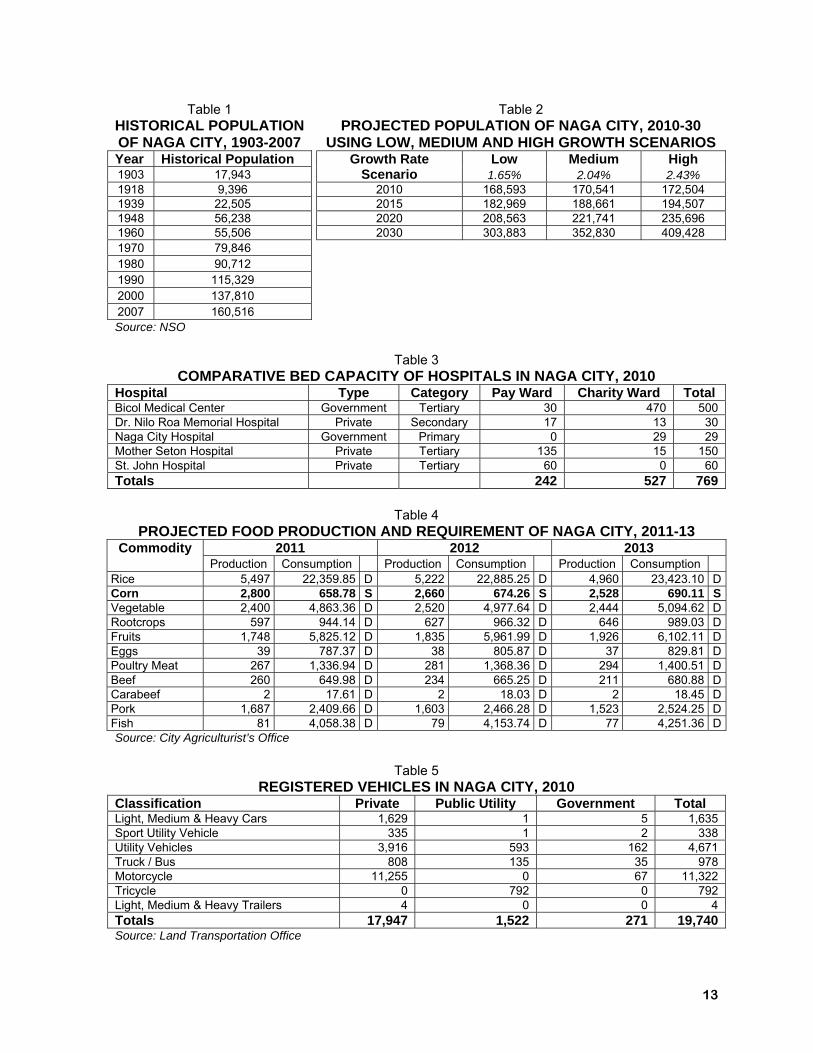
Table 1 HISTORICAL POPULATION OF NAGA CITY, 1903-2007
Table 2 PROJECTED POPULATION OF NAGA CITY, 2010-30
USING LOW, MEDIUM AND HIGH GROWTH SCENARIOS Year Historical Population Low Medium High 1903 17,943
Growth Rate Scenario 1.65% 2.04% 2.43%
1918 9,396 2010 168,593 170,541 172,504 1939 22,505 2015 182,969 188,661 194,507 1948 56,238 2020 208,563 221,741 235,696 1960 55,506 2030 303,883 352,830 409,428 1970 79,846 1980 90,712 1990 115,329 2000 137,810 2007 160,516 Source: NSO
Table 3 COMPARATIVE BED CAPACITY OF HOSPITALS IN NAGA CITY, 2010
Hospital Type Category Pay Ward Charity Ward Total Bicol Medical Center Government Tertiary 30 470 500 Dr. Nilo Roa Memorial Hospital Private Secondary 17 13 30 Naga City Hospital Government Primary 0 29 29 Mother Seton Hospital Private Tertiary 135 15 150 St. John Hospital Private Tertiary 60 0 60 Totals 242 527 769
Table 4 PROJECTED FOOD PRODUCTION AND REQUIREMENT OF NAGA CITY, 2011-13
2011 2012 2013 Commodity Production Consumption Production Consumption Production Consumption Rice 5,497 22,359.85 D 5,222 22,885.25 D 4,960 23,423.10 DCorn 2,800 658.78 S 2,660 674.26 S 2,528 690.11 SVegetable 2,400 4,863.36 D 2,520 4,977.64 D 2,444 5,094.62 DRootcrops 597 944.14 D 627 966.32 D 646 989.03 DFruits 1,748 5,825.12 D 1,835 5,961.99 D 1,926 6,102.11 DEggs 39 787.37 D 38 805.87 D 37 829.81 DPoultry Meat 267 1,336.94 D 281 1,368.36 D 294 1,400.51 DBeef 260 649.98 D 234 665.25 D 211 680.88 DCarabeef 2 17.61 D 2 18.03 D 2 18.45 DPork 1,687 2,409.66 D 1,603 2,466.28 D 1,523 2,524.25 DFish 81 4,058.38 D 79 4,153.74 D 77 4,251.36 DSource: City Agriculturist’s Office
Table 5 REGISTERED VEHICLES IN NAGA CITY, 2010
Classification Private Public Utility Government Total Light, Medium & Heavy Cars 1,629 1 5 1,635 Sport Utility Vehicle 335 1 2 338 Utility Vehicles 3,916 593 162 4,671 Truck / Bus 808 135 35 978 Motorcycle 11,255 0 67 11,322 Tricycle 0 792 0 792 Light, Medium & Heavy Trailers 4 0 0 4 Totals 17,947 1,522 271 19,740Source: Land Transportation Office

Chapter 2 Matrix of Local Development Indicators To monitor and assess the state of development in Naga City, the city government uses a combination of development indicators relevant to its needs. These indicators include the following:
• the United Nation’s Millennium Development Goals (MDGs) • the World Health Organization’s Urban Health Equity Assessment and Response Tool (Urban
HEART) • the Institute for Solidarity in Asia’s Public Governance System (PGS), and • the Department of the Interior and Local Government’s Local Governance Performance
Management System (LGPMS. This chapter presents these indicators, which were presented to, debated and validated by the participating stakeholders during the series of sectoral planning workshops conducted in August and September 2010. They are summarized under Table 6.
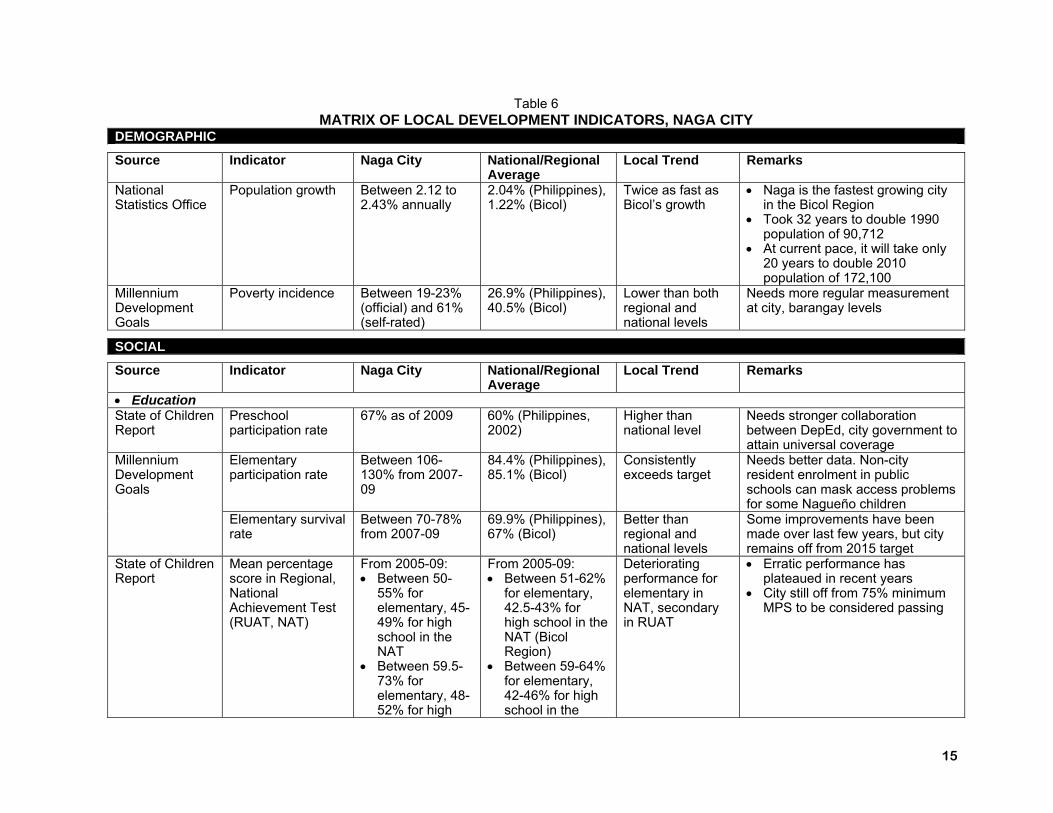
15
Table 6 MATRIX OF LOCAL DEVELOPMENT INDICATORS, NAGA CITY
DEMOGRAPHIC
Source Indicator Naga City National/Regional Average
Local Trend Remarks
National Statistics Office
Population growth Between 2.12 to 2.43% annually
2.04% (Philippines), 1.22% (Bicol)
Twice as fast as Bicol’s growth
• Naga is the fastest growing city in the Bicol Region
• Took 32 years to double 1990 population of 90,712
• At current pace, it will take only 20 years to double 2010 population of 172,100
Millennium Development Goals
Poverty incidence Between 19-23% (official) and 61% (self-rated)
26.9% (Philippines), 40.5% (Bicol)
Lower than both regional and national levels
Needs more regular measurement at city, barangay levels
SOCIAL
Source Indicator Naga City National/Regional Average
Local Trend Remarks
• Education State of Children Report
Preschool participation rate
67% as of 2009 60% (Philippines, 2002)
Higher than national level
Needs stronger collaboration between DepEd, city government to attain universal coverage
Elementary participation rate
Between 106-130% from 2007-09
84.4% (Philippines), 85.1% (Bicol)
Consistently exceeds target
Needs better data. Non-city resident enrolment in public schools can mask access problems for some Nagueño children
Millennium Development Goals
Elementary survival rate
Between 70-78% from 2007-09
69.9% (Philippines), 67% (Bicol)
Better than regional and national levels
Some improvements have been made over last few years, but city remains off from 2015 target
State of Children Report
Mean percentage score in Regional, National Achievement Test (RUAT, NAT)
From 2005-09: • Between 50-
55% for elementary, 45-49% for high school in the NAT
• Between 59.5-73% for elementary, 48-52% for high
From 2005-09: • Between 51-62%
for elementary, 42.5-43% for high school in the NAT (Bicol Region)
• Between 59-64% for elementary, 42-46% for high school in the
Deteriorating performance for elementary in NAT, secondary in RUAT
• Erratic performance has plateaued in recent years
• City still off from 75% minimum MPS to be considered passing

16
school in the RUAT
RUAT
• Health Under 5 mortality rate
From 5.55 (2007) to 2.33 per 1,000 live births (2009)
32.0 (Philippines), 6.1 (Bicol)
Significantly lower than both regional and national levels
Has already met 2015 target
Infant mortality rate Increased from 0.30 (2007) to 1.91 per 1,000 live births (2009)
24.0 (Philippines), 9.3 (Bicol)
Substantially lower than both regional and national levels
Has already met 2015 target, in spite of slippages
Maternal mortality ratio
Increased from 0.30 (2007) to 0.78 per 100,000 live births (2009)
162.0 (Philippines), 1.2 (Bicol)
Substantially lower than national, marginally lower than regional levels
Has already met 2015 target, in spite of slippages
Millennium Development Goals
Fully immunized children
Increased from 85% (2007) to 90% (2009)
83% (Philippines), 87% (Bicol)
Marginally higher than both regional and national levels
Continues to recover lost ground towards full immunization achieved in previous years
MDG, State of Children Report
Preschool malnutrition
Between 4-5% from 2007-09
24.6% (Philippines), 22.6% (Bicol)
Significantly lower than both regional and national levels
State of Children Report
Grade school malnutrition
Reduced from 19% (2005) to 11% (2009)
No data available Needs sustained implementation of “Nutri Dunong” program
Incidence of road traffic injuries
17 8.3 (Philippines) Significantly higher than national level
Urban HEART
Social health insurance enrolment
13% 79% Substantially lower than national level
Does not take into account city’s own social insurance scheme anchored on the Naga City Hospital
• Housing MDG, Public Governance Scorecard (PGS)
Proportion of urban poor households enjoying secure tenure
63% No data available
City Profile Proportion of KSK beneficiaries to
25.8% Not applicable Higher than 20% ratio when
Unmanaged program expansion and weak collection efficiency,
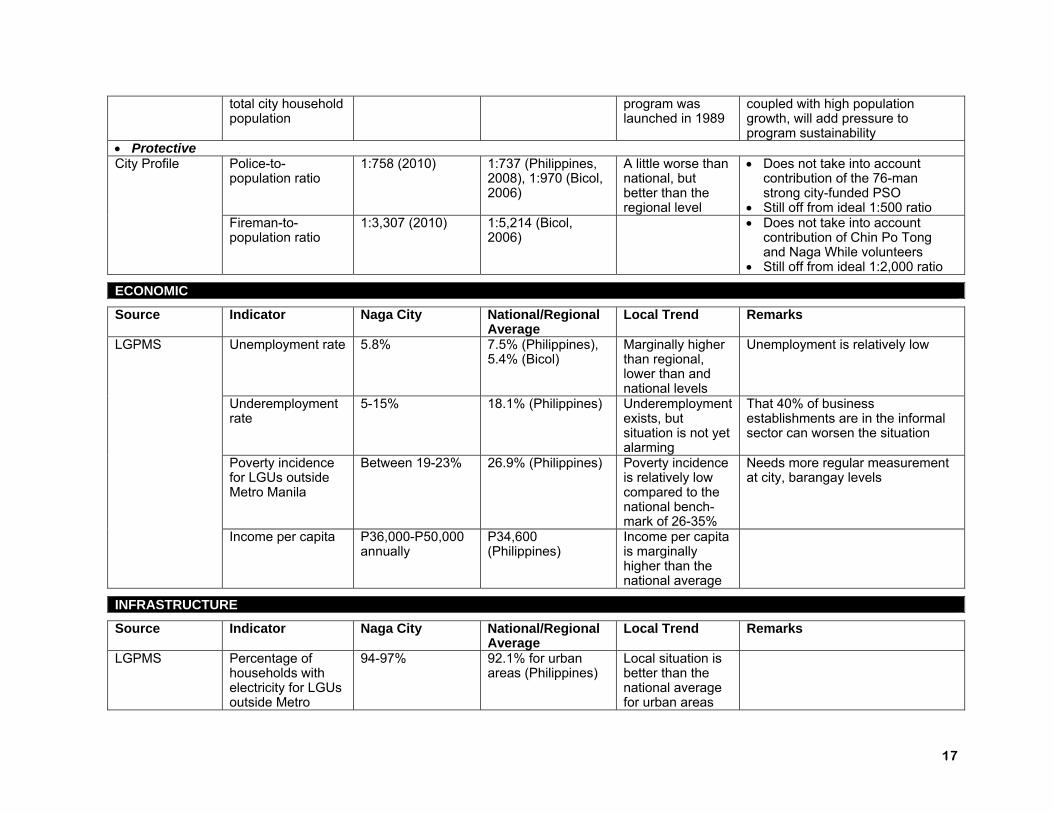
17
total city household population
program was launched in 1989
coupled with high population growth, will add pressure to program sustainability
• Protective Police-to-population ratio
1:758 (2010) 1:737 (Philippines, 2008), 1:970 (Bicol, 2006)
A little worse than national, but better than the regional level
• Does not take into account contribution of the 76-man strong city-funded PSO
• Still off from ideal 1:500 ratio
City Profile
Fireman-to-population ratio
1:3,307 (2010) 1:5,214 (Bicol, 2006)
• Does not take into account contribution of Chin Po Tong and Naga While volunteers
• Still off from ideal 1:2,000 ratio
ECONOMIC
Source Indicator Naga City National/Regional Average
Local Trend Remarks
Unemployment rate 5.8% 7.5% (Philippines), 5.4% (Bicol)
Marginally higher than regional, lower than and national levels
Unemployment is relatively low
Underemployment rate
5-15% 18.1% (Philippines) Underemployment exists, but situation is not yet alarming
That 40% of business establishments are in the informal sector can worsen the situation
Poverty incidence for LGUs outside Metro Manila
Between 19-23% 26.9% (Philippines)
Poverty incidence is relatively low compared to the national bench-mark of 26-35%
Needs more regular measurement at city, barangay levels
LGPMS
Income per capita P36,000-P50,000 annually
P34,600 (Philippines)
Income per capita is marginally higher than the national average
INFRASTRUCTURE
Source Indicator Naga City National/Regional Average
Local Trend Remarks
LGPMS Percentage of households with electricity for LGUs outside Metro
94-97% 92.1% for urban areas (Philippines)
Local situation is better than the national average for urban areas

18
Manila Percentage of households with sanitary toilets for LGUs outside Metro Manila
91-96% 75% (Philippines, Urban HEART data)
Local situation is significantly higher than the national average
Water pollution due to domestic wastes and its effects on public health is somewhat less threatening
Percentage of households with access to piped-in water
91-95% 83% (Philippines, Urban HEART data)
Local situation is better than the national average
Many households have access to piped-in water supply. Easy access to this service is available to more than 90% of the population.`
ENVIRONMENT
Source Indicator Naga City National/Regional Average
Local Trend Remarks
• Solid Waste PGS Proportion of city’s
residential areas whose garbage is collected at least four times a week
85% No data available City roadmap targets raising it to 99% by 2015
Garbage collection and disposal is a big financial burden to the city government, which is spending around P38 million (roughly 8% of its annual budget) in providing the service. Cost recovery is only 5%.
• Air Quality City Profile Ambient air quality
reading “Fair” - 96 microgram per cubic meter (μg/m³) in 2009
No data available City roadmap targets raising it to “Good” by 2015
In 2008, the city already achieved “Good” rating after achieving 80 μg/m³ reading
Percentage of polluting industries
All industries have pollution control facilities
No data available Better air quality in urban areas is expected
LGPMS
Absence of smog, odor and noise in urban areas
Smog, odor and loud and uncomfortable noise level are absent.
No data available Better air quality in urban areas is expected
From time to time, foul odor coming from the Balatas Controlled Dumpsite has become an issue due to capacity problems
• Water Quality PGS Average water
quality rating of Naga River
Class C No data available City roadmap targets raising it to “B+” by 2015
LGPMS Freshwater quality Water is turbid (light brown to
No data available Freshwater quality is poor
Water should be clear, without water lilies and/or floating wastes
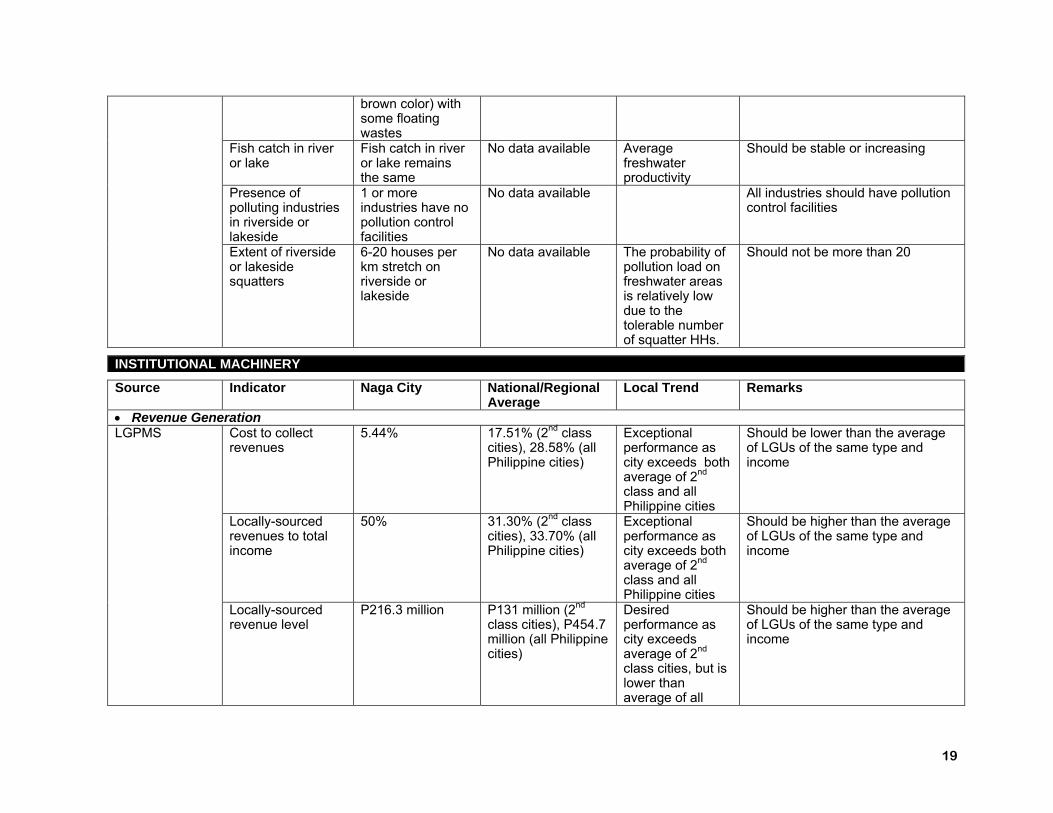
19
brown color) with some floating wastes
Fish catch in river or lake
Fish catch in river or lake remains the same
No data available Average freshwater productivity
Should be stable or increasing
Presence of polluting industries in riverside or lakeside
1 or more industries have no pollution control facilities
No data available All industries should have pollution control facilities
Extent of riverside or lakeside squatters
6-20 houses per km stretch on riverside or lakeside
No data available The probability of pollution load on freshwater areas is relatively low due to the tolerable number of squatter HHs.
Should not be more than 20
INSTITUTIONAL MACHINERY
Source Indicator Naga City National/Regional Average
Local Trend Remarks
• Revenue Generation Cost to collect revenues
5.44% 17.51% (2nd class cities), 28.58% (all Philippine cities)
Exceptional performance as city exceeds both average of 2nd class and all Philippine cities
Should be lower than the average of LGUs of the same type and income
Locally-sourced revenues to total income
50% 31.30% (2nd class cities), 33.70% (all Philippine cities)
Exceptional performance as city exceeds both average of 2nd class and all Philippine cities
Should be higher than the average of LGUs of the same type and income
LGPMS
Locally-sourced revenue level
P216.3 million P131 million (2nd class cities), P454.7 million (all Philippine cities)
Desired performance as city exceeds average of 2nd
class cities, but is lower than average of all
Should be higher than the average of LGUs of the same type and income
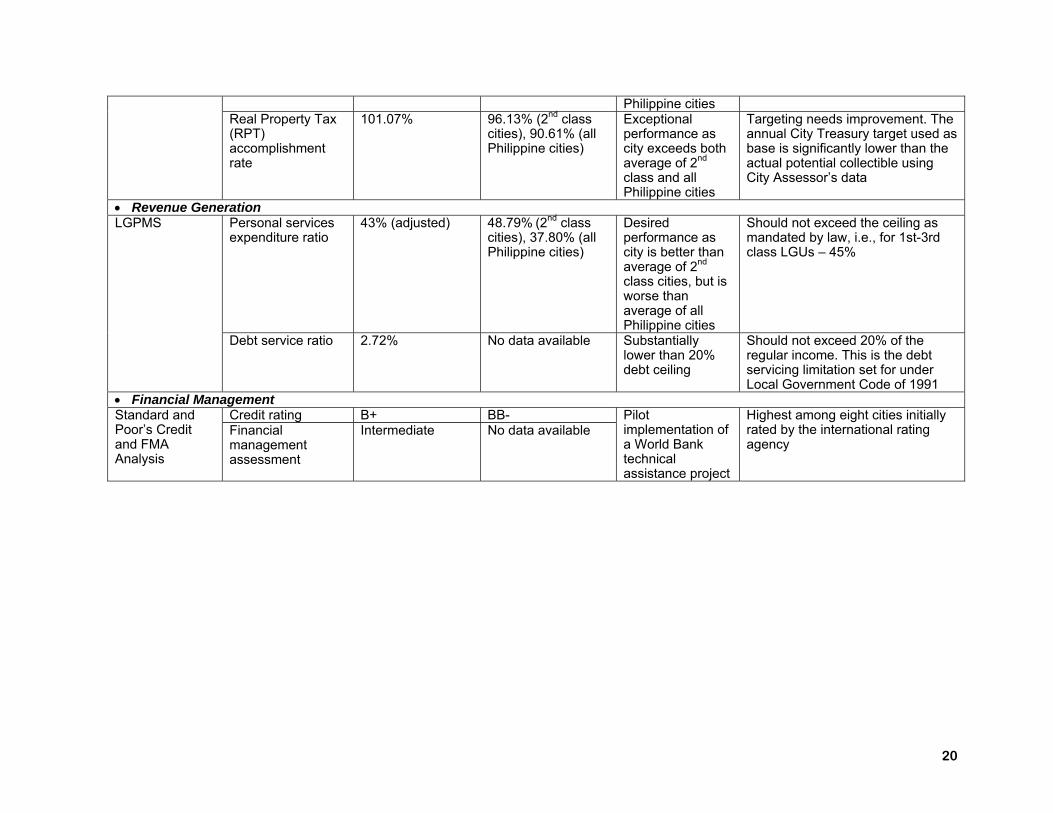
20
Philippine cities Real Property Tax (RPT) accomplishment rate
101.07% 96.13% (2nd class cities), 90.61% (all Philippine cities)
Exceptional performance as city exceeds both average of 2nd class and all Philippine cities
Targeting needs improvement. The annual City Treasury target used as base is significantly lower than the actual potential collectible using City Assessor’s data
• Revenue Generation Personal services expenditure ratio
43% (adjusted) 48.79% (2nd class cities), 37.80% (all Philippine cities)
Desired performance as city is better than average of 2nd
class cities, but is worse than average of all Philippine cities
Should not exceed the ceiling as mandated by law, i.e., for 1st-3rd class LGUs – 45%
LGPMS
Debt service ratio 2.72% No data available Substantially lower than 20% debt ceiling
Should not exceed 20% of the regular income. This is the debt servicing limitation set for under Local Government Code of 1991
• Financial Management Credit rating B+ BB- Standard and
Poor’s Credit and FMA Analysis
Financial management assessment
Intermediate No data available Pilot implementation of a World Bank technical assistance project
Highest among eight cities initially rated by the international rating agency

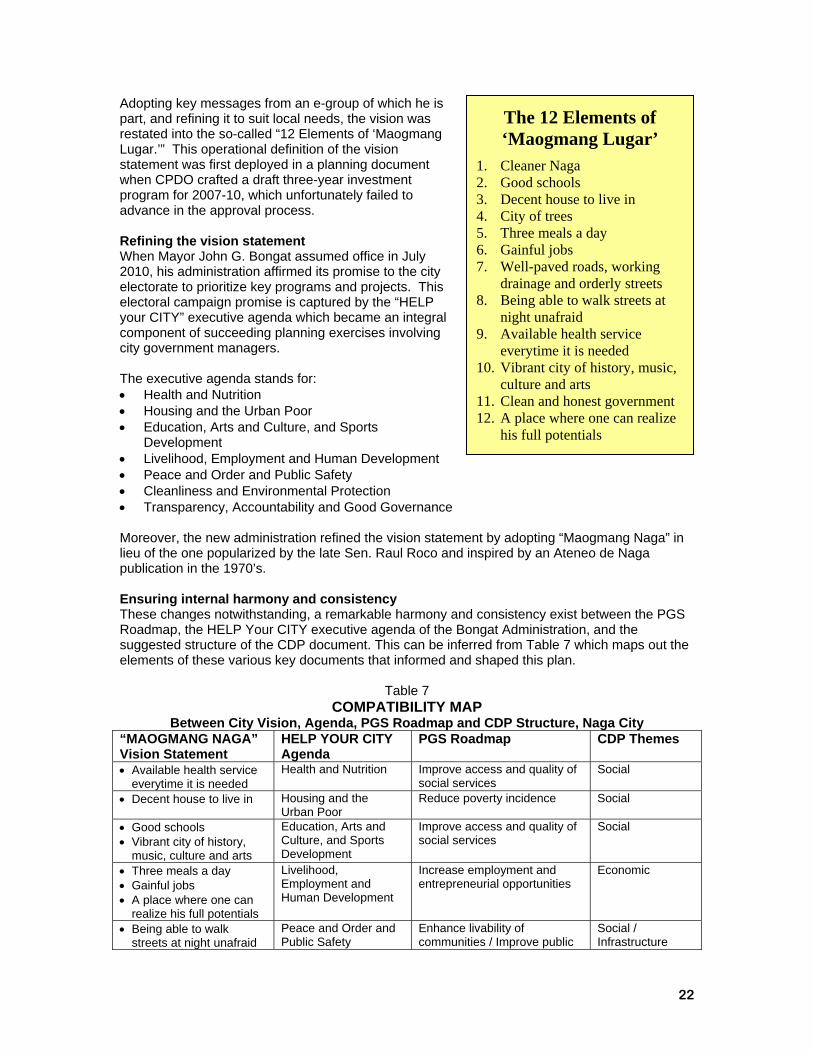
Chapter 3 Comprehensive Development Plan This chapter describes Naga City’s plan for comprehensively responding to the development challenges faced by the city as described by the indicators summarized in Chapter 2. It takes off from a discussion of the city vision – the “future state” that its citizens and their leaders aspire Naga to become well into the future. Then it identifies the gaps between that vision and current realities, which the development indicators describe, and summarizes the main themes that emerge – the so-called cross-sectoral challenges it faces during the planning period. Finally, it documents the five sectoral plans crafted by stakeholders that seek to respond, both to these major challenges facing society as well as those facing their respective sectors. Vision To avoid reinventing the wheel, the CDP adopts a finetuned version of the city vision statement contained in the Naga City Roadmap 2015 crafted under the Public Governance System (PGS) project conducted in partnership with the Institute for Solidarity in Asia (ISA). The vision statement (see box) remains compelling, having been crafted in 2005 through a highly participative process involving representatives of various sectors of Naga’s society facilitated by experts on the “Balanced Scorecard” scheme which underpins the PGS. In addition, what makes it relevant in the current context is the emphasis it puts on the pursuit of happiness, which is recognized as one of the sovereign rights of man. Contemporary development literature has also increasingly recognized the need to measure the state of happiness of a society, giving rise to such measures as the so-called “Gross Happiness Index” that seek to complement traditional metrics like the GNP and GNP. Communicating the vision In 2007, then Mayor Jesse M. Robredo sought to communicate the vision statement to ordinary citizens in a better way. Several meetings with public school heads impelled this, as the audience failed to connect with the vision as worded at the time.
Naga: “An Maogmang Lugar” By 2015, Naga City shall be the recognized model of: • Good governance and responsible citizenship
– driven by a shared development direction crafted, implemented and continually improved in an inclusive manner
– sustained by a citizenry that asserts their rights and accepts their roles and responsibilities in nation-building
• People-centered development – anchored on quality and accessible services in
health, education and other social services, especially for the marginalized and the vulnerable;
– that enables the private sector to generate the best value from local talents, technology and resources, and provide gainful jobs and entrepreneurial opportunities for the Nagueno; and
• Abiding faith – that expresses itself in social solidarity and a
culture of excellence flourishing in a city that is peaceful, safe and in accord with nature; where cultural values are nurtured and religious diversity respected; and where technology enables the Nagueño to be part of a global community of people and nations.
Naga City’s Vision Statement from the PGS Roadmap 2015.
22
Adopting key messages from an e-group of which he is part, and refining it to suit local needs, the vision was restated into the so-called “12 Elements of ‘Maogmang Lugar.’” This operational definition of the vision statement was first deployed in a planning document when CPDO crafted a draft three-year investment program for 2007-10, which unfortunately failed to advance in the approval process. Refining the vision statement When Mayor John G. Bongat assumed office in July 2010, his administration affirmed its promise to the city electorate to prioritize key programs and projects. This electoral campaign promise is captured by the “HELP your CITY” executive agenda which became an integral component of succeeding planning exercises involving city government managers. The executive agenda stands for: • Health and Nutrition • Housing and the Urban Poor • Education, Arts and Culture, and Sports
Development • Livelihood, Employment and Human Development • Peace and Order and Public Safety • Cleanliness and Environmental Protection • Transparency, Accountability and Good Governance Moreover, the new administration refined the vision statement by adopting “Maogmang Naga” in lieu of the one popularized by the late Sen. Raul Roco and inspired by an Ateneo de Naga publication in the 1970’s. Ensuring internal harmony and consistency These changes notwithstanding, a remarkable harmony and consistency exist between the PGS Roadmap, the HELP Your CITY executive agenda of the Bongat Administration, and the suggested structure of the CDP document. This can be inferred from Table 7 which maps out the elements of these various key documents that informed and shaped this plan.
Table 7 COMPATIBILITY MAP
Between City Vision, Agenda, PGS Roadmap and CDP Structure, Naga City “MAOGMANG NAGA” Vision Statement
HELP YOUR CITY Agenda
PGS Roadmap CDP Themes
• Available health service everytime it is needed
Health and Nutrition Improve access and quality of social services
Social
• Decent house to live in Housing and the Urban Poor
Reduce poverty incidence Social
• Good schools • Vibrant city of history,
music, culture and arts
Education, Arts and Culture, and Sports Development
Improve access and quality of social services
Social
• Three meals a day • Gainful jobs • A place where one can
realize his full potentials
Livelihood, Employment and Human Development
Increase employment and entrepreneurial opportunities
Economic
• Being able to walk streets at night unafraid
Peace and Order and Public Safety
Enhance livability of communities / Improve public
Social / Infrastructure
The 12 Elements of ‘Maogmang Lugar’
1. Cleaner Naga 2. Good schools 3. Decent house to live in 4. City of trees 5. Three meals a day 6. Gainful jobs 7. Well-paved roads, working
drainage and orderly streets 8. Being able to walk streets at
night unafraid 9. Available health service
everytime it is needed 10. Vibrant city of history, music,
culture and arts 11. Clean and honest government 12. A place where one can realize
his full potentials

23
• Well-paved roads, working drainage and orderly streets
infrastructure and facilities
• Cleaner Naga • City of trees
Cleanliness and Environmental Protection
Enhance livability of communities
Environment
• Clean and honest government
Transparency, Accountability and Good Governance
Broaden access to participatory mechanisms
Institutional
Vision-Reality Gap Analysis After comparing the above with the city profile described in Chapter 1 and the key development indicators summarized in Chapter 2, the following are the vision-reality gap for Naga City, representing the key development challenges it faces over the next 10 years:
Table 8 MATRIX OF VISION-REALITY GAP ANALYSIS, NAGA CITY
VISION STATEMENT CURRENT REALITY • Available health service
everytime it is needed Key MDG indicators have already been met. Major policy to be resolved is social health insurance, Philhealth vs. City Hospital-based localized health service delivery. Rising incidence of road traffic injuries noted, mainly due to the fast rise of motorcycles as dominant vehicle type (3 of every 5 registered vehicles)
• Decent house to live in Major strides were made in ensuring secure tenure for the urban poor. But there are issues on managing expansion, with high population growth and weak collection efficiency threatening long-term sustainability
• Good schools • Vibrant city of history, music,
culture and arts
• City gained some ground toward universal preschool participation, and in ensuring children survival in school. Erratic academic performance remains an issue, still off from 75% minimum passing score
• There is renewed interest on culture and the arts, and need for indicators to measure performance
• Three meals a day • Gainful jobs • A place where one can realize
his full potentials
• Unemployment, underemployment and malnutrition remain relatively low
• Job quality remains a concern, owing to large informal sector • Food security an issue, as city is self-sufficient only in one of 11 major
foodstuffs • Addressing needs (especially in regard to livelihood and employment)
of the 20% who are income-poor remains a challenge, especially in the context of high migration-driven population growth
• Being able to walk streets at night unafraid
• Well-paved roads, working drainage and orderly streets
• Improvements in police manpower, organizational status have been made. But public safety remains a lingering issue due to perceived rise in criminality, in spite of positive official figures.
• Private transport has increased in volume, bringing about an inefficient transport system characterized by delays and congestion. There is need to improve quality of public land transport to encourage shift and promote efficiency.
• High system losses in water and power remain a concern, which can impact prices of these key services.
• Cleaner Naga • City of trees
• Poor cost recovery in garbage collection and disposal is adding budgetary pressures to service provision.
• Capacity problems of the Balatas Controlled Dumpsite have become a serious concern, emitting foul odor everytime stored garbage is moved.
• The Class C rating and other allied problems associated with the Naga River remains a continuing challenge to society.
• Clean and honest government • City government continues to perform well as an institution, both at the revenue and expenditure sides. Good financial management practices have been affirmed by favorable credit rating from Standard and Poor’s.

24
• Sustaining governance innovations and quality of public service delivery are long-term challenges.
Cross-Sectoral Challenges Informed by the PGS Roadmap, the city therefore needs to address four key cross-sectoral or major development challenges for the current planning period to deliver on its “Maogmang Ciudadano sa Maogmang Naga” vision. These are: • Reducing poverty incidence
o At the demand side, this requires greater efficiency and effectiveness in harmonizing existing poverty programs of government, and ensuring that they are targeting the same clientele, i.e. the 20% income-poor households in Naga, This requires putting in place a database of these households, and ensuring that they are prioritized in terms of all poverty programs of the city government, i.e. housing, education, microfinance, skills training, livelihood and enterprise development, health and nutrition, etc.
o At the supply side, this requires creating employment and entrepreneurial opportunities that will keep pace with, if not exceed, the city’s increasing migration-driven population growth.
• Improving access to basic services. Similarly, in the face of an increasing population, it requires government to strategically manage investments in the delivery of social services to ensure that they will maintain, if not exceed, the current performance levels described in Section 3.
• Enhancing quality of life thru livable communities. This requires well crafted government policies, programs and projects on transport and urban development that will operationalize “smart growth” and a “compact city” development in Naga – built around revitalizing public transport, developing and protecting vibrant public spaces (which includes Naga River), promoting mixed-use development, and reducing travel time and transportation costs between home and work.
• Good governance and responsible citizenship. This requires government to bring its governance innovations to the next level, anchored on a strong civic education program that promotes the virtues of responsible citizenship – which is the fundamental value and vision behind the HELP Your CITY agenda.
• At the same time, it requires continuously broadening participatory and collaborative governance mechanisms that will encourage individual citizens, households, organized groups, local institutions and even neighboring municipalities to partner with the city government in realizing mutually beneficial goals.
Strategic Responses To respond to these major development challenges, the PGS Roadmap specifies six basic strategies, which were adopted to underpin the CDP and provide the underlying logic to its sectoral components. These are: 1. Reduce poverty incidence 2. Enhance livability of communities 3. Increase employment and entrepreneurial opportunities 4. Improve public infrastructure and facilities 5. Broaden access to participatory mechanisms, and 6. Improve access and quality of social services Figure 10 below captures the interrelationships between these strategies that will realize the “Maogmang Naga” vision for city residents. On the whole, they require the city government to “do more with less” (i.e. forge partnerships with civil society aside from increasing its revenues and using internal resources more efficiently), provide “fast and responsive services” to customers (made possible by better programs and information flow within the bureaucracy) through its corps of “motivated and competent employees” (who are mission- and performance-driven, having embraced a culture of transparency).
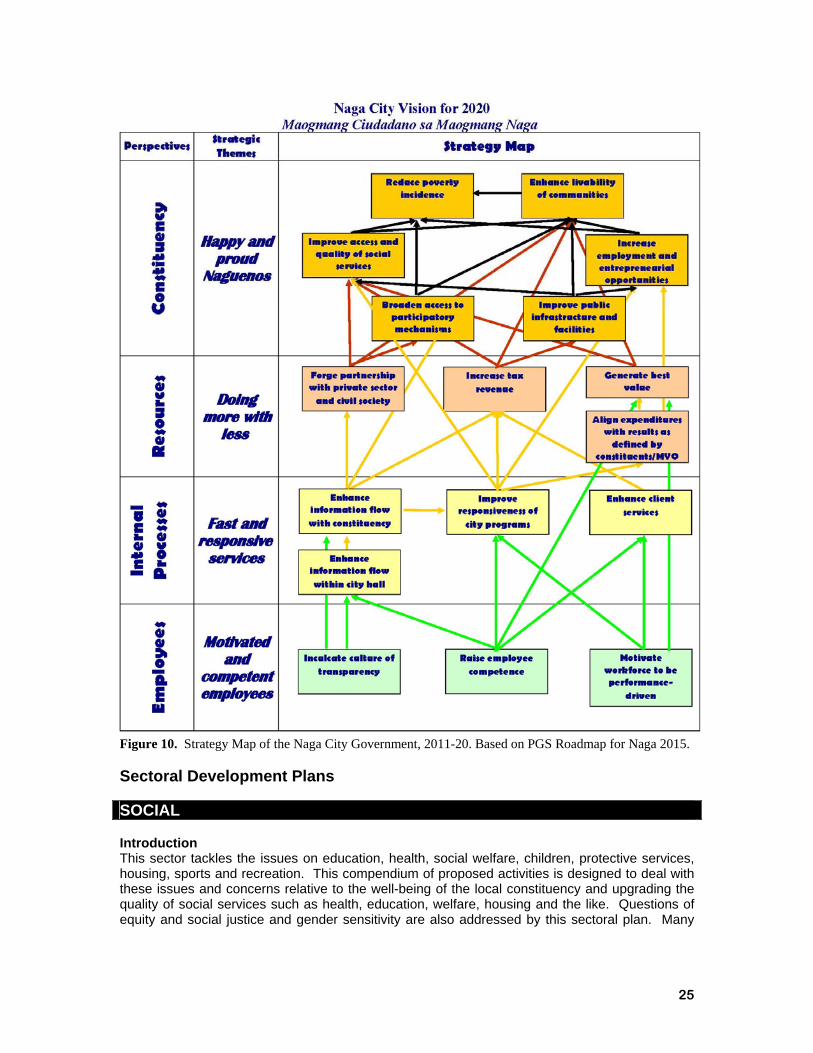
25
Figure 10. Strategy Map of the Naga City Government, 2011-20. Based on PGS Roadmap for Naga 2015. Sectoral Development Plans SOCIAL Introduction This sector tackles the issues on education, health, social welfare, children, protective services, housing, sports and recreation. This compendium of proposed activities is designed to deal with these issues and concerns relative to the well-being of the local constituency and upgrading the quality of social services such as health, education, welfare, housing and the like. Questions of equity and social justice and gender sensitivity are also addressed by this sectoral plan. Many
26
programs and projects in this sector are of the “soft” capital type but are as important as capital investment of “hard” projects. SUBSECTOR: Education Goals • Improve the quality of education of the school-going population. • Promote equitable, affordable and accessible education for all Nagueños. Objectives and Targets At the end of the planning period, the Education subsector shall attain the following objectives: • To consistently improve National Achievement Tests results so that Naga will exceed the
minimum passing MPS of 75% on all subject areas • To cut the number of dropouts by 50% by 2013, and raise cohort survival and completion
rates to 100% by 2020 • To increase tertiary completion rate from 25 % to 35% by 2015 and 50% by 2020 Strategies • Enhancing partnership between the allied agencies in the promotion of affordable and quality
education. • Quality and affordable education shall be available for all as a tool for the city’s development
in the next ten years. • Immediate passage of a system for scholarship • Increase scholarship fund • Establish tertiary public institution operated by the city • Improve classroom to pupils ratio especially in secondary schools • All classrooms should have CRs for male and female • New classrooms should be built and ready for vertical expansion • Introduction of 12-year Basic Education • Establishment of Naga City Training Center Academy Programs and Projects • Feeding Program • Expand/Strengthen SANGGAWADAN Program/QUEEN • Additional Instructional Materials • CommuniTEACH • Summer Enrichment Program • Community Dunong Centers • Additional Scholarship Fund • Scholarship Program • Tertiary Public Institution operated by the city • Construction of additional classrooms, comfort rooms for male and female • Construction of additional school buildings with provision for vertical expansion • BRIDGE Program • Naga City Training Center Academy Proposed Legislations • Additional scholarship program for tertiary education • Ordinances establishing and institutionalizing Naga City Training Center Academy, bridge
programs, CommuniTEACH, Summer Enrichment, and expansion of the QUEEN programs Project Ideas

27
• Naga City Training Center Academy – the academy will be the city’s premier public tech-voc school providing an alternative schooling for OSYs, college dropouts and underprivileged students
• Bridge Program – will facilitate career guidance for high school students before enrolling for tertiary education
• CommuniTEACH – will provide accessible education to less privileged youth in the community
• Summer Enrichment Programs – will provide supplementary education for students while enjoying their summer vacation
• QUEEN – includes the provision of free tuition fees and miscellaneous fees to less privileged elementary pupils and high school students
SUBSECTOR: Health Goals • Improve the health status of the constituency. • Provide affordable, quality and accessible health services to all Nagueños. Objectives and Targets At the end of the planning period, the Health subsector shall attain the following objectives: • To improve health indicators by 10 percent • To establish a DENR-accredited health care waste disposal facilities • To strengthen quality assurance in every health facility • To ensure continuous availability of blood supply • To secure representation of private hospitals in the LHB membership • To attain the ideal bed-to-population ratio (1:2,000) • To maintain zero Maternal Mortality Rate • To reduce teenage pregnancy • To expand coverage of indigent families to Philhealth by 100 percent. • To provide affordable and quality over-the-counter medicines to the community Strategies • Coordinate with DENR regarding the accreditation of health care waste disposal facilities • Strengthening of quality assurance in every health facility through strict monitoring • Ensure continuous availability of blood supply thru Blood Bank Program • Include representative from private hospital as member of LHB • Attain the ideal bed-to-population ratio (1:2,000) by establishing additional tertiary hospitals • Maintain zero MMR by providing affordable and quality maternal and child care services in
the barangays • Reduce teenage pregnancy by providing reproductive health care services • Inviting Philhealth to a conference aimed at expanding coverage to indigent families. • Provide affordable and quality over-the-counter medicines to the community through Botica
ng Barangay Programs and Projects • Integration of health services under one government institution • Establishment of waste storage facilities by private sector • Training on quality improvement activities for health providers • Conduct training on blood donor recruitment • Campaign/IEC programs for blood donation • Invite private sector representatives (hospitals) as members of LHB • Expansion of NCH to secondary level • Encourage private sector and government hospitals to expand their facilities through
investment incentives

28
• Training of midwives • Establishment of lying-up clinics in barangays • Develop incentives for hilots for referral • Coordinate with private Ob-Gyne regarding awareness training on reproductive health • Conduct training on Reproductive Health • Tap NGOs for additional health services • Organize women’s health team • Expansion of Philhealth Programs • Expansion of certified DOH Botica ng Barangays esp. to upper barangays • Orient/train project holders and BNB operators on BNB Proposed Legislations • Requiring/urging Membership of private hospitals into the Local Health Board • Urging/requiring private sector to put up waste storage facilities • Establishing blood donation program in the city • Establishing lying-up clinics in barangays • On training programs: health providers, women’s health team, hilots, midwives, teenage
reproductive health, BNB operators • Establishing Botica ng Barangay • Expansion of PHILHEALTH coverage to all barangays Project Ideas • Establishment of lying-up clinics in barangays – this will reduce the incidence of child and
maternal mortality in the city • Blood Donation Program – will ensure the steady of blood supply • Training programs for health workers – this will upgrade their capabilities on basic health
remedies • Training for BNB operators – this will enable BNB operators become aware of basic
pharmacy operations (inventory, bookkeeping, etc.) • Establishment of Botica ng Barangay – BNBs will provide immediate access to basic
medicines at affordable prices • PHILHEALTH for all barangays – the expansion of PHILHEALTH coverage will ensure quality
and affordable medical services to the barangays. SUBSECTOR: Social Welfare Goals • To promote and to protect the rights of the marginalized sectors: children, women, senior
citizens and persons with disabilities (PWDs) Objectives and Targets At the end of the planning period, the city would have: • accessible buildings (public and private) • transport facilities with reserved seats for PWD passengers (Air, water and sea transport) • available PWDs’ data bank (including senior citizens with disability, women, children and
adult with disability) • Free medicines provided for senior citizens and PWDs • Senior Citizens Ward in private and government hospitals • Enrollment of Senior Citizens to PHILHEALTH • Masterlist of senior citizens • Availment of 50 percent discount on electricity, water and telephone for PWDs and senior
citizens • Gender-sensitive programs and projects that address the needs of women and children.

29
Strategies • Intensify information, education and advocacy campaigns on gender and disability issues and
concerns. • Strengthen/ expand collaboration and partnership between and among PWDs, government
and private sector. • Regular annual fund allocation for PWD programs and services (0.5% ) City/Barangay • Establish data base on disability thru survey, research and PWD profiler • Operationalize PDAO • Passage of the local ordinances in support of the PWD program and services/activities • Monitoring on the compliance of the law General Assembly to nominate three nominees (for
OSCA Head) • Compliance of ½ of 1% of LGU Budget for senior citizens activities • Coordinate/ dialogue with concerned establishments re discounts for PWDs and senior
citizens • Purchase of equipment, tables, chairs and others Programs and Projects • IEC on women and disability affairs • PWD database • Seminars on rights of senior citizens, women and PWDs. • Establishment of City Coordinating and Monitoring Board • Seminars and Training • Cooperatives • Financial Support Proposed Legislations • Ordinance supporting programs and projects for senior citizens, PWDs and women. Project Ideas • PWD Database – an information system containing pertinent data on the number of PWDs in
the city --- their disabilities and their personal needs. • IEC on Women’s rights, Senior Citizens and PWDs – a lecture seminar which encourages the
marginalized sector to fight for their basic rights as mandated by law. SUBSECTOR: Children Goals • Promote children’s participation in governance • Enhance the development of children and realizing their full potentials • Ensure the survival of children • Establish a protective system for children Objectives and Targets • To minimize number of delinquent minors and CICL • To establish children’s center and additional manpower • To increase participation of pre-school enrolment in barangay levels • To provide additional knowledge and skills on OSYs' fields of interest • To lessen access of school children to computer shops, video games and irrelevant
recreational games • To enhance awareness of parents on their roles and responsibilities

30
Strategies • Identify/ survey pre-school children in all barangays • Conduct survey to identify OSYs per barangay • Provide additional knowledge and skills on OSYs' fields of interest • Better access to ALS • Lessen access of school children to computer shops, video games and irrelevant recreational
games • Enhance awareness of parent’s roles and responsibilities • Strict monitoring and implementation of existing laws and ordinances Programs and Projects • Construction of additional pre-school centers and hiring of additional teachers • Seminars on parenting • Seminars for OSYs • Improvement of Alternative Learning System • Provision of children’s center and additional manpower Proposed Legislations • Provision of financial support to Scholarship programs • Parents’ accountability and imposing penalties on failure of child-rearing • Additional appropriations, fund sourcing Project Ideas • Establishment of children’s center • OSY Seminars • Alternative Learning System • Seminars on effective parenthood SUBSECTOR: Sports and Recreation Goals • To ensure provision of parks, plazas, greenery at relocation area • To conserve areas for recreational purposes • To implement meaningful sports and recreational activities for the constituency. Objectives and Targets At the end of the planning period: • Parks and plazas would have been maintained (cleanliness, orderliness, conserved) • More meaningful activities for sports and recreation would have been identified and enjoyed
by the community. Strategies • Public-private consultations/partnerships in the establishment of recreational parks and
plazas Programs and Projects • Identification of open spaces for recreational purposes • Promotion of meaningful sports and recreational activities • Naga River Rehab Project (NRRP) Proposed Legislations • Ordinances identifying and promoting the development of areas where people can enjoy
recreational activities

31
Project Ideas • Naga River Rehab Project – beautification of river walkway SUBSECTOR: Housing Goals • To increase collection efficiency rate (50%) for the KSK program • To access LCMP Fund at the SHFC (P50 M) • To realize approved Subdivision Plan/5 Sites per year • To achieve approved Comprehensive City Shelter Plan • To expedite land conversion of land acquired by LGU for resettlement purposes Objectives and Targets At the end of the planning period: • the collection efficiency rate of the KSK program would have increased by 20 percent. • The LCMP Fund of P 50 M would have been utilized by the city for its housing programs • 5 sites per year would be approved for subdivision development • Comprehensive City Shelter Plan would have been approved • Land conversion for resettlement purposes would have been expedited Strategies • Strict enforcement of UDHA Compliance on 20% Balanced Housing • Issuance of Monthly Bill for KSK collection • Encourage and authorize local organization to collect monthly amortization • Provision of livelihood opportunities aside site development • Convene UDHB and re-activate committees in monitoring erring KSK beneficiaries • All applicants must be screened / evaluate and approved by the UDHB • Conduct Urban Poor Seminar-orientation to qualified / potential urban poor beneficiaries re:
rules and regulations • Establish systematic data base: e.g. List of beneficiaries, list of applicants, list of lot owners/status, cost of acquisition • Strict compliance to BP 220 • Reporting of actual expenditures of KSK Fund (10% of City Budget less Personal Services) Programs and Projects • Seminar orientation for qualified / potential urban poor beneficiaries re: rules and regulations • Issuance of KSK monthly bills Proposed Legislations • Ordinance enforcing the collection of amortization through homeowners’ organizations, use of
monthly KSK bills Project Ideas • Monthly Bill issuance – akin to CASURECO and MNWD system, the issuance of monthly bills
for KSK amortizations will ensure prompt payment and systematic recording of payments. • Establishment of relocation areas – identified relocation sites will decongest the perennial
problem of the proliferation of squatters in the city SUBSECTOR: Protective Services Goals • Improve the peace and order situation of the city • Enhance security of the constituency

32
Objectives and Targets • To increase assignment of 20 personnel annually • To undergo continuous mandatory basic and advance courses / training At the end of the
planning period, the educational situation would have improved by 10 percent. • Procurement of communication equipment with replacement program every three years • Issuance of one-is-to-one firearm ration • Enhancement and upgrading of office equipment • Construction/ repairs of all police buildings and transfer of current office to CSPPO compound • Elevate NCPO as permanent police office with standard logistical budget • Provide sufficient gas allocation • Increase budget for fixed expenditures • Sufficient budget for OPN support • Procurement of restraining devices • Provision for sufficient ammos • With separate cell for sick and unhealthy inmates • Sufficient medical supplies • Increase of assignment of 5 personnel annually • Increase of assignments of 10 personnel every year • Attainment of firetrucks • Attainment of ambulances • Issuance and purchase of radios • Attainment of standard fire hydrants to strategic places Strategies • Upgrading and increase in budget for the maintenance of support from LGU • Persistent request to cope up with the standard police-to-population ratio • Consistent police-related trainings • Request from national headquarter and LGU’s support • Compliance to the mandate of laws • Request from NHQ and LGU’s support • Undertake necessary repairs • Request approval of PNP-CHQ and with representation from DBM • Request from NHQ and RHQ thru LGU on items A to E • Donation of lots for construction of cells and infirmary • Request LGU for additional personnel to cope up with much needed personnel to man the
facilities • Persistent request from NHQ thru the RHQ to cope-up with the standard fireman-to-
population ratio (for BOFP) • LGU lot donations for the construction of fire sub-station (for BOFP) • Request for issuance of fire-fighting gears and equipment (for BOFP) • Installation of fire hydrants • Request from NHQ for incorporation to the national budget (BOFP) • Appropriation of budget thru SP resolution Programs and Projects • Establishment/construction of fire stations at Barangays Penafrancia and Pacol • Issuance/procurement of fire-fighting gears and equipment • Procurement of firetrucks, ambulances, radios and ammos • Construction/establishment of fire hydrants • Procurement of FSI vehicles • Request/ purchase of medical equipment/supplies

33
Proposed Legislations • Ordinance institutionalizing allotment of funds for the procurement of firetrucks, ammos,
radio, medical equipment and supplies, establishment of fire stations at Barangays Penafrancia and Pacol
Project Ideas • Fire Station Projects – establishment of fire stations at barangays Peñafrancia and Pacol • Purchase of fire-fighting gears, ammo, firetrucks, ambulances, radios • Establishment of fire hydrants • Procurement of vehicles for PNP/ BOFP / BJMP • Purchase of medical supplies and equipments ECONOMIC Introduction This sector covers the issues on the core subsectors of agriculture, tourism, commerce and trade. It leverages the city’s vibrant economy to sustain its growth and create new opportunities for expansion, especially through targeted government investments in both existing and emerging industries.. SUBSECTOR: Agriculture Goals • P10,000 net income per month per household-hectare • Reverse land conversion • Produce healthful food • Promote appropriate technology on crop diversification to maximize the utilization of land
area • Conduct training to farm family members with skills capability building on small scale
entrepreneurs to increase farm incomes and profitability Objectives and Targets • To provide technical assistance to farmers with improved crop production technology with
emphasis on low cost production techniques • To enhance the productivity and increase farm incomes through the Diversified Farming
Systems Approach • To promote the organic farming techniques for sustainable agriculture Strategies • Intensify and diversify crop production within the existing prime agricultural lands • Increase farm and livestock production by protecting key agricultural areas from land
conversion and promotion of production boosting methods • Encourage participation of the private sector in the provision of support facilities to meet
future agricultural demands, prevent pollution and top soil deterioration • Minimize land conversion to ensure continuity of local food supply Programs and Projects • Sustainable Agriculture for Rural Income Growth (SARIG) • Dairy Production • Swine weaning production for dispersal and fattening • Cutflower Production Project • Establishment of Livestock Auction Market Proposed Legislations

34
• An ordinance mandating the City Agriculturist Office the management and implementation of the Sustainable Agriculture for Rural income Growth (SARIG) Program
• An ordinance providing funds for the procurement of equipment necessary for milk production and providing funds thereof for the training in the care of animal.
• An ordinance providing funds thereof for the mass buying of piglets for dispersal for fattening. • An ordinance mandating the City Agriculturist Office to provide cutflower producers access to
appropriate technology in cutflower production. • An ordinance establishing a Livestock Auction Market that will be under the management of
the Naga City Abattoir Office. Project Ideas • Sustainable Agriculture for Rural Income Growth – An agricultural loan assistance
program that significantly help the farming sector financial needs to increase their income. • Dairy Production - Involves the procurement of equipment for milk production, dairy cows
and goats and training of beneficiaries in the care of the animal particularly on grazing, milk extraction, preservation or storage and the making of other dairy products.
• Swine weaning production for dispersal and fattening – Involves the dispersal of piglets for fattening to deserving beneficiaries/constituents of Naga City.
• Cutflower Production Project - Involves the enhancement of cutflower production by giving producers access to appropriate technology through the City Agriculturist Office.
• Establishment of Livestock Auction – Involves the establishment of a Livestock Auction Market within the existing slaughter house compound which shall serve as the center of livestock trading activities.
SUBSECTOR: Tourism Goals • Be globally competitive vis-à-vis major tourism destinations in the world • Promote Naga as a premier tourist destination to encourage tourist arrivals, brand Naga as a
center for culture, arts and education; and, solicit support for the improvement of tourism services.
• Improve Tourist Destinations • Increase support for tourism infra and facilities; solicit support both from the private and
national government agencies for its development and improvement • Collaborate and coordinate with both private and public, national and local agencies for inter-
agency partnership in the promotion of tourism • Evaluate and allocate tourism areas in line with R.A. 7079 • Promote Bikol Culture as primary tourism product and activity Objectives and Targets • To engender an agro-ecotourism friendly ambience that shall advance, promote and develop
tourism as a viable and sustainable socio-economic activity in the city • To generate employment opportunities and increased productive undertakings without
sacrificing the moral values of the community • To ensure the recognition of the city as a world class and leading agro-ecotourism destination
where foreign and domestic tourists and visitors alike are assured with a safe, convenient and pleasurable stay
• To assist the creation of a solid and dynamic government-private entities-non government organizations synergy
Strategies • Develop/promote tourist attractions • Establish tourist trade center • Redirect focus of barangay officials to tourism activities

35
• Compromise with residents to allow opening of tourism activities as a leverage for more funds and investments
• Encourage barangay officials to initiate/be involved in tourism activities Programs and Projects • Naga River Rehabilitation Project • Malabsay Falls Ecology Park • Transport Sector Tourism Education Project Proposed Legislations • An ordinance regulating development along Naga River • An ordinance requiring the beautification/improvement of Malabsay Falls Ecology Park • An ordinance requiring the transport sector to undergo basic tourism education. • An ordinance prohibiting the destruction of historical buildings as well as preserving its
historical value • An ordinance prescribing the rules for the use and maintenance of Plaza Rizal and penalizing
violations thereof. Project Ideas • Naga River Rehabilitation Project – An urban governance initiative to revitalize the Naga
River through physical rehabilitation, water pollution control and greenway development • Malabsay Falls Ecology Park - Involves the beautification/improvement and construction of
tourism-related facilities at the Malabsay Falls in barangay Panaceas • Transport Sector Tourism Education Project – Involves training/education on tourism
destinations/ethics and values formation for the transport sector particularly the drivers. SUBSECTOR: Commerce and Industry Goals • Be strongly competitive with other fast growing cities (Cebu, Davao, etc.) in the Philippines as
a destination • Increased income and employment • Growth of local micro and small enterprises Objectives and Targets • To develop the city’s industrial potential • To encourage product and market development for micro and small enterprises • To attain the realization of the “waste-to-energy” facility in Naga • To encourage commercial land development that is compatible and complementary to
neighboring areas Strategies • Utilize “Build-Operate-and-Transfer”(BOT) schemes in exploring alternative energy sources • Maximize/optimize/maintain present infrastructure • Review and amend Investment Code, with provision on Corporate Social Responsibility
(CSR) • Provision of job opportunities through industries • Require all industries to put their own anti-pollution services Programs and Projects • Infrastructure Support for Investment Incentive Program (INVEST) • One Stop Shop Business Assistance Center • Establishment of a Metalcraft Village

36
Proposed Legislations • An ordinance mandating the organization and management of ONE BARANGAY ONE
PRODUCT (OBOP) in the City of Naga and providing funds thereof. • An ordinance providing funds infrastructure facilities to new establishments as part of the
business incentive program of the city. • An ordinance involving the establishment of a Metalcraft Village that will be a common
service facility and procurement center to all those engaged in metalcraft business. Project Ideas • Infrastructure Support for Investment Incentive Program (INVEST) – A yearly infrastructure
program that provides infrastructure facilities to new establishments as part of the business incentive program of the city.
• One Stop Shop Business Assistance Center – Involves the establishment of a center as frontline services for business assistance and information to interested investors in Naga City.
• Establishment of a Metalcraft Village - Involves the establishment of a common service facility and procurement center to all those engaged in metalcraft business.
INFRASTRUCTURE AND PHYSICAL DEVELOPMENT Introduction This component deals with the transportation and utilities development program which involves the opening of new roads and bridges to open up new urban expansion areas or new growth centers, as well as the development and expansion of communication, water and power projects. Naga City, having a vibrant land and air transportation industry, also takes pride in having major telecommunication companies that provide services at par with international standards. SUBSECTOR: Transportation Goals • Provision of efficient and adequate road system for easy movement of people, services and
goods. Objectives and Targets • To improve and expand/widen existing road network and linkages to major economic areas; • To open up new roads that will hasten economic, agricultural, industrial and tourism
development. • To decongest CBD I and II • To save lives and properties Strategies • Eradicate “padyaks” along national roads • Minimize/regulate trimobiles • Make zero “habal-habal” in Naga • Stop issuance of new franchise • Strict implementation of existing laws and ordinances (no “padyaks” allowed on national
roads) • Strict enforcement of existing PDs and city ordinance • No more than one rider at the back of driver • Ordinance to make a common design for trimobiles for hire and also one for private use • Limit number of passengers • Ordinance increasing penalty for violators on refusal to convey passengers (operators and
drivers)

37
• Ordinance prohibiting use of “habal-habal” • Monitor motorcycles with ‘FOR REGISTRATION” plates • Ordinance on no riders below seven years old • Remove helmet in city roads • No 24-hour parking on roadsides • Construction of additional circumferential roads • Ordinance on creating taxi lanes at CBD I • Roadsides should not be used as terminal • No sidewalk vendors at CBD I • Designate loading and unloading areas, in at least one road strip (adopt the Singapore traffic
program) • Construction of additional circumferential roads • Regulate the number and use of “padyaks” in the city. • Strict enforcement of traffic ordinances. • Regulate sidewalk vendors • Create pedestrian malls/open air commercial area, ex. BUGIS street in Singapore • Require all future commercial and industrial building owners to provide off-street parking for
their customers • Open-up new jeepney routes to minimize traffic congestion along major streets • Gradual phase-out of trimobiles and "padyaks" along major roads • Enter into financing agreements for infrastructure projects with external funding sources • Rehabilitation of bridges • Adoption of Bus Rapid Transit (BRT) • Implement volume reduction program for tricycles • Push on the adoption of Green Walk at Mayon, Panganiban, Magsaysay and Penafrancia
Avenues, etc. • Strict implementation of Jaywalking ordinance, Task Force ordinance, etc. Programs and Projects • Widening of Magsaysay Avenue (Penafrancia-Bagumbayan) • Concreting of Calauag (Villa Karangahan)-San Felipe Road • Concreting of Concepcion Grande (Ramaida Village)-Balatas Road • Concreting of Leon Aureus (Gimenez Subdivision)-Balatas Road • Construction of Dinaga-Lerma Bridge • Volume Reduction Program • Implementation/Enforcement of existing ordinances, laws Proposed Legislations • Ordinance to make a common design for trimobiles for hire and also one for private use • Ordinance increasing penalty for violators on refusal to convey passengers (operators and
drivers) • Ordinance prohibiting use of “habal-habal” • Ordinance prohibiting motorcycle riders below seven years old • Ordinance creating taxi lanes at CBD I • Ordinance adopting of Green Walk at CBD I Project Ideas • Magsaysay and Roxas Avenue (Diversion-Bagumbayan). Widening of certain road
sections to upgrade them to four-lane highway • Villa Karangahan)-San Felipe Road. Road opening and concreting, connecting Calauag
and San Felipe. • Concepcion Grande (Ramaida Village)-Balatas Road. Road opening and concreting to link
Balatas to Concepcion Grande.
38
• Leon Aureus (Gimenez Subdivision)-Balatas Road. Completion of key road construction project connecting Balatas Road and Magsaysay Avenue, via Leon Aureus Street.
• Dinaga-Lerma Bridge-Bridge. New bridge construction linking CBD I and II. • Volume Reduction Program. Implementation of schemes to reduce the volume of vehicles
plying city roads. SUBSECTOR: Communication Goals • Continuous upgrading of communication system in Naga City Objectives and Targets • To provide efficient service with improved facilities • To minimize interconnection problems between telecommunication companies. Strategies • Digitalization of TV/media/maximize use of bandwidths • Wireless technology/underground • Wi-fi zone Naga • Promotion of digital technology/incentive • Promotion of wireless technology/incentive • Promote wi-fi technology/provide incentives/all government establishments wi-fi zone • Availability of data of telephone companies • Encourage other communication companies to operate in the city. • Coordination of all telecommunication companies. Programs and Projects • Installation of new telephone lines • Upgrading and rehabilitation of existing telephone lines • Introduction of new services and products • Underground connection of telephone lines Proposed Legislation • Ordinance mandating the underground installation of lines Project Ideas • Installation of new telephone lines. Involves the of additional telephone capacity in the
entire city in the event demand outstrips supply. • Rehabilitation of existing telephone lines. Involves the upgrading and repair of existing
telephone lines in the entire city • New products and services. Involves the introduction of new telecommunication products
and services that will meet changing market demands. • Underground telephone, cable and power lines. Involves the installation of underground
lines at CBD II. SUBSECTOR: Water Goals • Provision of adequate and potable water supply for domestic and industrial use. Objectives and Targets • To efficiently distribute potable water to the various barangays within the city. • To increase the water supply proportionately with the increase of the population of the city. • To increase number of service connections.
39
Strategies • Continuous monitoring of water system • Ensure a well-managed water system • Continuing investment in additional capacity (supply) • Reduce system loss (NRW) to 20% or below (demand side) • Ensure high level of water quality • Protect the site/water source • Restore MNWD or LGU deputization over private well extraction • Implementation of the MOA turning over management to MNWD • Install 1-2 additional pumping stations per year • Replace 3 kms. of old lines over the next ten years (lower pilferage) • Require cistern tank from all buildings/establishments with booster pump (quality) • Maintenance/protection of Naga River/Mt. Isarog Watershed • Improve financial management, personnel and general services. • Improve billing collection, customer services and control water pilferage. • Construction of additional water sources and other facilities for water system expansion. • Effective development and protection of the MNWD production area watershed. • Effective operation and maintenance of the system. • Ensure water quality and supply. • Repair/Rehabilitation of existing water pumps. Programs and Projects • Water Source Development • Service Area/Distribution Line Extension • Construction of Dam and Treatment Plant • Construction of Pumping Stations • Installation of Shallow Wells Proposed Legislation Project Ideas • Water Source Development. Involves the installation of transmission lines, construction of
pump house and transformer platform, perimeter fence, drilling of exploratory/production well, construction of concrete ground reservoir, booster pump house, etc.
• Service Area/Distribution Line Extension. Installation of additional pipelines to meet demands in additional service area
• Dam and Water Treatment Plant. Construction of Dam and Treatment Plant • Pumping Stations. Construction of additional pumping stations at various strategic locations. • Installation of Shallow Wells. Installation of shallow wells, especially in low-income
households in Naga with no access to potable water. SUBSECTOR: Power Goals • Provision of sufficient, quality and accessible electric power services. Objectives and Targets • To provide adequate, clean and quality power sufficient to meet the growing demands of the
city • To reduce to the minimum the rate per kilowatt of electricity. • To minimize systems loss

40
Strategies • Advocate for reasonable power rate that will attract investments • Develop other options for other power suppliers aside from CASURECO II • Identify and develop local power sources • Improve/expand mini-hydro power plant • Pursue Waste to energy Project • Aggregate power requirement of the city and look for efficient provider • Maximize use of existing renewable sources or energy (solar for street lights and government
offices) • Privatization of the cooperative • Restructuring of the cooperative • Implement aggregation – more competitive in the distribution of power • Encourage the development of local power resources. • Organize a task force to study local power generation viability. • Tap the resources of non-government technical organization available locally. • Explore the possibility of developing power resources. • Identify from among the cost components, items that would tend to reduce power rate. • Develop technology on local power generation. • Tap existing foreign and local entities for fund sourcing through Build Operate Transfer • Build Operate Own (BOT/BOO) schemes. • Identify areas to be energized especially those with approved housing programs. • Impose power disconnection to LGUs, residential and commercial establishments with unpaid
bills Programs and Projects • Power Connection Expansion Program • Rehabilitation/Revamp of Power Lines • Rehabilitation/Upgrading of Power Lines • Electrical Power Add-Ons • Logistic Support • Underground Connection of Electric Lines Proposed Legislation • Ordinance mandating the underground installation of lines in new business
districts/commercial areas Project Ideas • Power Connection Expansion Program. The extension of power lines to meet
new/unserviced areas of the city • Rehabilitation of Existing Power Lines. Repair and upgrading of existing power lines by
replacing various line materials and hardware to meet additional capacity and reduce system loss.
• Electrical Power Add-Ons. Involves the installation of service drop wires and meters to fully provide electric power service.
• Logistic Support. The provision of support facilities, vehicles and communication equipment • Underground Electric Line Connections. Involves the installation of underground power
connection at CBD II and other future growth areas of the city. ENVIRONMENTAL Introduction This sector consolidates the environmental implications of all development programs and projects within the city and provides mitigating and preventive measures for their anticipated impacts. It

41
embodies initiatives for maintaining cleanliness of air, water and land resources and rehabilitating or preserving the quality of natural resources to enable them to support the requirements of economic development and ecological balance across generations.
Goals • Solid waste management – Improve the waste disposal system in the city and promote and
implement RA 9003 particularly cleanliness, orderliness, waste reduction and waste diversion.
• General water quality – Improve the drainage and sewerage system in the city, improve the condition of the Naga River ,
• General air quality – Achieve “Good” Ambient Air Quality. • Environmentally constrained areas – Improve the condition of the environmentally
constrained areas.
Objectives and Targets 1. Solid waste management
• To keep the streets, sidewalks, gutters, vacant lots, canals, esteros and river free from garbage;
• To reduce waste that will require disposal; • To provide adequate collection services to all the barangays and 95% of the population • To keep collection vehicles roadworthy all the time; the physical appearance of the
collection vehicles clean and pleasing. • To divert at least 40% of waste by 2017; • To rehabilitate the Balatas dumpsite according to the requirements of the law; • To improve the organization in-charge of solid waste management; • To provide continuing capability building opportunities to all the solid waste management
personnel; • To actively enforce regulations on solid waste management.
2. General water quality • To conserve and protect the watershed area of the city • To upgrade the quality of water through the installation of anti-pollution devices in
industrial establishments • To minimize dumping of solid and liquid wastes into the Naga River
3. General air quality • To achieve in the next three years “Good” Ambient Air and maintain that condition for the
rest of the planning period 4. Environmentally constrained areas
• To address the problem of flooding through construction of adequate drainage system by 2013
• To increase awareness of the residents with regards to disaster preparedness • To reduce illegal construction of structures through proper implementation of city zoning
ordinances
Strategies 1. Solid Waste Management
• Placement of billboards at strategic areas in the city showing proper waste disposal practices
• Encourage waste segregation at source • Giving of citation/awards/incentives to model schools/barangays/households/individuals • Police power to concerned agencies / citizen arrest • Conduct research on leachate generation • Efficient collection and disposal of wastes • Encourage the practice of recycling • Efficient Monitoring and Evaluation
42
2. General Water Quality • Combine drainage and sewerage system • Riverbank stabilization to control water run-off • Establishment of Water Treatment Facility by MNWD and commercial / industrial
establishments • Implement Septage Ordinance • MOA between LGU Naga/MNWD/DENR relative to the co-management of Mt. Isarog
Natural Park • Regulate water extraction by getting permit to water extract from MNWD • LGU Naga to assist in monitoring various underground sources - almost 50% of which
have no permit 3. General Air Quality
• Immediate transfer of the Air Quality Monitoring Station • Strict implementation of the Emission Testing of Vehicles for Registration (LTO/PETC) • Operationalize the Naga City Anti-Smoke Belching Unit (NASBU) • Procure the required machines for the Emission Testing (Gas Analyzer and Opacimeter) • Implement Local Ordinance penalizing violators • Conduct of massive tree planting and Information and Education Campaign • Sustained Activities/Programs of the Naga City Airshed Board • Close monitoring of local transport sector towards the eventual phase-out of 2-stroke
vehicles and prohibition of R12 (freons) • Strengthen partnership with private sector
4. Environmentally constrained areas • Proper implementation of Disaster Preparedness measures and policies • Strengthen monitoring of illegal construction
Programs and Projects • Finalization of the Comprehensive Solid Waste Management Plan • Establishment of a sanitary and controlled dumpsite • Waste to Energy Project • Sustained pollution prevention and control by households, commercial establishments and
institutions • Watershed vegetative cover restoration and maintenance • Physical rehabilitationof Naga River and waterways • Naga River Revitalization Project Proposed Legislations • Ordinance establishing a Septage Management System in the City of Naga. Septage
Management refers to the comprehensive programs for managing septic tanks and the procedures for desludging, transportation, treatment and disposal of septic tank contents. Improper handling of septage may lead to environmental damage and severe impacts to public health. For these reasons, septage management activities within Naga City shall be highly regulated by the city government.
Project Ideas of Project Briefs/Profiles • Naga River Revitalization Project
o Physical Rehabilitation – built around Naga Riverwalk fro Magsaysay Bridge to its mouth in Tabuco; 1.5 km. one-lane green river walk on both banks.
o Water pollution control – introduction of wastewater treatment within project area. Provides treatment facilities in key outfalls of existing drainage system.
o Greenway development – City wide network of public corridors that interconnect CBD I, CBD 2, and government and educational facilities.
o Construction of a mini dam to control the flow of water downstream.

43
INSTITUTIONAL Introduction This focuses on strengthening the capability of the local government bureaucracy as well as elcted officials to plan and manage the development of the city. Manpower development, fiscal management and program/project development are the vital components of this sectoral plan. This sectoral plan likewise promotes the involvement of voluntary groups of civil society orgainzations in the preparation, implementation, monitoring and evaluation of the different sectoral programs, projects and activities. Goals • Develop an efficient and effective city administration responsive to the needs of its
constituents • Be the top Sangguniang Panlungsod in the Philippines in a consistent basis • Institutionalize a model development planning regime, with strong stakeholder participation
as key feature, for the Philippines consistent with national and international standards • Ensure that the completed program/project management cycle is fully implemented in the city • Determination of actual number of business establishments and their gross receipts. 90%
collection of tax base • Maximize debt financing, minimize debt servicing cost • Reduce gov’t subsidy, reduce operating cost, raise operating revenue, improve services • Projects which match NGA priorities be funded thru transfers • Increase projects funded thru grants and liberalized credit facilities Objectives and Targets • To prepare and implement a continuing program of systematic improvement in operating
procedures or methods in the whole system of orgainization • To prepare and administer a continuing program of training to improve employees job
performance. • To intensify collection of city revenues • To adopt policies on cost consciousness and cost effectiveness. • To maintain quality service at the optimum level regardless of whoever assumes the rein of
governance. Strategies LOCAL LEGISLATION AND DEVELOPMENT PLANNING • Develop, implement effective tracking of local legislation (status of resolutions, execution of
ordinances o Regularize meetings of the local Executive-Legislative Council o Pursue, complete codification of existing ordinances by category, incl. Code of
General Ordinances • Pursue, complete computerization of Sangguniang Panlungsod processes and services
o Establish SP’s own dedicated website linked to www.naga.gov.ph: features legislative tracking, minutes of meetings, schedule of public hearings and consultations, searchable database of local legislation, wiki-type legislation formulation and development
• Establish, operationalize Naga City’s own Legislative Building • Promote more participative, empowered City Hall departments, especially in developing their
own PPAs • Strengthen annual State of the City Reporting by adding the Annual Legislature Report (by
the Vice Mayor), and departmental reports (by cluster before the appropriate SP committee) – with the approved CDP, CDIP and AIPs as key reference documents

44
• Institutionalize semestral NCPC-PMC-City Budget Office monitoring of departmental plans, programs and activities – with the approved CDP, CDIP and AIPs as key reference documents
• Promote the development of departmental websites to strengthen reporting and monitoring • Promote regular evaluation of local programs, projects and activities – to be coordinated by
the NCPC in partnership with members from the academe HUMAN RESOURCE MANAGEMENT AND CUSTOMER SERVICE • Increase income of city thru revenue generation (RPT, Bus. Tax other fees collection) • Increase productive & qualified employees (permanent) • Install/Establish computerized system • Fill-up permanent positions (vacant) to reduce hiring of casuals • Establish linkages with other schools & universities for OJTs • Position streamlining • Creation of new jobs • Establish year-round one stop shop • Establish information desk manned regularly by knowledgeable personnel • Install directory of city hall offices • Incentives program REVENUE GENERATION AND RESOURCE ALLOCATION • Target 50% of 25% for tax campaign within the next 3 years • Create a debt management unit to tap opportunities to reduce debt service cost • Match LDIP projects with donor priorities • Strengthen project packaging capacity of staff • Leverage city’s reputation in tapping donor Programs and Projects • Updating of the CLUP • Community Based Monitoring System • Codification of General Ordinances • Revisit “PSEP” • Tax Mapping Proposed Legislations • Ordinance mandating that at least 50% of the city’s Real Property Tax collection shall be
reinvested in capital expenditure projects to promote continuous wealth creation in Naga City • Resolution mandating the conduct of a study on the continuing viability of existing component
barangays of Naga, particularly those with consistently contracting population, with the end view of merging small and splitting larger barangays of the city
• Ordinance Amending Last Paragraph of Section 4, Section 5, Section 6 and First Paragraph of Section 19 of Ordinace 95-092 otherwise known as the Empowerment Ordinance of Naga City
Chapter 4 Local Development Investment Program Based on Chapter 3, this chapter draws up a 10-year local development investment program (LDIP) containing a list of sectoral programs and projects in support of the City Development Plan. Essentially, the LDIP aims to help realize the “Maogmang Naga” vision, especially on the four cross-sectoral challenges identified in the PGS Roadmap:
1. reducing poverty incidence 2. improving access to basic services 3. enhancing quality of life thru livable communities, and 4. promoting good governance and responsible citizenship.
Fundamentally, the program consists of either new projects or expansion of existing initiatives aimed at addressing the development indicators in the vision-reality gap analysis. Thus, it assumes that spending on current programs, projects and activities in the 2010 and previous year budgets that are delivering the current indicators shall be maintained. Moreover, another key feature of the program is its responsiveness to the projected increase in Naga’s population; consequently, the various population-indexed socio-economic initiatives it contains have been adjusted to meet the additional requirements that more people brings to society. Sectoral Investments By sector, the LDIP will comprise of the following priority undertakings: SOCIAL To promote social development, the following priority programs and projects shall be pursued: • Universal Preschool Coverage. This calls for the establishment of 25 additional Educare centers
over the next five years (on top of the existing 73), and the hiring of the required teaching staff that will run these centers. Together with the expected expansion of both DepEd and private schools, this will put the city in a good position to attain 100% participation rate by 2015.
• Nutri-Dunong. This involves the expansion of the existing program to cover all school children coming from the 20% low-income households living below poverty line. This will put the city in a good position to eliminate grade school malnutrition by 2015.
• QUEEN and QUEEN Plus. This, on the other hand, calls for the expansion of the existing QUEEN initiatives of the city government aimed at ensuring that school children will stay in school, thereby addressing the city’s problems on cohort survival and completion. It adopts the ASSRC self-rated poverty line as benchmark, thus targeting the lower 61% of the city household population for coverage of the subsidized school fees, school supplies and rice incentives being extended to beneficiaries.
• Summer Enrichment. Similar to the QUEEN initiatives, this calls for the regular conduct of summer enrichment classes for school children belonging to the lower 61% of the city’s household population, aimed at preparing them for and improving their academic performance during the regular school year.
• Tertiary Scholarship Program. This involves the progressive expansion of the city’s Iskolar kan Ciudad program, targeting the city’s college-going population (aged 17-24, which accounts for around 11% of the total city population). By offering access to college and technical-vocational programmes under a study-now-pay-later scheme, the city – in concert with other existing scholarship programmes – should be able to raise the percentage of its population with post-secondary degrees from 25 to 50% by the end of the planning period.
• Development of Public Tertiary Institutions. Side by side the above, the city government shall also progressively invest in developing its capability to offer both college and tech-voc programmes, anchored on the establishment of the Naga City TechVoc Academy and the

46
expansion of the Camarines Sur Community College (which should be renamed Naga City Community College, catering exclusively to city residents).
• Upgrading of the Naga City Hospital to Secondary. This involves adding additional bed capacity to the primary-level Naga City Hospital, and its upgrading into a full-fledged secondary hospital by adding a surgery unit, including complementary staff. This will also put the city hospital in a better position to provide subsidized full-service hospital care to low-income families in Naga.
• PhilHealth Coverage. This initiative relies on national government funding to provide coverage to the lowest 12% of the city household population (half of the higher end of official data on poverty incidence in Naga) by 2013 and beyond. In case it is not made available, the city will focus on strengthening its Naga City Hospital-based health service provision.
• Upgrading Social Housing Capability. This involves upgrading of the Urban Poor Affairs Office (UPAO) into a department-level Housing and Settlements Development Office (HSDO), strict delimitation of program coverage only to the lower 23% of the city’s household population who are living in poverty, and additional infusion of capital for social housing development starting in 2016 when existing number of beneficiaries exceed this baseline due to population growth.
Over the next 10 years, it will require a total of P1.49 billion to implement these programs and projects, of which P860.9 million (52%) will be put up by the city government, with the balance (P628.9 or 48%) to be sourced from the national government. These are detailed in the table below.
Table 9
SOCIAL SECTOR INVESTMENT PROGRAM, 2011-20 In Million Pesos
Programs/Projects Total Requirements
CGN* NGP* Private/ External
Universal Preschool Coverage Physical Plant - 25 new DCCs 20.0 20.0 Staff 34.2 34.2
Nutri-Dunong Feeding Program 80.8 60.6 20.2
QUEEN Pupil Retention Program 154.1 154.1
Summer Enrichment 15.4 15.4
Tertiary Scholarship Program College 135.7 135.7 Techvoc 30.5 30.5
City Tertiary Institutions Naga City TechVoc Academy 32.0 32.0 Expansion of Naga City Community College 28.0 28.0
Conversion of NCH to Secondary Infra - Additional Capacity 5.0 5.0 Additional Staff 32.5 32.5
PhilHealth Coverage Poorest of the Poor 608.7 608.7
Upgrading of Social Housing Capability Conversion of UPAO to HSDO 35.0 35.0 Social Housing (KsK Settlement Development) 277.9 277.9 Subtotals 1,490.2 860.9 628.9 CGN – City Government of Naga; NGP – National Government of the Philippines ECONOMIC To sustain and speed up economic development in Naga, three priority programs and projects will be implemented during the planning period:
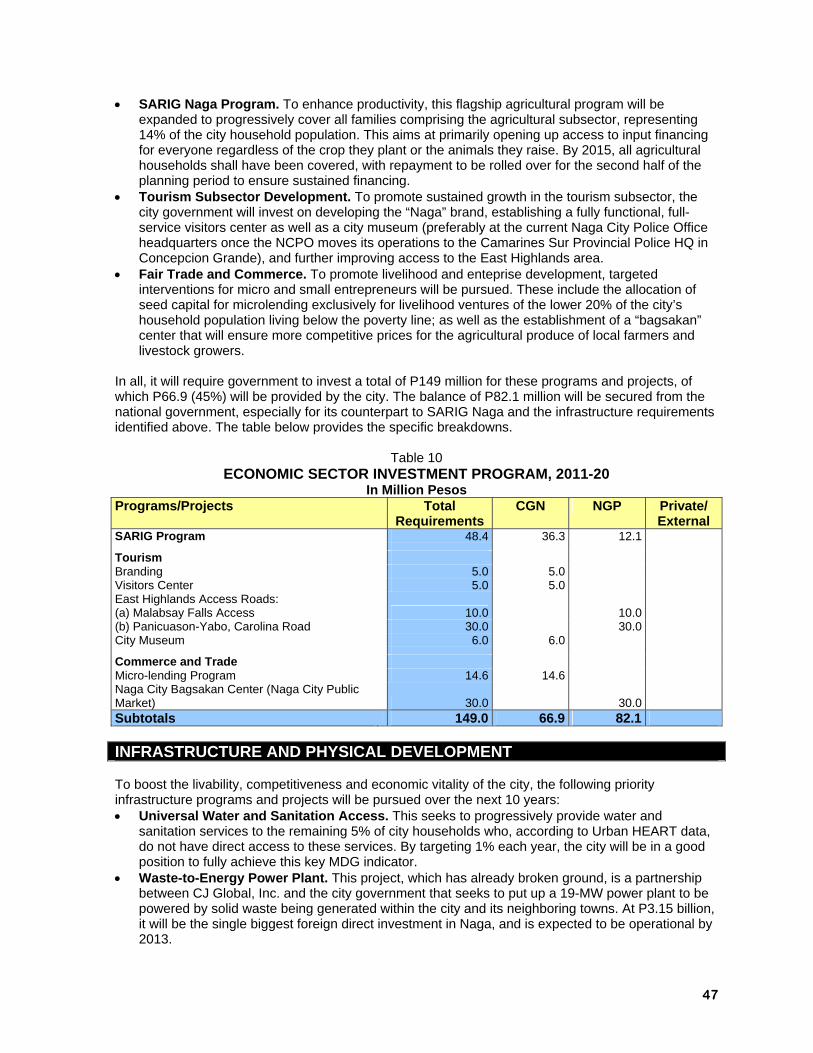
47
• SARIG Naga Program. To enhance productivity, this flagship agricultural program will be expanded to progressively cover all families comprising the agricultural subsector, representing 14% of the city household population. This aims at primarily opening up access to input financing for everyone regardless of the crop they plant or the animals they raise. By 2015, all agricultural households shall have been covered, with repayment to be rolled over for the second half of the planning period to ensure sustained financing.
• Tourism Subsector Development. To promote sustained growth in the tourism subsector, the city government will invest on developing the “Naga” brand, establishing a fully functional, full-service visitors center as well as a city museum (preferably at the current Naga City Police Office headquarters once the NCPO moves its operations to the Camarines Sur Provincial Police HQ in Concepcion Grande), and further improving access to the East Highlands area.
• Fair Trade and Commerce. To promote livelihood and enteprise development, targeted interventions for micro and small entrepreneurs will be pursued. These include the allocation of seed capital for microlending exclusively for livelihood ventures of the lower 20% of the city’s household population living below the poverty line; as well as the establishment of a “bagsakan” center that will ensure more competitive prices for the agricultural produce of local farmers and livestock growers.
In all, it will require government to invest a total of P149 million for these programs and projects, of which P66.9 (45%) will be provided by the city. The balance of P82.1 million will be secured from the national government, especially for its counterpart to SARIG Naga and the infrastructure requirements identified above. The table below provides the specific breakdowns.
Table 10 ECONOMIC SECTOR INVESTMENT PROGRAM, 2011-20
In Million Pesos Programs/Projects Total
Requirements CGN NGP Private/
External SARIG Program 48.4 36.3 12.1
Tourism Branding 5.0 5.0 Visitors Center 5.0 5.0 East Highlands Access Roads: (a) Malabsay Falls Access 10.0 10.0 (b) Panicuason-Yabo, Carolina Road 30.0 30.0 City Museum 6.0 6.0
Commerce and Trade Micro-lending Program 14.6 14.6 Naga City Bagsakan Center (Naga City Public Market) 30.0 30.0 Subtotals 149.0 66.9 82.1 INFRASTRUCTURE AND PHYSICAL DEVELOPMENT To boost the livability, competitiveness and economic vitality of the city, the following priority infrastructure programs and projects will be pursued over the next 10 years: • Universal Water and Sanitation Access. This seeks to progressively provide water and
sanitation services to the remaining 5% of city households who, according to Urban HEART data, do not have direct access to these services. By targeting 1% each year, the city will be in a good position to fully achieve this key MDG indicator.
• Waste-to-Energy Power Plant. This project, which has already broken ground, is a partnership between CJ Global, Inc. and the city government that seeks to put up a 19-MW power plant to be powered by solid waste being generated within the city and its neighboring towns. At P3.15 billion, it will be the single biggest foreign direct investment in Naga, and is expected to be operational by 2013.

48
• Electric Power Aggregation. This seeks to encourage private investors to operationalize electric power aggregation in Naga City, an innovation under the EPIRA Law, thereby introducing competition in the retail of electricity in local markets.
• CBD I Urban Renewal. This involves the continuing revitalization of Centro Naga, and will be anchored on the provision of adequate quality parking services in strategic sites within the district, as well as the construction of pedestrian bridges that will enhance connectivity between CBD I and its adjacent areas.
• Enhanced Trunk Roads. This involves the widening of key trunk arteries of the existing road network, specifically road links along Magsaysay Avenue (i.e. Melchor Villanueva Street) and Roxas Avenue (more popularly known as Diversion Road). This lays down the groundworks for a four-lane trunk route that will allow dedicated lanes for public transport conveyances.
• Circumference Road 2 (C-2). This involves the construction of three new road links and a bridge – with a combined length of around 2 kms connecting Barangays Calauag, San Felipe, Balatas, Concepcion Pequena, Tabuco and Mabulo – that will comprise the Naga City section of its second circumferential or ring road. (See Fig. 11.)
• New Road Links. These are projects that seek to enhance radial and circumferential connectivities between key areas of the city, as well as with its neighboring towns. They include CBD I and II, especially through the PNR property between Lerma and Triangulo; Concepcion Grande (via Ramaida Village) and Balatas; completion of the Maogmang GK-Leon Aureus Road connection; and a new roadlink between Upper Pacol and Carangcang, Magarao.
• Naga River Revitalization Project. This flagship project seeks to implement three strategies to raise Naga River’s water quality rating from C to B+ by 2015, and finally to A by 2020: (a) physical rehabilitation through the construction of a Riverwalk on both banks; (2) water pollution control through the introduction of wastewater treatment in the area; and (3) greenway development through the establishment of a citywide network of public corridors that interconnect CBD I, CBD II and government and educational facilities.
• BRT Study. This feasibility seeks to determine the optimal configuration of the local transport system in Naga that would raise service quality and financial viability, in process encouraging residents to shift from private to public transportation.
• Bicol Riverfront Development and Flood Control Project. This seeks to accelerate the development of the South CBD II area, anchored on the establishment of flood control structures, public walkways and a river park in the Bicol Riverfront area along Barangay Tabuco. At the same time, the construction of the Naga South District Market and complementary medium-rise housing within the area will anchor this planned development. (See Fig. 11.)
The table below details these priority infrastructure programs and projects, which will require total capital expenditures amounting to P4.8 billion. The private sector and donor agencies are expected to contribute the bulk of these funding requirements in the amount of P3.5 billion or 74% of the total. The balance will be shared between the city (P785.7 billion or 17%) and national governments (P437.4 million or 9%).
Table 11 INFRASTRUCTURE SECTOR INVESTMENT PROGRAM, 2011-20
In Million Pesos Programs/Projects Total
RequirementsCGN NGP Private/
External Water Services Universal access to WatSan Services 17.3 17.3
Power Waste-to-Energy Power Plant 3,150.0 3,150.0 Retail Energy Aggregation 70.0 70.0
Urban Development CBD I Urban Renewal Parking Facility and CBD I Upgrading 130.0 130.0 Pedestrian Bridges (2 units) 50.0 50.0

49
Enhanced Road Links Widening, Maysaysay-Roxas Avenue 21.3 21.3
C-2 Network Calauag (Villa Karangahan)-San Felipe, 1.032 km 5.2 5.2 Balatas-Concepcion Road, 0.987 km 4.9 4.9 Almeda Highway-Mabolo Bypass, 2.099 km 10.5 10.5 RROW acquisition (3 road links) 30.9 30.9 New Tabuco-Mabulo Bridge 150.0 150.0
New Road Links Enhanced CBD 1 & 2 connectivity 7.5 7.5 Concepcion Grande (Ramaida Village)-Balatas 6.0 6.0 Maogmang GK-Leon Aureus Road 6.0 6.0 Upper Pacol-Carangcang Road 2.5 2.5
Naga River Revitalization Project 300.0 75.0 75.0 150.0
BRT Study 5.0 1.5 3.5
Bicol Riverfront Development and Flood Control Project Revetment and Flood Control Project 75.0 75.0 Naga City Riverpark 25.0 25.0 Naga South District Market (10000 sqm, 2 storey) 300.0 300.0 Medium-Rise Housing (7 units) 378.0 113.4 113.4 151.2 Subtotals 4,745.0 785.7 434.7 3,524.7 To be financed through borrowings
Figure 11. The Proposed C-2 and South CBD II Development. Legend: C-2 Roadlinks | South District Market | Medium-Rise Housing | River Park and Flood Control Structures
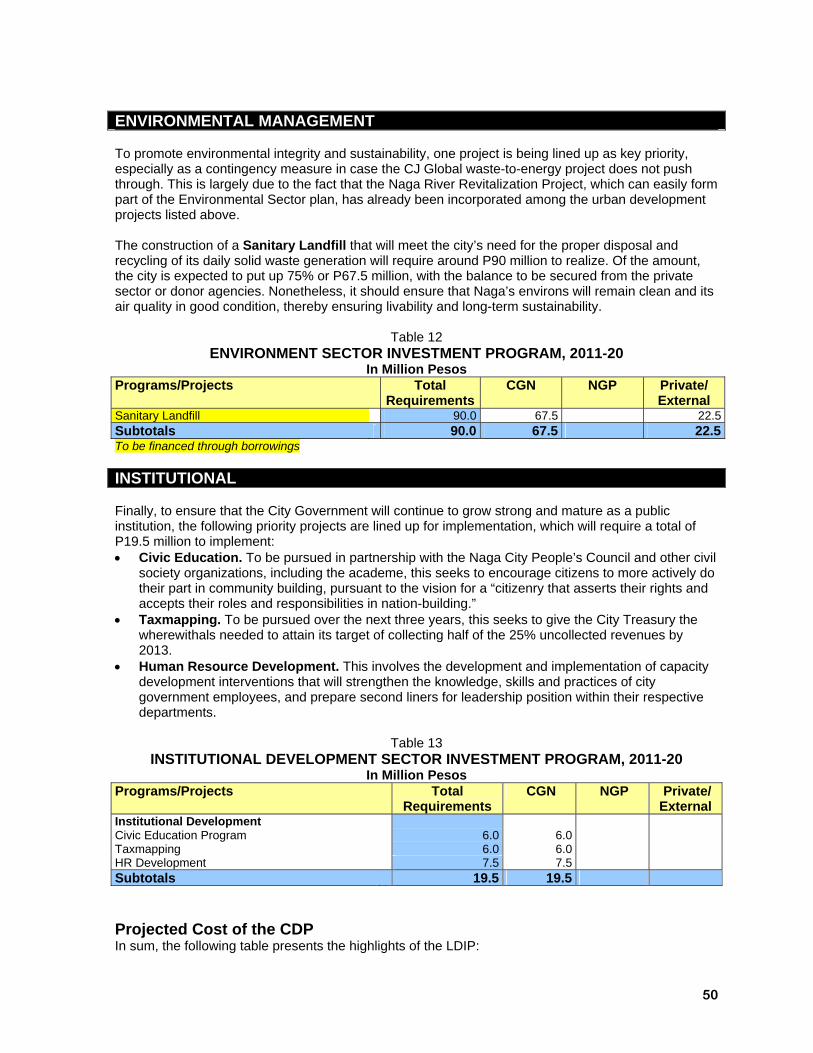
50
ENVIRONMENTAL MANAGEMENT To promote environmental integrity and sustainability, one project is being lined up as key priority, especially as a contingency measure in case the CJ Global waste-to-energy project does not push through. This is largely due to the fact that the Naga River Revitalization Project, which can easily form part of the Environmental Sector plan, has already been incorporated among the urban development projects listed above. The construction of a Sanitary Landfill that will meet the city’s need for the proper disposal and recycling of its daily solid waste generation will require around P90 million to realize. Of the amount, the city is expected to put up 75% or P67.5 million, with the balance to be secured from the private sector or donor agencies. Nonetheless, it should ensure that Naga’s environs will remain clean and its air quality in good condition, thereby ensuring livability and long-term sustainability.
Table 12 ENVIRONMENT SECTOR INVESTMENT PROGRAM, 2011-20
In Million Pesos Programs/Projects Total
RequirementsCGN NGP Private/
External Sanitary Landfill 90.0 67.5 22.5 Subtotals 90.0 67.5 22.5 To be financed through borrowings INSTITUTIONAL Finally, to ensure that the City Government will continue to grow strong and mature as a public institution, the following priority projects are lined up for implementation, which will require a total of P19.5 million to implement: • Civic Education. To be pursued in partnership with the Naga City People’s Council and other civil
society organizations, including the academe, this seeks to encourage citizens to more actively do their part in community building, pursuant to the vision for a “citizenry that asserts their rights and accepts their roles and responsibilities in nation-building.”
• Taxmapping. To be pursued over the next three years, this seeks to give the City Treasury the wherewithals needed to attain its target of collecting half of the 25% uncollected revenues by 2013.
• Human Resource Development. This involves the development and implementation of capacity development interventions that will strengthen the knowledge, skills and practices of city government employees, and prepare second liners for leadership position within their respective departments.
Table 13
INSTITUTIONAL DEVELOPMENT SECTOR INVESTMENT PROGRAM, 2011-20 In Million Pesos
Programs/Projects Total Requirements
CGN NGP Private/ External
Institutional Development Civic Education Program 6.0 6.0 Taxmapping 6.0 6.0 HR Development 7.5 7.5 Subtotals 19.5 19.5 Projected Cost of the CDP In sum, the following table presents the highlights of the LDIP:
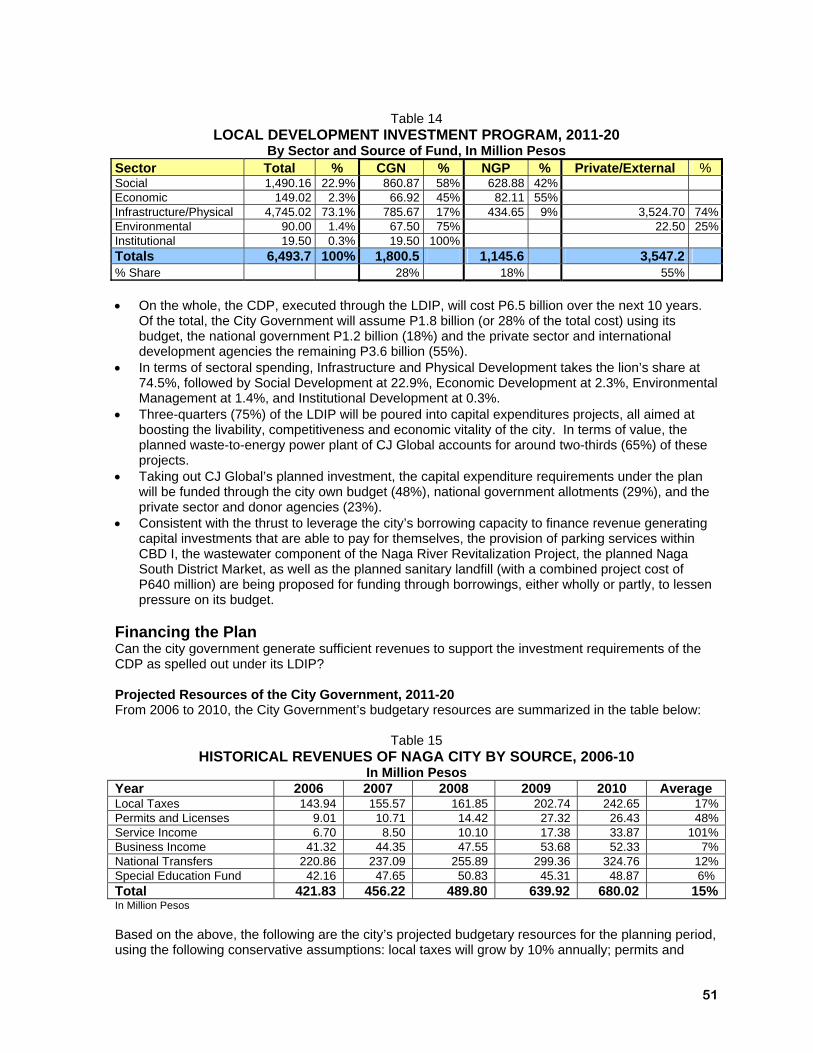
51
Table 14
LOCAL DEVELOPMENT INVESTMENT PROGRAM, 2011-20 By Sector and Source of Fund, In Million Pesos
Sector Total % CGN % NGP % Private/External % Social 1,490.16 22.9% 860.87 58% 628.88 42% Economic 149.02 2.3% 66.92 45% 82.11 55% Infrastructure/Physical 4,745.02 73.1% 785.67 17% 434.65 9% 3,524.70 74%Environmental 90.00 1.4% 67.50 75% 22.50 25%Institutional 19.50 0.3% 19.50 100% Totals 6,493.7 100% 1,800.5 1,145.6 3,547.2 % Share 28% 18% 55% • On the whole, the CDP, executed through the LDIP, will cost P6.5 billion over the next 10 years.
Of the total, the City Government will assume P1.8 billion (or 28% of the total cost) using its budget, the national government P1.2 billion (18%) and the private sector and international development agencies the remaining P3.6 billion (55%).
• In terms of sectoral spending, Infrastructure and Physical Development takes the lion’s share at 74.5%, followed by Social Development at 22.9%, Economic Development at 2.3%, Environmental Management at 1.4%, and Institutional Development at 0.3%.
• Three-quarters (75%) of the LDIP will be poured into capital expenditures projects, all aimed at boosting the livability, competitiveness and economic vitality of the city. In terms of value, the planned waste-to-energy power plant of CJ Global accounts for around two-thirds (65%) of these projects.
• Taking out CJ Global’s planned investment, the capital expenditure requirements under the plan will be funded through the city own budget (48%), national government allotments (29%), and the private sector and donor agencies (23%).
• Consistent with the thrust to leverage the city’s borrowing capacity to finance revenue generating capital investments that are able to pay for themselves, the provision of parking services within CBD I, the wastewater component of the Naga River Revitalization Project, the planned Naga South District Market, as well as the planned sanitary landfill (with a combined project cost of P640 million) are being proposed for funding through borrowings, either wholly or partly, to lessen pressure on its budget.
Financing the Plan Can the city government generate sufficient revenues to support the investment requirements of the CDP as spelled out under its LDIP? Projected Resources of the City Government, 2011-20 From 2006 to 2010, the City Government’s budgetary resources are summarized in the table below:
Table 15 HISTORICAL REVENUES OF NAGA CITY BY SOURCE, 2006-10
In Million Pesos Year 2006 2007 2008 2009 2010 Average Local Taxes 143.94 155.57 161.85 202.74 242.65 17% Permits and Licenses 9.01 10.71 14.42 27.32 26.43 48% Service Income 6.70 8.50 10.10 17.38 33.87 101% Business Income 41.32 44.35 47.55 53.68 52.33 7% National Transfers 220.86 237.09 255.89 299.36 324.76 12% Special Education Fund 42.16 47.65 50.83 45.31 48.87 6% Total 421.83 456.22 489.80 639.92 680.02 15%In Million Pesos Based on the above, the following are the city’s projected budgetary resources for the planning period, using the following conservative assumptions: local taxes will grow by 10% annually; permits and
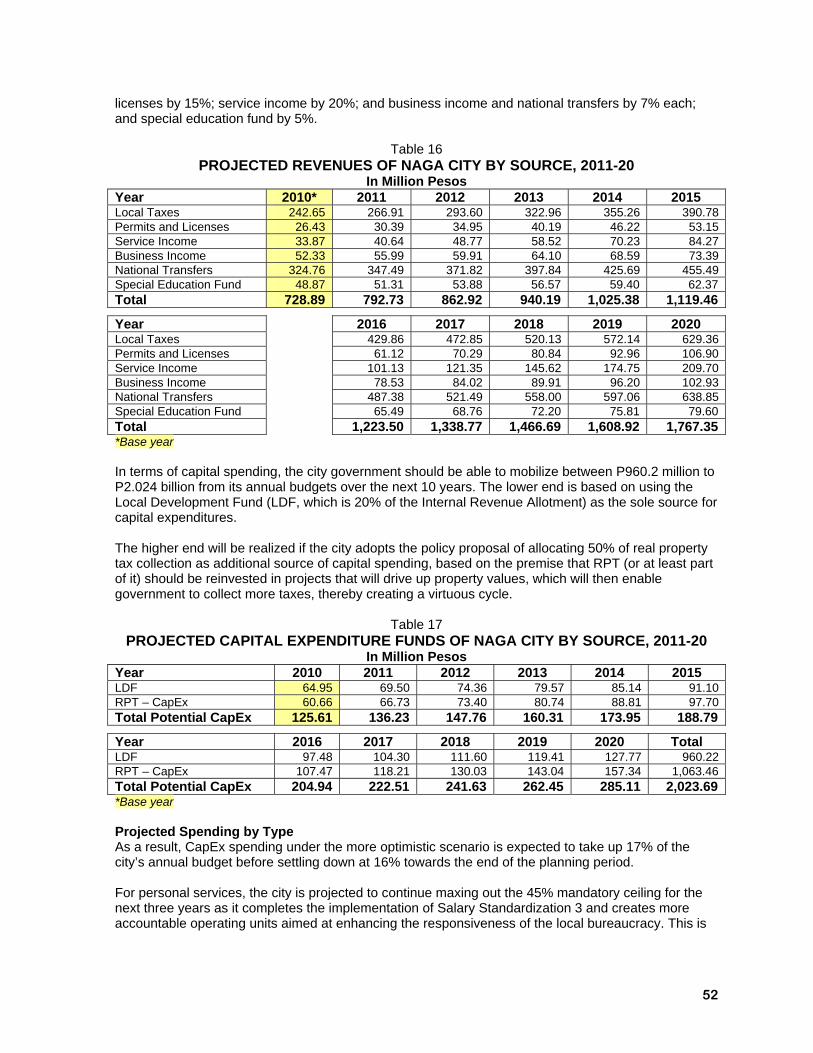
52
licenses by 15%; service income by 20%; and business income and national transfers by 7% each; and special education fund by 5%.
Table 16 PROJECTED REVENUES OF NAGA CITY BY SOURCE, 2011-20
In Million Pesos Year 2010* 2011 2012 2013 2014 2015 Local Taxes 242.65 266.91 293.60 322.96 355.26 390.78 Permits and Licenses 26.43 30.39 34.95 40.19 46.22 53.15 Service Income 33.87 40.64 48.77 58.52 70.23 84.27 Business Income 52.33 55.99 59.91 64.10 68.59 73.39 National Transfers 324.76 347.49 371.82 397.84 425.69 455.49 Special Education Fund 48.87 51.31 53.88 56.57 59.40 62.37 Total 728.89 792.73 862.92 940.19 1,025.38 1,119.46
Year 2016 2017 2018 2019 2020 Local Taxes 429.86 472.85 520.13 572.14 629.36 Permits and Licenses 61.12 70.29 80.84 92.96 106.90 Service Income 101.13 121.35 145.62 174.75 209.70 Business Income 78.53 84.02 89.91 96.20 102.93 National Transfers 487.38 521.49 558.00 597.06 638.85 Special Education Fund 65.49 68.76 72.20 75.81 79.60 Total 1,223.50 1,338.77 1,466.69 1,608.92 1,767.35 *Base year In terms of capital spending, the city government should be able to mobilize between P960.2 million to P2.024 billion from its annual budgets over the next 10 years. The lower end is based on using the Local Development Fund (LDF, which is 20% of the Internal Revenue Allotment) as the sole source for capital expenditures. The higher end will be realized if the city adopts the policy proposal of allocating 50% of real property tax collection as additional source of capital spending, based on the premise that RPT (or at least part of it) should be reinvested in projects that will drive up property values, which will then enable government to collect more taxes, thereby creating a virtuous cycle.
Table 17 PROJECTED CAPITAL EXPENDITURE FUNDS OF NAGA CITY BY SOURCE, 2011-20
In Million Pesos Year 2010 2011 2012 2013 2014 2015 LDF 64.95 69.50 74.36 79.57 85.14 91.10 RPT – CapEx 60.66 66.73 73.40 80.74 88.81 97.70 Total Potential CapEx 125.61 136.23 147.76 160.31 173.95 188.79
Year 2016 2017 2018 2019 2020 Total LDF 97.48 104.30 111.60 119.41 127.77 960.22 RPT – CapEx 107.47 118.21 130.03 143.04 157.34 1,063.46 Total Potential CapEx 204.94 222.51 241.63 262.45 285.11 2,023.69 *Base year Projected Spending by Type As a result, CapEx spending under the more optimistic scenario is expected to take up 17% of the city’s annual budget before settling down at 16% towards the end of the planning period. For personal services, the city is projected to continue maxing out the 45% mandatory ceiling for the next three years as it completes the implementation of Salary Standardization 3 and creates more accountable operating units aimed at enhancing the responsiveness of the local bureaucracy. This is

53
projected to progressively go down to 43% from 2014-15; to 40 from 2016-18, before settling at 35% from 2019-20. Consequently, the city’s projected budgetary resources in terms of major expenditure type over the next 10 years are broken down as follows:
Table 18 PROJECTED SHARE OF BUDGETARY
RESOURCES BY TYPE OF EXPENDITURE, 2011-20 Year 2010 2011 2012 2013 2014 2015 2016 2017 2018 2019 2020CapEx 17% 17% 17% 17% 17% 17% 17% 17% 17% 16% 16% PS 45% 45% 45% 45% 43% 43% 40% 40% 40% 35% 35% MOE, Social, Others 38% 38% 38% 38% 40% 40% 43% 43% 43% 49% 49% *Base year Conclusion Thus, even assuming the worst case scenario that the city government is unable to tap external funding, its projected CapEx budget (maximum of P2.024 billion) during the planning period should be able to fully cover the P1.6 billion requirements, excluding that of the waste-to-energy project. With the share of Maintenance and other Operating Expenses (MOE), Social Service and Other Expenses rising from 38 to 49% or almost half of the annual budget, the city government is likewise in a good position to fund its other sectoral programs and projects, notwithstanding the high rate of increase in city population.