Embed Size (px)
Citation preview

,
DOCUMENT RESUME
ED 466 961 SE 066 536
AUTHOR TITLE
INSTITUTION
SPONS AGENCY
REPORT NO PUB DATE NOTE CONTRACT AVAILABLE FROM
PUB TYPE
EDRS PRICE DESCRIPTORS
I DENT1 FIERS
Abedi, Jamal; Hofstetter, Carolyn; Baker, Eva; Lord, Carol NAEP Math Performance and Test Accommodations: Interactions with Student Language Background. CSE Technical Report. National Center for Research on Evaluation, Standards, and Student Testing, Los Angeles, CA.; California Univ., Los .
Angeles. Center for the Study of Evaluation. National Center for Education Statistics (ED), Washington, DC . CSE-TR-536 2001-02-00 85p. RS90159001 University of California, Los Angeles, National Center for Research on Evaluation, Standards, and Student Testing, Center for the Study of Evaluation, Graduate School of Education and Information Studies, Los Angeles, CA 90095-1522 ($6.50). Tel: 310-206-1532. For full text: http:/ /www.cse.ucla.edu/CRESST/pages/reports.htm. Numerical/Quantitative Data (110) -- Reports - Research (143) -- Tests/Questionnaires (160) EDRS Price MFOl/PC04 Plus Postage. Academic Achievement; *English (Second Language); *Grade 8; Junior High Schools; Language Fluency; *Language Proficiency; *Limited English Speaking; Mathematics Education; National Competency Tests *National Assessment of Educational Progress
ABSTRACT
This study compared the performance of 946 8th-grade students with different language proficiencies (limited English proficient [LEP], fluent English proficient [FEP], and initially fluent in English [IFE]) and language backgrounds on a 35-item math test (from the 1996 National Assessment of Educational Progress (NAEP) Grade 8 Bilingual Mathematics booklet) when different test accommodations were provided (original items, linguistically Modified English items, original items plus Glossary, original items plus Extra Time, original items plus Glossary and Extra Time). A reading test (11 items from the NAEP 1992 Grade 8 Reading assessment) and a language background questionnaire (Abedi, Lord, and Plummer, 1995) were also administered. For the entire sample, providing extra time for the math test resulted in a 1-point increase in student mean scores (14.68 for original items, and 15.64 with extra time). When a glossary and extra time were provided, the mean score was more than 2 points higher (mean 17.08). For the entire sample, no significant difference was found when items were linguistically modified (mean 14.23) or a glossary was provided without extra time (mean 14.53). Major findings include the following. Students designated LEP by their schools scored, on average, more than 5 points lower than non- LEP students on the math test. In comparison with scores on the original NAEP items, the greatest score improvements, by both LEP and non-LEP students, were on the accommodation version that included the Glossary plus Extra Time. LEP students scored higher with all types of accommodation except Glossary only. Most accommodations helped both LEP and non-LEP students; however, the
Reproductions supplied by EDRS are the best that can be made from the original document.
only accommodation that narrowed the score difference between LEP and non-LEP students was Modified English. Students who were better readers, as measured by reading test scores, achieved higher math scores. These differences and relative impacts need to be considered and investigated further before accommodation strategies are adopted for large-scale assessments. (Contains 90 references. ) (MM)
Reproductions supplied by EDRS are the best that can be made from the original document.

n w
NAEP Math Performance and Test Accommodations: Interactions With Student Language Background
CSE Technical Report 536
Jamal Abedi, Carolyn Hofstetter, and Eva Baker CRESST/University of California, Los Angeles
Carol Lord California State University/Long Beach
U S . DEPARTMENT OF EDUCATION Office of Educational Research and lmPrOvemenl
EDUCATIONAL RESOURCES INFORMATION CENTER (ERIC)
document has been reproduced as b received from the person or organization originating it.
improve reproduction quality. 0 Minor changes have been made to February 2001
Points of view or opinions stated in this document do not necessarily represent official OERl position or policy.
1
,
Center for the Study of Evaluation National Center for Research on Evaluation,
Standards, and Student Testing Graduate School of Education & Information Studies
University of California, Los Angeles Los Angeles, CA 90095-1522
(310) 206-1532
National Assessment of Educational Progress, Technical Review Panel for Assessing the Validity of the National Assessment of Educational Progress TRP Task 3D: Language Background Study-Phase 2. Jamal Abedi, Project Director, CRESST/ University of California, Los Angeles
Copyright'@ 2001 The Regents of the University of California
The work reported herein was supported in part under National Center for Education Statistics Contract No. RS90159001 as administered by the US. Department of Education.
The findings and opinions expressed in this report do not reflect the position or policies of the National Center for Education Statistics or the U.S. Department of Education.
3

CONTENTS
LIST OF TABLES .................................................................................................................................... iv
ACKNOWLEDGMENTS ....................................................................................................................... vi
EXECUTIVE SUMMARY ..................................................................................................................... vii
INTRODUCTION ..................................................................................................................................... 1
LITERATURE REVIEW ........................................................................................................................... 3 Math Performance Among Language Minority Students ....................................................... 4 Impact of Background Factors ..................................................................................................... 5 Linguistic Variables Affecting Math Performance ................................................................... 7 Effect of Accommodations .......................................................................................................... 11
PURPOSE ................................................................................................................................................. 14
RESEARCH HYPOTHESES .................................................................................................................. 14
METHOD .................................................................................................................................................. 16 Participants .................................................................................................................................... 16 Design ............................................................................................................................................. 16 Instruments .................................................................................................................................... 17 Procedure ....................................................................................................................................... 20 Linguistic Modification of Math Items ..................................................................................... 20 Development of Glossary Accommodation ............................................................................. 22 Categorization of LEI' and Non-LEP students ........................................................................ 22
FINDINGS ................................................................................................................................................ 24 Sample Descriptives ..................................................................................................................... 24 Math Performance by Accommodation ................................................................................... 26 Reading Performance by Accommodation .............................................................................. 29 Impact of Reading Proficiency on Math Performance ........................................................... 30 Teacher and School Effects .......................................................................................................... 32 Analyses of the Background Questionnaire ............................................................................ 34 Designation of LEP Status ........................................................................................................... 46 Predictors of Math and Reading Performance ........................................................................ 46 Differential Impact of Accommodation Strategies on LEP Students .................................. 49
SUMMARY .............................................................................................................................................. 56
REFERENCES .......................................................................................................................................... 58
APPENDIX: Student Background Questionnaire/Teacher Classroom Questionnaire ............. 65
... 111
4 .
LIST OF TABLES
1 . 2 . 3 .
4 . 5 . 6 . 7 . 8 .
9 . 10 . 11 . 12 . 13 . 14 . 15 . 16 . 17 . 18 .
19 .
20 .
21 .
22 .
23 .
24 . 25 .
26 .
27 .
Two Categories of Accommodations for English Language Learners ............................... 12
Test Booklets Administered in Study ....................................................................................... 17 Results of Interrater Reliability Studies for Open-Ended Math and .................................. 19 Reading Test Items
Mean NAEP Math Achievement Scores for 8th-Grade Students ........................................ 27 ANOVA Results for Math Scores by Accommodation and LEP Status ............................ 28
Mean NAEP Reading Achievement Scores for 8th-Grade Students ................................... 29 ANOVA Results for Reading Scores by Accommodation and LEP Status ...................... 30
ANCOVA Results for Math Scores by Accommodation and LEP Status. ........................ 31 Using Reading Score as a Covariate
ANOVA Results for Math Scores by School ............................................................................ 33 ANOVA Results for Reading Scores by School ...................................................................... 33 ANOVA Results for Math Scores by Teacher ......................................................................... 33
ANOVA Results for Reading Scores by Teacher .................................................................... 33 Selected Background Variables by Question Number .......................................................... 35 Correlation Among Background (Composite) Variables ....................... : .............................. 36 Internal Consistency Coefficients of Background (Composite) Variables ......................... 37
Correlation Among Composite Variables for LEP Students ................................................ 38
Correlation Among Composite Variables for Non-LEP Students ....................................... 39 Internal Consistency Coefficients of Composite Variables for ........................................... 40 LEP Students Internal Consistency Coefficients of Composite Variables for Non-LEP ........................... 41 Students Correlation Coefficients Between Composite Variables and Math and ............................ 42 Reading Scores
Correlation Coefficients Between Composite Variables and Math and ............................ 43 Reading Scores for LEP Students
Correlation Coefficients Between Composite Variables and Math and ............................ 44 Reading Scores for Non-LEP Students
Correlation Coefficients Between Individual Variables and Math and ............................ 45 Reading Scores for All Students Comparison of LEP Status .......................................................................................................... 46
Results of Multiple Regression Analysis Predicting Math Scores From ............................ 47 Students’ Background Information (All Students)
Results of Multiple Regression Analysis Predicting Math Scores From ........................... 48 Students’ Background Information (LEP Students)
Results of Multiple Regression Analysis Predicting Reading Scores From ..................... 49 Students’ Background Information (All Students)
iv
5
28 .
29 . 30 . 31 . 32 . 33 .
Results of Multiple Regression Analysis Predicting Reading Scores From ...................... 49
Background Variables for Grouping Students ........................................................................ 50 Students’ Background Information (LEP Students)
Full Model ...................................................................................................................................... 52 Restricted Model ........................................................................................................................... 53 Impact of Accommodations on Average Math Performance. by Math Class ................... 54 Impact of Accommodations on the Average Math Performance. by ................................. 55 Language of Instruction
V
6

ACKNOWLEDGMENTS
The generous efforts of several people informed the development of this study. We would like to thank all the researchers-faculty, staff, and students-who 'participated in and informed the study. We are especially indebted to Christy Kim, Joan Herman, Frances Butler, and Robin Stevens for their support and insightful comments on an earlier draft of this report. We appreciate the assistance of
Cici Bianch Debra LeRoux
Gina Cogswell Lynn Winters
Kris Waltman Alfred0 Artiles
Barry Gribbons Zenaida Aguirre-Mu Aoz
Rory Constancio Katharine Fry
We greatly appreciate the cooperation and assistance of the Los Angeles Unified School District, the Long Beach Unified School District, and all the test administrators, teachers, school staff, and students who helped us.
.
vi
7
NAEP MATH PERFORMANCE AND TEST ACCOMMODATIONS: INTERACTIONS WITH STUDENT LANGUAGE BACKGROUND
Jamal Abedi, Carolyn Hofstetter, and Eva Baker
National Center for Research on Evaluation, Standards, and Student Testing/UCLA
Carol Lord
California State University, Long Beach
EXECUTIVE SUMMARY
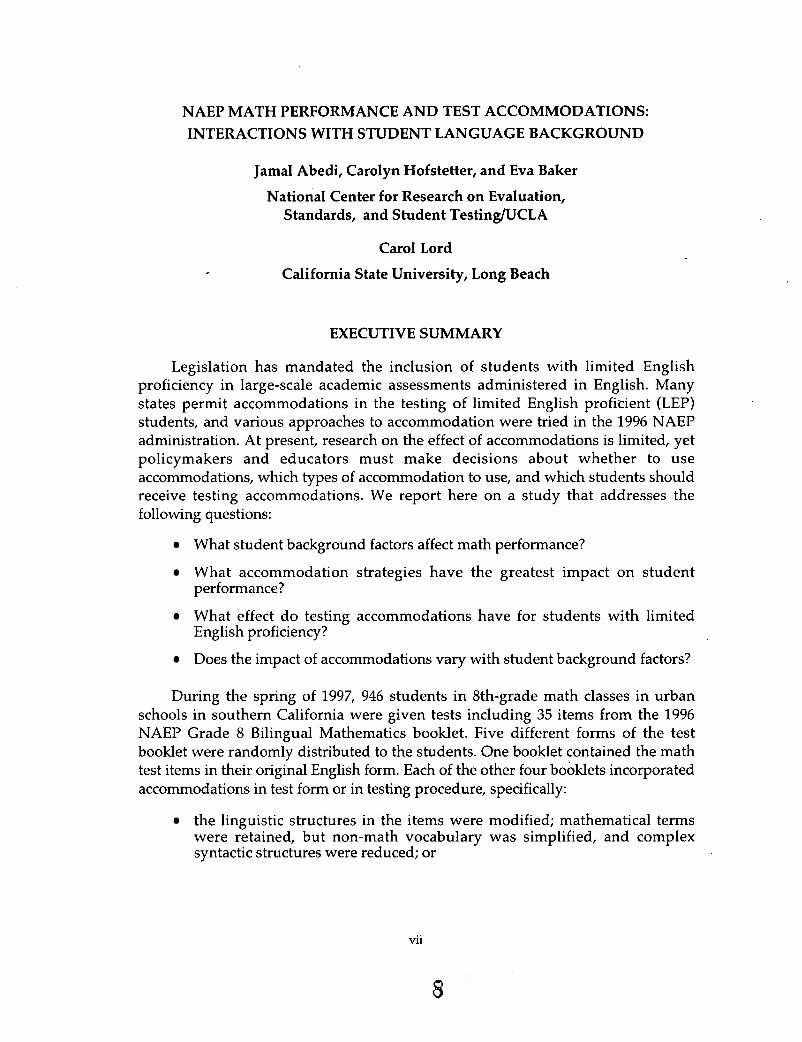
Legislation has mandated the inclusion of students with limited English proficiency in large-scale academic assessments administered in English. Many states permit accommodations in the testing of limited English proficient (LEP) students, and various approaches to accommodation were tried in the 1996 NAEP administration. At present, research on the effect of accommodations is limited, yet policymakers and educators must make decisions about whether to use accommodations, which types of accommodation to use, and which students should receive testing accommodations. We report here on a study that addresses the following questions:
What student background factors affect math performance?
What accommodation strategies have the greatest impact on student performance?
What effect do testing accommodations have for students with limited English proficiency?
Does the impact of accommodations vary with student background factors?
During the spring of 1997, 946 students in 8th-grade math classes in urban schools in southern California were given tests including 35 items from the 1996 NAEP Grade 8 Bilingual Mathematics booklet. Five different forms of the test booklet were randomly distributed to the students. One booklet contained the math test items in their original English form. Each of the other four booklets incorporated accommodations in test form or in testing procedure, specifically:
the linguistic structures in the items were modified; mathematical terms were retained, but non-math vocabulary was simplified, and complex syntactic structures were reduced; or
vii
8
the original wording was retained, but a glossary was provided;. the margins of the test booklet pages included definitions for non-math vocabulary items that might be difficult or unfamiliar; or
extra time was given for the test; or
both a glossary and extra time were provided.
In addition to a math test, each student completed a reading test and a language background questionnaire. The reading test was a two-page story with 11 questions from the NAEP 1992 Grade 8 Reading assessment. The language background questionnaire consisted of 45 items, primarily from the 1996 NAEP Grade 8 Bilingual Mathematics booklet and an earlier CRESST study (Abedi, Lord, & Plummer, 1995).
Over half of the students in the study were designated limited English proficient (LEI'). Only about 17% were initially fluent in English (IFE); the remainder, about 30%, had transitioned from LEI' programs and were designated fluent English proficient (FEP). Most (85%) spoke another language besides English, and for most of those, the other language was Spanish (82%).
Initial analyses suggest that test accommodations affected student math scores. For the entire sample, providing extra time for the math test resulted in a 1-point increase in student scores (mean scores of 14.68 on the original items, and 15.64 on the original items with extra time allowed, out of a total of 35 items). When a glossary and extra time were provided, the mean scores were more than 2 points higher (mean 17.08).
For the entire sample, no significant difference was found when items were linguistically modified (mean 14.23) or a glossary was provided without extra time (mean 14.53). In fact, non-LEP students actually scored slightly lower on the modified English version than they did on the original version.
When we compare the scores of LEP and non-LEP students, we find differences: on average, non-LEP students scored more than 5 points higher overall. The greatest difference between LEP and non-LEP scores was found on the glossary- plus-extra-time accommodation (6.38 points difference); the least difference between LEP and non-LEP scores was found on the linguistically modified version (3.31 points difference). In other words, the mod$ed English accommodation enabled the LEP students to achieve scores most comparable to those ofnon-LEP students.
If we look at the performance of the 473 LEP students in the sample, we find that they benefited from three of the accommodations-Modified English, Extra Time, and Glossary plus Extra Time-with the latter showing the greatest benefit. (Mean scores: original items 12.07, Modified English 12.63, Extra Time 12.93, and
... Vlll
9
Glossary plus Extra Time 13.69.) The LEP students did not benefit from the glossary accommodation without extra time; a possible explanation for this is that it took extra minutes to consult the glossary, and therefore the glossary did not help to increase scores unless extra time was provided for it.
Student scores on the reading test correlated, in general, with scores on the math tests. This is consistent with earlier research on student performance in math and reading. LEP students scored lower overall; the LEP mean was 3.92 out of 11, and the non-LEP mean was 6.35.
All students took the same reading test. However, there were small differences in mean reading test scores for different accommodation groups; this was not an expected result, since the booklets were distributed randomly within classes. For the LEP student group, math scores on original, Modified English, Extra Time, and Glossary plus Extra Time booklets were 12.07, 12.63, 12.93, and 13.69, respectively; these same groups showed reading scores of 3.78,3.84,3.93, and 4.48, respectively. If the reading scores represent real differences between groups, these trends may imply that reading skills and math skills tend to go together, or that the poorer readers got low math scores because they did not understand the English language of the items. We are investigating these possibilities.
After controlling for students’ reading scores, there were still significant differences in students’ math test scores, by type of accommodation. When LEP and non-LEP groups were compared on their math performance without controlling for reading proficiency, a coefficient of determination of 0.15 was obtained. When the reading score was entered as a covariate, however, this coefficient was reduced to 0.05. That is, two thrds of the variance in math scores between LEP and non-LEP students was explained by differences in level of reading proficiency in English.
Analyses of students’ responses on the language background questionnaire showed that the best predictor of math scores was the length of time the student has lived in the United States. Other predictors were questions about how far the student expects to go in school, how good at math the student is, and how many times the student changed schools.
Some major findings of t h s study include the following:
Students desi nated LEP by their schools scored, on average, more than 5
In comparison with scores on the original NAEP items, the greatest score improvements, by .both LEP and non-LEP students, were on the accommodation version that included a glossary explaining potentially unfamiliar or difficult words plus extra time.
points lower t a an non-LEP students on a 35-item math test.
ix
1 0
LEP students' scores were higher on all types of accommodation except Glossary only; LEI' students were helped by Modified English, Extra Time, and Glossary plus Extra Time.
Most accommodations helped both LEP and non-LEP students; the only type of accommodation that narrowed the score difference between LEP and non-LEP students was Modified English.
Students who were better readers, as measured by reading test scores, achieved hgher math scores.
The results of this study' indicate that there are relationships among student background variables and test performance under different types of accommodation. We are currently conducting further analyses to clarify these relationships. Among the specific variables we are investigating are: student English proficiency level; math proficiency level; reading skill level; first language; recency of arrival in the United States; self-reported data including attitudes, English proficiency, and first-language proficiency; the consistency and reliability of self- reported data and school-reported data as sources of information on language proficiency; and appropriateness of different types of accommodation with different subgroups of students.
Test accommodations can result in hgher math scores for both LEP and non- LEP students, and some types of accommodation have greater impact than others. Furthermore, certain accommodations may help LEP students more than non-LEP students. These differences and relative impacts need to be considered and investigated further before accommodation strategies are adopted for large-scale assessments.
X
NAEP MATH PERFORMANCE AND TEST ACCOMMODATIONS: INTERACTIONS WITH STUDENT LANGUAGE BACKGROUND
Jamal Abedi, Carolyn Hofstetter, and Eva Baker National Center for Research on Evaluation,
Standards, and Student TestinglUCLA
Carol Lord California State University, Long Beach
Introduction
Recent federal and state legislative changes, including Goals 2000 and the Improving America's Schools Act (IASA) of 1994, have important implications for the assessment of students in the United States. Not only are all students expected to attain meaningful, challenging, and appropriate standards set by their individual states, but the federal government is considering the implementation of a new national voluntary testing program. In the proposed testing program, students' standardized test results would be available to schools and parents for review. The increasing participation or "inclusion" of students in large-scale assessments has sparked debates within the educational and research communities. Much of the discussion focuses on the validity of standardized test results for English language learners,1 including students with limited English proficiency (LEP). Prior to the standards-based reforms, for example, these students were largely excluded from large-scale assessments administered in English. Now, standards-based legislation mandates the inclusion of these students in testing programs, with the provision of test accommodations. However, little is known about what variables affect test performance, whether accommodated or not.
Calls for research have since mounted. Studies are currently underway at the National Center for Research on Evaluation, Standards, and Student Testing (CRESST). These studies examine the validity of the National Assessment of Educational Progress (NAEP) in mathematics for 8th-grade students with limited
1 English language learners represent a rapidly growing, diverse student population in the United States. This group encompasses a wide range of learners, including students whose first language is not English, students who are beginning to learn English and could benefit from school instruction (referred to as "limited English proficient" or LEE'), and students who are proficient in English but may need additional assistance in social or academic situations (LaCelle-Peterson & Rivera, 1994). English language learners also include "language minority" or "linguistic minority" students who actively use another language besides English in the home environment.
1
English proficiency2 The goal is to produce and analyze a series of test accommodations and modifications that may be appropriate and feasible for use in the NAEP testing program. Experimental methods have been used to compare scores on modified test versions and/or testing conditions for student groups including those with limited English proficiency.
T h s is the third language background report in a series produced by the Center for the Study of Evaluation/ National Center for Research on Evaluation, Standards, and Student Testing (CSE/CRESST), under contract with the National Center for Educational Statistics (NCES). Exploratory research was first presented on the effects of language proficiency on mathematics performance among 8th-grade students (Abedi, Lord, & I'lummer, 1995). This was followed by another study (Abedi, Lord, & Hofstetter, 1998) with three important differences: (a) greater focus on students with limited English proficiency; (b) inclusion of a measure of English language proficiency, to better relate the effects of students' language proficiency on their math test performance; and (c) examination of the validity of selected test- accommodations administered to LEI' and non-LEP students.
The current study extends the above research questions. Specifically, it examines four test accommodations (Modified English, Glossary, Extra Time, Glossary plus Extra Time) commonly found in national and/ or statewide standardized testing situations. Each test accommodation is described further in the next section. Research questions guiding the kudy include:
What student background factors affect math performance? What accommodation strategies have the greatest impact on student
What effect do testing accommodations have for students with limited English proficiency? Does the impact of accommodations vary with student background factors?
One of the goals of the CRESST Language Background studies has been to keep the research designs as similar as possible, primarily to determine whether findings
* performance?
2 The term "limited English proficient" (LEP) is used primarily by government-funded programs to classify students, as well as by the National Assessment of Educational Progress (NAEP) for determining inclusion criteria. We acknowledge that this term may have a negative connotation. We also acknowledge that the broader term, "English language learner" (ELL), is preferred (see LaCelle- Peterson & Rivera, 1994; Butler & Stevens, 1997). However in keeping with its widespread use in NAEP testing, we use "limited English proficient (LEP)" to refer to students who are not native English speakers and who are at the lower end of the English proficiency continuum. Classification here is based on student background information obtained from participating schools.
2
remained consistent with different samples of students in southern California. For these reasons, readers familiar with the previous CRESST study will note parallels with this research report.
Literature Review
Recent standards-based legislation has prompted the rapid use of accommodations in testing LEP students. Over half of the states in the United States (55%) permit accommodations for English language learners (Hafner, 1995). Test accommodations were also administered to students with limited English proficiency in two NAEP test administrations-the 1995 field test, and the 1996 main math and science assessments. The 1996 NAEP administration provided the first series of studies evaluating various testing accommodations and their effectiveness with oversamples of English language learners at the 4th, 8th, and 12th grades (Goldstein, 1997; Mazzeo, 1997). The three subsamples were the 1992 Inclusion criteria without Accommodations; the 1996 Inclusion criteria without Accommodations; and the 1996 Inclusion criteria with Accommodations. The accommodations included one-on-one testing, small-group testing, extended time, and oral reading of directions. The NAEP test data, however, are aggregated for groups of students, so gauging the impacts of specific test accommodations for individual students is difficult. Further, results from these data are not yet available.\
The rationale for test accommodations is generally clear. Student performance on assessments may be particularly affected by background factors (e.g., English language proficiency, number of years in the U.S.), the linguistic complexity of the text (e.g., passive voice constructions, difficult terminology), and other threats to validity. The type of accommodation the student receives may also influence test performance. However, little systematic research has been conducted to guide decisions involving the use of accommodations for students with limited English proficiency (August & Hakuta, 1997; Thurlow, Liu, Erickson, Spicuzza, & El Sawaf, 1996).
Numerous research questions are relevant in making such decisions: What is the impact of various accommodations on student performance? What student background variables impact test performance generally, and for certain test accommodations specifically? What conditions may affect student test performance with any given test accommodation? Whch students should receive accommodated assessments, and based on what criteria? Without responses to these complex
3

questions, educators and researchers concerned about equity for English language learners caution the extensive use of accommodations in large-scale testing efforts, and subsequent inferences about students’ educational performance (Abedi, Lord, & Hofstetter, 1998; August & Hakuta, 1997; Butler & Stevens, 1997; LaCelle-Peterson & Rivera, 1994; Olson & Goldstein, 1997).
This literature review has three parts. First, it focuses on math performance among language minority students. Second, it presents information about the effects of background variables and linguistic features on math test performance. Finally, it defines the notion of accommodations and outlines the various accommodation techniques used in large-scale testing.
Math Performance Among Language Minority Students
Achievement differences between LEP and non-LEP students have been documented (see Cocking & Chipman, 1988). Students designated as LEP (including Native American and Hispanic students) tend to score lower than Caucasian students on standardized tests of mathematics achievement at all grade levels, the Scholastic Aptitude Test (SAT), and the quantitative and analytical sections of the Graduate Record Examination (GRE). Although no evidence suggests that the basic abilities of minority students are different from those of Caucasian students, researchers speculate that the differential performance may be due in part to differences in English language proficiency, the language commonly used in large- scale assessments.
Language proficiency also appears to be a contributing factor in problem solving; student performance on word problems is generally 10% to 30% below that on comparable problems in numeric format (Carpenter, Corbitt, Kepner, Linquist, & Reys, 1980; Cummins, Kintsch, Reusser, & Weimer, 1988; Noonan, 1990; Saxe, 1988). Further evidence of the importance of language was demonstrated by Cocking and Chipman (1988), who found that Spanish-dominant students scored higher on the Spanish version of a math placement test than on the same test in English. Additionally, Macnamara (1966) found that bilingual students showed lower performance when the language of instruction was in the students’ weaker language. Evidence suggests that bilingual students keep pace with monolinguals in mechanical arithmetic but fall behind in solving word problems. This discrepancy may be due to language minority students reading their second language more slowly.
4
Mestre (1988) compared bilingual Hispanic 9th-grade students with monolingual students with the same level of mathematical sophistication and concluded that language deficiencies can lead to the misinterpretation of word problems. Mestre identified four proficiencies in language that interact to produce knowledge in the mathematics domain: proficiency with language in general, proficiency in the technical language of the domain, proficiency with the syntax and usage of language in the domain, and proficiency with the symbolic language of the domain. Mestre concluded that the ability to understand written text is of paramount importance in solving math word problems.
Impact of Background Factors
Previous research in second language acquisition, content area learning in a second language, and linguistic minority testing suggest that selected background factors, especially for language minority students, can threaten the validity of content-based assessments. A student’s performance may be influenced by language background factors such as English language proficiency in academic contexts (Butler & Stevens, 1997). Thus, students’ language background must be taken into account, as noted in the Standards for Educational and Psychologicd Testing (American Educational Research Association, American Psychological Association, and National Council for Measurement in Education, 1985):
Individuals who are familiar with two or more languages can vary considerably in their ability to speak, write, comprehend aurally, and read in each language. These abilities are affected by the social or functional situations of communication. Some people may develop socially and culturally acceptable ways of speaking that intermix two or even three languages simultaneously. Some individuals familiar with two languages may perform more slowly, less efficiently, and at times, less accurately, on problem-solving tasks that are administered in the less familiar language. It is important, therefore, to take language background into account in developing, selecting, and administering tests and in interpreting test performance. (p. 73)
Although students may develop social skills in English fairly quickly, development of cognitive/ academic language proficiency (CALP) or school language proficiency may take five to seven years (Cummins, 1984, 1989; Ramirez, Yuen, Ramey, & Billings, 1991). Compared with students who are continuously exposed to standard academic English, students from homes where English is not spoken, where a limited amount of English is spoken, or who are in situations where there is little opportunity to acquire academic English would be expected to score
5
1 6
lower on content-based assessments conducted in English. Thus, test scores may likely underestimate the students’ potential until there have been at least seven years of exposure to English in an academic context (Cummins, 1984). Further, linguistic and cultural discontinuities between the school and the home may be present; for example, research on Crow, a Native American language, suggests that some mathematical concepts may be regarded as having little relevance outside of school, and terms for these concepts may be recent introductions to the Crow language (Davison & Schndler, 1988).
Research suggests that fully bilingual students who attain high levels of proficiency in both their native and second languages are most likely to succeed on assessments in either language, especially the stronger language (Cummins, 1980). Partial bilinguals who are proficient in their native language, but not in the second language, will likely perform more poorly if the assessment is in their weaker language. This occurs due to less efficient language processing (Dornic, 1979), especially under adverse environmental conditions such as a noisy room (Figueroa, 1989). Finally, limited bilinguals who develop less than native-like ability in either of the two languages are most likely to experience academic underachievement and poor test performance, regardless of the language of the test (Cummins, 1981). Some students who are bilingual speakers may read at a slower rate in their second language. These students may be negatively impacted by speed tests that involve reading (Mestre, 1984).
Thus, as most standardized, content-based tests are conducted in English and normed on native-English-speaking test populations, they may function as English language proficiency tests. English language learners (either native or non-native English speakers) may be unfamiliar with scriptally implicit questions, may not recognize vocabulary terms, or may mistakenly interpret an item literally (Duran, 1989; Garcia, 1991). Additionally, a student’s first language can interfere; for example, Schmitt and Dorans (1989) found that Hispanic students scored higher than Anglo students on Scholastic Aptitude Test questions with ”true” cognates (e.g., metal, which has the same meaning in both Spanish and English), whereas they scored lower on ”false” cognates (e.g., pie, whch means “foot” in Spanish).
These factors are likely to reduce the validity and reliability of inferences drawn about students’ content-based knowledge, as stated in the Standards fo r Educational and Psychological Testing (American Educational Research Association, et al., 1985):
6

For a non-native English speaker and for a speaker of some dialects of English, every test given in English becomes, in part, a language or literacy test. Therefore, testing individuals who have not had substantial exposure to English as it is used in tests presents special challenges. Test results may not reflect accurately the abilities and competencies being measured if test performance depends on these test takers’ knowledge of English. Thus special attention may be needed in many aspects of test development, administration, interpretation, and deasion-making. (p. 73)
Linguistic Variables Affecting Math Performance
Minor changes in the wording of math problems can raise student performance (Abedi et al., 1995; Cummins et al., 1988; De Corte, Verschaffel, & DeWin, 1985; Hudson, 1983; Riley, Greeno, & Heller, 1983). According to De Corte et al. (1985), rewording a verbal problem can make the semantic relations more explicit without affecting the underlying semantic and mathematical structure; the reader is then more likely to construct a proper problem representation and consequently to solve the problem correctly. What textual characteristics contribute to the relative ease or difficulty with which the reader constructs a proper problem representation?
Research has identified several linguistic features that appear to contribute to the difficulty of a text; they slow down the reader, make misinterpretation more likely, or add to the reader’s cognitive load and thus interfere with concurrent tasks. In addition, certain linguistic variables have been found to correlate with difficulty; these variables may or may not be considered to be the causes of the difficulty, but they may serve as convenient indexes for the actual causes of the difficulty, and can therefore be used to predict difficulty.
Indexes of language difficulty include word frequency, word length, and sentence length. An additional index of difficulty for math word problems is length of item. These indexes are elaborated below. Following them is a discussion of linguistic features that may cause difficulty for readers; these include passive voice constructions, long noun phrases, long question phrases, comparative structures, prepositional phrases, sentence and discourse structure, clause types, conditional clauses, relative clauses, and concrete vs. abstract or impersonal presentations.
These features are relevant for English prose text in general, including math word problems. However, math word problems constitute a special genre with its own peculiarities of vocabulary and syntax (Aiken, 1971, 1972; Chamot & OMalley, 1994; Cocking & Chipman, 1988; Munro, 1979; Rothman & Cohen, 1989; Spencer &
7 \
Russell, 1960) a more comprehensive review of this literature is found in a previous language background study (Abedi et al., 1995).
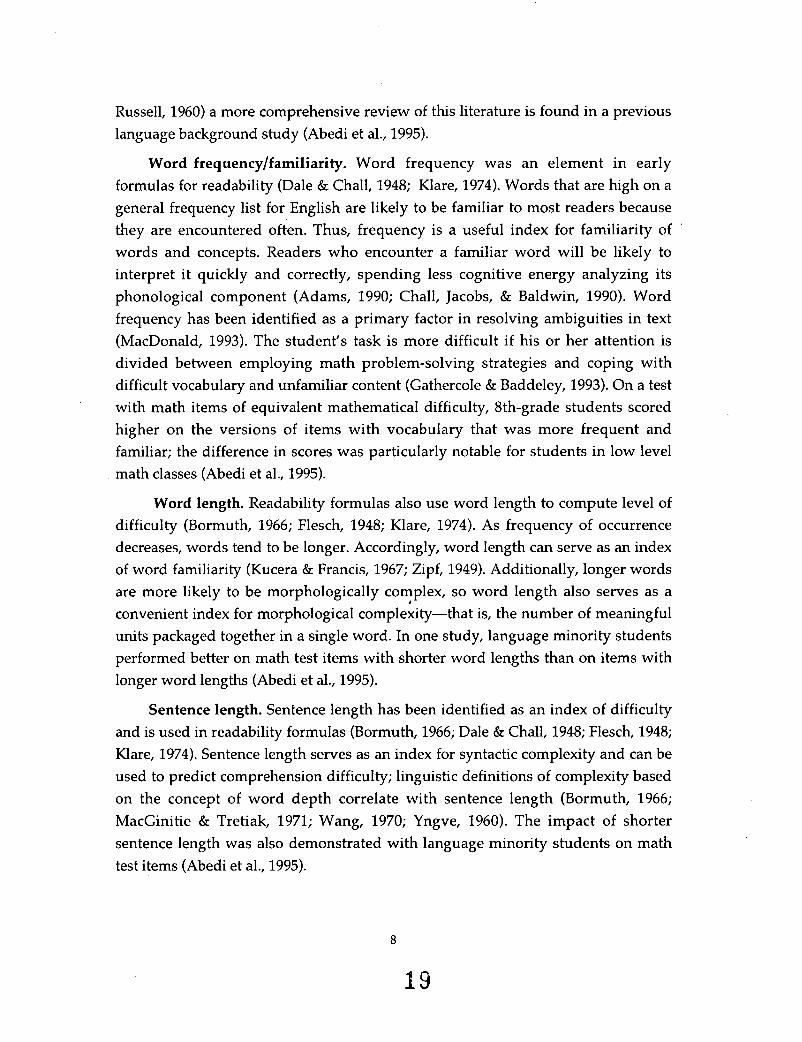
Word frequency/familiarity. Word frequency was an element in early formulas for readability (Dale & Chall, 1948; Klare, 1974). Words that are high on a general frequency list for English are likely to be familiar to most readers because they are encountered often. Thus, frequency is a useful index for familiarity of ’
words and concepts. Readers who encounter a familiar word will be likely to interpret it quickly and correctly, spending less cognitive energy analyzing its phonological component (Adams, 1990; Chall, Jacobs, & Baldwin, 1990). Word frequency has been identified as a primary factor in resolving ambiguities in text (MacDonald, 1993). The student’s task is more difficult if his or her attention is divided between employing math problem-solving strategies and coping with difficult vocabulary and unfamiliar content (Gathercole & Baddeley, 1993). On a test with math items of equivalent mathematical difficulty, 8th-grade students scored higher on the versions of items with vocabulary that was more frequent and familiar; the difference in scores was particularly notable for students in low level math classes (Abedi et al., 1995).
Word length. Readability formulas also use word length to compute level of difficulty (Bormuth, 1966; Flesch, 1948; Klare, 1974). As frequency of occurrence decreases, words tend to be longer. Accordingly, word length can serve as an index of word familiarity (Kucera & Francis, 1967; Zipf, 1949). Additionally, longer words are more likely to be morphologically complex, so word length also serves as a convenient index for morphological complexity-that is, the number of meaningful units packaged together in a single word. In one study, language minority students performed better on math test items with shorter word lengths than on items with longer word lengths (Abedi et al., 1995).
I
Sentence length. Sentence length has been identified as an index of difficulty and is used in readability formulas (Bormuth, 1966; Dale & Chall, 1948; Flesch, 1948; Klare, 1974). Sentence length serves as an index for syntactic complexity and can be used to predict comprehension difficulty; linguistic definitions of complexity based on the concept of word depth correlate with sentence length (Bormuth, 1966; MacGinitie & Tretiak, 1971; Wang, 1970; Yngve, 1960). The impact of shorter sentence length was also demonstrated with language minority students on math test items (Abedi et al., 1995).
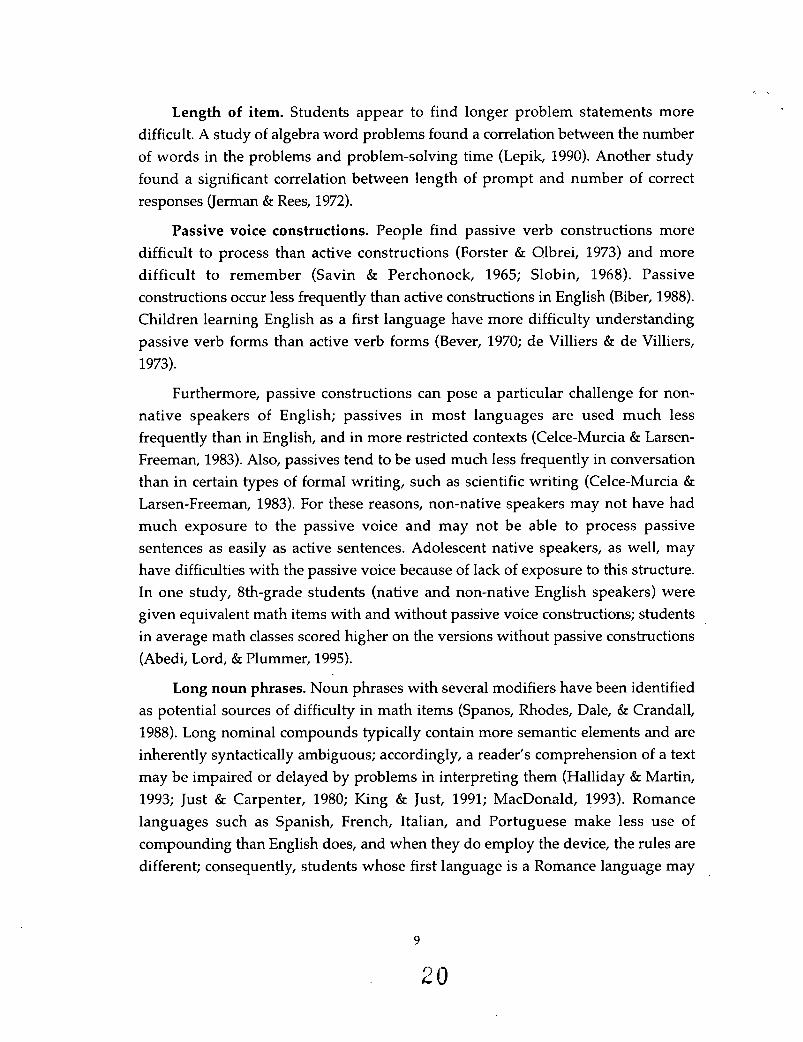
Length of item. Students appear to find longer problem statements more difficult. A study of algebra word problems found a correlation between the number of words in the problems and problem-solving time (Lepik, 1990). Another study found a significant correlation between length of prompt and number of correct responses (Jerman & Rees, 1972).
Passive voice constructions. People find passive verb constructions more difficult to process than active constructions (Forster & Olbrei, 1973) and more difficult to remember (Savin & Perchonock, 1965; Slobin, 1968). Passive constructions occur less frequently than active constructions in English (Biber, 1988). Children learning English as a first language have more difficulty understanding passive verb forms than active verb forms (Bever, 1970; de Villiers & de Villiers, 1973).
Furthermore, passive constructions can pose a particular challenge for non- native speakers of English; passives in most languages are used much less frequently than in English, and in more restricted contexts (Celce-Murcia & Larsen- Freeman, 1983). Also, passives tend to be used much less frequently in conversation than in certain types of formal writing, such as scientific writing (Celce-Murcia & Larsen-Freeman, 1983). For these reasons, non-native speakers may not have had much exposure to the passive voice and may not be able to process passive sentences as easily as active sentences. Adolescent native speakers, as well, may have difficulties with the passive voice because of lack of exposure to this structure. In one study, 8th-grade students (native and non-native English speakers) were given equivalent math items with and without passive voice constructions; students in average math classes scored higher on the versions without passive constructions (Abedi, Lord, & Hummer, 1995).
Long noun phrases. Noun phrases with several modifiers have been identified as potential sources of difficulty in math items (Spanos, Rhodes, Dale, & Crandall, 1988). Long nominal compounds typically contain more semantic elements and are inherently syntactically ambiguous; accordingly, a reader’s comprehension of a text may be impaired or delayed by problems in interpreting them (Halliday & Martin, 1993; Just & Carpenter, 1980; King & Just, 1991; MacDonald, 1993). Romance languages such as Spanish, French, Italian, and Portuguese make less use of compounding than English does, and when they do employ the device, the rules are different; consequently, students whose first language is a Romance language may
9
have difficulty interpreting compound nominals in English (Celce-Murcia & Larsen- Freeman, 1983).
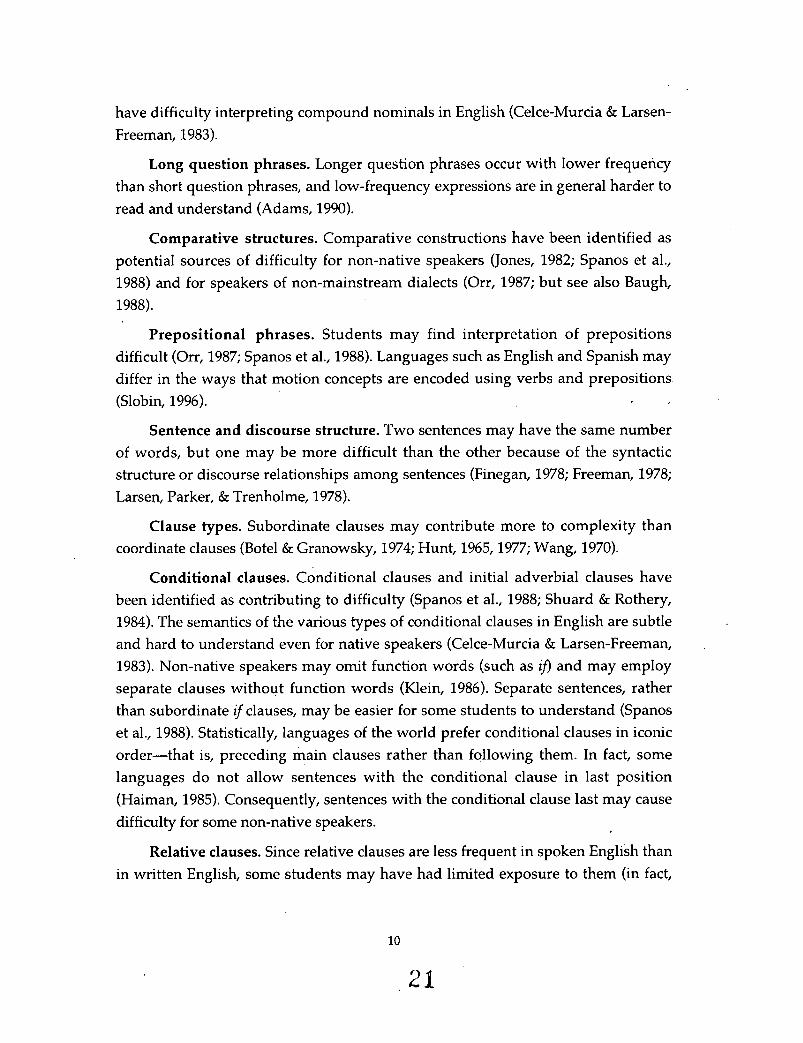
Long question phrases. Longer question phrases occur with lower frequency than short question phrases, and low-frequency expressions are in general harder to read and understand (Adams, 1990).
Comparative structures. Comparative constructions have been identified as potential sources of difficulty for non-native speakers (Jones, 1982; Spanos et al., 1988) and for speakers of non-mainstream dialects (Orr, 1987; but see also Baugh, 1988).
Prepositional phrases. Students may find interpretation of prepositions difficult (Orr, 1987; Spanos et al., 1988). Languages such as English and Spanish may differ in the ways that motion concepts are encoded using verbs and prepositions (Slobin, 1996).
Sentence and discourse structure. Two sentences may have the same number of words, but one may be more difficult than the other because of the syntactic structure or discourse relationships among sentences (Finegan, 1978; Freeman, 1978; Larsen, Parker, & Trenholme, 1978).
Clause types. Subordinate clauses may contribute more to complexity than coordinate clauses (Botel & Granowsky, 1974; Hunt, 1965,1977; Wang, 1970).
Conditional clauses. Conditional clauses and initial adverbial clauses have been identified as contributing to difficulty (Spanos et al., 1988; Shuard & Rothery, 1984). The semantics of the various types of conditional clauses in English are subtle and hard to understand even for native speakers (Celce-Murcia & Larsen-Freeman, 1983). Non-native speakers may omit function words (such as if, and may employ separate clauses without function words (Klein, 1986). Separate sentences, rather than subordinate $clauses, may be easier for some students to understand (Spanos et al., 1988). Statistically, languages of the world prefer conditional clauses in iconic order-that is, preceding main clauses rather than following them. In fact, some languages do not allow sentences with the conditional clause in last position (Haiman, 1985). Consequently, sentences with the conditional clause last may cause difficulty for some non-native speakers.
Relative clauses. Since relative clauses are less frequent in spoken English than in written English, some students may have had limited exposure to them (in fact,
10
21

Pawley and Syder, 1983, argue that the relative clauses in literature differ from those in spoken vernacular language). Relative clauses are acquired relatively late by first- language learners. Languages differ with respect to marking structures and word ordering for relative clauses (Schachter, 1983), so they may be difficult for a non- native speaker to interpret if his/her first language employs patterns that are different from those of English.
Concrete vs. abstract or impersonal presentations. Studies show better performance when problem statements are presented in concrete rather than abstract terms (Cummins et al., 1988). Information presented in narrative structures tends to be understood and remembered better than information presented in expository text (Lemke, 1986).
From the studies discussed above, we identified features of ordinary English that may contribute to the overall difficulty of a mathematics problem statement. Then we surveyed NAEP math items to identify which of those features were present in the items and could be modified without changing the math content of the items. We included the features in a rubric for rating the complexity of a problem statement, and we were guided by them in malung modifications to existing math items.
Effect of Accommodations
Butler and Stevens (1997 define test accommodations as "support provided students for a given testing event either through modification of the test itself or through modification of the testing procedure to help students access the content in English and better demonstrate what they know" (p. 5). Accommodations or adaptations may be administered to better understand what students know and can do, especially with regard to content-based assessments (e.g., math, science) where their test results may be confounded with the students' English or native language proficiency or other background variables. In so doing, the goal of the test accommodations is not to give LEP students an "unfair advantage" over students not receiving an accommodated assessment (Thurlow et al., 1996).
There are two types of test accommodations: (a) modifications of the test; and (b) modifications of the test procedure (see Table 1). Potential modifications of the test include assessment in native language, textual changes in vocabulary, and modification of linguistic structure. Possible modifications of the test procedure are extra assessment time, small-group administration, use of dictionaries, and reading
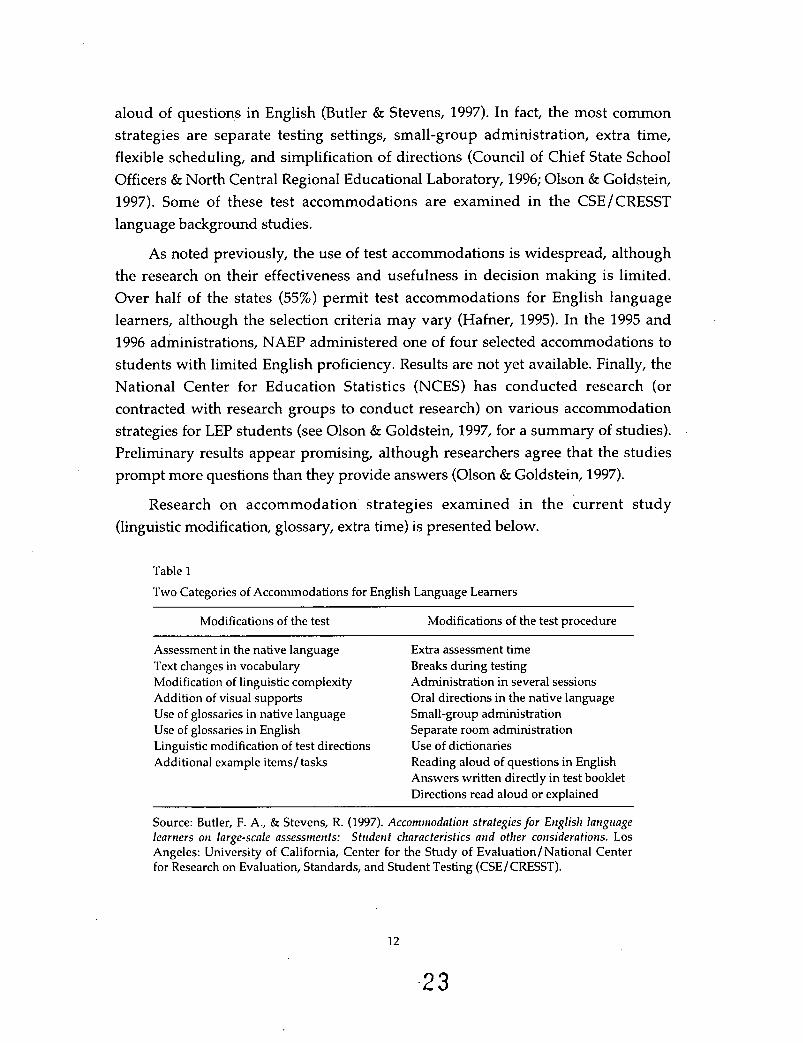
aloud of questions in English (Butler & Stevens, 1997). In fact, the most common strategies are separate testing settings, small-group administration, extra time, flexible scheduling, and simplification of directions (Council of Chief State School Officers & North Central Regional Educational Laboratory, 1996; Olson & Goldstein, 1997). Some of these test accommodations are examined in the CSE/CRESST language background studies.
As noted previously, the use of test accommodations is widespread, although the research on their effectiveness and usefulness in decision malung is limited. Over half of the states (55%) permit test accommodations for English language learners, although the selection criteria may vary (Hafner, 1995). In the 1995 and 1996 administrations, NAEP administered one of four selected accommodations to students with limited English proficiency. Results are not yet available. Finally, the National Center for Education Statistics (NCES) has conducted research (or contracted with research groups to conduct research) on various accommodation strategies for LEI' students (see Olson & Goldstein, 1997, for a summary of studies). Preliminary results appear promising, although researchers agree that the studies prompt more questions than they provide answers (Olson & Goldstein, 1997).
Research on accommodation strategies examined in the current study (linguistic modification, glossary, extra time) is presented below.
Table 1
Two Categories of Accommodations for English Language Learners
Modifications of the test Modifications of the test procedure
Assessment in the native language Text changes in vocabulary Modification of linguistic complexity Addition of visual supports Use of glossaries in native language Use of glossaries in English Linguistic modification of test directions Additional example items/ tasks
Extra assessment time Breaks during testing Administration in several sessions Oral directions in the native language Small-group administration Separate room administration Use of dictionaries Reading aloud of questions in English Answers written directly in test booklet Directions read aloud or explained
Source: Butler, F. A., & Stevens, R. (1997). Accominodation strategies for English langiiage learners on large-scale assessments: Stiident characteristics and other considerations. Los Angeles: University of California, Center for the Study of Evaluation/ National Center for Research on Evaluation, Standards, and Student Testing (CSE/CRESST).
12
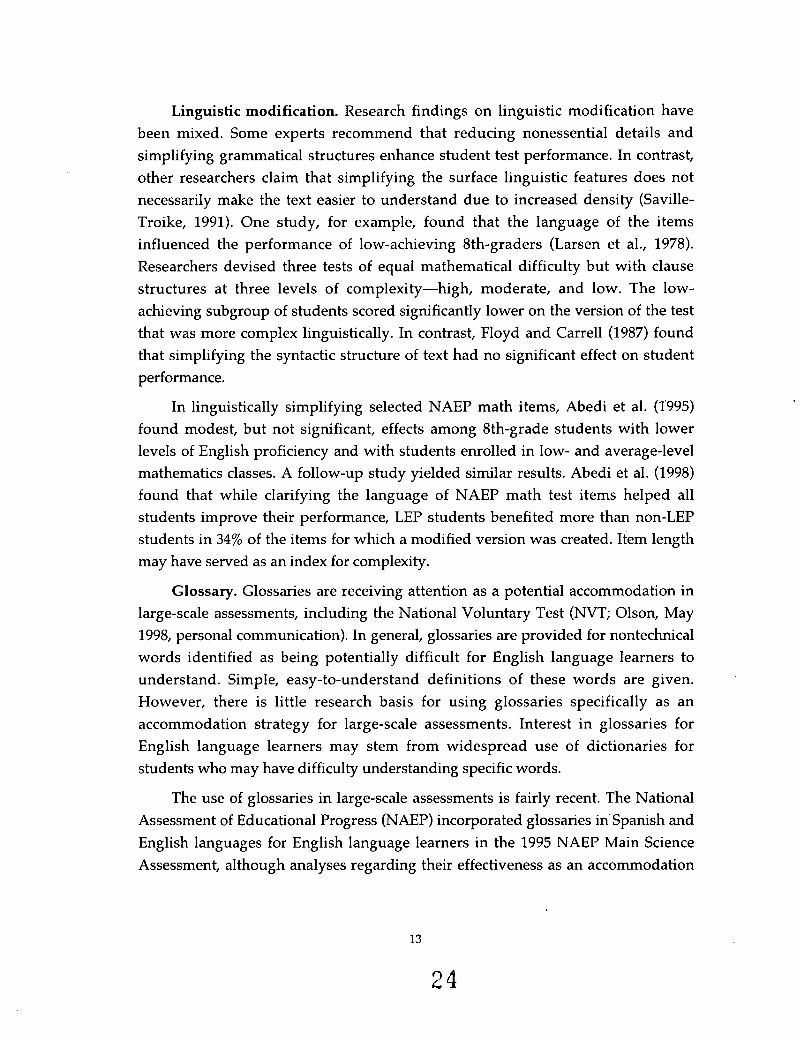
Linguistic modification. Research findings on linguistic modification have been mixed. Some experts recommend that reducing nonessential details and simplifying grammatical structures enhance student test performance. In contrast, other researchers claim that simplifying the surface linguistic features does not necessarily make the text easier to understand due to increased density (Saville- Troike, 1991). One study, for example, found that the language of the items influenced the performance of low-achieving 8th-graders (Larsen et al., 1978). Researchers devised three tests of equal mathematical difficulty but with clause structures at three levels of complexity-high, moderate, and low. The low- achieving subgroup of students scored significantly lower on the version of the test that was more complex linguistically. In contrast, Floyd and Carrel1 (1987) found that simplifying the syntactic structure of text had no significant effect on student performance.
In linguistically simplifying selected NAEP math items, Abedi et al. (1'995) found modest, but not significant, effects among 8th-grade students with lower levels of English proficiency and with students enrolled in low- and average-level mathematics classes. A follow-up study yielded similar results. Abedi et al. (1998) found that while clarifying the language of NAEP math test items helped all students improve their performance, LEP students benefited more than non-LEP students in 34% of the items for which a modified version was created. Item length may have served as an index for complexity.
Glossary. Glossaries are receiving attention as a potential accommodation in large-scale assessments, including the National Voluntary Test (NVT; Olson, May 1998, personal communication). In general, glossaries are provided for nontechnical words identified as being potentially difficult for English language learners to understand. Simple, easy-to-understand definitions of these words are given. However, there is little research basis for using glossaries specifically as an accommodation strategy for large-scale assessments. Interest in glossaries for English language learners may stem from widespread use of dictionaries for students who may have difficulty understanding specific words.
The use of glossaries in large-scale assessments is fairly recent. The National Assessment of Educational Progress (NAEP) incorporated glossaries in Spanish and English languages for English language learners in the 1995 NAEP Main Science Assessment, although analyses regarding their effectiveness as an accommodation
13
2 4
strategy have not been reported. For this reason, CRESST researchers are examining the use of a glossary as an accommodation strategy for English language learners.
Extra time. As noted earlier, considerable research has shown that English language learners perform lower than other students on speeded tests. These students tend to process information in their second language less efficiently than in their first language. As most standardized content-based assessments are administered in English, second language students frequently run out of time on a speeded test, and especially under adverse environmental conditions, such as a noisy room. Consequently, these students may be negatively affected by speeded tests that involve reading.
These facts support giving extra time as an accommodation strategy in large- scale assessments for English language learners. This strategy does not involve any changes to the test content or format. However, it introduces a variety of logistical difficulties for schools and other testing environments.
Purpose
The purpose of this study was to examine the validity and comparability of selected test accommodations on math performance for students with limited English proficiency (LEP), as compared to students who are more fluent in English. As noted earlier, research questions include:
What student background factors affect math performance?
What accommodation strategies have the greatest impact on student performance?
What effect do testing accommodations have for students with limited English proficiency?
Does the impact of accommodations vary with student background factors?
Research Hypotheses
Several hypotheses address the main research questions in this study. In each set, the hypotheses are stated in the null and alternative forms:
14
25

Factor A (Test Accommodation)
HOA: There are no significant differences on NAEP math performance between students who receive a test accommodation and students who do not receive a test accommodation.
(Modified English) will perform significantly higher on the NAEP math test than students who do not receive a test accommodation.
Hu : Students who receive the Glossary accommodation will perform significantly higher on the NAEP math test than students who do not receive a test accommodation.
H ~ A : Students who receive the Extra Time accommodation will perform significantly higher on the NAEP math test than students who do not receive a test accommodation.
Hu : Students who receive the Glossary plus Extra Time accommodation will perform significantly higher on the NAEP math test than students who do not receive a test accommodation.
HIA: Students who receive the linguistic modification accommodation ~
Factor B (LEP Status)
HOB: There is no significant difference on NAEP math test performance between students designated as limited English proficient (LEP) and students designated as non-LEP (FEP/ IFE). Students designated as LEP will perform significantly lower on the NAEP math test than students designated as non-LEP (FEP/IFE).
H ~ B :
Interaction Between Factor A (Test Accommodation) and Factor B (LEP Status)
HOAB: There are no significant differences on NAEP math performance between LEP and non-LEP students who are administered test booklets by accommodation.
H~AB: The performance of LEP students will be significantly different from non-LEP students on the NAEP math test with the linguistic modification (Modified English) accommodation.
HUB: The performance of LEP students will be significantly different from non-LEP students on the NAEP math test with the Glossary accommodation.
H~AB: The performance of LEP students will be significantly different from non-LEP students on the NAEP math test with the Extra Time accommodation.
H~AB: The performance of LEP students will be significantly different from non-LEP students on the NAEP math test with the Glossary Plus Extra Time accommodation.
15
26

Method
Participants
Data were collected from 946 8th-grade students (ages 13-14 years) during March and April 1997. Students were selected from a larger, nonprobability sample of 33 math classrooms in 6 middle schools from two major school districts (Los Angeles Unified School District and Long Beach Unified School District) in southern California. The math classes varied in content and level (e.g., 8th-grade basic math, pre-algebra, algebra), as well as language of instruction (English only, English sheltered), with several classes taught by the same teachers.
Efforts were made to target and select schools with large Spanish-speaking student enrollments, sizable English language learner populations, and varying socioeconomic, language and ethnic backgrounds. Additionally, students varied in country of origin, English language proficiency and math proficiency, number of years in LEP programs, and number of years living in the United States. Class lists were obtained from participating schools to provide insights into how students were categorized by native language, LEP student designation or program (if available), LEP entry date (if available), and date transitioned into fluent English proficient (FEP) designation (if applicable).
Design
One of five test booklets was administered randomly to 8th-grade students in intact math classrooms. Random assignment of test accommodations was done to minimize class, teacher and school effects. Each test booklet contained the same NAEP math test items (differing only by linguistic demands, time demands, or availability of glossary), a NAEP reading proficiency test, and a student background questionnaire (see Table 2).
Secured math test items for this study were derived from alternate versions of the 1996 NAEP Grade 8 Bilingual Mathematics booklet (M921CG, M9CP, MlOCG) with some items common to all the test versions. Math questions were presented in both the English and Spanish languages, whereby students participating in the national assessment could select whichever language they preferred. From this pool of math items, five test booklets for the current study were developed. All booklets contained the same math items, differing only in their linguistic or time demands:
16
27
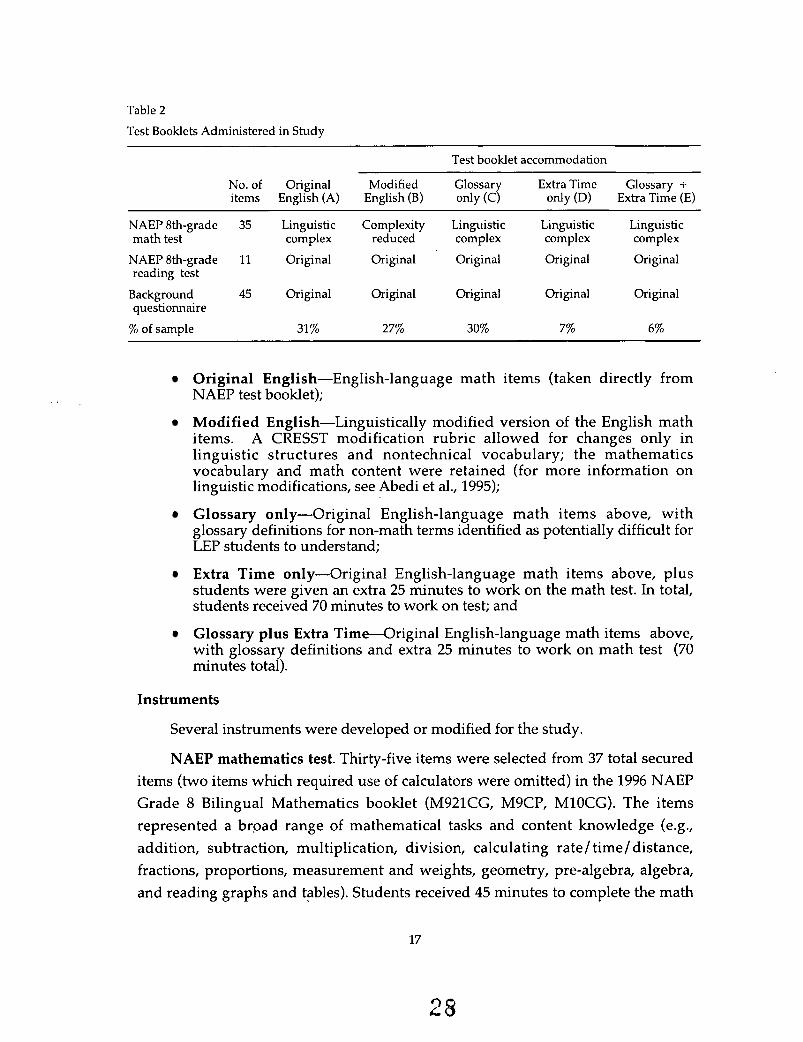
Table 2
Test Booklets Administered in Study
Test booklet accommodation
No. of Original Modified Glossary ExtraTime Glossary + items English (A) English (B) only (C) only (D) Extra Time (E)
NAEP 8th-grade 35 Linguistic Complexity Linguistic Linguistic Linguistic math test complex reduced complex complex complex
NAEP 8th-grade 11 Original Original Original Original Original reading test
Background 45 Original Original Original Original Original questionnaire
% of sample 31 % 27% 30% 7% 6%
Original English-English-language math items (taken directly from NAEP test booklet);
Modified English-Linguistically modified version of the English math items. A CRESST modification rubric allowed for changes only in linguistic structures and nontechnical vocabulary; the mathematics vocabulary and math content were retained (for more information on linguistic modifications, see Abedi et al., 1995);
Glossary only-Original English-language math items above, with glossary definitions for non-math terms identified as potentially difficult for LEP students to understand;
Extra Time only-Original English-language math items above, plus students were given an extra 25 minutes to work on the math test. In total, students received 70 minutes to work on test; and
Glossary plus Extra T i m A r i g i n a l English-language math items above, with glossary definitions and extra 25 minutes to work on math test (70 minutes total).
Instruments
Several instruments were developed or modified for the study.
NAEP mathematics test. Thirty-five items were selected from 37 total secured items (two items whch required use of calculators were omitted) in the 1996 NAEP Grade 8 Bilingual Mathematics booklet (M921CG, M9CP, MlOCG). The items represented a broad range of mathematical tasks and content knowledge (e.g., addition, subtraction, multiplication, division, calculating rate/ time/ distance, fractions, proportions, measurement and weights, geometry, pre-algebra, algebra, and reading graphs and tables). Students received 45 minutes to complete the math
17
28
b
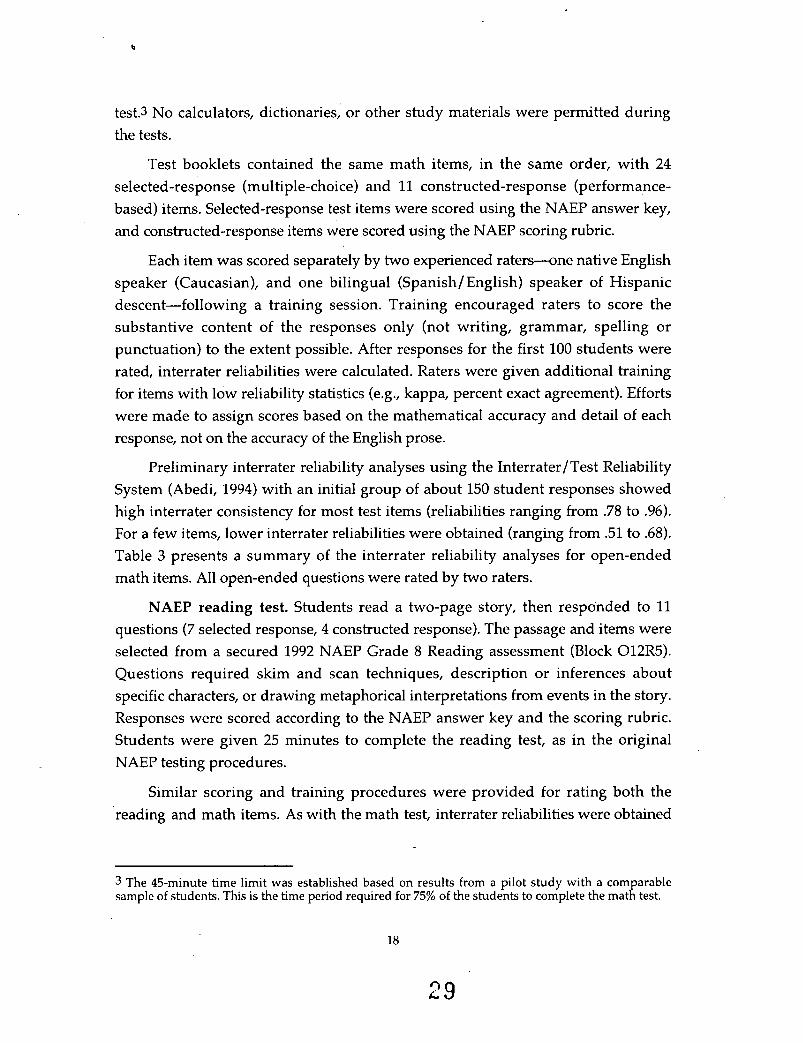
test3 No calculators, dictionaries, or other study materials were permitted during the tests.
Test booklets contained the same math items, in the same order, with 24 selected-response (multiple-choice) and 11 constructed-response (performance- based) items. Selected-response test items were scored using the NAEP answer key, and constructed-response items were scored using the NAEP scoring rubric.
Each item was scored separately by two experienced raters-one native English speaker (Caucasian), and one bilingual (Spanish/ English) speaker of Hispanic descent-following a training session. Training encouraged raters to score the substantive content of the responses only (not writing, grammar, spelling or punctuation) to the extent possible. After responses for the first 100 students were rated, interrater reliabilities were calculated. Raters were given additional training for items with low reliability statistics (e.g., kappa, percent exact agreement). Efforts were made to assign scores based on the mathematical accuracy and detail of each response, not on the accuracy of the English prose.
Preliminary interrater reliability analyses using the Interrater / Test Reliability System (Abedi, 1994) with an initial group of about 150 student responses showed high interrater consistency for most test items (reliabilities ranging from .78 to .96). For a few items, lower interrater reliabilities were obtained (ranging from .51 to .68). Table 3 presents a summary of the interrater reliability analyses for open-ended math items. All open-ended questions were rated by two raters.
NAEP reading test. Students read a two-page story, then responded to 11 questions (7 selected response, 4 constructed response). The passage and items were selected from a secured 1992 NAEP Grade 8 Reading assessment (Block 012R5). Questions required skim and scan techniques, description or inferences about specific characters, or drawing metaphorical interpretations from events in the story. Responses were scored according to the NAEP answer key and the scoring rubric. Students were given 25 minutes to complete the reading test, as in the original NAEP testing procedures.
Similar scoring and training procedures were provided for rating both the reading and math items. As with the math test, interrater reliabilities were obtained
3 The 45-minute time limit was established based on results from a pilot study with a comparable sample of students. This is the time period required for 75% of the students to complete the math test.
18
29

Table 3
Results of Interrater Reliability Studies for Open-Ended Math and Reading Test Items
Item # Rater combination # Students Kappa % Agreement
Math 2 Math 5 Math 6 Math 9 Math 29 Math 30 Math 31 Math 32 Math 33 Math 34 Math 35 Reading 1 Reading 4 Reading 7 Reading 11
119 93
116 148 148 148 148 148 148 148 148 148 148 148 148
.82
.51
.68
.68
.94
.95
.78
.96
.89
.74
.95
.60
.81
.49
.64
94.07 75.27 86.21 77.03 96.62 97.30 85.14 97.30 93.24 84.46 97.30 76.35 87.84 63.51 76.35
Note. Rater 1 = Bilingual Latina; Rater 2 = Caucasian, English-speaking female.
for the first 200 student responses. Interrater reliabilities for the reading test items were generally lower (kappas ranging from .60 to .81) than for the math test items, with one item posing considerable difficulty for the raters (kappa = .49). See Table 3 for reliability summaries for the open-ended reading items.
Student background questionnaire. Each student was administered a 45-item questionnaire, comprising primarily items from the 1996 NAEP Grade 8 Bilingual Mathematics booklet, relating to home language use, student attitudes toward mathematics, grades in mathematics, self-reports of ability to understand math terminology and performing computations, and educational and mathematical ambitions. This questionnaire contained additional items from an earlier language background study (Abedi et al., 1995). Questionnaire development was also informed by other NAEP background questionnaires and the 1988 National Education Longitudinal Study (NELS). Students were given approximately 15 minutes to complete the questionnaire4 (see Appendix for sample).
4 As with the math test, the 15-minute time limit for the questionnaire was established based on results from a pilot study with a comparable sample of students. This is the time period required for 75% of the students to complete the background questionnaire.
19
30
Teacher classroom questionnaire. Teachers were asked to report aggregate percentage breakdowns of various classroom and student characteristics, including percent LEP and FEI'/IFE students in classroom at time of testing, type of math class (8th-grade math, pre-algebra, algebra, sequential/ integrated math), ethnic breakdown and native language of students, and percent that received free- or reduced-price lunches. Teachers also reported general classroom levels in math proficiency (percentage in low-level math, medium-level math, high-level math), and English language proficiency (reading, writing, and oral proficiency) (see Appendix for sample).
Procedure
For this study, NAEP test administration was conducted by six independent, trained CSE/ CRESST test administrators, all of whom were retired educators (e.g., LAUSD assistant superintendents, principals, resource teachers). The test administrators varied by ethnic background, although none were Latino (three Caucasian, two African American, one Japanese). Four were female, two were male. Test administrators attended a half-day training session, and were accompanied and observed by the project coordinator on their first testing assignment. Testing sites were also monitored in random visits by project staff. Schools received honoraria of $125 per participating classroom, and each student received a UCLA pencil.
In each classroom, the test administrators randomly distributed the test booklets to the students. Students were given one of the five test booklets (Original, Modified English, Original with Glossary, Original with Extra Time, Original with Glossary plus Extra Time).
Linguistic Modification of Math Items
Previous research on the effect of linguistic complexity on the performance of LEI' students in content area assessments was reviewed, and language features with potential impact on student performance were identified. These features included word frequency, word length, sentence length, length of item, passive voice constructions, long noun phrases, long question phrases, comparative structures, prepositional phrases, sentence and discourse structure, clause types, conditional clauses, relative clauses, and concrete versus abstract or impersonal presentations. This list of linguistic features was reviewed by three experts in linguistics and/or the teaching of English. Their comments and suggestions were incorporated.
20
31
Next, NAEP math items were analyzed to determine which of these linguistic features were present in the items. The language of many of the NAEP math items presented potentially challenging linguistic structures in the areas identified.
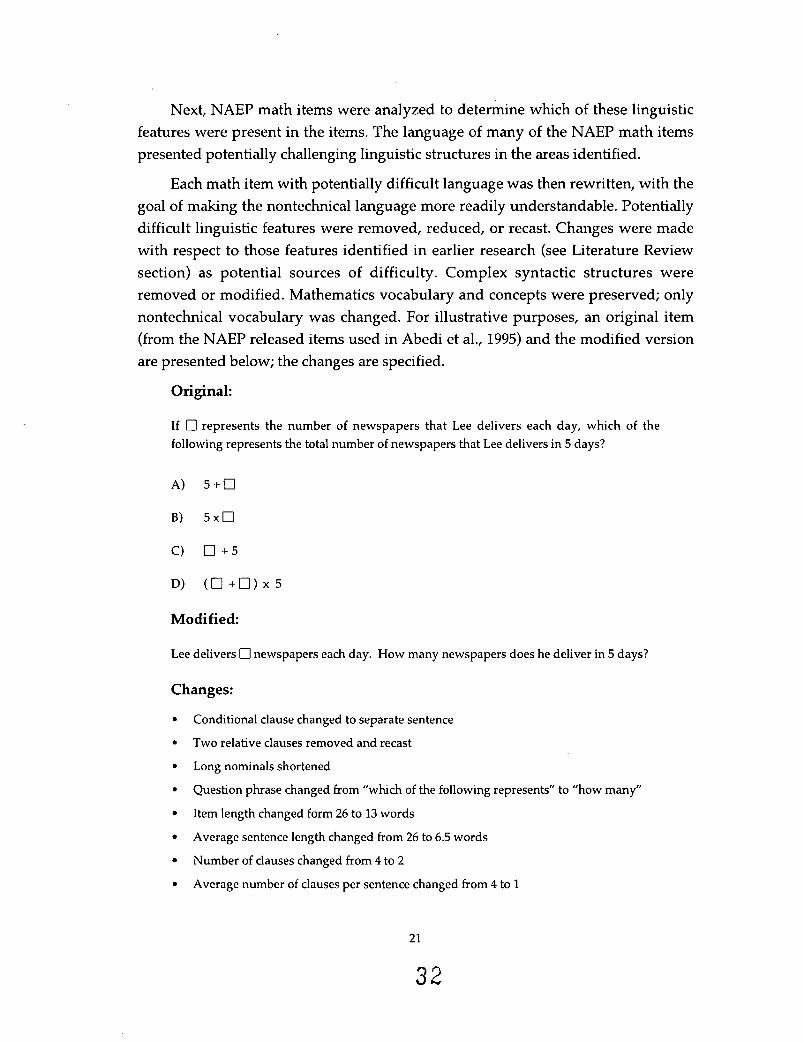
Each math item with potentially difficult language was then rewritten, with the goal of making the nontechnical language more readily understandable. Potentially difficult linguistic features were removed, reduced, or recast. Changes were made with respect to those features identified in earlier research (see Literature Review section) as potential sources of difficulty. Complex syntactic structures were removed or modified. Mathematics vocabulary and concepts were preserved; only nontechnical vocabulary was changed. For illustrative purposes, an original item (from the NAEP released items used in Abedi et al., 1995) and the modified version are presented below; the changes are specified.
Original:
If 0 represents the number of newspapers that Lee delivers each day, which of the following represents the total number of newspapers that Lee delivers in 5 days?
A) 5 + 0
B) 5 x 0
C) 0 + 5
Modified:
Lee delivers 0 newspapers each day. How many newspapers does he deliver in 5 days?
Changes:
Conditional clause changed to separate sentence
Two relative clauses removed and recast
Long nominals shortened
Question phrase changed from “which of the following represents” to “how many”
Item length changed form 26 to 13 words
Average sentence length changed from 26 to 6.5 words
Number of clauses changed from 4 to 2
Average number of clauses per sentence changed from 4 to 1
21
32
The modified items were compared with the original items by a mathematics education expert to ensure that, in each item, the modifications did not change the mathematical concepts or the problem to be solved. The reviewer’s comments and suggestions were incorporated.
Development of Glossary Accommodation
The math items in the Original test version were reviewed, and vocabulary items considered potentially difficult or unfamiliar to LEP students were targeted for inclusion in the glossary. Mathematics terms were not included. Brief explanations of each potentially difficult vocabulary item were written. Each word and its explanation were printed in the margin of the test booklet beside the test item in which the word occurred.
Categorization of LEE’ and Non-LEP Students
Categorizations of students into various student designations (LEP, FEP, IFE) were obtained from the participating schools. Designations are based primarily on students’ performance on English language proficiency tests administered at the schools upon entrance into the educational program, and are updated periodically. However, different schools may not necessarily use the same designation criteria and may have varying types of instructional programs (e.g., Accelerated Bilingual, English Language Development Program Literate). This suggests that students designated as limited English proficient (LEI’) at one school would not necessarily be designated as LEI’ at another school, even within the same school district. Additionally, distinctions between LEP levels are often based on additional factors tangential to English proficiency levels.
Students can be categorized into LEP or non-LEP (FEP/IFE) groups according to various criteria, including schools’ specifications and the NAEP LEI’ definition. The current study, however, presents data analyses only for students designated as LEP according to the school specificiations. In future studies, it would be of interest to examine students’ test performance according to different LEP designations.
School specifications. Schools in our sample represented two large school districts in southern California. The districts classified students for whom English is a second language differently, although the general designations are as follows, according to students’ status as LEP, FEP, or IFE. Based on this categorization, over half (53%, n = 473) of the students in ths sample were classified as limited English
22
33
proficient (LEP), and the remaining 47% (n = 423) were classified as fluent English proficient (FEP) or initially fluent in English (IFE).
NAEP definition. NAEP has recently changed its inclusion guidelines. Prior to 1995, the procedures were based on criteria for "excluding" students. However, the guidelines presented in the 1995 NAEP field test were revised to aid in making appropriate and consistent decisions about the inclusion of . . . LEP students (Olson & Goldstein, 1997). Students with limited English proficiency (LEP) are now to be included in NAEP assessments if
Student has received academic instruction primarily in English for at least three years; or
Student has received academic instruction in English for less than three years, if school staff determine that the student is capable of participating in the assessment in English; or
Student, whose native language is Spanish, has received academic instruction in English for less than three years, if school staff determine that the student is capable of participating in the assessment in Spanish (if available).
Student background variables. As noted previously, the categorization of students based on their LEP status typically varies by school district, and perhaps by school within a single school district. For these reasons, comparing students exclusively by their LEP status may be problematic. Other variables might be considered as predictors of LEP status, such as country of origin, speaking another language besides English, and number of times changed schools. Following are three questions from the background questionnaire that might be useful for categorizing students based on language-related variables:
1. What country do you comefiom? Nearly half the students responded "US." (57%, n = 540); the remaining students cited other countries (430J0, n = 406).
2. Do you speak another language besides English? Over three quarters of the students responded "Yes" (85%, n = 773); the remaining students responded "No" (15%, n = 135).
3. In the last two years, how many times have you changed schools because you ? Students res onded as follows: none (68%), one
(17%), two (8% PU , or live three or more (7%f: changed where
23
34
Findings
The current study compared the performance of students with limited English proficiency with the performance of students who were native speakers of English, under the original test condition and four different forms of accommodation. Thus, the main independent variables in this study are (a) students’ status as native or non-native speakers of English, and (b) different forms of accommodations. This section presents the initial descriptive findings from the student background questionnaire, overall performance levels of the students on the math and reading proficiency tests, and results as related to research questions posed at the beginning of the report.
Sample Descriptives
Data were collected from 946 8th-grade students (ages 13-14 years) during March and April 1997. Students were selected from a larger, nonprobability sample of 33 math classrooms in 6 middle schools in southern California. Some classrooms were taught by the same teachers (10 total). Of these classes, most (76%) were taught in English only, with one quarter of the classrooms (22%) taught in Sheltered English (simplified English, as necessary to enhance student comprehension of material). In this sample, over half of the students were designated as limited English proficient (53%); the remaining students had transitioned into non-LEP programs and were designated fluent English proficient (FEP; 30%), or initially fluent in English (IFE; 17%).
Test booklets were distributed in intact math classes. About half of the students reported being enrolled in 8th-grade mathematics (47%), pre-algebra (26%), algebra (24%), or some other type of math class (e.g., integrated, sequential math, applied math 2%). The distribution of test booklets was fairly even within classrooms, with the exception that fewer students received the Extra Time accommodation: Original English (31%), Modified English (27%), Glossary (30%), Extra Time (6%), and Glossary plus Extra Time (7%). Fewer students received the Extra Time accommodation (either alone or combined with Glossary) because of logistical difficulties in administration. Many schools felt it would be too disruptive to keep students beyond the standard class period.
Students came from a variety of cultural backgrounds, with many having lived their entire lives in the United States. Nearly three quarters of the students (72%) reported their e thc i ty as Hispanic; the remaining students were Asian or Southeast
24
35
Asian (15%), White (6%), Black (5%), or Other (2%). The majority of students noted that they were from the United States (57%), followed by Mexico (23%), various Latin American countries (e.g., El Salvador, 3%; Guatemala, 2%), and Southeast Asian countries (Cambodia, 3%; Thailand, 3%). The remaining students hailed from various countries in Europe (e.g., England, Germany) and the Middle East (e.g., Iran, Syria), and from other countries. The mean number of years the students had lived in the United States was 11.06, with the number of years ranging from less than one year (2%) to 14 years or more (27%). There were equal percentages of males and females in the sample (50% each).
The language backgrounds of the students also varied, with many students speaking more than one language. Most students in the sample spoke another language besides English (85%); the remaining students spoke English (15%). Of those who reported speaking another language besides English, Spanish was the most commonly reported (82%), followed by Cambodian or Khmer (ll%), and Vietnamese, Tagalog, and Lao (1% each). About 6% of students spoke another language, such as Hmong, French, Thai, Armenian, or Farsi. Of the students who spoke another language, most reported speaking their home language with their parents sometimes or always (95%)) and less so with their siblings (83%), other children at school (75%), or people outside of school (76%).
Students were generally confident about their home language and English language abilities. Nearly two thirds (66%) reported that they understood their home language very well, but fewer spoke or wrote the language at the same level (54% and 38%, respectively). About 43% reported reading their home language very well. In terms of their English language proficiency, most students reported that they understood spoken English very well (71%), spoke English very well (65%), read English very well (62%), and wrote English very well (57%).
Students were also asked about whether they had studied math in another language. Nearly half (41%) said they had studied math in another language besides English. Of these students, about 9% had studied math in another language all their life, half (50%) had done this for over one year, and the remaining students (41%) had studied math in another language for less than one year. Conversely, over half of the sample (57%) reported studying math in the English language their whole life, 33% had been instructed in English for over one year, and the remaining students (9%) had studied math in the English language for less than one year.
25
36

Over half of the students in the sample came from home environments that contained English language reading materials. Nearly two thirds of the students said their home had at least 25 books in the English language (64%), whereas there were fewer homes ‘with encyclopedias in English (52%) and magazines (55%) written in English. Fewer of these students reported receiving an English language newspaper regularly in their home (34%).
Students reported spending more time watching television than reading books or doing homework. The mean number of hours watching television was 3.3 hours per day, with one quarter of the sample (25%) watching for 5 or more hours per day. In contrast, over half of the sample (58%) spent one hour or less per week reading for fun, and very few (5%) did so for at least 5 or more hours per week. Most of the student sample (86%) spent one hour or less per day on homework.
Most students had fairly high educational aspirations, as well as positive views toward math. In response to the question ”How far do you think will go in school?” very few (2%) of the students did not think they would finish h g h school, one third (34%) said they would graduate from high school, about 10% would have some education after high school, about half (47%) hoped to graduate from college, and the remaining students (8%) noted that they would pursue graduate school. Data on students’ attitudes toward mathematics were also collected. In general, the students were positive about their math experiences. Over half (52%) agreed or strongly agreed with the statement ”I am good at mathematics.”
Math Performance by Accommodation
Initial analyses suggest that test accommodations affect general test performance. For the entire sample, students who received the Original English math test (standard) had a mean math score of 14.68 (SD = 6.67), out of 35 points possible. Linguistic modification (M = 14.23, SD = 6.19) and presence of a glossary of nontechnical terms (M = 14.53, SD =7.01) appeared to make no notable difference in student performance. However, the data suggest that students who received extra time increased their scores by one point (M = 15.64, SD = 6.86). The data also suggest that students who received the Glossary plus Extra Time accommodation scored the highest, overall (M = 17.08, S D = 7.68). These students had math scores approximately 2 points hgher than students who received no accommodation at all (see Table 4).
26
37

Table 4
Mean NAEP Math Achievement Scores for 8th-Grade Students (35 Points Possible)
LEP status
Math book LEP (Bl) FEP/IFE (B2) Column total
Original English (Al) 12.07
Modified English (A2) 12.63
Glossary only (A3) 11.84
Extra Time only (A4) 12.93 (SD=5.99; n=30)
Glossary + Extra Time (A5) 13.69 (SD=6.74; n=29)
Row total 12.30
(SD=5.47; n=144)
(SD=5.23; n=124)
(SD=5.94; n=146)
(SD=5.67; n=473)
17.56 (SD=6.70; n=130)
15.94 (SD=6.67; n=117)
17.78 (SD=6.84; n=121)
-, 18.88 (SD=6.50; n=25)
20.37 (SD=7.17; n=30)
17.45 (SD=6.83; n=423)
14.68 (SD=6.67; n=274)
14.23 (SD=6.19; n=241)
14.53 (SD=7.01; n=267)
15.64 (SD=6.86; n=55)
17.08 (SD=7.68; n=59)
14.73 (SD=6.75; n=896)
Note. LEP = limited English proficient; FEP = fluent English proficient; IFE = initially fluent in English.
Among LEP students, accommodations resulted in higher math scores, as shown in Table 4.
Accommodation effects may also be examined by comparing math performance by LEP status. LEP students performed much lower (M = 12.30, S D =
5.67) than their more English-fluent counterparts (M = 17.45, S D = 6.83)-a difference of over 5 points. This trend was maintained across test booklets. For example, LEP students who received the standard math assessment (Original English) reported a mean score of 12.07 ( S D = 5.47), whereas FEP/IFE students had a mean score of 17.56 ( S D = 6.70). Interestingly, linguistic modification appeared to aid LEP students (M = 12.63, S D = 5.23), but had potentially negative effects on FEP/IFE students (M = 15.94, SD = 6.67).
In this study, non-LEP students scored slightly lower on the Modified English version than on the Original English version. This result was unexpected, since it ’ was not found in the two earlier CRESST language background studies. In the first CRESST study, native speakers of English scored slightly higher on Modified English versions of math items (Abedi et al., 1995). In the second study (Phase I), non-LEP students scored 1.45 points higher on the Modified English version (Abedi et al., 1998). Future studies may confirm the earlier pattern.
27
38

In addition, scores for LEP students were lower on the math test with a glossary (M = 11.84, SD = 5.94), perhaps because of information overload, whereas scores for FEP/IFE students with the glossary increased (M = 17.78, S D = 6.84). Extra time appeared to help all students. Math scores for students with limited English proficiency increased slightly with extra time (M = 12.94, SD = 5.99), and even more when they received the glossary with extra time (M = 13.69, SD = 6.74). For FEP/IFE students, extra time alone increased math scores by nearly 1.5 points (M = 18.88, SD = 6.50), and the addition of a glossary resulted in about a 3-point gain (M = 20.37, SD = 7.17). Overall, these results suggest that the linguistic modification may help LEP students, as a possible accommodation. Further, all students benefited from extra time. These trends remained stable, even after controlling for the students’ reading achievement scores.
Both type of accommodation and students’ LEP status appeared to have significant effects on students’ NAEP math performance. A two-factor analysis of variance model was used (see Table 5). For the first factor (Math Book), a significant main effect was obtained (F = 2.71, df = 4,886, p = 0.029). The largest difference was in test performance among students who were administered the linguistically Modified English accommodation (M = 14.23) and students who received the Glossary plus Extra Time accommodation (M = 17.08). There was also a significant difference in students’ NAEP math test performance; for LEP status (Factor B) a significant main effect was obtained (F = 103.67, df = 1,886, p = 0.000). As noted earlier, LEP students scored about 5 points lower than FEP/IFE students on a 35- point scale. No interaction effects between type of test booklet and LEP status were reported ( F = 1.925, df= 4,886, p = 0.105).
Table 5
ANOVA Results for Math Scores by Accommodation and LEP Status
sum of Mean Source of variation squares df squares F-ratio Signif. of F
Type of accommodation (A) 417.47 4 104.37 2.71* 0.029
LEP status (B) 3996.75 1 3996.75 103.67** 0.000
Interaction effects (AxB) 296.37 4 74.09 1.92 0.105
Within subjects 34157.41 886 38.55
Total 40801.71 895 45.59
* p < .05. **p < .01.
28
39

Reading Performance by Accommodation
The reading test, from the NAEP Grade 8 Reading assessment, was administered to obtain a measure of the students’ reading proficiency. Because of time constraints in the testing environment, a single section was selected with one reading passage and 11 responses. The resulting measure was considered limited but potentially valuable, and nevertheless preferable to the option of omitting a reading measure entirely. In addition to students’ reading proficiency, narrowly defined, the scope of the test included language arts (e.g., metaphor and inferences about characters were included). Accordingly, the reading test scores may have reflected language arts capabilities broader than those assumed to be required for math problem scenario comprehension. Summary findings are presented (see Table 6).
Overall, the mean reading test scores were fairly low (M = 5.07, SD = 3.22, n =
896). As the reading test was the same for all students, regardless of test booklet, we would expect the scores to be comparable across test booklet groups. However, the score means suggest that students receiving the Modified English test booklet scored lower than students receiving any other test booklet, although the difference among math scores (by test accommodation) was not statistically significant (F-ratio = .88, df = 4,886, p = 0.475).
Table 6
Mean NAEP Reading Achievement Scores for 8th-Grade Students (11 Points Possible)
LEP Status
Math book LEP (Bl ) LEP (Bl) Column total
Original English (Al) 3.78
Modified English (A2) 3.84
Glossary (A3) 4.01
(SD=2.80; n=144)
(SD=2.91; n=124)
(SD=2.92; n=146)
Extra Time (A4) 3.93 (SD=2.69; n=30)
6.77 (SD=2.91; n=130)
5.81 (51)-3.26; n=117)
6.50 (SD=3.01; n=121)
6.40 (SD=3.34; n=25)
5.20 (SD=3.22; n=274)
4.80 (SD=3.23; n=241)
5.13 (SD=3.21; n=267)
5.05 (SD=3.22; i1=55)
Glossary + Extra Time (A5) 4.48 6.10 5.31
Row total 3.92 6.35 5.07
(SD=2.87; n=29) (SD=3.61; n=30) (SD=3.34; n=59)
(SD=2.86; n=473) (SD=3.12; n=423) (SD33.22; n=896)
29
4 0

Students who were administered the Modified English booklet comprised a wider variety of student groups, including native English speakers. Even though the difference between the highest average reading score (M = 5.31 for Glossary) and the lowest average (M = 4.80 for Modified English) is not significant, it explains the lower math scores of the students who took the linguistically modified booklet.
The most notable finding is the difference between the LEP and non-LEP students’ performance on the NAEP reading assessment. As expected, FEP/ IFE students (M = 6.35, SD = 3.12, n = 423) consistently performed higher on the reading test than LEP students (M = 3.92, SD = 2.86, n = 473)-a 2.5-point difference, which was statistically significant (F-ratio = 79.49, df= 1,886; p = 0.00) (see Table 7).
This finding provides evidence that the reading achievement test, despite its limitations related to validity and appropriateness as a measure of students’ reading proficiency, emerged as a suitable predictor of math performance. In this sample, the FEP/IFE students scored higher on reading tests and math tests. One likely reason for the math score difference is that students with a better command of English text (FEP/IFE students) were likely more able to read and interpret the math items correctly than students with lower English proficiency levels (LEP students).
Impact of Reading Proficiency on Math Performance
A source of variation that was not controlled by random assignment was students’ language background. Earlier findings (see Tables 5 and 7) indicated a significant difference between LEP and non-LEP students’ performance in math and reading. One may expect a significant difference between LEI’ and non-LEP students
Table 7
ANOVA Results for Reading Scores by Accommodation and LEP Status
Sum of Mean squares Source of variation squares df, F-ratio Signif. of F
Type of accommodation (A) 33.64 4 8.41 0.94 0.438
LEP status (B) 709.06 1 706.06 79.49** 0.000
Interaction effects 43.52 4 10.88 1.22 0.301
Within subjects 7903.09 886 8.92
Total 9304.57 895 10.40
* p < .05. **p < .01.
30
4 1
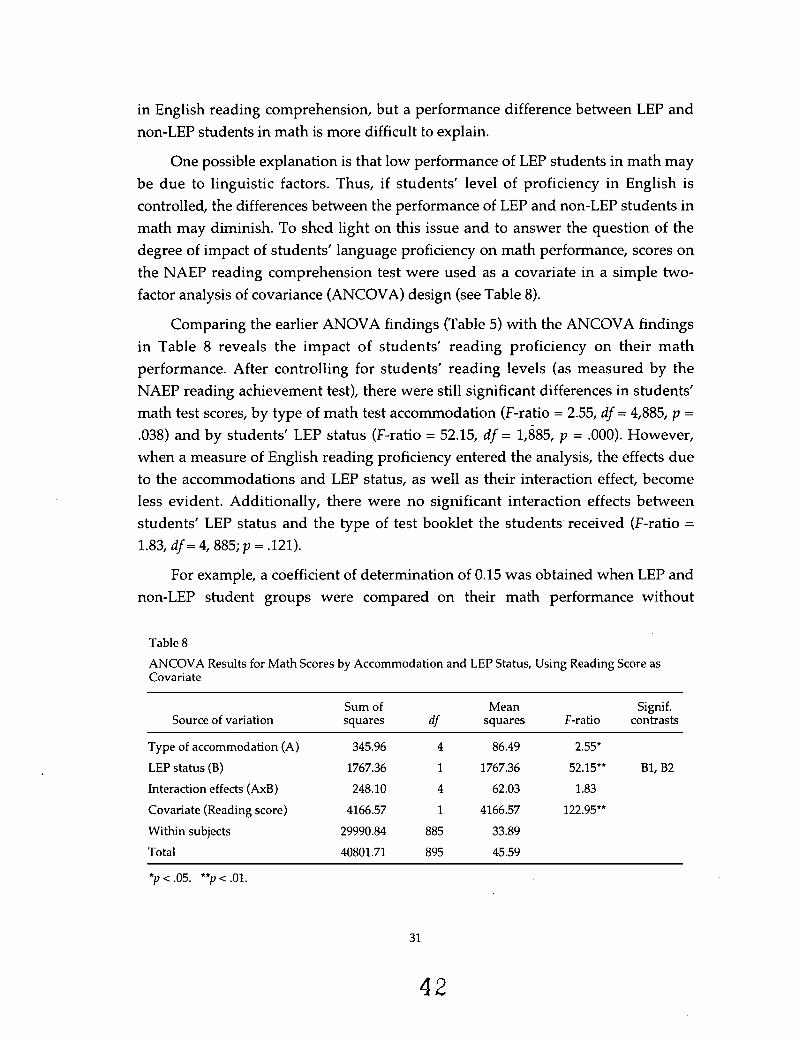
in English reading comprehension, but a performance difference between LEP and non-LEP students in math is more difficult to explain.
One possible explanation is that low performance of LEP students in math may be due to linguistic factors. Thus, if students’ level of proficiency in English is controlled, the differences between the performance of LEP and non-LEP students in math may diminish. To shed light on this issue and to answer the question of the degree of impact of students’ language proficiency on math performance, scores on the NAEP reading comprehension test were used as a covariate in a simple two- factor analysis of covariance (ANCOVA) design (see Table 8).
Comparing the earlier ANOVA findings (Table 5) with the ANCOVA findings in Table 8 reveals the impact of students’ reading proficiency on their math performance. After controlling for students’ reading levels (as measured by the NAEP reading achievement test), there were still significant differences in students’ math test scores, by type of math test accommodation (F-ratio = 2.55, df = 4,885, p =
.038) and by students’ LEP status (F-ratio = 52.15, df = 1,885, p = .OOO). However, when a measure of English reading proficiency entered the analysis, the effects due to the accommodations and LEP status, as well as their interaction effect, become less evident. Additionally, there were no significant interaction effects between students’ LEP status and the type of test booklet the students. received (F-ratio =
1.83, df = 4, 885; p = .121).
For example, a coefficient of determination of 0.15 was obtained when LEP and non-LEP student groups were compared on their math performance without
Table 8
ANCOVA Results for Math Scores by Accommodation and LEP Status, Using Reading Score as Covariate
Sum of Mean Signif. Source of variation squares df squares F-ratio contrasts
Type of accommodation (A) 345.96 4 86.49 2.55*
LEP status (B) 1767.36 1 1767.36 52.15** Bl,B2
Interaction effects (AxB) 248.10 4 62.03 1.83
Covariate (Reading score) 4166.57 1 4166.57 122.95**
Witlun subjects 29990.84 885 33.89
Total 40801.71 895 45.59
* p < .05. **p c .01.
31
4 2

controlling for language. When the reading score was entered as a covariate, however, this coefficient was reduced to 0.05. That is, two thirds of the variance in math scores between LEP and non-LEP students was explained by level of reading proficiency. These analyses suggest that students’ reading level has a substantial impact on their performance in the mathematics content area.
One might expect reading proficiency to have a greater impact on math performance. This study measured reading proficiency with a test that included items on interpretation and metaphor. In future studies, it may be desirable to use a reading test that focuses more narrowly on understanding expository prose.
Teacher and School Effects
If there are large significant differences between students’ performance at different schools or between students taught by different teachers, those factors must also be accounted for using other analytical techniques (e.g., hierarchical linear models). Although random assignment of booklets to students within classrooms largely controls for the overall teacher and school effects, we were nonetheless interested in whether school and/ or teacher characteristics that were not controlled for by random assignment affected students’ NAEP math performance.
To test the hypothesis of no significant difference between students’ performance at different schools taught by different teachers, simple one-factor ANOVAs were performed on the data, using teachers and schools as independent variables and NAEP math and reading scores as dependent variables. Table 9 presents the results of the ANOVA with math test scores as a dependent variable and school (6 levels) as the independent variable. The average math score was 14.77 (SD = 6.76, n = 946), with school means ranging from 13.07 to 16.45 (out of 35 points possible). Further, students’ NAEP math scores were significantly different across the six schools participating in this study, well beyond the nominal level of .01 (F- ratio = 7.37, df= 5,940, p = ,000).
Similar results were obtained for NAEP reading test scores when students were compared across schools (see Table 10). The average reading score was 5.05 ( S D =
3.23, n = 946), with school reading test means ranging from 4.17 to 5.95 (out of 11 points possible). Additionally, students differed significantly on the reading test by participating school (F-ratio = 7.34, df= 5,940, p = .OOO).
Tables 11 and 12 summarize the results of simple one-way ANOVA analyses for NAEP math and reading test scores by teacher. The average math scores, by
32
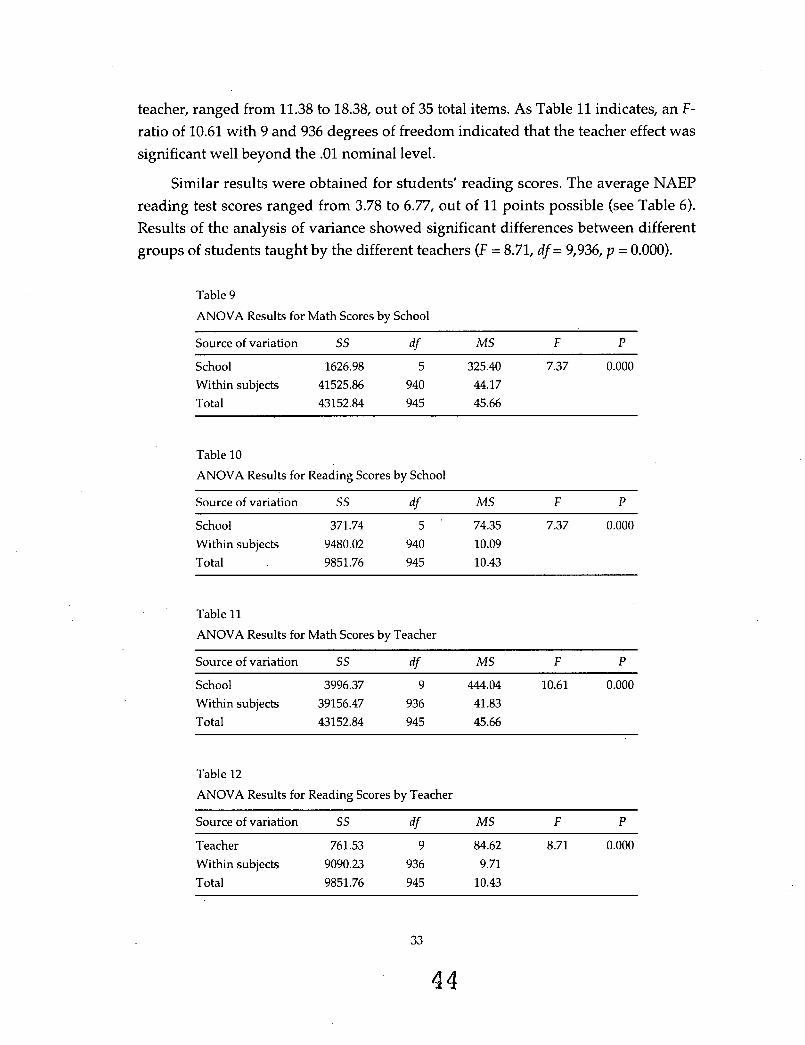
teacher, ranged from 11.38 to 18.38, out of 35 total items. As Table 11 indicates, an F- ratio of 10.61 with 9 and 936 degrees of freedom indicated that the teacher effect was significant well beyond the .01 nominal level.
Similar results were obtained for students’ reading scores. The average NAEP reading test scores ranged from 3.78 to 6.77, out of 11 points possible (see Table 6). Results of the analysis of variance showed significant differences between different groups of students taught by the different teachers ( F = 8.71, df= 9,936, p = 0.000).
Table 9
ANOVA Results for Math Scores by School
Source of variation ss df MS F P
School 1626.98 5 325.40 7.37 0.000 Within subjects 41525.86 940 44.17 Total 43 152.84 945 45.66
Table 10
ANOVA Results for Reading Scores by School
Source of variation ss df MS F P
School 371.74 5 74.35 7.37 0.000 Within subjects 9480.02 940 10.09 Total 9851.76 945 10.43
Table 11 ANOVA Results for Math Scores by Teacher
Source of variation ss df MS F P
School 3996.37 9 444.04 10.61 0.000 Within subjects 39156.47 936 41.83 Total 43152.84 945 45.66
Table 12
ANOVA Results for Reading Scores by Teacher
Source of variation ss df MS F P
Teacher 761.53 9 84.62 8.71 0.000 Within subjects 9090.23 936 9.71 Total 9851.76 945 10.43
33
4 4
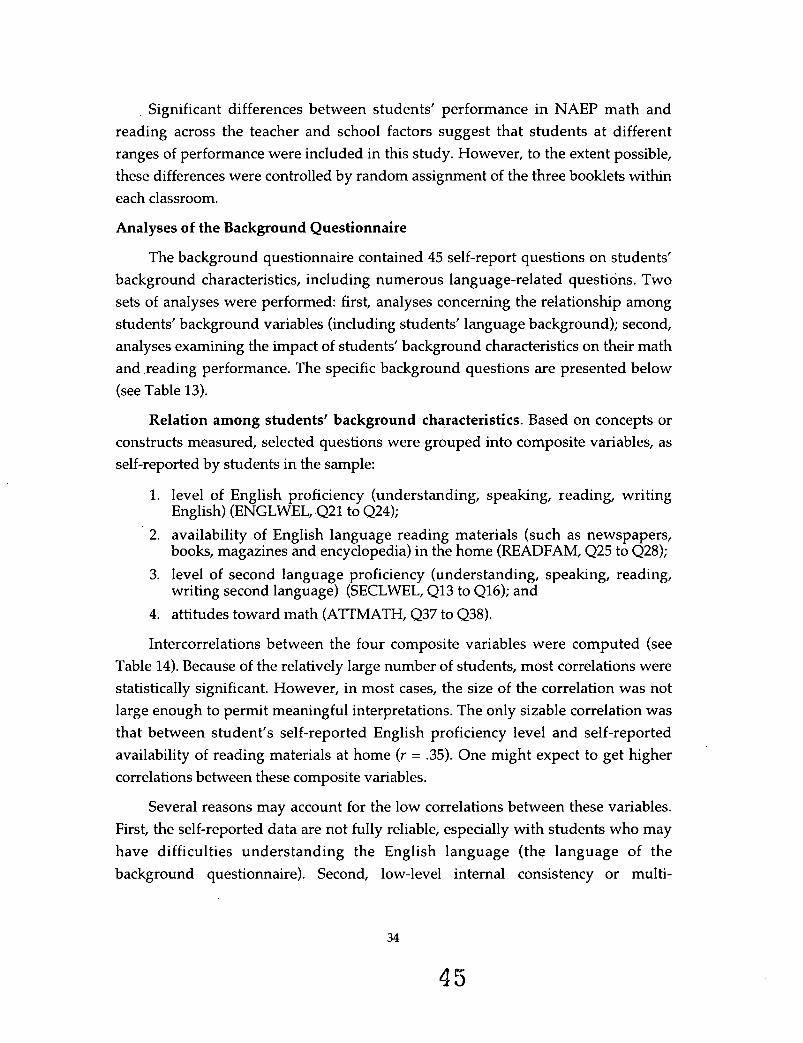
, Significant differences between students’ performance in NAEP math and reading across the teacher and school factors suggest that students at different ranges of performance were included in this study. However, to the extent possible, these differences were controlled by random assignment of the three booklets withm each classroom.
Analyses of the Background Questionnaire
The background questionnaire contained 45 self-report questions on students’ background characteristics, including numerous language-related questions. Two sets of analyses were performed: first, analyses concerning the relationship among students’ background variables (including students’ language background); second, analyses examining the impact of students’ background characteristics on their math and .reading performance. The specific background questions are presented below (see Table 13).
Relation among students’ background characteristics. Based on concepts or constructs measured, selected questions were grouped into composite variables, as self-reported by students in the sample:
1. level of English proficiency (understanding, speaking, reading, writing English) (ENGLWEL, Q21 to Q24);
2. availability of English language reading materials (such as newspapers, books, magazines and encyclopedia) in the home (READFAM, Q25 to Q28);
3. level of second language proficiency (understanding, speaking, reading, writing second language) (SECLWEL, Q13 to Q16); and
4. attitudes toward math (ATTMATH, Q37 to Q38).
Intercorrelations between the four composite variables were computed (see Table 14). Because of the relatively large number of students, most correlations were statistically significant. However, in most cases, the size of the correlation was not large enough to permit meaningful interpretations. The only sizable correlation was that between student’s self-reported English proficiency level and self-reported availability of reading materials at home (Y = .35). One might expect to get higher correlations between these composite variables.
Several reasons may account for the low correlations between these variables. First, the self-reported data are not fully reliable, especially with students who may have difficulties understanding the English language (the language of the background questionnaire). Second, low-level internal consistency or multi-
34
45
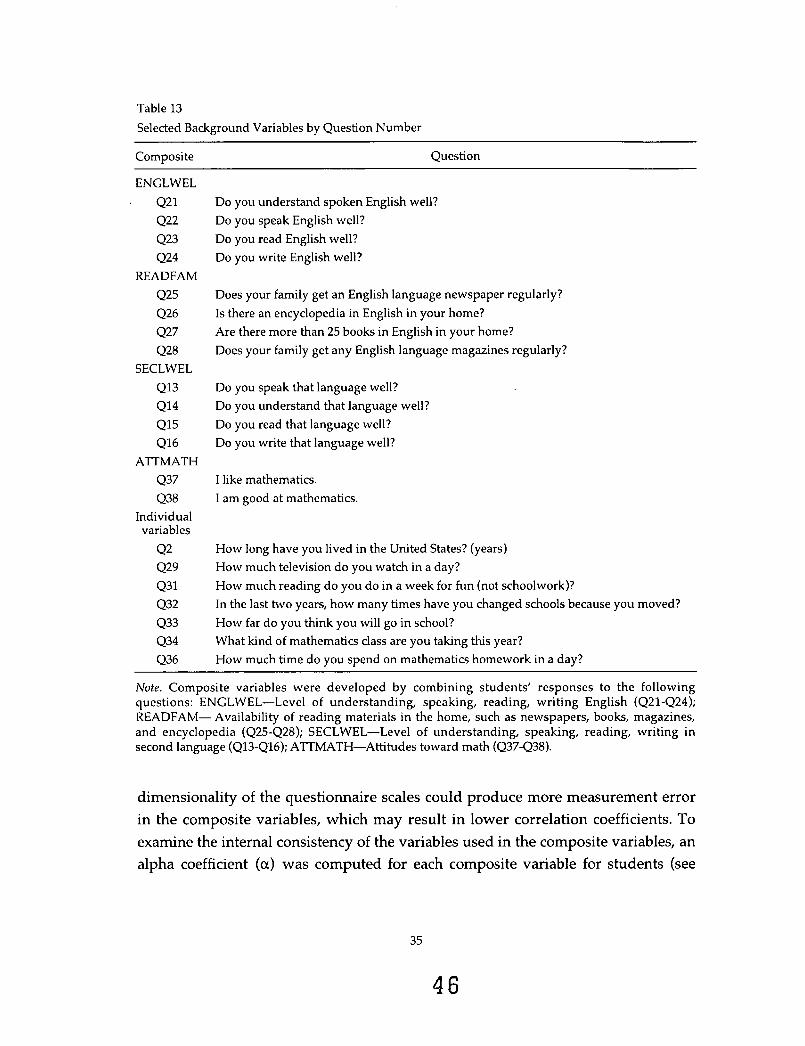
Table 13 Selected Background Variables by Question Number
Composite Question
ENGLWEL Q21 Q22 Q23 Q24
READFAM Q25 Q26 Q27 Q28
SECLWEL Q13 Q14 Q15 Q16
Q37 Q38
Individual variables
Q2 Q29 Q31 Q32 Q33 Q34 Q36
ATTMATH
Do you understand spoken English well? Do you speak English well? Do you read English well? Do you write English well?
Does your family get an English language newspaper regularly? Is there an encyclopedia in English in your home? Are there more than 25 books in English in your home? Does your family get any English language magazines regularly?
Do you speak that language well? Do you understand that language well? Do you read that language well? Do you write that language well?
I like mathematics. I am good at mathematics.
How long have you lived in the United States? (years) How much television do you watch in a day? How much reading do you do in a week for fun (not schoolwork)? In the last two years, how many times have you changed schools because you moved? How far do you think you will go in school? What kind of mathematics class are you taking this year? How much time do you spend on mathematics homework in a day?
Note. Composite variables were developed by combining students’ responses to the following questions: ENGLWEL-Level of understanding, speaking, reading, writing English (Q21-Q24); READFAM- Availability of reading materials in the home, such as newspapers, books, magazines, and encyclopedia (Q25-Q28); SECLWEL-Level of understanding, speaking, reading, writing in second language (Q13-Ql6); ATTMATH-Attitudes toward math (Q37-Q38).
dimensionality of the questionnaire scales could produce more measurement error in the composite variables, which may result in lower correlation coefficients. To examine the internal consistency of the variables used in the composite variables, an alpha coefficient (a) was computed for each composite variable for students (see
35
4 6
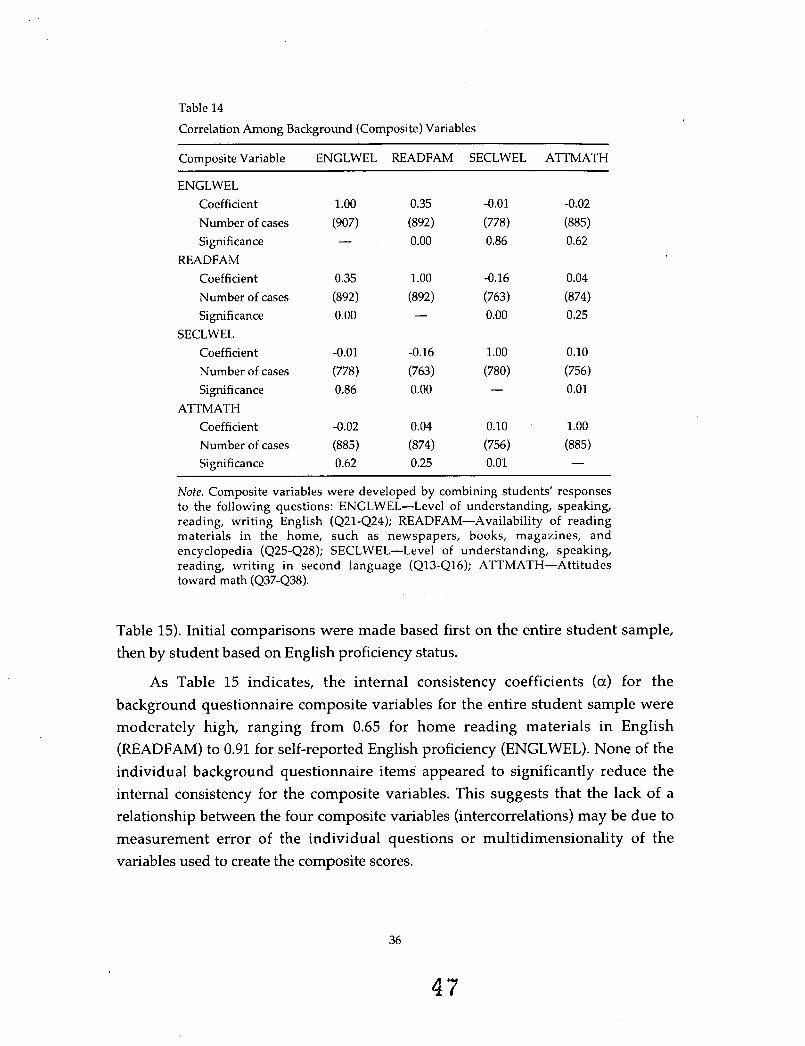
Table 14
Correlation Among Background (Composite) Variables ~ ~~
Composite Variable ENGLWEL READFAM SECLWEL ARMATH
ENGLWEL Coefficient 1.00 0.35 -0.01 -0.02
Number of cases (907) (892) (778) (885) Significance - 0.00 0.86 0.62
Coefficient 0.35 1.00 -0.16 0.04 Number of cases (892) (892) (763) (874) Significance 0.00 - 0.00 0.25
Coefficient -0.01 -0.16 1.00 0.10
Number of cases (778) (763) (780) (756) Significance 0.86 0.00 - 0.01
READFAM
SECLWEL
ATTMATH Coefficient -0.02 0.04 0.10 1.00 Number of cases (885) (874) (756) (885) Significance 0.62 0.25 0.01 -
Note. Composite variables were developed by combining students' responses to the following questions: ENGLWEL-Level of understanding, speaking, reading, writing English (Q21-Q24); READFAM-Availability of reading materials in the home, such as newspapers, books, magazines, and encyclopedia (Q25-Q28); SECLWEL-Level of understanding, speaking, reading, writing in second language (Q13-Ql6); ATTMATH-Attitudes toward math (Q37-Q38).
Table 15). Initial comparisons were made based first on the entire student sample, then by student based on English proficiency status.
As Table 15 indicates, the internal consistency coefficients (a) for the background questionnaire composite variables for the entire student sample were moderately high, ranging from 0.65 for home reading materials in English (READFAM) to 0.91 for self-reported English proficiency (ENGLWEL). None of the individual background questionnaire items appeared to significantly reduce the internal consistency for the composite variables. This suggests that the lack of a relationship between the four composite variables (intercorrelations) may be due to measurement error of the individual questions or multidimensionality of the variables used to create the composite scores.
36
4 7
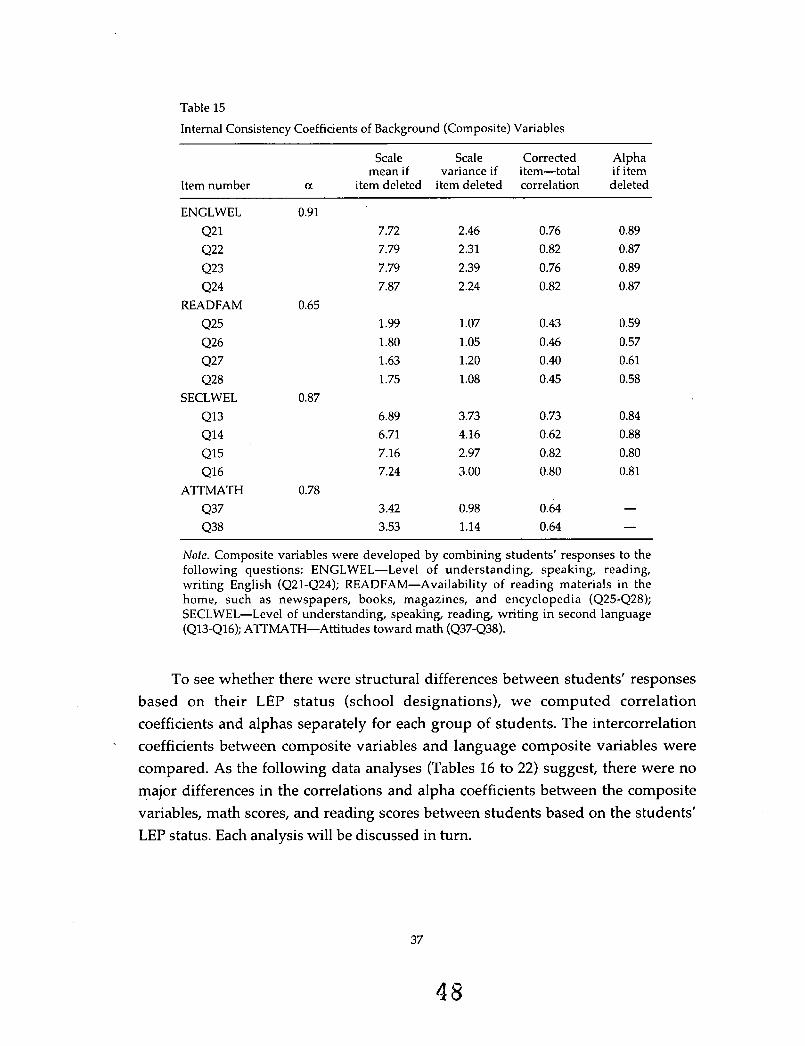
Table 15
Internal Consistency Coefficients of Background (Composite) Variables
Scale Scale Corrected Alpha mean if variance if item-total if item
Item number a item deleted item deleted correlation deleted _____~ ~
ENGLWEL
Q21 Q22 Q23 Q24
READFAM Q25 Q26 Q27 Q28
SECLWEL Q13 Q14 Q15 Q16
ATTMATH
0.91 7.72 7.79 7.79 7.87
0.65 1.99 1.80 1.63 1.75
0.87 6.89 6.71 7.16 7.24
0.78
2.46 2.31 2.39 2.24
1.07 1.05 1.20 1.08
3.73 4.16 2.97 3.00
0.76 0.82 0.76 0.82
0.43 0.46 0.40 0.45
0.73 0.62 0.82 0.80
0.89 0.87 0.89 0.87
0.59 0.57 0.61 0.58
0.84 0.88 0.80 0.81
3.42 0.98 0.64 - 3.53 1.14 0.64 -
Q37 Q38
Note. Composite variables were developed by combining students' responses to the following questions: ENGLWEL-Level of understanding, speaking, reading, writing English (Q21-QZ4); READFAM-Availability of reading materials in the home, such as newspapers, books, magazines, and encyclopedia (Q25-QZ8); SECLWEL-Level of understanding, speaking, reading, writing in second language (Q13-Ql6); ATTMATH-Attitudes toward math (Q37-Q38).
To see whether there were structural differences between students' responses based on their LEP status (school designations), we computed correlation coefficients and alphas separately for each group of students. The intercorrelation coefficients between composite variables and language composite variables were compared. As the following data analyses (Tables 16 to 22) suggest, there were no major differences in the correlations and alpha coefficients between the composite variables, math scores, and reading scores between students based on the students' LEP status. Each analysis will be discussed in turn.
*
37
48
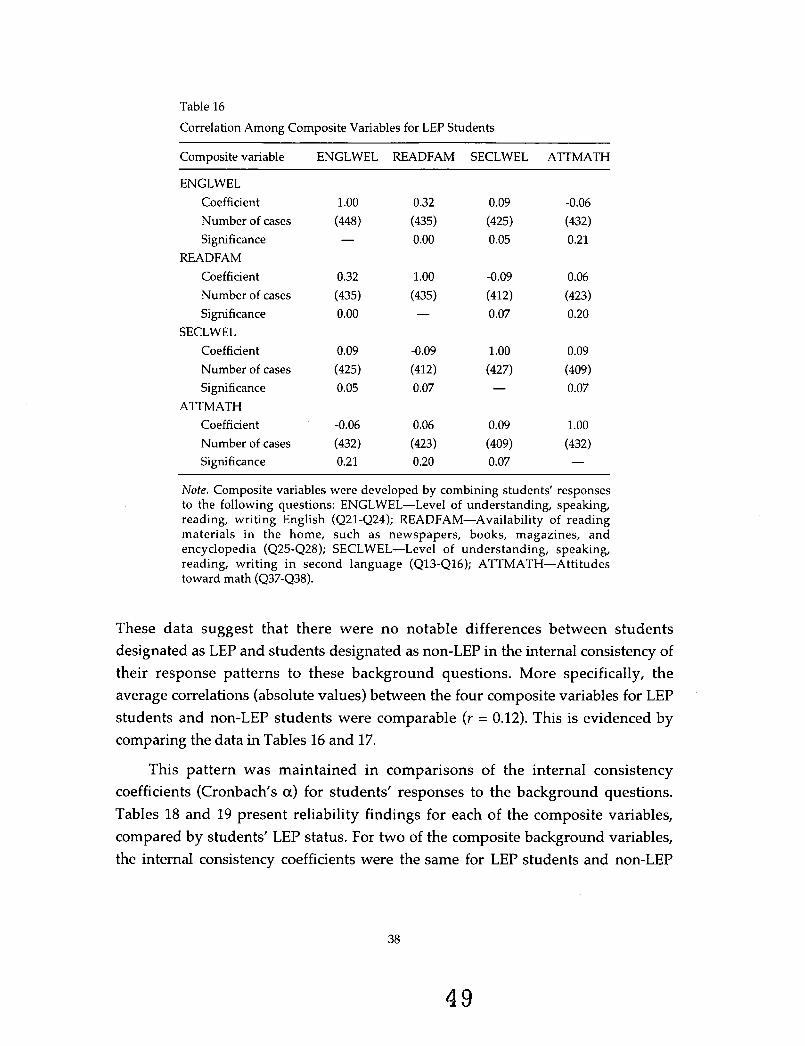
Table 16
Correlation Among Composite Variables for LEP Students
Composite variable ENGLWEL READFAM SECLWEL ATTMATH
ENGLWEL Coefficient Number of cases Significance
Coefficient Number of cases Significance
Coefficient Number of cases Significance
Coefficient Number of cases Significance
READFAM
SECLWEL
A’ITMATH
1 .oo (448)
0.32 (435) 0.00
0.09
(425) 0.05
-0.06 (432) 0.21
0.32
(435) 0.00
1.00 (435)
-0.09
(412) 0.07
0.09 (425) 0.05
-0.09 (412) 0.07
0.09
(409) 0.07
-0.06 (432) 0.21
0.06
(423) 0.20
0.09
(409) 0.07
Note. Composite variables were developed by combining students’ responses to the following questions: ENGLWEL-Level of understanding, speaking, reading, writing English (Q21-Q24); READFAM-Availability of reading materials in the home, such as newspapers, books, magazines, and encyclopedia (Q25-Q28); SECLWEL-Level of understanding, speaking, reading, writing in second language (Q13-Ql6); ATTMATH-Attitudes toward math (Q37-Q38).
These data suggest that there were no notable differences between students designated as LEI’ and students designated as non-LEP in the internal consistency of their response patterns to these background questions. More specifically, the average correlations (absolute values) between the four composite variables for LEP students and non-LEP students were comparable (Y = 0.12). This is evidenced by comparing the data in Tables 16 and 17.
This pattern was maintained in comparisons of the internal consistency coefficients (Cronbachs a) for students’ responses to the background questions. Tables 18 and 19 present reliability findings for each of the composite variables, compared by students’ LEP status. For two of the composite background variables, the internal consistency coefficients were the same for LEP students and non-LEP
38
4 9
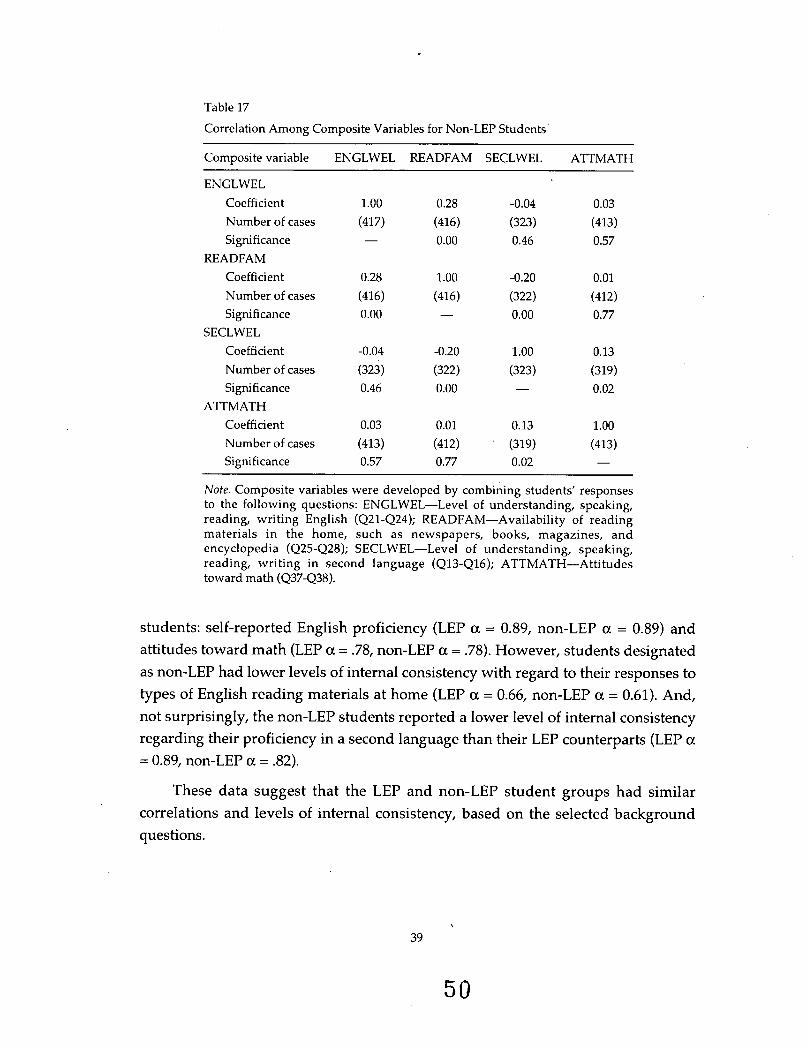
Table 17
Correlation Among Composite Variables for Non-LEP Students
Composite variable ENGLWEL READFAM SECLWEL ATTMATH
ENGLWEL Coefficient Number of cases Significance
Coefficient Number of cases Significance
Coefficient Number of cases Significance
Coefficient Number of cases Significance
READFAM
SECLWEL
AlTMATH
1.00 (417)
0.28 (416) 0.00
0.03 (413) 0.57
0.28 (416) 0.00
-0.04
(323) 0.46
0.03 (413) 0.57
1 .oo (416)
-0.20 (322) 0.00
0.01
(412) 0.77
1.00
(323)
0.01
(412) 0.77
0.13
(319) 0.02
1.00
(413)
Note. Composite variables were developed by combining students’ responses to the following questions: ENGLWEL-Level of understanding, speaking, reading, writing English (Q21-Q24); READFAM-Availability of reading materials in the home, such as newspapers, books, magazines, and encyclopedia (Q25-Q28); SECLWEL-Level of understanding, speaking, reading, writing in second language (Q13-Ql6); ATTMATH-Attitudes toward math (Q37-Q38).
students: self-reported English proficiency (LEP a = 0.89, non-LEP a = 0.89) and attitudes toward math (LEP a = .78, non-LEP a = .78). However, students designated as non-LEP had lower levels of internal consistency with regard to their responses to types of English reading materials at home (LEP a = 0.66, non-LEP a = 0.61). And, not surprisingly, the non-LEP students reported a lower level of internal consistency regarding their proficiency in a second language than their LEP counterparts (LEI’ a = 0.89, non-LEP a = .82).
These data suggest that the LEP and non-LEP student groups had similar correlations and levels of internal consistency, based on the selected background questions.
39
50
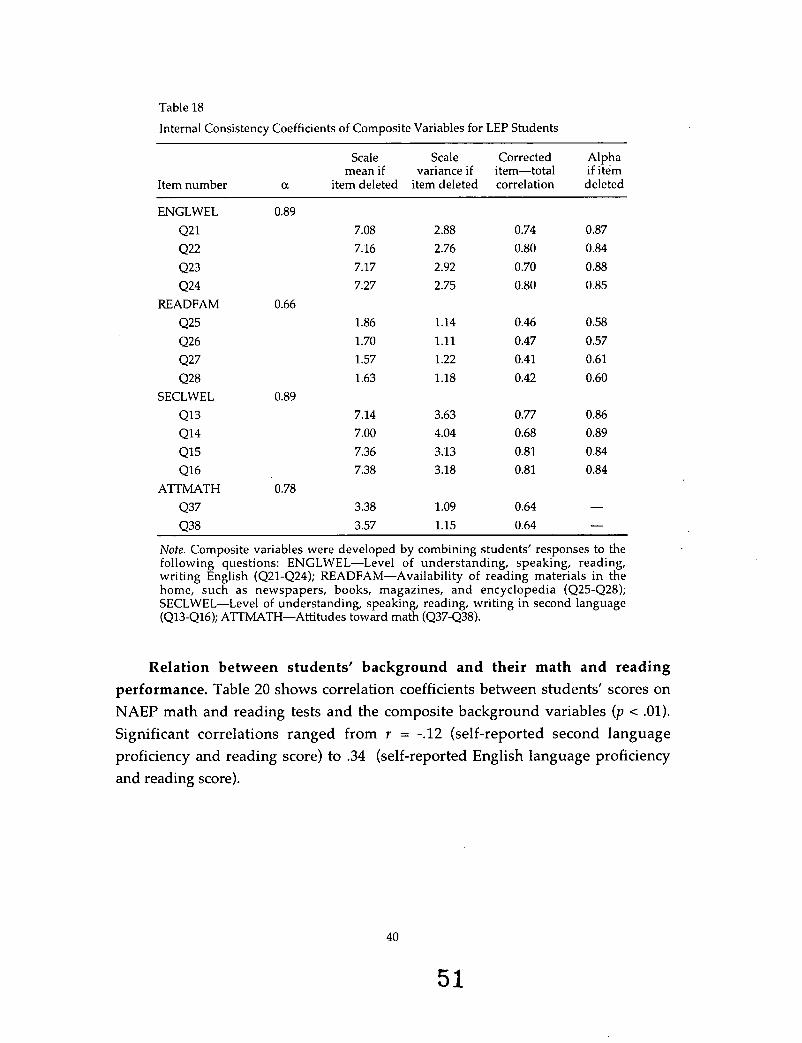
Table 18
Internal Consistency Coefficients of Composite Variables for LEP Students
Scale Scale Corrected Alpha mean if variance if item-total if item
Item number ci item deleted item deleted correlation deleted ~
ENGLWEL Q21 Q22 Q23 Q24
READFAM Q25 Q26 Q27 Q28
0.89 7.08 7.16 7.17 7.27
0.66 1.86 1.70 1.57 1.63
2.88 2.76 2.92 2.75
1.14 1.11 1.22 1.18
0.74 0.80 0.70 0.80
0.46 0.47 0.41 0.42
0.87 0.84 0.88 0.85
0.58 0.57 0.61 0.60
SECLWEL 0.89 Q13 7.14 3.63 0.77 0.86 Q14 7.00 4.04 0.68 0.89 Q15 7.36 3.13 0.81 0.84 Q16 7.38 3.18 0.81 0.84
3.38 1.09 0.64 - Q37 3.57 1.15 0.64 - Q38
A’ITMATH 0.78
Note. Composite variables were developed by combining students’ responses to the following questions: ENGLWEL-Level of understanding, speaking, reading, writing English (Q21-Q24); READFAM-Availability of reading materials in the home, such as newspapers, books, magazines, and encyclopedia (Q25-Q28); SECLWEL-Level of understanding, speaking, reading, writing in second language (Q13-Ql6); ATMATH-Attitudes toward math (Q37-Q38).
Relation between students’ background and their math and reading performance. Table 20 shows correlation coefficients between students’ scores on NAEP math and reading tests and the composite background variables ( p c .01). Significant correlations ranged from r = -.12 (self-reported second language proficiency and reading score) to .34 (self-reported English language proficiency and reading score).
40
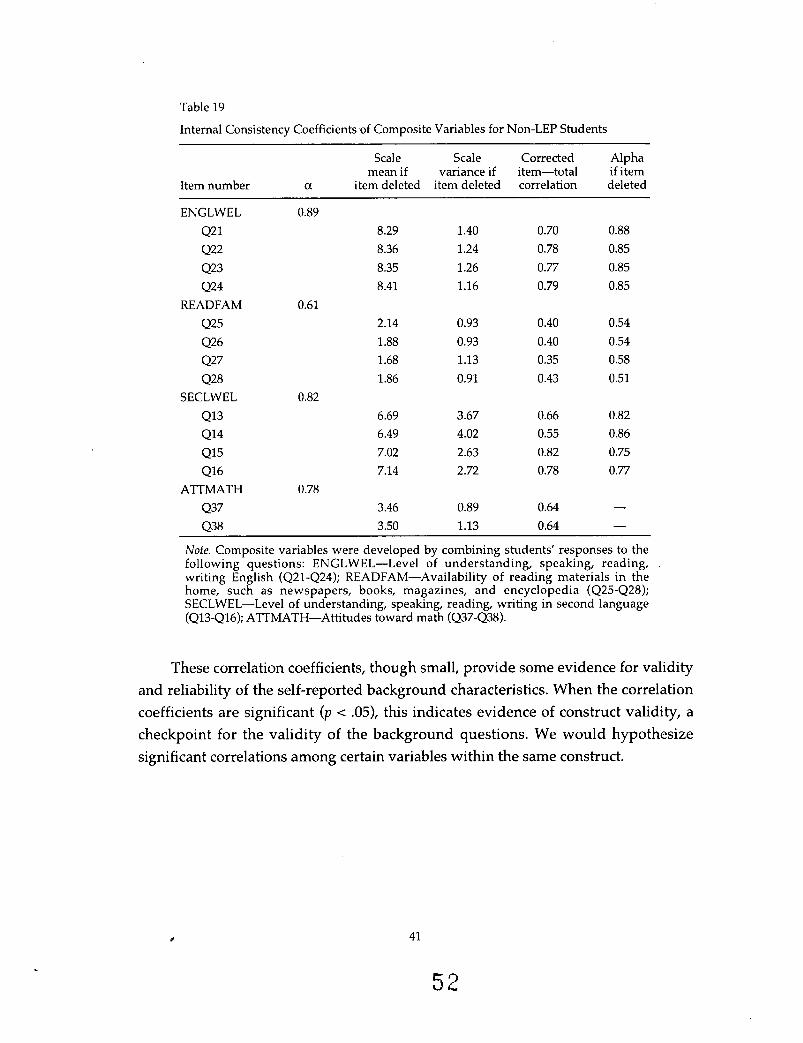
Table 19
Internal Consistency Coefficients of Composite Variables for Non-LEP Students
Scale Scale Corrected Alpha mean if variance if item-total if item
Item number a item deleted item deleted correlation deleted
ENGLWEL 0.89 Q21 8.29 1.40 0.70 0.88 Q22 8.36 1.24 0.78 0.85 Q23 8.35 1.26 0.77 0.85 Q24 8.41 1.16 0.79 0.85
READFAM Q25 Q26 Q27
0.61 2.14 0.93 0.40 0.54 1.88 0.93 0.40 0.54 1.68 1.13 0.35 0.58
Q28 1.86 0.91 0.43 0.51 SECLWEL 0.82
Q13 6.69 3.67 0.66 0.82 Q14 6.49 4.02 0.55 0.86 Q15 7.02 2.63 0.82 0.75 Q16 7.14 2.72 0.78 0.77
3.46 0.89 0.64 - Q37 3.50 1.13 0.64 - Q38
ATTMATH 0.78
Note. Composite variables were developed by combining students’ responses to the following questions: ENGLWEL-Level of understanding, speaking, reading, writing English (Q21-Q24); READFAM-Availability of reading materials in the home, such as newspapers, books, magazines, and encyclopedia (Q25-Q28); SECLWEL-Level of understanding, speaking, reading, writing in second language (Q13-Q16); ATTMATH-Attitudes toward math (Q37-Q38).
These correlation coefficients, though small, provide some evidence for validity and reliability of the self-reported background characteristics. When the correlation coefficients are significant ( p -= .05), this indicates evidence of construct validity, a checkpoint for the validity of the background questions. We would hypothesize significant correlations among certain variables withn the same construct.
41
5 2
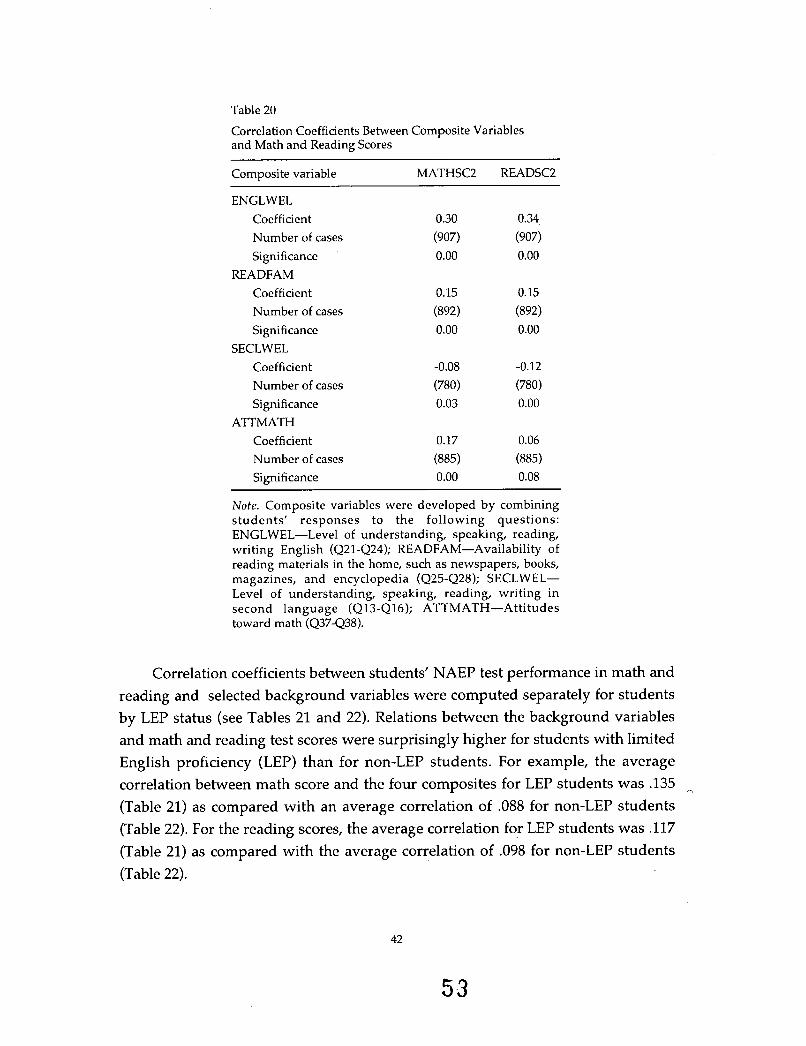
Table 20
Correlation Coefficients Between Composite Variables and Math and Reading Scores
Composite variable MATHSC2 READSC2
ENGLWEL Coefficient 0.30 0.34 Number of cases (907) (907) Significance 0.00 0.00
READFAM Coefficient 0.15 0.15 Number of cases (892) (892) Significance 0.00 0.00
SECLWEL Coefficient -0.08 -0.12 Number of cases (780) (780) Significance 0.03 0.00
ATTMATH Coefficient 0.17 0.06 Number of cases (885) (885) Significance 0.00 0.08
Note. Composite variables were developed by combining students' responses to the following questions: ENGLWEL-Level of understanding, speaking, reading, writing English (Q21-Q24); READFAM-Availability of reading materials in the home, such as newspapers, books, magazines, and encyclopedia (Q25-Q28); SECLWEL- Level of understanding, speaking, reading, writing in second language (Q13-Ql6); ATTMATH-Attitudes toward math (Q37-Q38).
Correlation coefficients between students' NAEP test performance in math and reading and selected background variables were computed separately for students by LEP status (see Tables 21 and 22). Relations between the background variables and math and reading test scores were surprisingly higher for students with limited English proficiency (LEP) than for non-LEP students. For example, the average correlation between math score and the four composites for LEI' students was .135 ~
(Table 21) as compared with an average correlation of .088 for non-LEP students (Table 22). For the reading scores, the average correlation for LEP students was .117 (Table 21) as compared with the average correlation of .098 for non-LEP students (Table 22).
42
5 3
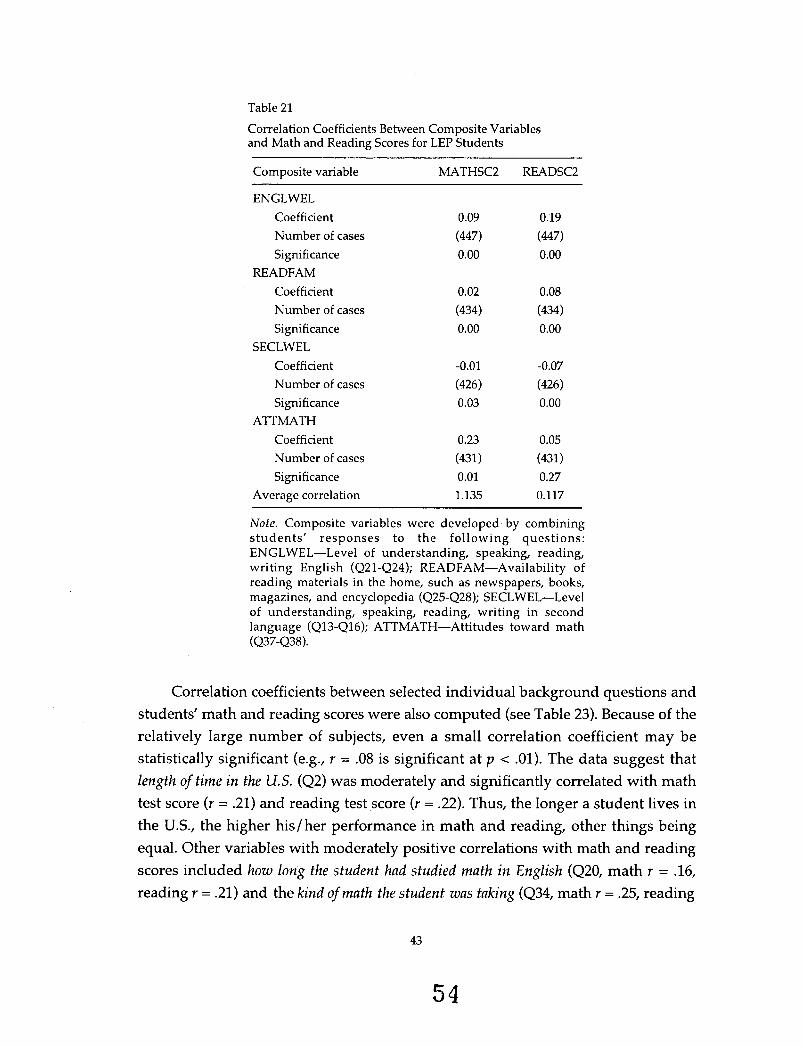
Table 21
Correlation Coefficients Between Composite Variables and Math and Reading Scores for LEI’ Students
Composite variable MATHSC2 READSC2
ENGLWEL Coefficient Number of cases Significance
Coefficient Number of cases Significance
Coefficient Number of cases Significance
Coefficient Number of cases Significance
Average correlation
READFAM
SECLWEL
AlTMATH
0.09 (447) 0.00
0.02 (434) 0.00
-0.01 (426) 0.03
0.23 (431 1 0.01 1.135
0.19 (447) 0.00
0.08 (434) 0.00
-0.07 (426) 0.00
0.05 (431) 0.27 0.117
Note. Composite variables were developed by combining students’ responses to the following questions: ENGLWEL-Level of understanding, speaking, reading, writing English (Q21-Q24); READFAM-Availability of reading materials in the home, such as newspapers, books, magazines, and encyclopedia (Q25-Q28); SECLWEL-Level of understanding, speaking, reading, writing in second language (Q13-Ql6); ATTMATH-Attitudes toward math (Q37-Q38).
Correlation coefficients between selected individual background questions and students’ math and reading scores were also computed (see Table 23). Because of the relatively large number of subjects, even a small correlation coefficient may be statistically significant (e.g., r = .08 is significant at p < .Ol ) . The data suggest that length of time in the U.S. (Q2) was moderately and significantly correlated with math test score (r = .21) and reading test score (r = .22). Thus, the longer a student lives in the U.S., the higher his/her performance in math and reading, other things being equal. Other variables with moderately positive correlations with math and reading scores included how Zong the student had studied math in English (Q20, math r = .16, reading Y = .21) and the kind ofmath the student wus taking (Q34, math r = .25, reading
43
54
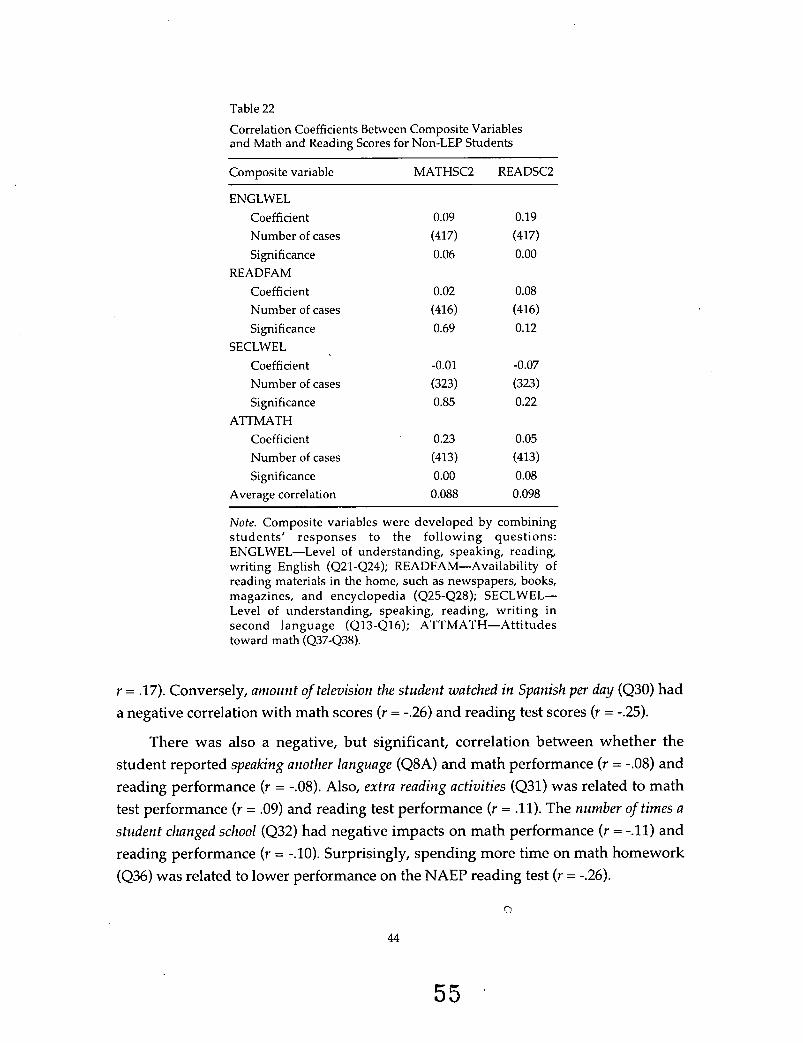
Table 22
Correlation Coefficients Between Composite Variables and Math and Reading Scores for Non-LEP Students
Composite variable MATHSC2 READSC2
ENGLWEL Coefficient Number of cases Significance
Coefficient Number of cases Significance
READFAM
SECLWEL
0.09 0.19 (417) (417) 0.06 0.00
0.02 0.08
(416) (416) 0.69 0.12
Coefficient -0.01 -0.07 Number of cases (323) (323) Significance 0.85 0.22
ATTMATH Coefficient 0.23 0.05 Number of cases (413) (413) Significance 0.00 0.08
Average correlation 0.088 0.098
Note. Composite variables were developed by combining students’ responses to the following questions: ENGLWEL-Level of understanding, speaking, reading, writing English (Q21-Q24); READFAM-Availability of reading materials in the home, such as newspapers, books, magazines, and encyclopedia (Q25-QZ8); SECLWEL- Level of understanding, speaking, reading, writing in second language (Q13-Ql6); ATTMATH-Attitudes toward math (Q37-Q38).
r = .17). Conversely, amount oftelevision the student watched in Spanish per day (Q30) had a negative correlation with math scores (r = -.26) and reading test scores (r = -.25).
There was also a negative, but significant, correlation between whether the student reported speaking another language (Q8A) and math performance (Y = -.08) and reading performance (r = -.08). Also, extra reading activities (Q31) was related to math test performance ( r = .09) and reading test performance (r = .11). The number of times a student changed school (Q32) had negative impacts on math performance ( r = -.11) and reading performance (r = -.lo). Surprisingly, spending more time on math homework (Q36) was related to lower performance on the NAEP reading test (r = -.26).
44
55
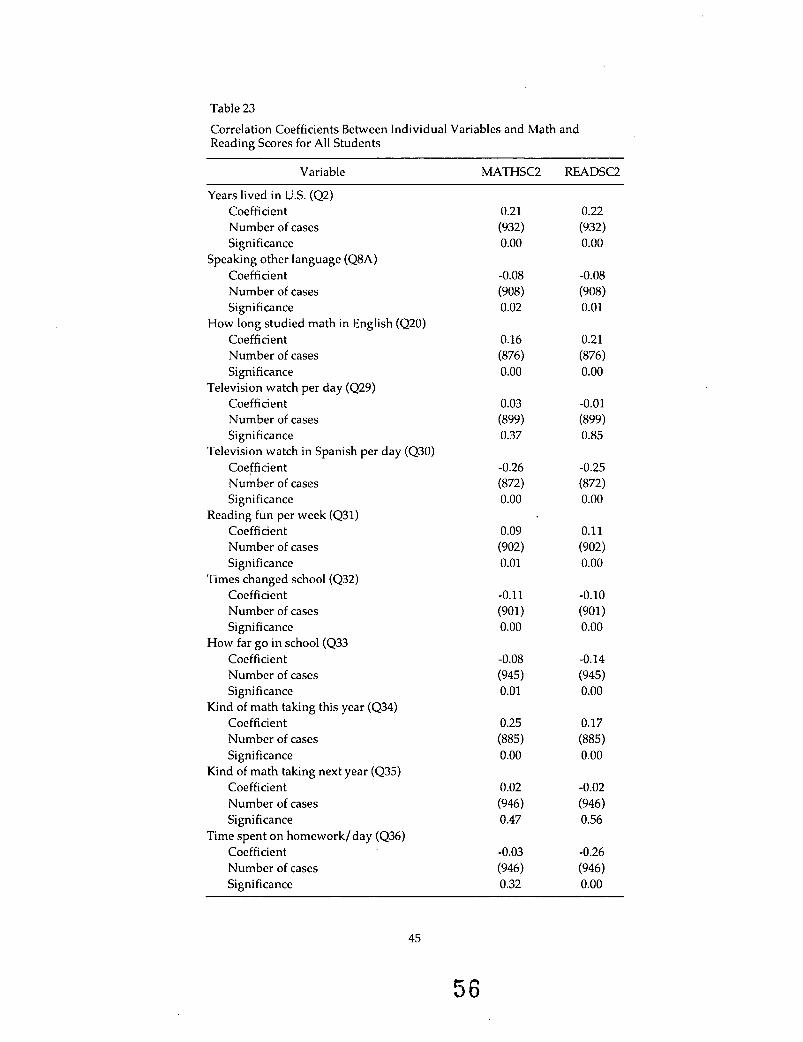
Table 23
Correlation Coefficients Between Individual Variables and Math and Reading Scores for All Students
Variable MATHSC2 READSC2
Years lived in US. (Q2) Coefficient Number of cases Significance
Coefficient Number of cases Significance
Coefficient Number of cases Significance
Coefficient Number of cases Significance
Coefficient Number of cases Significance
Coefficient Number of cases Significance
Coefficient Number of cases Significance
How far go in school (Q33 Coefficient Number of cases Significance
Coefficient Number of cases Significance
Coefficient Number of cases Significance
Coefficient Number of cases Significance
Speaking other language (Q8A)
How long studied math in English (Q20)
Television watch per day (Q29)
Television watch in Spanish per day (Q30)
Reading fun per week (Q31)
Times changed school (Q32)
Kind of math taking this year (Q34)
Kind of math taking next year (Q35)
Time spent on homework/day (Q36)
0.21
0.00
-0.08 (908) 0.02
0.16 (876) 0.00
0.03 (899) 0.37
(932)
-0.26 (872) 0.00
0.09 (902) 0.01
-0.11 (901) 0.00
-0.08
0.01
0.25 (885) 0.00
0.02 (946) 0.47
(945)
-0.03 (946) 0.32
0.22
0.00
-0.08 (908) 0.01
0.21 (876) 0.00
-0.01 (899) 0.85
(932)
-0.25 (872) 0.00
0.11 (902) 0.00
-0.10 (901 ) 0.00
-0.14 (945) 0.00
0.17 (885) 0.00
-0.02 (946) 0.56
-0.26 (946) 0.00
45
56

Designation of LEP Status
The language background data can tell us how students choose to report their proficiency in Academic English skills. Items Q23 and Q24 asked the student whether s/ he reads (Q23) and writes (Q24) English very well, fairly well, or not very well. We selected students who answered either item as fairly well or not very wel2, and furthermore described themselves as Hispanic (Q7) and reported speaking a language besides English with parents always or most of the time (Q9). This group, totaling 326 students, we designated ”Limited Academic English by Self-Report.” We then identified those students who described themselves as Hispanic and were designated LEP by their schools (360 total). When we compared the self-reported group with the school-designated group, we found that only 249 students were in both groups (69% agreement) (see Table 24).
Predictors of Math and Reading Performance
In addition to identifying the relations between specific background variables and student NAEP test performance (evidenced by correlations), we were interested in the relative effects of selected individual background variables on student performance. To address this question, two multiple regression analyses were conducted. The math and reading scores served as the dependent variables, respectively, and selected background variables were the predictors. These background variables were selected to examine their impact on students’ academic progress. The two equations were run once for all students and once for the students designated as limited English proficient only (school designation).
Table 25 summarizes the results of multiple regression analyses using math score as the criterion variable for all students (LEP and non-LEP). The ENTER option in SPSS was used to obtain estimates of the power of all independent variables used in this analysis in predicting the students’ math scores. The regression coefficients B (slope), standardized regression coefficient (p), standard
Table 24
Comparison of LEP Status
Background questionnaire (composite)
School designation LEP Non-LEP
LEP 293 180 Non-LEP 99 324
5 7

Table 25
Results of Multiple Regression Analysis Predicting Math Scores From Students’ Background Information (All Students)
Variable B SE B P t P
Numbers of years lived in U.S.’(Q2) Television watched per day (Q29) Reading for fun per week (Q31) Times changed schools (Q32) How far went in school (Q33) How much time spent on homework I like mathematics (Q37) How good at math are you? (Q38) (Constant)
0.352 0.135 0.160
-0.561 1.170
(Q36) 0.304 -0.129 1.324 1.941
0.059 0.140 0.160 0.273 0.219 0.201 0.262 0.282 1.378
0.197 0.031 0.033
-0.066 0.180 0.050
-0.020 0.192
6.01 0.000 0.97 0.334 1.00 0.318
-2.05 0.040 5.33 0.000 1.51 0.131
-0.49 0.623 4.69 0.000 1.41 0.159
Note. R = 0.374. R2 = 0.140.
error of B, a t-test indicating the significance of the slope and a p-value associated with the t-statistic are reported for each variable.
Of the 8 predictors, 4 had significant contributions in predicting NAEP math test scores. The multiple R for this equation was 0.374, with an R2 of 0.140 indicating that 14% of the variance in NAEP math scores was explained by the set of predictors used in this equation. The column under p shows (to some extent) the relative importance of the predictors. Based on the size of p relative to the standard error of the slope, the length of time lived in the United States (Q2) had the highest level of predictive power.
The next best predictors of students’ performance in math were howfur think will go in school (Q33), how good at math ure you (Q38), and times changed schools (Q32). Thus, variables related to students’ self-reported background may predict students’ math performance. For example, the longer students live in the U.S., the higher their performance in math tends to be. T h s indicates that language plays an important role in learning mathematics and expressing the learned knowledge through an assessment tool in the English language. Nonetheless, additional variables that are not currently in the regression model (e.g., attitude toward math and interest in math, plans for future schooling) may also influence performance. These variables should be incorporated into future studies examining the impact of selected student and classroom variables on student math test performance.
47
58
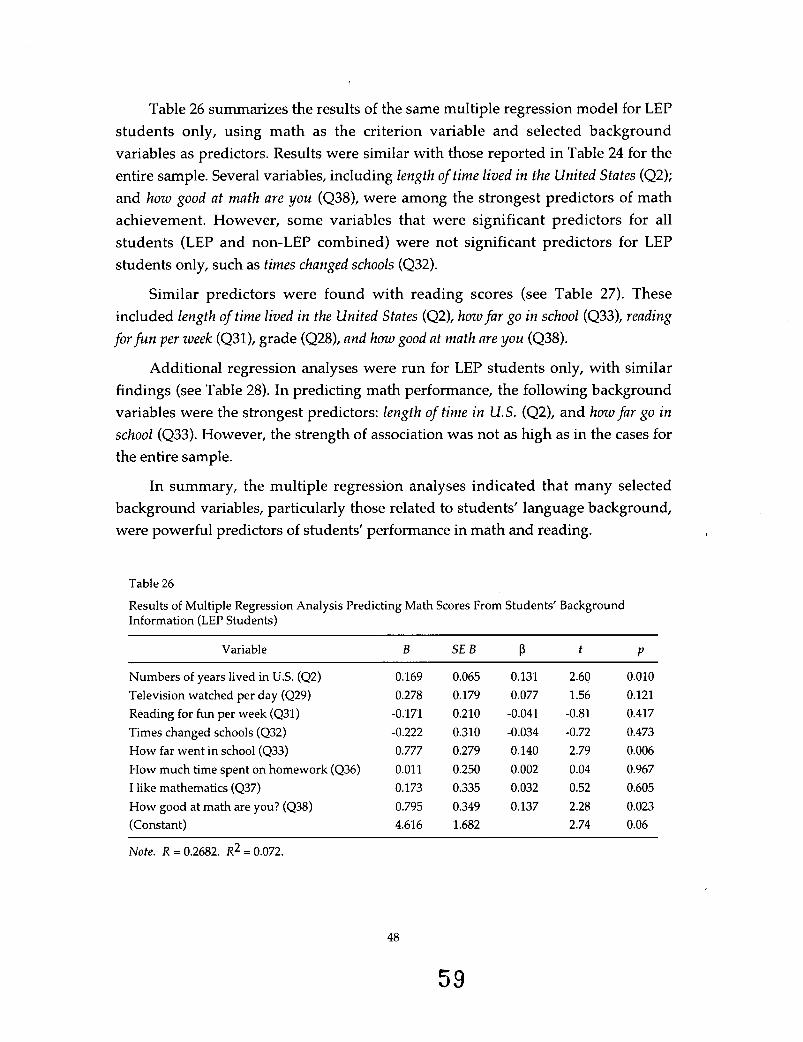
Table 26 summarizes the results of the same multiple regression model for LEP students only, using math as the criterion variable and selected background variables as predictors. Results were similar with those reported in Table 24 for the entire sample. Several variables, including length of time lived in the United States (Q2); and how good at math are you (Q38), were among the strongest predictors of math achievement. However, some variables that were significant predictors for all students (LEP and non-LEP combined) were not significant predictors for LEI’ students only, such as times changed schools (Q32).
Similar predictors were found with reading scores (see Table 27). These included length of time lived in the United States (Q2), howfar go in school (Q33), reading for fun per week (Q31), grade (Q28), and how good at math are you (Q38).
Additional regression analyses were run for LEP students only, with similar findings (see Table 28). In predicting math performance, the following background variables were the strongest predictors: length of time in U.S. (Q2), and how far go in school (Q33). However, the strength of association was not as high as in the cases for the entire sample.
In summary, the multiple regression analyses indicated that many selected background variables, particularly those related to students’ language background, were powerful predictors of students’ performance in math and reading.
Table 26
Results of Multiple Regression Analysis Predicting Math Scores From Students’ Background Information (LEP Students)
Variable B SE B P t P
Numbers of years lived in U.S. (Q2) 0.169 0.065 0.131 2.60 0.010 Television watched per day (Q29) 0.278 0.179 0.077 1.56 0.121 Reading for fun per week (Q31) -0.171 0.210 -0.041 -0.81 0.417 Times changed schools (Q32) -0.222 0.310 -0.034 -0.72 0.473
How much time spent on homework (Q36) 0.011 0.250 0.002 0.04 0.967 I like mathematics (Q37) 0.173 0.335 0.032 0.52 0.605 How good at math are you? (Q38) 0.795 0.349 0.137 2.28 0.023 (Constant) 4.616 1.682 2.74 0.06
How far went in school (Q33) 0.777 0.279 0.140 2.79 0.006
Note. R = 0.2682. R2 = 0.072.
48
59

Table 27
Results of Multiple Regression Analysis Predicting Reading Scores From Students’ Background Information (All Students)
Variable B SE B P t P ~~
Numbers of years lived in U.S. (Q2) 0.152 0.027 0.186 5.60 0.000 Television watched per day (Q29) -0.018 0.065 -0.009 -0.28 0.776 Reading for fun per week (Q31) 0.162 0.074 0.074 2.18 0.030 Times changed schools (Q32) -0.252 0.127 -0.065 -1.99 0.047 How far went in school (Q33) 0.672 0.102 0.225 6.59 0.000 How much time spent on homework (Q36) 0.036 0.093 0.013 0.39 0.698 I like mathematics (Q37) -0.224 0.122 -0.077 -1.84 0.066 How good at math are you? (Q38) 0.289 0.131 0.091 2.12 0.027 (Constant) 1.021 0.639 1.60 0.110
Note. R = 0.347. R2 = 0.121.
Table 28
Results of Multiple Regression Analysis Predicting Reading Scores From Students’ Background Information (LEP Students)
Variable B S E B P t P
Numbers of years lived in U.S. (Q2) Television watched per day (Q29) Reading for fun per week (Q31)
How far went in school (Q33) How much time spent on homework (Q36)
How good at math are you? (Q38) 0.239 (Constant) 1.644
0.060 0.114 0.181
Times changed schools (Q32) -0.162 0.343
-0.111 I like mathematics (Q37) -0.067
0.032 0.088 0.103 0.152 0.137 0.123 0.164 0.171 0.825
0.096 0.065 0.089
-0.052 0.128
-0.045 -0.026 0.085
1.87 1.30 1.76
-1.07 2.51
-0.90 -0.41 1.40 1.99
0.063 0.195 0.080 0.285 0.012 0.367 0.682 0.162 0.047
Note. R = 0226. R2 = 0.051.
Differential Impact of Accommodation Strategies on LEP Subgroups
One of the primary research questions guiding the use of accommodations is their effectiveness, both generally and with specific groups of students. The challenge is to identify what students a specific test accommodation may be most appropriate for. The purpose of this section is to examine whether students represented by selected language and student background variables differed in their
49
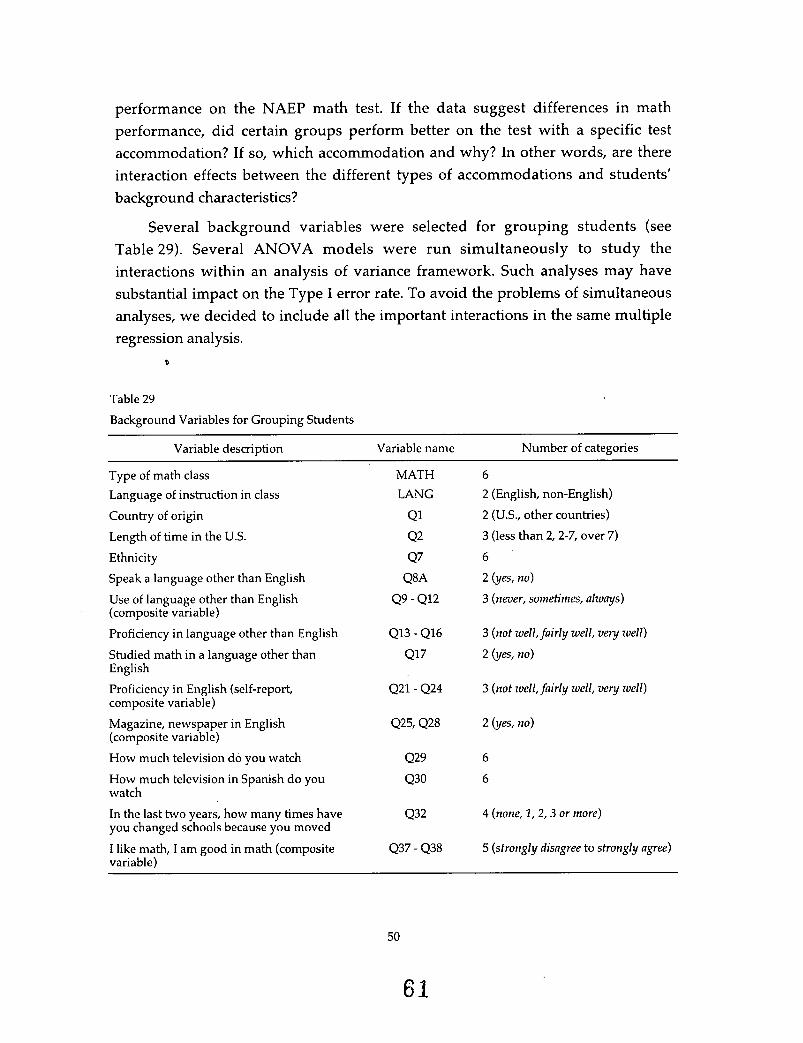
performance on the NAEP math test. If the data suggest differences in math performance, did certain groups perform better on the test with a specific test accommodation? If so, which accommodation and why? In other words, are there interaction effects between the different types of accommodations and students’ background characteristics?
Several background variables were selected for grouping students (see Table 29). Several ANOVA models were run simultaneously to study the interactions within an analysis of variance framework. Such analyses may have substantial impact on the Type I error rate. To avoid the problems of simultaneous analyses, we decided to include all the important interactions in the same multiple regression analysis.
8
Table 29 Background Variables for Grouping Students
~~
Variable description Variable name Number of categories
Type of math class MATH 6 Language of instruction in class LANG 2 (English, non-English)
Country of origin Q1 2 (U.S., other countries)
Length of time in the U.S. Ethnicity Q7 6
Q2 3 (less than 2,2-7, over 7)
Speak a language other than English Q8A 2 (yes, no) Use of language other than English (composite variable)
Q9 - Q12 3 (never, sometimes, always)
Proficiency in language other than English
English
Q13 - Q16 3 (not well, fairly well, very well)
Studied math in a language other than Q17 2 (yes, no)
Proficiency in English (self-report, composite variable)
Magazine, newspaper in English (composite variable)
Q21- Q24 3 (not well, fairly well, very well)
How much television do you watch Q29 6 How much television in Spanish do you Q30 6 watch
In the last two years, how many times have you changed schools because you moved
I like math, I am good in math (composite variable)
Q32
Q37 - Q38
4 (none, 1 , 2 , 3 or more)
5 (strongly disagree to strongly agree)
50
6 1
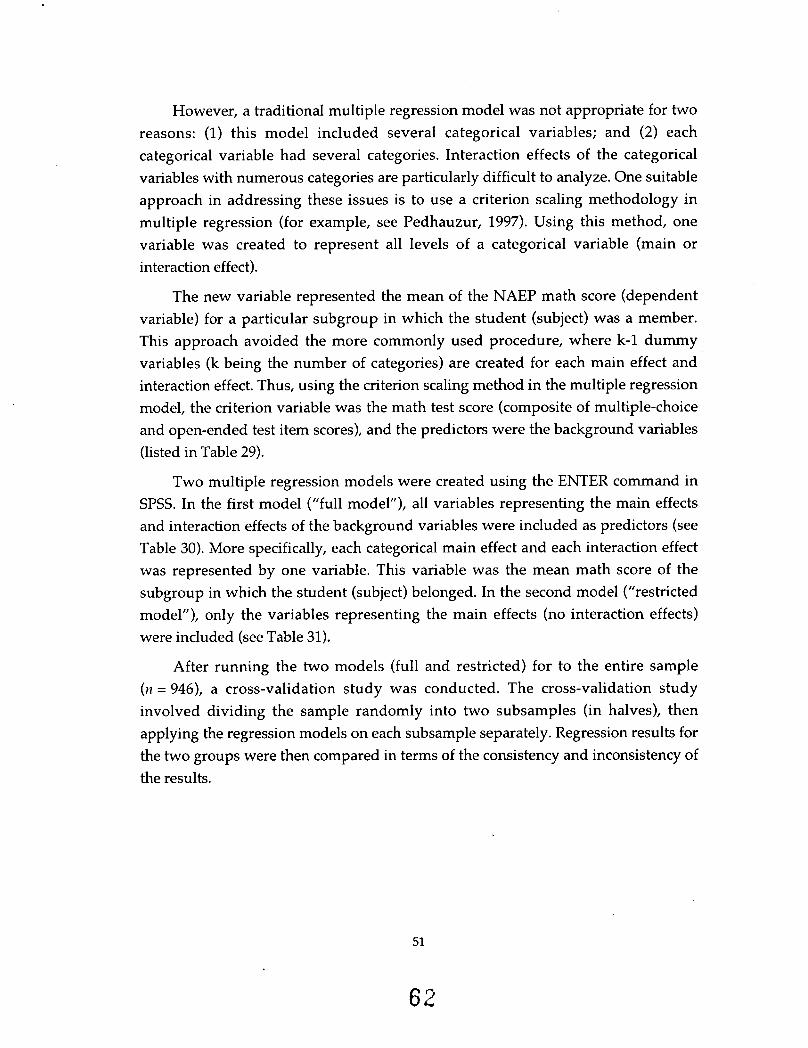
However, a traditional multiple regression model was not appropriate for two reasons: (1) this model included several categorical variables; and (2) each categorical variable had several categories. Interaction effects of the categorical variables with numerous categories are particularly difficult to analyze. One suitable approach in addressing these issues is to use a criterion scaling methodology in multiple regression (for example, see Pedhauzur, 1997). Using this method, one variable was created to represent all levels of a categorical variable (main or interaction effect).
The new variable represented the mean of the NAEP math score (dependent variable) for a particular subgroup in which the student (subject) was a member. This approach avoided the more commonly used procedure, where k-1 dummy variables (k being the number of categories) are created for each main effect and interaction effect. Thus, using the criterion scaling method in the multiple regression model, the criterion variable was the math test score (composite of multiple-choice and open-ended test item scores), and the predictors were the background variables (listed in Table 29).
Two multiple regression models were created using the ENTER command in SPSS. In the first model ("full model"), all variables representing the main effects and interaction effects of the background variables were included as predictors (see Table 30). More specifically, each categorical main effect and each interaction effect was represented by one variable. This variable was the mean math score of the subgroup in which the student (subject) belonged. In the second model ("restricted model"), only the variables representing the main effects (no interaction effects) were included (see Table 31).
After running the two models (full and restricted) for to the entire sample ( n = 946), a cross-validation study was conducted. The cross-validation study involved dividing the sample randomly into two subsamples (in halves), then applying the regression models on each subsample separately. Regression results for the two groups were then compared in terms of the consistency and inconsistency of the results.
51
62
Table 30
Full Model
Variables B SE B P T Sig T
MATHM -0.021 0.290 -.009 -.073 .942 BOOKM -3.157 0.848 -.347 -3.72 .ooo MATHBOOK 0.725 0.283 .345 2.56 .011 LANGBOOK 1.386 0.521 .386 2.66 .008
OTHPBOK 0.394 0.401 .066 0.98 .3251 Q29BOK 0.590 0.274 .lo7 2.153 .032 Q30BOK 0.643 0.486 .184 1.321 .187 ATBOK 0.444 0.322 .lo2 1.380 .168 CONTRYM 0.435 0.186 .083 2.473 .014
OTHENGPM 0.507 0.491 .063 1.034 .302 Q29M 0.329 0.446 .031 0.738 .461
Q30M -0.086 0.507 -.022 -.170 365 A'ITITUM 0.309 0.360 .057 .858 .391 LANGM -0.973 0.545 -.243 -1.079 .075 (Constant) -7.500 14.76 -.508 .6118
Note. R = 0.530. R2 = .281. F = 19.07. y = .OOO.
As Table 30 indicates, the regression model (full model) with all main effects and interaction variables yielded a multiple R of .530 (R2 = .281). For the restricted model, all main effects variables were used, yielding a multiple R of .500 (R2 = .251) (see Table 31). There was little difference between R2 of the full model (.281) and that of the restricted model (.251). However, when the R 2 of the two models were compared, an F-ratio of 4.66 was obtained. This F-ratio is significant beyond the .01 nominal level, which indicates that the full model had more predictive power and explained a larger amount of the variance in students' math test scores. Because the full model had greater prediction power, this suggests that the interaction effects added to the prediction above and beyond the main effects.
Another interesting finding was that, of the 14 variables in the full model, only three were significant predictors of NAEP math performance ( p < .01; see Table 30). The significant variables were accommodation main effect, type of math and accommodation interaction, and language and accommodation interaction. Only one of these three significant predictors is a main effect, and two of them are the
52
6 3

Table 31
Restricted Model
Variables B S E B s T Sig T
MATHM BOOKM CONTRYM OTHENGPM Q29M Q30M AlTlTUM LANGM (Constant)
0.711 0.714 0.466 0.930 0.933 0.572 0.740 0.441
-66.565
0.076 0.301 0.178 0.277 0.352 0.134 0.181 0.137 8.747
.321
.078
.089
.115
.090
.149
.136
.110
9.415 2.372 2.623 3.352 2.654 4.289 4.084 3.220 -7.610
.ooo
.018
.009
.ooo
.008
.ooo
.ooo
.001
.ooo Note. R = 0.500. R2 = .251. F = 28.88. p = .OOO.
interactions. Also, the predictors with relatively large ps are mainly the interaction effects.
The study also examined students’ average math performance across the different math class levels-8th-grade math, pre-algebra, and algebra or integrated math-with different forms of accommodations (see Table 32). The data suggest that for all students, the most effective form of accommodation for all three levels of math classes was the Glossary plus Extra Time. Across the three levels of math classes, students who received the Glossary plus Extra Time accommodation performed the highest on average compared to students who received other forms of accommodation. Students’ average math performance on the NAEP test items with this accommodation, by level of math class, was as follows: 13.52 (8th-grade math), 17.44 (pre-algebra), and 23.13 (algebra or integrated math).
As suggested in the multiple regression analysis and the mean table, the least effective form of accommodation varied across three levels of math classes. Table 32 suggests that there is a significant interaction between the effectiveness of accommodations and the level of math class. Students in 8th-grade math classes performed lowest on average with Extra Time only as a form of accommodation. In comparison, the students in 8th-grade math classes who received Original English test booklets performed better on average, with a score of 12.37 compared to students who received the Extra Time accommodation with 11.69 as the average math score.
53
64

Table 32
Impact of Accommodations on Average Math Performance, by Math Class
Original Modified Glossary Extra Time Glossary + English English only only Extra Time
( n ) ( n ) ( n ) ( n ) ( n )
8th-grade math 12.37 13.09 13.23 11.69 13.52 (123) (115) (116) (29) (23)
Pre-algebra 13.55 13.95 13.81 17.07 17.44 (73) (57) (72) (14) (18)
Algebra/integrated math 19.40 18.36 20.03 22.50 23.13 (73) (56) (66) (14) (15)
Thus, for students taking advanced levels of math classes (algebra or integrated math), the Modified English version of the test had a negative impact on performance. Students who received the Original English (standard) version of the tests performed better on average than the students who received the accommodation with Modified English (M1=13.95 and M2=13.55). In general, the effectiveness of the four accommodations in this study varied according to the level of math class.
Results from this study also suggest that the students’ language of math instruction had a significant impact on the effectiveness of certain accommodations (Table 33). Depending on the language of instruction, students’ performance varied across different accommodations. Whether the language of instruction was English or Spanish, students performed highest on average with the Glossary plus Extra Time accommodation (M1= 17.51 and M2 = 16.31).
Students in English-only instruction classes performed lowest on average (M =
15.25) when administered the Modified English version of the test booklet. The modification seemed to be the least effective form of accommodation for students in English-only classrooms. Additionally, students enrolled in some form of bilingual education classroom performed lowest, on average (M = 10.97), with the Modified English booklets compared to performance with the Original English (standard) test booklet and other types of accommodation.
54
65
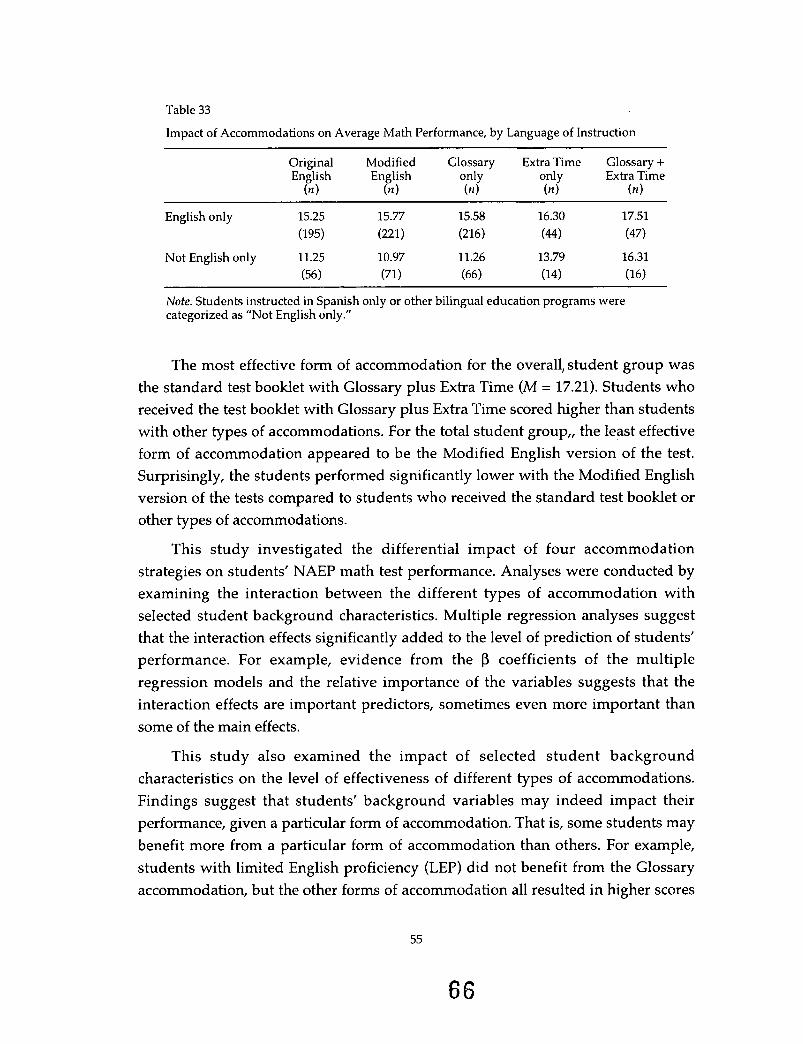
Table 33
Impact of Accommodations on Average Math Performance, by Language of Instruction
Original Modified Glossary Extra Time Glossary + English English only only Extra Time
(n 1 (n ) (n) (n) (n)
English only 15.25 15.77 15.58 16.30 17.51 (195) (221) (216) (44) (47)
Not English only 11.25 10.97 11.26 13.79 16.31 (56) (71) (66) (14) (16)
Note. Students instructed in Spanish only or other bilingual education programs were categorized as “Not English only.”
The most effective form of accommodation for the overall, student group was the standard test booklet with Glossary plus Extra Time (M = 17.21). Students who received the test booklet with Glossary plus Extra Time scored higher than students with other types of accommodations. For the total student group,, the least effective form of accommodation appeared to be the Modified English version of the test. Surprisingly, the students performed significantly lower with the Modified English version of the tests compared to students who received the standard test booklet or other types of accommodations.
This study investigated the differential impact of four accommodation strategies on students’ NAEP math test performance. Analyses were conducted by examining the interaction between the different types of accommodation with selected student background characteristics. Multiple regression analyses suggest that the interaction effects significantly added to the level of prediction of students’ performance. For example, evidence from the p coefficients of the multiple regression models and the relative importance of the variables suggests that the interaction effects are important predictors, sometimes even more important than some of the main effects.
This study also examined the impact of selected student background characteristics on the level of effectiveness of different types of accommodations. Findings suggest that students’ background variables may indeed impact their performance, given a particular form of accommodation. That is, some students may benefit more from a particular form of accommodation than others. For example, students with limited English proficiency (LEI‘) did not benefit from the Glossary accommodation, but the other forms of accommodation all resulted in hgher scores
55
66
for these students. The only form of accommodation that narrowed the difference between LEP and non-LEP scores was Modified English.
Summary
Since legislation in the 1990s mandating standards-based reforms, the inclusion of English language learners, or students with limited English proficiency, in large- scale assessments has become a major concern of legislators, educational researchers, and practitioners in the United States. Historically, these student populations have not participated in the content-based assessments, typically administered in the English language, because of potentially confounding influences. Now, however, various test accommodation strategies have been suggested for the assessment of English language learners. Studies have suggested that some forms of accommodation may be more effective than others. Despite the widespread implementation of accommodations in large-scale assessments, little is known about their effectiveness or level of impact with different populations of students.
The purpose of this study was to build on the existing knowledge base regarding test accommodations and their impacts on NAEP math test performance among students with limited English proficiency (LEI'). Four test accommodations (Modified English, Extra Time, Glossary, Glossary plus Extra Time) were examined and compared with a non-accommodated test version (Original English). These types of accommodation were selected because they are commonly found in national and/or statewide standardized testing situations. There were four main research questions:
What student background factors affect math performance? What accommodation strategies have the greatest impact on student performance? What effect do testing accommodations have for students with limited English proficiency? Does the impact of accommodations vary with student background factors?
Data were obtained from a nonprobability sample of 946 8th-grade middle school math students in southern California. Efforts were made to target schools with large Latino student enrollments. Students were enrolled in a variety of math class levels-8th-grade math, pre-algebra, algebra/ integrated math. A test booklet of original NAEP math test items and four accommodated versions were administered randomly within intact math classrooms to control for student and classroom effects
56
to the extent possible. Students were also administered a' NAEP reading proficiency test, as well as a series of questions regarding their language background, attitudes toward math, number of years in the United States, and self-reported proficiency in English and their other language (if applicable). School designations of the students' language proficiency status (LEP, FEP, or IFE) were also obtained.
There were several interesting findings.
Students desi nated LEI' by their schools scored, on average, more than 5
In comparison with scores on the original NAEP items, the greatest score improvements, by both LEP and non-LEP students, were on the accommodation version that included a glossary explaining potentially unfamiliar or difficult words plus extra time.
LEI' students' scores were higher on all types of accommodation except Glossary only; LEP students were helped by Modified English, Extra Time, and Glossary plus Extra Time.
Most accommodations helped both LEP and non-LEP students; the only type of accommodation that narrowed the score difference between LEP and non-LEP students was Modified English.
Students who were better readers, as measured by reading test scores, achieved lugher math scores.
points lower t a an non-LEP students on a 35-item math test.
The results of this study indicate that there are relationships among student background variables and test performance under different types of accommodation. We are currently conducting further analyses to clarify these relationships. Among the specific variables we are investigating are student English proficiency level; math proficiency level; reading skill level; first language; recency of arrival in the United States; self-reported data including attitudes, English proficiency, and first language proficiency; the consistency and reliability of self- reported data and school-reported data as sources of information on language proficiency; and appropriateness of different types of accommodation with different subgroups of students.
Test accommodations can result in higher math scores for both LEP and non- LEP students, and some types of accommodation have greater impact than others. Also, certain accommodations may help LEP students more than non-LEP students. These differences and relative impacts need to be considered and investigated further before accommodation strategies are adopted for large-scale assessments.
57
68
REFERENCES
Abedi, J. (1994). Interrater/Test Reliability System. Los Angeles, CA: Advance Data Research and Data Analyses Center.
Abedi, J., Lord, C., & Hofstetter, C. (1998). Impact of selected background variables on students’ NAEP math performance. Los Angeles: University of California, Center for the Study of Evaluation/ National Center for Research on Evaluation, Standards, and Student Testing.
Abedi, J., Lord, C., & Hummer, J. (1995). Language background as u variable in NAEP mathematics performance: NAEP TRP Task 3 D: Language background study. Los Angeles: University of California, Center for the Study of Evaluation/ National Center for Research on Evaluation, Standards, and Student Testing.
Adams, M. J. (1990). Beginning to read: Thinking and learning about print. Cambridge, MA: MIT Press.
Aiken, L. R. (1971). Verbal factors and mathematics learning: A review of research.
Aiken, L. R. (1972). Language factors in learning mathematics. Review of Education
Journal for Research in Mathematics Education, 2,304-13.
Research, 42,359-85.
American Educational Research Association, American Psychological Association, & National Council on Measurement in Education. (1985). Standards for educational and psychological testing. Washington, DC: American Psychological Association.
Anderson, N. E., Jenkins, F. F., & Miller, K. E. (1996). NAEP inclusion criteria and testing accommodations: Findings fYom the NAEP 1995 field test in mathematics. Washington, DC: Educational Testing Service
August, D., & Hakuta, K. (Eds.). (1997). Improving schooling for language-minority children: A research agenda. Washington, DC: National Academy Press.
Baugh, J. (1988, August). [Review of ”Twice as less: Black English and the performance of Black students in mathematics and science”]. Harvard Educational Review, 58, 395-404.
Bever, T. (1970). The cognitive basis for linguistic structure. In J. R. Hayes (Ed.), Cognition and the development of language (pp. 279-353). New York Wiley.
Biber, D. (1988). Variation across speech and writing. New York: Cambridge University Press.
Bormuth, J. R. (1966). Readability: A new approach. Reading Research Quarterly, 1(3), 79-132.
58
Botel, M., & Granowsky, A. (1974). A formula for measuring syntactic complexity: A
Butler, F. A., & Stevens, R. (1997). Accommodation strategies for English language learners on large-scale assessments: Student characteris tics and other considerations. Los Angeles: University of California, Center for the Study of Evaluation/ National Center for Research on Evaluation, Standards, and Student Testing.
directional effort. Elementary English, 1,513-516.
Carpenter, T. P., Corbitt, M. K., Kepner, H. S., Jr., Linquist, M. M., & Reys, R. E. (1980). Solving verbal problems: Results and implications from national assessment. Arithmetic Teacher, 28,8-12.
Celce-Murcia, M., & Larsen-Freeman, D. (1983). The grammar book: An ESLIEFL teacher’s book. Rowley, MA: Newbury House.
Chall, J. S., Jacobs, V. S., & Baldwin, L. E. (1990). The reading crisis: W h y poor children fall behind. Cambridge, MA: Harvard University Press.
Chamot, A. U., & OMalley, J. M. (1994). The C A L L A handbook: Implementing the Cognitive Academic Language Learning Approach. Reading, MA: Addison Wesley.
Cocking, R. R., & Chipman, S. (1988). Conceptual issues related to mathematics achievement of language minority children. In R. R. Cocking & J. P. Mestre (Eds.), Linguistic and cultural influences on learning mathematics (pp. 17-46). Hillsdale, NJ: Lawrence Erlbaum Associates.
Council of Chief State School Officers and North Central Regional Educational Laboratory (1996). 1996 State student assessment programs database. Oak Brook, IL: North Central Regional Educational Laboratory.
Cummins, J. (1980). Psychological assessment of immigrant children. Logic or intuition? Journal of Multilingual Multicultural Development, 1,97-111.
Cummins, J. (1981). The role of primary language development in promoting educational success for language minority students. In Schooling and language minori ty Students: A theoretical framework (Office of Bilingual Bicultural Education, California State Department of Education). Los Angeles: California State University, Evaluation, Dissemination and Assessment Center.
Cummins, J. (1984). Bilingualism and special education: Issues in assessment and pedagogy. Austin, TX: Pro-Ed.
Cummins, J. (1989). A theoretical framework for bilingual special education.
Cummins, D. D., Kintsch, W., Reusser, K., & Weimer, R. (1988). The role of understanding in solving word problems. Cognitive Psychology, 20,405-438.
Exceptional Children, 56, 111-119.
59
70

Dale, E., & Chall, J. S. (1948). A formula for predicting readability. Educational Research Bulletin, 27, 11-20; 28,37-54.
Davison, D. M., & Schindler, S. E. (1988). Mathematics and the Indian student. In J. Reyhner (Ed.), Teaching the Indian child: A bilingual/multicultural approach (2nd ed., pp. 301-372). Billings, MT: East Montana College, Bilingual Education Program.
De Corte, E., Verschaffel, L., & De Win, L. (1985). Influence of rewording verbal problems on children’s problem representations and solutions. Journal of Educational Psychology, 77,460-470.
devilliers, J., & devilliers, P. (1973). Development of the use of word order in comprehension. Journal ofPsychologica1 Research, 2,331-341.
Dornic, S. (1979). Information processing in bilinguals: Some selected issues. Psychological Research, 40,329-348.
Exceptional Children, 56,154-158. Duran, R. P. (1989). Assessment and instruction of at-risk Hispanic students.
Figueroa, R. A. (1989). Psychological testing of linguistic minority students:
Finegan, E. (1978, December). The significance of syntactic arrangement for readability .
Knowledge gaps and regulations. Exceptional Children, 56,145-152.
Paper presented to the Linguistic Society of America, Boston.
Flesch, R. (1948). A new readability yardstick. Journal of Applied Psychology, 32, 221- 233.
Floyd, P., & Carrell, P. L. (1987). Effects on ESL reading of teaching cultural content
Forster, K. I., & Olbrei, I. (1973). Semantic heuristics and syntactic trial. Cognition, 2,
schemata. Language Learning, 37,89-108.
319-347.
Freeman, G. G. (1978). Interdisciplinary evaluation of children’s primary language skills.
Garcia, G. E. (1991). Factors influencing the English reading test performance of
Gathercole, S. E., & Baddeley, A. D. (1993). Working memory and language. Hillsdale,
(ERIC Document Reproduction Service No. ED157341)
Spanish-speaking Hispanic chldren. Reading Research Quarterly, 26,371-391.
NJ: Lawrence Erlbaum Associates.
Goldstein, A. A. (1997, March). Design for increasing participation of students with disabilities and limited English proficient students in the National Assessment of Educational Progress (NAEP). Paper presented at the annual meeting of the American Educational Research Association, Chicago.
60

Hafner, A. (1995). Assessment practices: Developing and modifying s tatewide assessments for LEP students. Paper presented at the annual conference on Large Scale Assessment sponsored by the Council of Chief State School Officers, Phoenix, AZ.
Haiman, J. (1985). Natural syntax: lconicity and erosion. New York: Cambridge
Halliday, M. A. K., & Martin, J. R. (1993.) Writing science: Literacy and discursive power.
University Press.
Pittsburgh, PA: University of Pittsburgh Press.
Hudson, T. (1983). Correspondences and numerical differences between disjoint
Hunt, K. W. (1965). Grammatical structures written at three grade levels (Research Rep.
sets. Child Development, 54, 84-90.
No. 3). Urbana, IL: National Council of Teachers of English.
Hunt, K. W. (1977). Early blooming and late blooming syntactic structures. In C. R. Cooper & L. Ode11 (Eds.)., Evaluating writing: Describing, measuring, judging (pp. 91-106). Urbana, IL: National Council of Teachers of English.
Improving America’s Schools Act of 1994, Pub. L. No. 103-382,108 Stat. 3518 (1994).
Jerman, M., & Rees, R. (1972). Predicting the relative difficulty of verbal arithmetic
Jones, P. L. (1982). Learning mathematics in a second language: A problem with
problems. Educational Studies in Mathematics, 4,306-323.
more and less. Educational Studies in Mathematics, 13, 269-87.
Just, M. A., & Carpenter, P. A. (1980). A theory of reading: From eye fixation to
King, J., &Just, M. A. (1991). Individual differences in syntactic processing: The role
Klare, G. R. (1974). Assessing readability. Reading Research Quarterly, 10,62-102.
Klein, W. (1986). Second language acquisition. New York Cambridge University Press.
Kucera, H., & Francis, W. N. (1967). Computational analysis of present-day English.
comprehension. Psychological Review, 87,329-354.
of working memory. Journal ofMemory and Language, 30,580-602.
Providence, RI: Brown University Press.
LaCelle-Peterson, M., & Rivera, C. (1994). Is it real for all kids? A framework for equitable assessment policies for English language learners. Harvard Educational Review, 64,55-75.
Larsen, S. C., Parker, R. M., & Trenholme, B. (1978). The effects of svntactic complexity upon arithmetic performance: Educationhl Studies in Mathemhtics, 21, 83-90.
61
72
Lemke, J. L. (1986). Using language in classrooms. Victoria, Australia: Deakin.
Lepik, M. (1990). Algebraic word problems: Role of linguistic and structural variables. Educational Studies in Mathematics, 21 , 83-90.
MacDonald, M. C. (1993). The interaction of lexical and syntactic ambiguity. Journal of Memory and Language, 32,692-715.
MacGinitie, W. H., & Tretiak, R. (1971). Sentence depth measures as predictors of
Macnamara, J. (1966). Bilingualism in primary education. Edinburgh: Edinburgh
Mazzeo, J. (1997, March). Toward a more inclusive NAEP. Paper presented at the ’
Mestre, J. P. (1984, Fall). The problem with problems: Hispanic students and mathematics. Bilingual Journal, 15-32.
Mestre, J. P. (1988). The role of language comprehension in mathematics and problem solving. In R. R. Cocking & J. P. Mestre (Eds.), Linguistic and cultural influences on learning mathematics (pp. 201-220). Hillsdale, NJ: Lawrence Erlbaum Associates.
reading difficulty. Reading Research Quarterly, 6,364-377.
University Press.
annual meeting of the American Educational Research Association, Chcago.
Munro, J. (1979). Language abilities and math performance. Reading Teacher, 32, 900- 915.
Noonan, J. (1990). Readability problems presented by mathematics text. Early Child Development and Care, 54,57-81.
Olson, J. F., & Goldstein, A. A. (1997). The inclusion of students with disabilities and limited English proficiency students in large-scale assessments: A summary of recent progress (NCES 97-482). Washington, DC: U.S. Department of Education, National Center for Education Statistics.
Orr, E. W. (1987). Twice as less: Black English and the performance of Black students in mathematics and science. New York W. W. Norton.
Pawley, A., & Syder, F. H. (1983). Natural selection in syntax: Notes on adaptive variation and change in vernacular and literary grammar. Journal of Pragmatics, 7, 551-579.
Pedhazur, E. (1997). Multiple regression in behavioral research (3rd ed.). Fort Worth, TX: Harcourt Brace College Publishers.
Ramirez, J., Yuen, S., Ramey, D., & Billings, D. (1991). Final report: Longitudinal study of structured English immersion strategy, early-exit and late-exit bilingual education programs for language minority children (Vols. 1, 11; No. 300-87-0156). San Mateo, CA: Aguirre International.
62
73
Riley, M. S., Greeno, J. G., & Heller, J. I. (1983). Development of children’s problem- solving ability in arithmetic. In H. P. Ginsburg (Ed.), The development of mathematical thinking (pp. 153-196). New York Academic Press.
Rothman, R. W., & Cohen, J. (1989). The language of math needs to be taught. Academic Therapy, 25,133-42.
Saville-Troike, M. (1991, Spring). Teaching and testing for academic achievement: The role of language development. NCBE FOCUS: Occasional Papers-in Bilingual Education, 4.
Savin, H. B., & Perchonock, E. (1965). Grammatical structure and the immediate recall of English sentences. Journal of Verbal Learning and Verbal Behavior, 4, 348- 353.
Saxe, G. B. (1988). Linking language with mathematics achievement: Problems and prospects. In R. R. Cocking & J. P. Mestre (Eds.), Linguistic and cultural injuences on learning mathematics (pp. 47-62). Hillside, NJ: Lawrence Erlbaum Associates.
Schachter, J. (1974). An error in error analysis. Language Learning, 24,205-214.
Schacter, P. (1983). On syntactic categories. Bloomington: Indiana University Linguistics Club.
Schmitt, A. P., & Dorans, N. J. (1989, April). Factors related to differential item functioning for Hispanic examinees on the Scholastic Aptitude Test. Paper presented at the ETS Invitational Conference “Assessment and Access: A Conference on Hispanics in Higher Education.” Princeton, NJ: Educational Testing Service.
Shuard, H., & Rothery, A., (Eds.). (1984). Children reading mathematics. London: J. Murray.
Slobin, D. I. (1968). Recall of full and truncated passive sentences in connected discourse. Journal of Verbal Learning and Verbal Behavior, 7,876-881.
Slobin, D. I. (1996). Two ways to travel: Verbs of motion in English and Spanish. In M. Shibatani & S. A. Thompson (Eds.), Grammatical constructions: Their form and meaning (pp. 195-217). Oxford: Oxford University Press.
Spanos, G., Rhodes, N. C., Dale, T. C., & Crandall, J. (1988). Linguistic features of mathematical problem solving: Insights and applications. In R. R. Cocking & J. P. Mestre (Eds.), Linguistic and cultural influences on learning mathematics (pp. 221-240). Hillsdale, NJ: Lawrence Erlbaum Associates.
Spencer, P. L., & Russell, D. (1960). Reading in arithmetic. In F. E. Grossnickle (Ed.), lnstruction in arithmetic. Twenty-fifth yearbook of the National Council of Teachers of Mathematics (pp. 202-223). Washington, DC: National Council of Teachers of Mathematics.
63
74

Thurlow, M., Liu, K., Erickson, R., Spicuzza, R., & El Sawaf, H. (1996, August). Accommodations for students with limited English proficien y: Analyses of guidelines from states with graduation exams (Report 6). Minneapolis: University of Minnesota, National Center on Educational Outcomes.
Wang, M. D. (1970). The role of syntactic complexity as a determiner of comprehensibility. Journal of Verbal Learning and Verbal Behavior, 9,398-404.
Yngve, V. H. (1960). A model and hypothesis for language structure. In Proceedings of
Zipf, G. K. (1949). Human behavior and the principle of least efiort. Cambridge, MA:
the American Philosophical Association, 404,444-466.
Addison-Wesley .
64
75
APPENDIX
STUDENT BACKGROUND QUESTIONNAIRE
TEACHER CLASSROOM QUESTIONNAIRE J
65
7 6
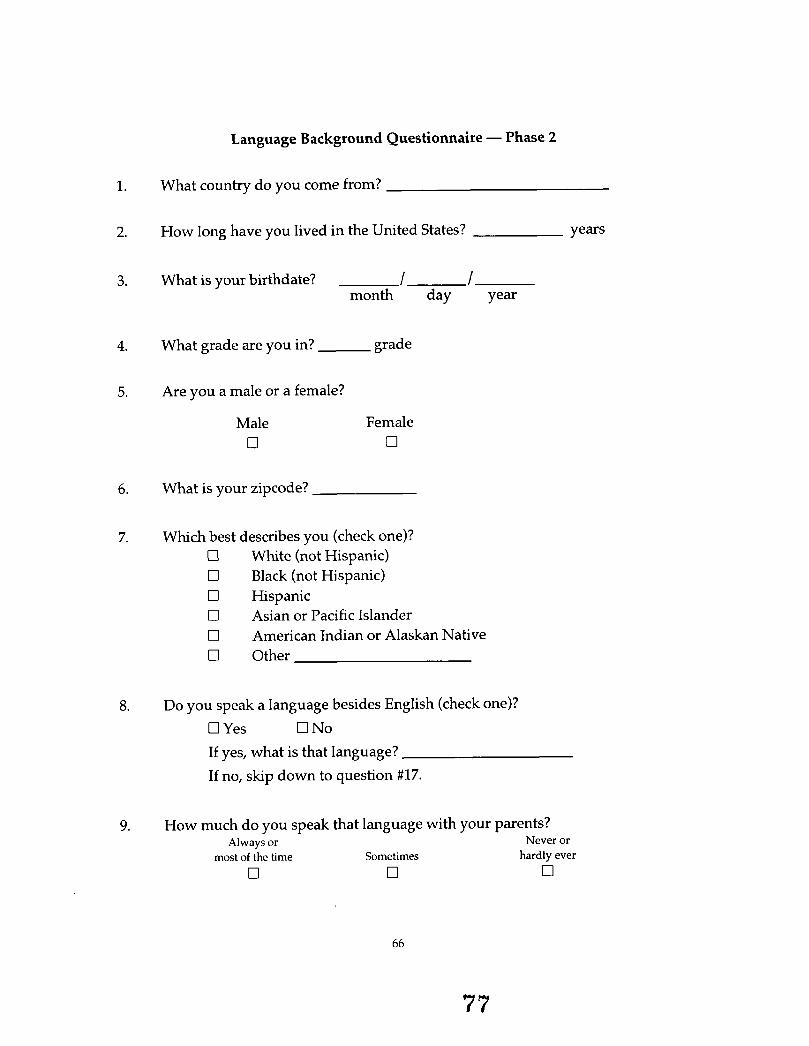
Language Background Questionnaire - Phase 2
1.
2.
3.
4.
5.
6 .
7.
8.
9.
What country do you come from?
How long have you lived in the United States? years
What is your birthdate? I I month day year
What grade are you in? grade
Are you a male or a female?
Male 0
Female 0
What is your zipcode?
Whch best describes you (check one)? 0 White (not Hispanic) 0 Black (not Hispanic) 0 Hispanic 0 Asian or Pacific Islander 0 0 Other
American Indian or Alaskan Native
Do you speak a language besides English (check one)? 0 Yes 0 No If yes, what is that language? If no, skip down to question #17.
How much do you speak that language with your parents? Always or Never or
most of the time Sometimes hardly ever
0 0 0
66
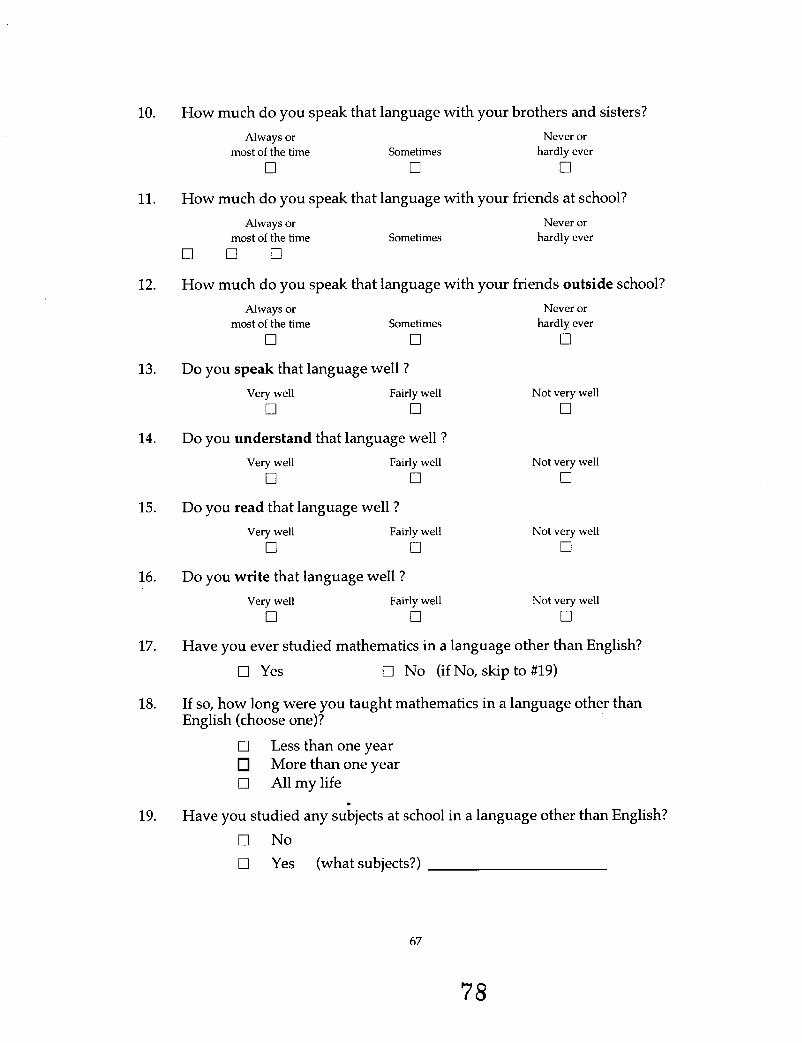
10.
11.
12.
13.
14.
15.
16.
17.
18.
19.
How much do you speak that Always or
most of the time 0
How much do you speak that Always or
most of the time u 0 0
anguage with your brothers and sisters?
Sometimes 0
Never or hardly ever 0
anguage with your friends at school?
Sometimes Never or
hardly ever
How much do you speak that language with your friends outside school? Always or
most of the time 0
Sometimes 0
Never or hardly ever 0
Do you speak that language well ? Very well Fairly well Not very well 0 0 0
Do you understand that language well ?
Very well 0
Fairly well 0
Do you read that language well ?
Very well 0
Fairly well 0
Do you write that language well ?
Very well 0
Fairly well 0
Not very well 0
Not very well 0
Not very well 0
Have you ever studied mathematics in a language other than English? 0 Yes 0 No (if No, skip to #19)
If so, how long were you taught mathematics in a language other than English (choose one)?
0 Less than one year More than one year
0 All my life
Have you studied any subjects at school in a language other than English? 0 No 0 Yes (what subjects?)
67
78

20.
21.
22.
23.
24.
25.
26.
27.
28.
How long have you studied mathematics in English?
0 All my life 0 Less than one year 0 More than one year
Do you understand spoken English well? Very well Fairly well 0 0
Not very well 0
Do you speak English well? Very well Fairly well Not very well 0 0 0
Do you read English well? Very well Fairly well Not very well 0 0 0
Do you write English well? Very well Fairly well Not very well 0 0 0
Does your family get a newspaper which is written in English regularly? Yes No I don't know 0 0 0
Is there an encyclopedia which is written in English in your home? Yes No I don't know 0 0 0
Are there more than 25 books in English in your home? Yes No I don't know 0 0 0
Does your family get any English language magazines? Yes 0
No 0
I don't know 0
68
79

29. How much television do you watch in a day?
0 None 0 1 hour or less 0 2hours 0 3hours 0 4hours 0 5 hours 0 6 hours or more
30. How much television in Spanish do you watch in a day (if applicable)?
0 None 0 1 hour or less 0 2hours 0 3hours 0 4hours 0 5 hours 0 6 hours or more
31. How much reading do you do in a week for fun (not schoolwork)?
0 None 0 1 hour or less 0 2hours 0 3hours 0 4hours 0 5 hours 0 6 hours or more
32. In the last two years, how many times have you changed schools because you moved?
0 None 0 1 0 2 0 3ormore
69
80
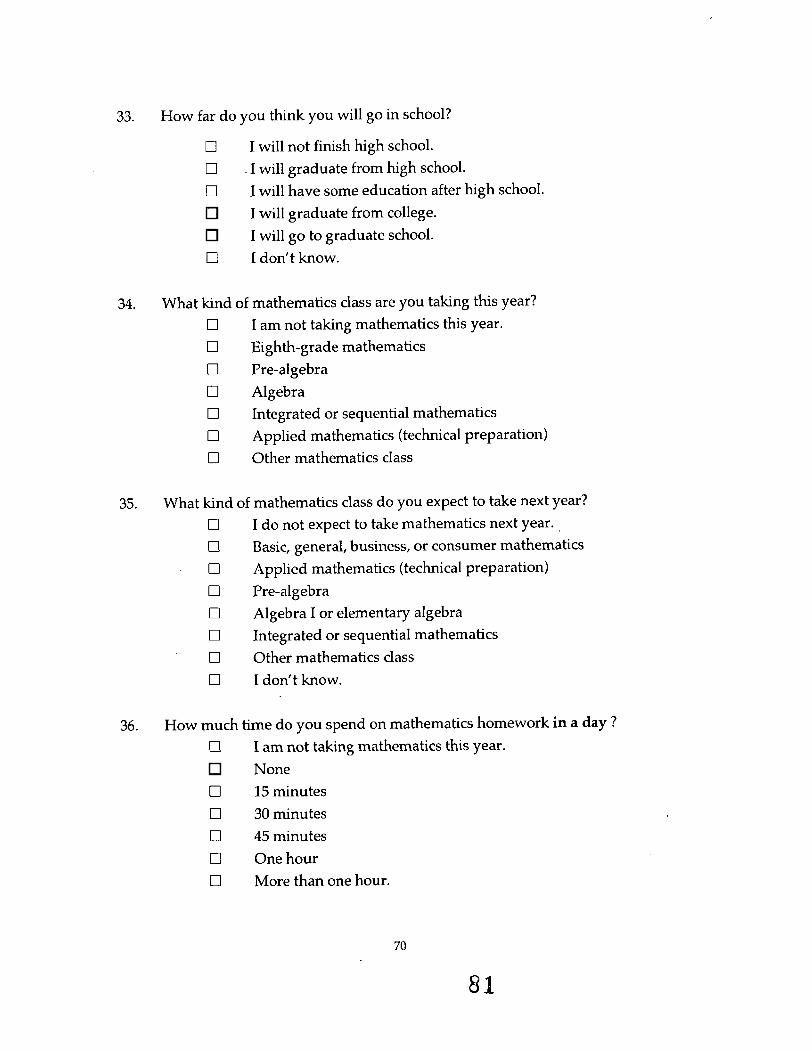
33.
34.
35.
36.
How far do you think you will go in school?
0 0 0
0 Idon’tknow.
I will not finish high school. . I will graduate from high school. I will have some education after h g h school. I will graduate from college. I will go to graduate school.
What kind of mathematics class are you taking this year? 0 0 Eighth-grade mathematics 0 Pre-algebra 0 Algebra 0 Integrated or sequential mathematics 0 Applied mathematics (technical preparation) 0 Other mathematics class
I am not taking mathematics this year.
What kind of mathematics class do you expect to take next year? I do not expect to take mathematics next year. Basic, general, business, or consumer mathematics
. 0 Applied mathematics (technical preparation)
0 0
0 Pre-algebra 0 Algebra I or elementary algebra 0 Integrated or sequential mathematics 0 Other mathematics class 0 Idon’tknow.
How much time do you spend on mathematics homework in a day ? 0
None 0 15minutes 0 30minutes 0 45minutes 0 Onehour 0 More than one hour.
I am not taking mathematics this year.
70
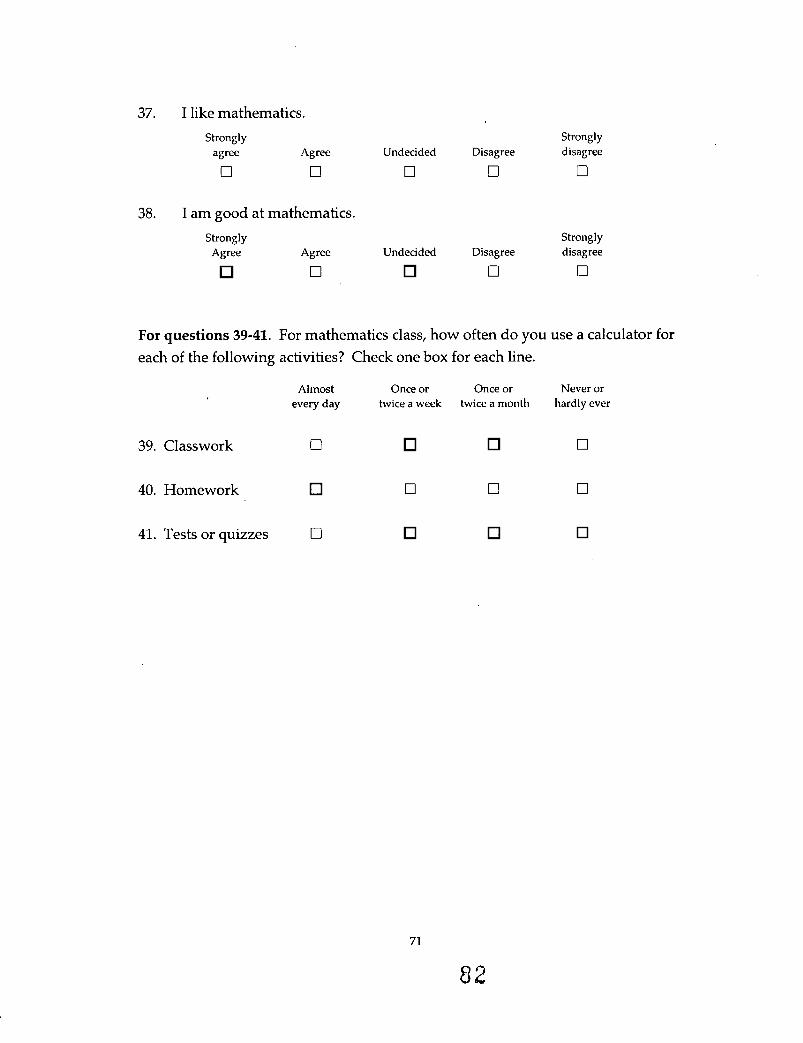
37. I like mathematics. Strongly
agree Agree
0 0 Undecided Disagree
0 0
Strongly disagree
0
38. I am good at mathematics. Strongly Strongly
Agree Agree Undecided Disagree disagree
0 0 0
For questions 39-41. For mathematics class, how often do you use a calculator for each of the following activities? Check one box for each line.
Almost Once or Once or Never or every day twice a week twice a month hardly ever
39. Classwork
40. Homework
41. Tests or quizzes
0 0
0 0 0
0
71
82
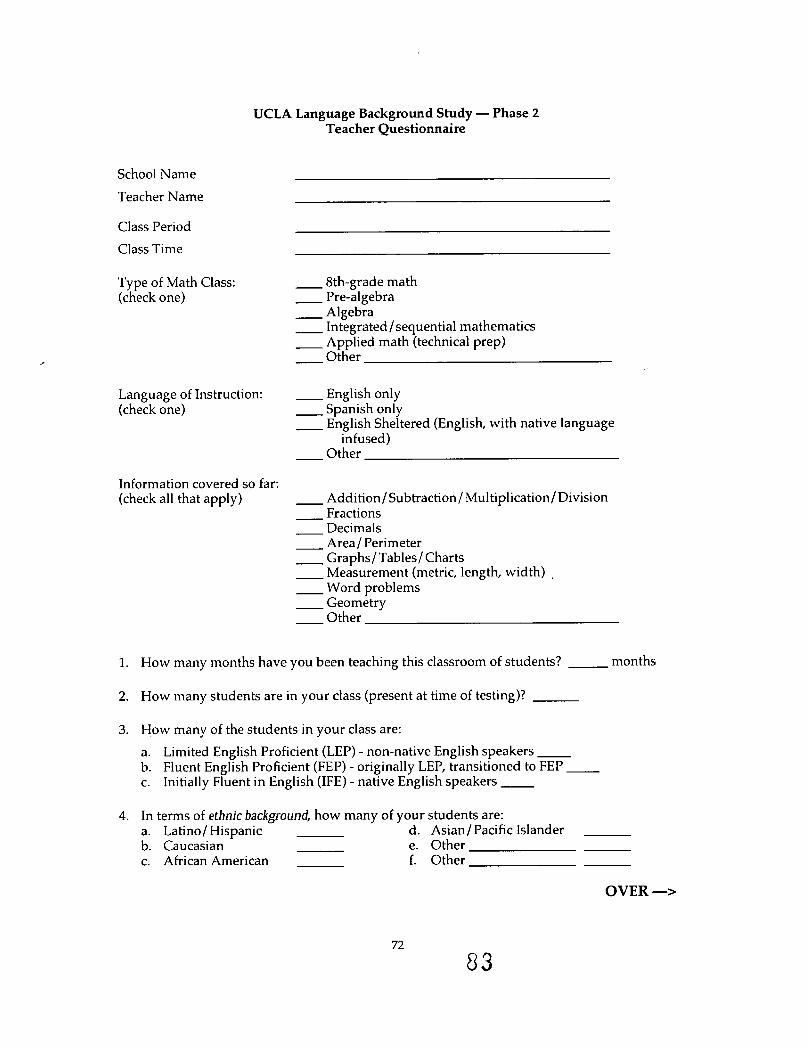
School Name
Teacher Name
Class Period Class Time
Type of Math Class: (check one)
,
UCLA Language Background Study - Phase 2 Teacher Questionnaire
- 8th-grade math - Pre-algebra - Algebra - Integrated / sequential mathematics - Apgied math {technical prep) - .
- Other
Language of Instruction: - English only (check one) - Spanish only
- English Sheltered (English, with native language
- Other infused)
Information covered so far: (check all that apply) - Addition/Subtraction/ Multiplication/ Division
- Fractions - Decimals - Area/ Perimeter - Graphs/Tables/ Charts - Measurement (metric, length, width) ,
-Word problems - Geometry - Other
1. How many months have you been teaching this classroom of students? months
2. How many students are in your class (present at time of testing)?
3. How many of the students in your class are: a. Limited English Proficient (LEE') - non-native English speakers b. Fluent English Proficient (FEP) - originally LEI', transitioned to FEP c. Initially Fluent in English (IFE) - native English speakers
4. In terms of ethnic background, how many of your students are: a. Latino/Hispanic d. Asian/Pacific Islander b. Caucasian e. Other c. African American f. Other
72
OVER ->
83

5. In terms of native language, how many of your students speak: a. English d. Other b. Spanish e. Other c. Vietnamese f. Other
6. In terms of English language use, about how many of your students speak: a. English only b. Spanish only c. English dominant, Spanish first language d. Spanish dominant, Spanish first language e. English dominant, other first language f. Other g. Other
7. In terms of general math achievement, how many of your students are in: a. low-level math (remediation, basic arithmetic) b. medium-level math (fractions, decimals, pre-algebra) c. high-level math (high math, honors, algebra)
8. In terms of reading English proficiency, how many of your students are: a. Completely fluent in reading the English language b. Somewhat fluent in reading the English language c. Not at all fluent in reading the English language
9. In terms of writing English proficiency, how many of these students are: a. Completely fluent in writing the English language b. Somewhat fluent in writing the English language c. Not at all fluent in writing the English language
10. In terms of oral English proficiency, how many of these students are: a. Completely fluent in spealung the English language b. Somewhat fluent in speaking the English language c. Not at all fluent in speaking the English language
11. If you have any comments about the study, the testing experience, or your students or classroom, please include them below.
Thank you very much for your time and assistance!
73 84
U S . Department of Education Office of Educational Research and lmprovement (OERI)
National Library of Education ( M E ) Educational Resources Information Center (ERIC)
NOTICE
Reproduction Basis
This document is covered by a signed "Reproduction Release (Blanket)" form (on file within the ERIC system), encompassing all or classes of documents from its source organization and, therefore, does not require a "Specific Document'' Release form.
0
This document is Federally-funded, or carries its own permission to reproduce, or is otherwise in the public domain and, therefore, may be reproduced by ERIC without a signed Reproduction Release form (either "Specific Document" or llBlankettt).
d
EFF-089 (512002)