Embed Size (px)
Citation preview
NADA Commercial Truck Guide Industry Update
January 2014
Annual review shows 2013 outperformed 2012
in most segments
Increased availability of 3-5 year old trucks
bolsters average pricing
Construction market ticked up in late 2013
Seasonal slowdown may be negligible
Medium-duty segments showing strength
Class 4 and 6 returned a strong November

Commercial Truck Guidelines | January 2014
NADA Used Car Guide | 8400 Westpark Drive | McLean, VA 22102 | 800.544.6232 | nada.com/b2b 2
© 2014 NADA Used Car Guide
TABLE OF CONTENTS
Commercial Truck Market Trends ............................................................................................... 2
Economic Data ............................................................................................................................. 12
ATD/NADA Official Commercial Truck Guide Value Trends ........................................................ 16
At NADA Used Car Guide ............................................................................................................. 17
COMMERCIAL TRUCK MARKET TRENDS
Summary
In this edition, we provide a 2013 review and discuss the marketplace changes that
occurred over the past 24 months. We also provide our traditional month-over-month
results, as well as predictions for 2014.
Sleeper Tractors – Retail
Performance of the sleeper segment in 2013 was characterized by accelerated average
pricing driven by greater numbers of newer trucks available to the marketplace. With
new trucks more expensive than ever, and a low build rate of 2008-2011 trucks, market
appetite for low-mileage used trucks is greater than any time in recent history.
Looking back 24 months, the retail market has shifted from being dominated by 6-year-
old trucks to being balanced out by relatively proportional numbers of 4-5 year-old
trucks. Through mid-2012, the 2007 model year
dominated the market. After mid-year, the supply of
lower-mileage 2007’s began to dry up. In the 4th
quarter of 2012, the 2009 model year came on-line
as those trucks hit prime trade-in age. 2009’s were
overtaken by 2010’s in July of 2013, and that model
year remains the highest in volume. 2011’s were
increasingly represented throughout 2013, really
accelerating in October. See the “Monthly Retail
Sales Volume by Model Year” graph for detail.
(Continued on page 3)

Commercial Truck Guidelines | January 2014
NADA Used Car Guide | 8400 Westpark Drive | McLean, VA 22102 | 800.544.6232 | nada.com/b2b 3
© 2014 NADA Used Car Guide
Currently, the most common sleeper tractor sold retail is 5 years old, which is a full year
younger than this time last year. Major reasons for this shift include the aforementioned
decreased impact of 2007’s, and also a return to traditional 3-5 year trade-in cycles. The
2008 and 2010 emissions changes – combined with reluctance to invest due to
economic uncertainty - shook up trade-in strategies. At present, with a Federal budget in
place for 2014, the costs of the Affordable Care Act largely understood, and upcoming
emissions regulations a known quantity, trade-in cycles seem to be returning to the
historical norm.
Looking at actual numbers, the average sleeper tractor retailed in the first 11 months of
2013 for $52,149, had 533,233 miles, and was 76.5 months old. Compared to same-
period 2012, this average truck was $3100 (or 5.9%) more expensive, had 15,355 (or
2.8%) fewer miles, and was 1.7 months (or 2.2%)
older.
Average mileage traced an arc in 2012, peaking in
August of that year at 555,193. This arc also roughly
correlates to the number of 2007’s sold, providing
further evidence of the outsized influence of that
model year. See the “Average Retail Price and
Mileage” graph for detail.
Based on these trends, it should come as little
surprise that November, 2013 set yet another record
for average retail pricing, coming in at $55,063 -
$1698 (or 3.1%) higher than October, and $5783 (or 10.5%) higher than November,
2012. Mileage came in at 527,606 – 4497 (or 0.9%) higher than October, and 14,484 (or
2.7%) lower than November, 2012. Age was two months older than October, and two
months younger than November, 2012.
Looking ahead, we will closely monitor the 2011 and 2012 model years. The oldest
2011’s have been on the road for just barely 4 years, which means average mileage for
these trucks should remain under the critical 600,000 mile point for the next 12 months.
As for 2012’s, that model year marked a return towards normal production rates after
four model years of recession-related pullback. As 2014 progresses, we expect a
(Continued on page 4)
[ COMMERCIAL TRUCK MARKET TRENDS continued ]

NADA Used Car Guide | 8400 Westpark Drive | McLean, VA 22102 | 800.544.6232 | nada.com/b2b 4
© 2014 NADA Used Car Guide
Commercial Truck Guidelines | January 2014
moderately increased supply of these trucks, potentially with a corresponding mild
decrease in the premium paid for them.
There is currently an $11,000 spread in average selling price of 2012 vs. 2011 models,
which would allow for some minor downward movement of 2012’s without too much
impact to 2011’s. Overall, though, a low-mileage truck will continue to command a
strong premium, due simply to the high price of new trucks.
Sleeper Tractors – Wholesale
2007’s dominated the wholesale market for all of 2012 (aside from a spike in 2008’s
from September-November) and most of 2013. 2009’s made up an increasing
proportion of the market starting in the 2nd quarter, and 2010’s came on-line in the
3rd. 2009 and newer trucks depreciated moderately
throughout 2012, with older trucks relatively stable.
The rate of depreciation on newer trucks diminished
going into 2013, and pricing since the 2nd quarter has
been essentially flat. See the “Average Wholesale
Selling Price by Model Year” graph for details.
Like the retail channel, the wholesale channel saw an
arc in mileage, starting around the 4th quarter of
2012, peaking in March of 2013, and returning closer
to the trend by late 2013. This arc likely reflects the
popularity of 2007’s combined with the last of the
trucks kept in service longer than usual during the recession.
In terms of actual numbers, the average sleeper tractor wholesaled in the first 11
months of 2013 brought $27,520, had 685,955 miles, and was 87.1 months old.
Compared to same-period 2012, 2013 was $4696 (or 14.6%) lower on price, 50,327 (or
7.3%) higher on mileage, and 4.4 months (or 5.1%) older.
Month-over-month, November, 2013’s pricing was $711 (or 2.4%) higher than October,
and $1185 (or 3.9%) higher than November, 2012. Mileage was 23,455 (or 3.5%) lower
than October, and 1919 (or 0.3%) lower than 2012. See “Average Wholesale Price and
Mileage” graph for detail.
(Continued on page 5)
[ COMMERCIAL TRUCK MARKET TRENDS continued ]

Commercial Truck Guidelines | January 2014
NADA Used Car Guide | 8400 Westpark Drive | McLean, VA 22102 | 800.544.6232 | nada.com/b2b 5
© 2014 NADA Used Car Guide
Volume of trucks sold wholesale was healthier in
2013 than in 2012 and 2011, although not yet back
to levels seen early in the recovery or even during
the recession. The past three years have been
market by cautious purchasing strategies among
fleets, so it is not surprising we have not seen large
volumes of auction and dealer-to-dealer activity. This
factor combined with lukewarm demand for trucks
with over 600,000 miles (which comprise the bulk of
trucks sold wholesale) are likely factors behind the
moderate volume in recent periods. See “Total
Wholesale Sales Reported to NADA” graph for detail.
Looking ahead, we expect mildly increased numbers
of lower-mileage trucks available in the wholesale
channel due to continued increased supply of 3-5
year-old trucks. Higher-mileage trucks should see
mildly accelerated depreciation in this scenario.
Class 8 Construction Trucks
The construction market trended mildly downwards
in terms of pricing over the past 24 months, although
volume was notably higher in 2013. The newest
model years (2009 and newer) saw a mild to
moderate increase in pricing starting in mid-2013,
and all model years increased in November.
Specifically, the average retail and wholesale price of
5-7 year-old (combined) construction trucks for the
first 11 months of 2013 was $72,127. This figure is
$1918 (or 2.6%) lower than same-period 2012.
Mileage for this cohort was 207,100 – 21,750 (or
9.5%) lower than 2012.
(Continued on page 6)
[ COMMERCIAL TRUCK MARKET TRENDS continued ]

Commercial Truck Guidelines | January 2014
NADA Used Car Guide | 8400 Westpark Drive | McLean, VA 22102 | 800.544.6232 | nada.com/b2b 6
© 2014 NADA Used Car Guide
What is not evident in this global average is the recovery in pricing of 2009’s in the 3rd
quarter of 2013. Also, most model years in general were up in November after a weak
October. Finally, anything newer than 2009 is
returning strong pricing, but that observation is
somewhat subjective due to the small sample size of
that group. See the “Average Retail + Wholesale
Price of Construction Trucks” graph for detail.
Looking ahead, the construction segment is linked to
residential and commercial construction, state and
federal infrastructure projects, mining, and the
petroleum industry. Residential and commercial
construction has tracked mild to moderately upward
over the past 24 months. Infrastructure has been
minimally funded since the recession, with a possible increase in the current highway
bill. Mining has been relatively strong, and petroleum has been extremely strong due to
fracking. But these last two sectors have not been enough to increase demand for used
trucks to a great extent. See the Economic Trends section later in this document for
additional analysis.
Model vs. Model Competitive Comparison
This month, we look at the performance of 4-year-old aerodynamic sleepers over the
past 24 months. This means 2009 model year trucks in 2012, and 2010’s in 2013.
First, in terms of global average pricing, 4-year-old trucks performed similarly in 2013
and 2012. This cohort returned an average of $63,764 for the first 11 months of 2013,
compared to $64,616 for same-period 2012, for a 1.3% decrease. However, annual
depreciation was greater in 2012, at roughly 13% over the first 11 months compared to
a mere 1% for same-period 2013.
Mileage was similar in both periods, at 460,656 in 2013 vs. 448,146 in 2012, for a 2.7%
increase in 2013.
The change in depreciation trends is notable. In 2012, higher-priced models depreciated
more heavily than their lower-priced counterparts. In 2013, none of the trucks in this
analysis depreciated at a notable rate, and some even appreciated. This change is even (Continued on page 7)
[ COMMERCIAL TRUCK MARKET TRENDS continued ]

Commercial Truck Guidelines | January 2014
NADA Used Car Guide | 8400 Westpark Drive | McLean, VA 22102 | 800.544.6232 | nada.com/b2b 7
© 2014 NADA Used Car Guide
more interesting when you consider that many 2010’s were equipped with SCR, while
2009’s were not.
One takeaway is that low-mileage trucks enjoyed an even greater premium in 2013 than
2012. The 2010 model year was the lowest build year in recent history, at only 58% of
2009. This ensures a tight supply of 2010’s going forward. Regarding emissions, it is
possible that SCR technology is actually preferred in some circumstances. Any initial
issues with the technology have long been addressed, and trucks so equipped generally
return greater fuel economy. Further, operators in
states with stringent emissions requirements who
plan to hold on to their units for multiple years will
need the latest emissions technology. At the same
time, 2010’s with pre-SCR engines are also
performing well, suggesting continued demand for
that cohort.
In terms of competitive positioning, trucks in the
higher price segment performed similarly over the
past 24 months. In the lower price levels, the
Kenworth T2000 is a surprise, generally
outperforming the average despite being out of
production for four years. This truck is strictly pre-
SCR, providing evidence for a market for that cohort.
The International ProStar is of course the big story.
The majority of 2009’s and 2010’s reported sold
were equipped with Cummins power. As such, the
recovery of this model through 2013 suggests that
marketplace acceptance of Cummins-equipped units
improved dramatically in this period. See the
“Average Retail Selling Price of 4-Year-Old Sleeper
Tractors” graphs for detail.
(Continued on page 8)
[ COMMERCIAL TRUCK MARKET TRENDS continued ]

Commercial Truck Guidelines | January 2014
NADA Used Car Guide | 8400 Westpark Drive | McLean, VA 22102 | 800.544.6232 | nada.com/b2b 8
© 2014 NADA Used Car Guide
Medium Duty Cabovers and Conventionals
Looking first at 4-7 year-old Class 3-4 cabovers, aside from a spike in September of 2012
attributable to a group of unusually new and low-mileage trucks sold, this cohort
returned mild depreciation through mid-2013, at which point prices declined more
notably. As you can see in the “4-7 Year-Old Class 3-
4 Cabovers” graph, this price decline is due mainly to
increased mileage of trucks sold.
Year-over-year, average mileage increased from
102,386 in 2012 to 116,175 in 2013 – an 11.9%
increase. But the increase in the second half of 2013
is even more notable. In this period, average mileage
was 130,121, compared to 96,489 in same-period
2012 – a 25.8% increase. This shift suggests that
owners who kept their trucks as long as possible
have finally started trading them in on new or newer
equipment.
Month-over-month results were very similar, with November coming in at $10,078 vs.
October’s $10,425 – a decrease of $347 (or 3.3%). Mileage was also very similar, at
132,632 in November and 129,151 in October – an increase of 3481 (or 2.6%).
Interestingly, the volume of trucks reported sold was notably lower in 2013, coming in at
an annual average of 25.8 trucks per month vs. 41.7 in 2012. It is likely that the higher-
mileage supply of trucks in 2013 is simply a more difficult sell. The daily rental and urban
delivery markets served by this segment appear to be adequately supplied at present.
Moving over to conventionals, both Class 4 and Class 6 saw price spikes in early 2012,
depreciating notably through midyear, and ending up flat since then. Mileage for both
groups ticked upwards over the past 24 months, and volume decreased.
Looking specifically at Class 4, the spike in pricing was strongest in January of 2012.
There was also a greater volume of trucks sold that month. Average mileage was
moderately lower than surrounding months. In the absence of any unusual mitigating
(Continued on page 9)
[ COMMERCIAL TRUCK MARKET TRENDS continued ]

Commercial Truck Guidelines | January 2014
NADA Used Car Guide | 8400 Westpark Drive | McLean, VA 22102 | 800.544.6232 | nada.com/b2b 9
© 2014 NADA Used Car Guide
factors, it appears that there was simply demand early in the year for trucks with
mileage in the high-5 figures.
Class 4’s averaged $14,234 in 2013, vs. $14,980 in 2012 – a decrease of $746 (or 5.0%).
Average mileage was 108,428 in 2013, and 96,840 in 2012 – an increase of 11,588 (or
10.7%). Volume averaged 51.6 trucks per month in 2013, and 74.8 in 2012 – a decrease
of 23.2 trucks (or 31.0%).
November returned a month-over-month increase,
coming in at $14,784 - $2334 (or 15.8%) higher than
October. Mileage was lower, at 107,484 vs. 115.741
– a difference of 8257 (or 7.1%). A monthly
improvement is encouraging, but until we see
multiple months of increased pricing, we will refrain
from identifying a recovery in this segment. There
are still more than enough trucks with over 100,000
miles available to the marketplace. See the “4-7 year
-Old Class 4 Conventionals” graph for detail.
Looking at Class 6, the price spike in early 2012 was due mainly to a lower-mileage mix
of trucks sold in the 1st quarter. Unlike the Class 4 segment, there were actually fewer
trucks sold in this period than in surrounding months, suggesting that demand existed
mainly for trucks with lower mileage.
Year-over-year, 2013’s average pricing was $15,312, compared to $16,573 in 2012. This
figure represents a $1261 (or 7.6%) decrease in 2013. Mileage was 186,199 in 2013 vs.
161,864 in 2012 – a 24,315 (or 13.1%) increase for 2013. Volume was lower in 2013, at
43.1 trucks per month vs. 59.2 in 2012 – a 27.2% decrease.
So there were fewer trucks sold in 2013, and those that sold had higher mileage. At the
same time, trucks at a given mileage level brought similar pricing year-over-year, so
demand for trucks with usable life has not changed appreciably. There are simply more
higher-mileage trucks available at present.
Month-over-month, Class 6’s improved dramatically in November, coming in at $17,050
– an increase of $4041 (or 23.7%) over October. Mileage was lower, at 161,837 vs.
186,810 last month – a decrease of 24,973 (or 13.4%). November’s result was the
(Continued on page 10)
[ COMMERCIAL TRUCK MARKET TRENDS continued ]
Commercial Truck Guidelines | January 2014
NADA Used Car Guide | 8400 Westpark Drive | McLean, VA 22102 | 800.544.6232 | nada.com/b2b 10
© 2014 NADA Used Car Guide
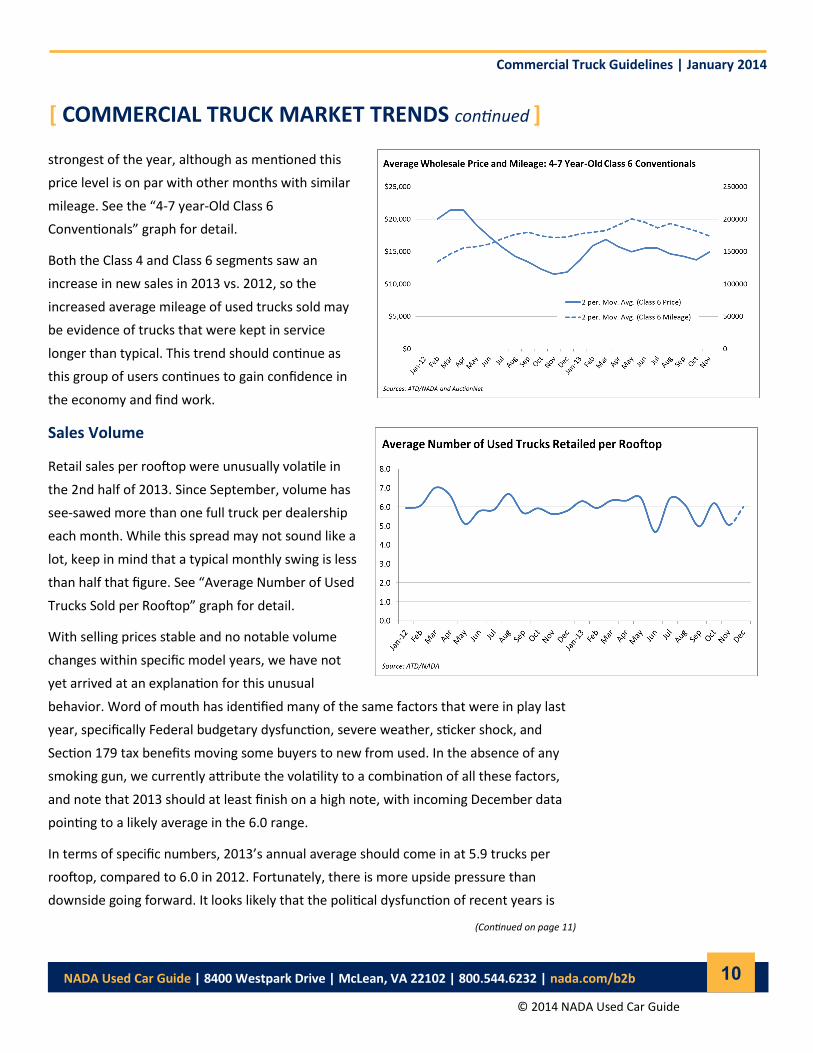
strongest of the year, although as mentioned this
price level is on par with other months with similar
mileage. See the “4-7 year-Old Class 6
Conventionals” graph for detail.
Both the Class 4 and Class 6 segments saw an
increase in new sales in 2013 vs. 2012, so the
increased average mileage of used trucks sold may
be evidence of trucks that were kept in service
longer than typical. This trend should continue as
this group of users continues to gain confidence in
the economy and find work.
Sales Volume
Retail sales per rooftop were unusually volatile in
the 2nd half of 2013. Since September, volume has
see-sawed more than one full truck per dealership
each month. While this spread may not sound like a
lot, keep in mind that a typical monthly swing is less
than half that figure. See “Average Number of Used
Trucks Sold per Rooftop” graph for detail.
With selling prices stable and no notable volume
changes within specific model years, we have not
yet arrived at an explanation for this unusual
behavior. Word of mouth has identified many of the same factors that were in play last
year, specifically Federal budgetary dysfunction, severe weather, sticker shock, and
Section 179 tax benefits moving some buyers to new from used. In the absence of any
smoking gun, we currently attribute the volatility to a combination of all these factors,
and note that 2013 should at least finish on a high note, with incoming December data
pointing to a likely average in the 6.0 range.
In terms of specific numbers, 2013’s annual average should come in at 5.9 trucks per
rooftop, compared to 6.0 in 2012. Fortunately, there is more upside pressure than
downside going forward. It looks likely that the political dysfunction of recent years is
(Continued on page 11)
[ COMMERCIAL TRUCK MARKET TRENDS continued ]

Commercial Truck Guidelines | January 2014
NADA Used Car Guide | 8400 Westpark Drive | McLean, VA 22102 | 800.544.6232 | nada.com/b2b 11
© 2014 NADA Used Car Guide
improving, judging by the apparent reduced influence of each party’s more extreme
factions. The resulting budget agreement late last year has alleviated some of the
uncertainty that has kept businesses on the fence. Section 179 is still a wild card,
because even though it was not renewed, businesses know that it could potentially be
retroactively reinstated. This factor may have limited acquisitions late in the year.
Weather may seem like a somewhat absurd factor behind market dynamics, but keep in
mind the more severe storms can change capital investment strategies in large areas if
damage is extensive. Sticker shock is a logical product of historically high pricing, but we
will need to see reduced volume and pricing in the newest model years before we fully
endorse this explanation.
Conclusion
Incoming 2012 models should mildly satiate demand for low-mileage sleeper tractors as
2014 progresses, placing mild downward pressure on the newest used trucks. Economic
conditions will continue to improve, likely assisted by a return to somewhat more
rational budgetary processes. Any increase in construction expenditures in the public
and private sectors will support the construction segment. Medium duty trucks will
continue to be impacted by an ample supply of units with over 100,000 miles, although
trucks with mileage substantially lower than that should return strong pricing. Please
see the Economic Trends section of this report for deeper analysis of these factors.
Be sure to keep up with our Commercial Vehicle Blog for twice-weekly updates on
market data, located at www.nada.com/b2b.
[ COMMERCIAL TRUCK MARKET TRENDS continued ]

Commercial Truck Guidelines | January 2014
NADA Used Car Guide | 8400 Westpark Drive | McLean, VA 22102 | 800.544.6232 | nada.com/b2b 12
© 2014 NADA Used Car Guide
Fears of another government shutdown in January were alleviated as the president
signed the Bipartisan Budget Act of 2013 into law, which was passed by both chambers
of Congress in mid-December. The deal prevents another government shutdown for the
next two years by setting overall spending figures through 2015. The automatic budget
cuts under sequestration are partially mitigated through $65 billion of increased
spending on various defense and non-defense programs. Meanwhile, a projected $85
billion will be raised through various means elsewhere in the budget. However,
congressional brinksmanship over the debt ceiling may again put the economy at risk by
late February or early March, which is when Treasury Secretary Jack Lew predicts the
government will reach its debt limit.
The healthy economic expansion of 3.6% in the July-September quarter has been further
revised by the Bureau of Economic Analysis. Third quarter growth in Gross Domestic
Product, the broadest measure of economic activity, was revised upward to 4.1%. This
final revision largely reflects gains in fixed investments and accelerations in state and
local government spending; however, much of the increase was also due to businesses
building up their inventories.
Consumer spending increased by 0.5% in November after a 0.4% gain the previous
month, according to the Commerce Department. This mirrors a popular measure of
consumer confidence, the Thomson Reuters/University of Michigan Index of Consumer
Sentiment, which climbed to 82.5 from 75.1 in November. A somewhat more optimistic
view of the economy and improved attitudes toward durable goods purchases by
consumers are reflected in these numbers. Meanwhile, holiday sales between
November 1 and December 24 rose by 2.3% compared with the 2012 season, according
to the MasterCard Advisors’ Spending Pulse report. Although there were six fewer days
between Thanksgiving and Christmas this year compared with 2012, there was a clear
improvement in sales numbers compared to the last holiday season, although many of
these were driven by deep discounts. Growth in consumer spending has likely served as
a bulwark supporting economic growth in the fourth quarter.
Healthy holiday sales levels were accompanied by expanding manufacturing activity in
December. The Institute for Supply Management (ISM) index of national manufacturing
activity was 57 in December after standing at 57.3 in November, the highest levels since
April 2011. Any number over 50 indicates that manufacturing is expanding, in turn
(Continued on page 13)
[ ECONOMIC TRENDS ]

Commercial Truck Guidelines | January 2014
NADA Used Car Guide | 8400 Westpark Drive | McLean, VA 22102 | 800.544.6232 | nada.com/b2b 13
© 2014 NADA Used Car Guide
promoting employment and strengthening economic growth. A particular bright spot is
the new orders measure of the ISM index, which rose to 64.2 in December. New orders
are prompting manufacturers to hire more workers, which is a trend that is likely to
continue in the first few months of 2014 as inventory is being depleted.
U.S. private employers added more jobs than
expected in December, according to the ADP
National Employment Report. While the consensus
forecast was 215,000 jobs, private employers added
238,000 jobs in the month of December, making it
the strongest month for job growth in 2013 based
on ADP’s estimates. Multiple industries experienced
healthy gains in payrolls rather than growth being
concentrated in one industry. The business services,
construction and transportation sectors all produced
around 50,000 new jobs in December. Furthermore,
November’s private payroll gains were revised to
229,000 from the previously reported 215,000.
Buoyed by recent labor market data and optimistic
economic projections, the Federal Open Market
Committee (FOMC) voted to commence the tapering
of bond purchases in its December meeting. Beginning
in January, the Federal Reserve’s purchases of long-
term Treasuries and mortgage-backed securities will
fall from $85 billion per month to $75 billion per
month, with an equal reduction in purchases of both
types of securities. The rate at which the FOMC will
reduce monthly purchases after January is contingent
on its outlook for the labor market and inflation, as well as the perceived effectiveness
of the program. Assuming the economic recovery stays on course, long-term interest
rates are likely to increase over 2014 as the Federal Reserve winds down its bond
purchases.
Meanwhile, the FOMC strengthened its language in support of keeping the Federal
(Continued on page 14)
[ ECONOMIC TRENDS continued ]
100.0
300.0
500.0
700.0
900.0
1100.0
1300.0
Jan
-08
Ma
r-08
Ma
y-0
8
Jul-
08
Sep
-08
No
v-0
8
Jan
-09
Ma
r-09
Ma
y-0
9
Jul-
09
Sep
-09
No
v-0
9
Jan
-10
Ma
r-10
Ma
y-1
0
Jul-
10
Sep
-10
No
v-1
0
Jan
-11
Ma
r-11
Ma
y-1
1
Jul-
11
Sep
-11
No
v-1
1
Jan
-12
Ma
r-12
Ma
y-1
2
Jul-
12
Sep
-12
No
v-1
2
Jan
-13
Ma
r-13
Ma
y-1
3
Jul-
13
Sep
-13
No
v-1
3
Ho
usi
ng
Sta
rts
(th
ou
san
ds)
Month
Total Housing Starts, Privately OwnedSeasonally Adjusted
Source: U.S. Census Bureau
100.0
110.0
120.0
130.0
140.0
150.0
160.0
170.0
180.0
190.0
Jan
-08
Ma
r-08
Ma
y-0
8
Jul-
08
Se
p-0
8
No
v-0
8
Jan
-09
Ma
r-0
9
Ma
y-0
9
Jul-
09
Se
p-0
9
No
v-0
9
Jan
-10
Ma
r-1
0
Ma
y-1
0
Jul-
10
Se
p-1
0
No
v-1
0
Jan
-11
Ma
r-1
1
Ma
y-1
1
Jul-
11
Se
p-1
1
No
v-1
1
Jan
-12
Ma
r-1
2
Ma
y-1
2
Jul-
12
Se
p-1
2
No
v-1
2
Jan
-13
Ma
r-13
Ma
y-1
3
Jul-
13
Se
p-1
3
Ind
ex
Leve
l
Month
S&P/Case-Shiller 20-City Composite Home Price IndexThree-month moving average published with a two-month lag.
Source: S&P Dow JonesSource: S&P Dow Jones

Commercial Truck Guidelines | January 2014
NADA Used Car Guide | 8400 Westpark Drive | McLean, VA 22102 | 800.544.6232 | nada.com/b2b 14
© 2014 NADA Used Car Guide
Funds Rate near 0%. It now maintains that based on labor market conditions and low
inflation expectations, it will be appropriate to maintain the current target for the
federal funds rate “well past the time the unemployment rate declines below 6.5%”. As
a result, short-term interest rates are highly unlikely to rise in 2014. The policy of
maintaining short-term interest rates at near 0% is
expected to continue under Ben Bernanke’s
successor, Janet Yellen, who is supportive of an
accommodative monetary policy until the labor
market improves significantly. She will take over the
reins of the Federal Reserve Board of Governors
when Ben Bernanke’s tenure as Chairman ends at
the end of January.
According to the National Association of Realtors,
recently released data on the housing market offers
mixed interpretations of its state. Total existing-
home sales, which are completed transactions that
include single-family homes, townhomes,
condominiums and co-ops, fell 1.2% to a seasonally
adjusted annual rate of 4.9 million units in
November. This is the first time in 29 months that
sales were below year-ago levels. November sales
were 4.3% lower than the October rate of 5.12
million units.
The national median existing-home price for all
housing types was $196,300 in November, which is
up 9.4% from November 2012. Total housing
inventory at the end of November was 2.09 million
existing homes available for sale, a 0.9% decline compared with October. This represents
a 5.1-month supply, compared with 4.9 months in October. November unsold inventory
was up 5% compared to the 4.8-month supply of November 2012.
One important variable that is likely to change in the upcoming year is mortgage rates,
which are closely linked with long-term Treasury rates. Consistent with the improving
(Continued on page 15)
[ ECONOMIC TRENDS continued ]
($0.25)
($0.20)
($0.15)
($0.10)
($0.05)
$0.00
$0.05
$0.10
$0.15
$0.20
$3.70
$3.75
$3.80
$3.85
$3.90
$3.95
$4.00
$4.05
$4.10
$4.15
Price
Ch
ange
Ave
rage
Pri
ce
Month
On-Highway Diesel Fuel PricesAverage Price Per Gallon $ YoY Change
Source: U.S. Energy Information Administration
($0.50)
($0.40)
($0.30)
($0.20)
($0.10)
$0.00
$0.10
$0.20
$0.30
$0.40
$3.10
$3.20
$3.30
$3.40
$3.50
$3.60
$3.70
$3.80
$3.90
$4.00
Price Change
Ave
rage
Pri
ce
Month
Regular Grade Gasoline Prices (all formulations)Average Price Per Gallon $ YoY Change
Source: U.S. Energy Information Administration

Commercial Truck Guidelines | January 2014
NADA Used Car Guide | 8400 Westpark Drive | McLean, VA 22102 | 800.544.6232 | nada.com/b2b 15
© 2014 NADA Used Car Guide
housing market and anticipation of the end of Federal Reserve bond purchases, 30-year
conventional, fixed-rate mortgage rates rose to a national average commitment rate of
4.46% in December from 4.26% in November and 3.41% in January 2013.
The U.S. average retail price of regular gasoline edged up through the month of
December. It has increased from $3.27 on Dec. 2 to $3.33 on Jan. 6. This is 3 cents
higher than the first week of 2013. The stable retail gasoline prices throughout
December largely reflect slightly declining Brent crude oil prices. The price of Brent is
traditionally the most relevant determinant of the price of gasoline. Between Dec. 2 and
Jan. 2, Brent prices decreased by $3.55 per barrel while the West Texas Intermediate
(WTI) price rose by $1.53 per barrel over the same period. The EIA expects that Brent
prices will continue to fall, leading the average price of gasoline over 2014 to be $3.46
per gallon, down from $3.51 in 2013. However, the EIA is careful to note that prices can
differ significantly from forecast levels, particularly because the global supply of crude
oil is highly dependent on geopolitical events.
[ ECONOMIC TRENDS continued ]
Commercial Truck Guidelines | January 2014
NADA Used Car Guide | 8400 Westpark Drive | McLean, VA 22102 | 800.544.6232 | nada.com/b2b 16
© 2014 NADA Used Car Guide
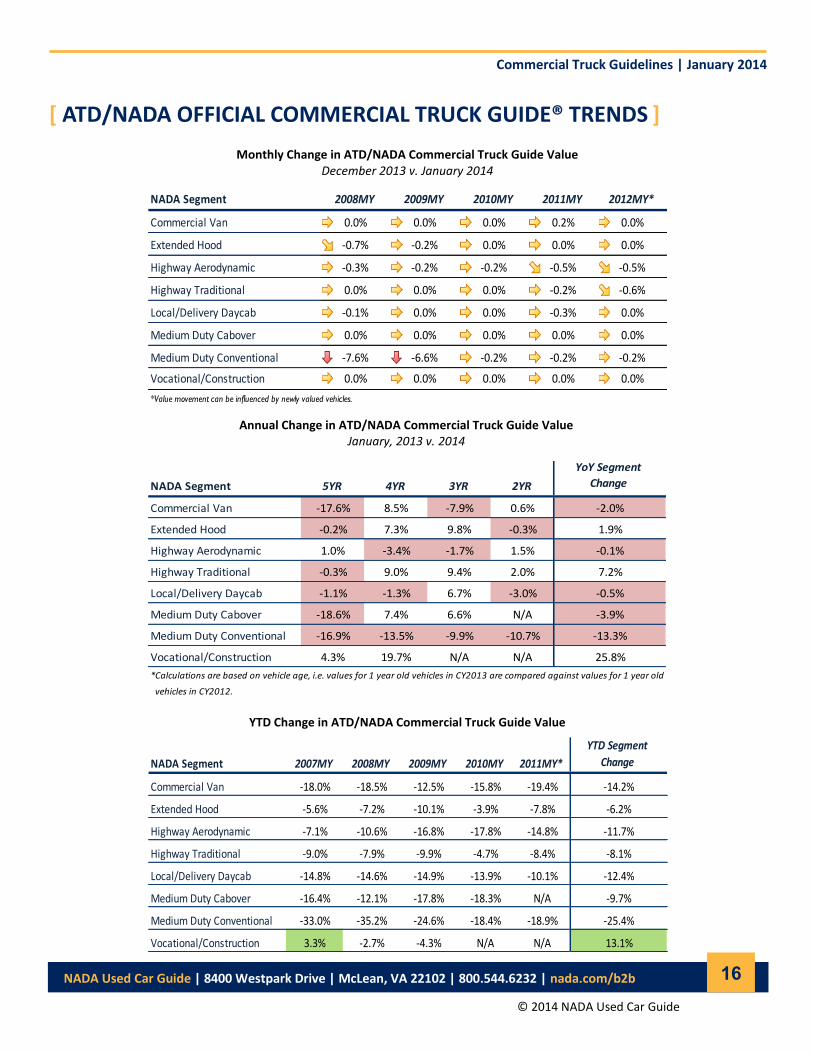
[ ATD/NADA OFFICIAL COMMERCIAL TRUCK GUIDE® TRENDS ]
Monthly Change in ATD/NADA Commercial Truck Guide Value December 2013 v. January 2014
Annual Change in ATD/NADA Commercial Truck Guide Value January, 2013 v. 2014
YTD Change in ATD/NADA Commercial Truck Guide Value
NADA Segment 5YR 4YR 3YR 2YR
YoY Segment
Change
Commercial Van -17.6% 8.5% -7.9% 0.6% -2.0%
Extended Hood -0.2% 7.3% 9.8% -0.3% 1.9%
Highway Aerodynamic 1.0% -3.4% -1.7% 1.5% -0.1%
Highway Traditional -0.3% 9.0% 9.4% 2.0% 7.2%
Local/Delivery Daycab -1.1% -1.3% 6.7% -3.0% -0.5%
Medium Duty Cabover -18.6% 7.4% 6.6% N/A -3.9%
Medium Duty Conventional -16.9% -13.5% -9.9% -10.7% -13.3%
Vocational/Construction 4.3% 19.7% N/A N/A 25.8%
*Calculations are based on vehicle age, i.e. values for 1 year old vehicles in CY2013 are compared against values for 1 year old
vehicles in CY2012.
NADA Segment 2007MY 2008MY 2009MY 2010MY 2011MY*
YTD Segment
Change
Commercial Van -18.0% -18.5% -12.5% -15.8% -19.4% -14.2%
Extended Hood -5.6% -7.2% -10.1% -3.9% -7.8% -6.2%
Highway Aerodynamic -7.1% -10.6% -16.8% -17.8% -14.8% -11.7%
Highway Traditional -9.0% -7.9% -9.9% -4.7% -8.4% -8.1%
Local/Delivery Daycab -14.8% -14.6% -14.9% -13.9% -10.1% -12.4%
Medium Duty Cabover -16.4% -12.1% -17.8% -18.3% N/A -9.7%
Medium Duty Conventional -33.0% -35.2% -24.6% -18.4% -18.9% -25.4%
Vocational/Construction 3.3% -2.7% -4.3% N/A N/A 13.1%
NADA Segment 2008MY 2009MY 2010MY 2011MY 2012MY*
Commercial Van 0.0% 0.0% 0.0% 0.2% 0.0%
Extended Hood -0.7% -0.2% 0.0% 0.0% 0.0%
Highway Aerodynamic -0.3% -0.2% -0.2% -0.5% -0.5%
Highway Traditional 0.0% 0.0% 0.0% -0.2% -0.6%
Local/Delivery Daycab -0.1% 0.0% 0.0% -0.3% 0.0%
Medium Duty Cabover 0.0% 0.0% 0.0% 0.0% 0.0%
Medium Duty Conventional -7.6% -6.6% -0.2% -0.2% -0.2%
Vocational/Construction 0.0% 0.0% 0.0% 0.0% 0.0%
*Value movement can be influenced by newly valued vehicles.

Commercial Truck Guidelines | January 2014
NADA Used Car Guide | 8400 Westpark Drive | McLean, VA 22102 | 800.544.6232 | nada.com/b2b 17
© 2014 NADA Used Car Guide
AT NADA USED CAR GUIDE
What’s New
NADA Online delivers values from 10 different NADA guidebooks including weekly values for commercial trucks.
Starting at $385 per year, NADA Online is comprehensive, easy to use and includes mobile web access free with your
subscription. And since it’s web-based, there is no software to install and your whole staff can use it at the same time
without the need for additional user licenses. NADA Online provides NADA Retail, Loan and Wholesale values for
truck and trailers dating back to the 2000 model year. If you’re looking for a small number of commercial vehicle
values, the Official Commercial Truck Guide Online Mini-Pack provides three values online for $40.
On the Road
Chris Visser, senior analyst and product manager for ATD/NADA Commercial Truck Guide, will be at the 2014 NADA
Convention & Expo in New Orleans from January 24 to January 27. Stop by booth #1714 for demos on our commercial
truck products and receive a Starbucks gift card.
Visser is also conducting a workshop titled “Understand and Manage Used Trucks.” The workshop will focus on the
importance of trucks to a dealership’s bottom line and tools and methods for managing inventory and increasing
exposure. You can participate in the workshop on Saturday, January 25 at 10:30 a.m. in Room 223 or Sunday, January
26 at 10:30 a.m. in Room 224.
About NADA Used Car Guide
Since 1933, NADA Used Car Guide has earned its reputation as the leading provider of vehicle
valuation products, services and information to businesses throughout the United States and
worldwide. NADA’s editorial team collects and analyzes over one million combined
automotive and truck wholesale and retail transactions per month. Its guidebooks, auction
data, analysis, and data solutions offer automotive/truck, finance, insurance and government
professionals the timely information and reliable solutions they need to make better business
decisions. Visit nada.com/b2b to learn more.
Senior Analyst and Product Manager Chris Visser 800.248.6232 x4731 [email protected]
Automotive Dealers, Auctions, Insurance Dan Ruddy 800.248.6232 x4707 [email protected]
Credit Unions, Fleet, Lease, Rental Industry, Government Doug Ott 800.248.6232 x4710 [email protected]
Business Development Manager Jim Gibson 800.248.6232 x7136 [email protected]
Financial Industry, Accounting, Legal, OEM Captive Steve Stafford 800.248.6232 x7275 [email protected]
PR Manager Allyson Toolan 800.248.6232 x7165 [email protected]

Commercial Truck Guidelines | January 2014
NADA Used Car Guide | 8400 Westpark Drive | McLean, VA 22102 | 800.544.6232 | nada.com/b2b 18
© 2014 NADA Used Car Guide
NADA CONSULTING SERVICES
NADA’s market intelligence team leverages a database of nearly 200 million transactions and more than
100 economic and market-related series to describe the factors driving current trends to help industry stakeholders
make more informed decisions. Analyzing data at both wholesale and retail levels, the team continuously provides
content that is both useful and usable to dealers, financial institutions, businesses and consumers.
Complemented by NADA’s analytics team, which maintains and advances NADA’s internal forecasting models and
develops customized forecasting solutions for clients, the market intelligence team is responsible for publishing white
papers, special reports and the Commercial Vehicle Blog. Throughout every piece of content, the team strives to go
beyond what is happening in the industry to confidently answer why it is happening and how it will impact the market
in the future.
ADDITIONAL RESOURCES
Connect with NADA
White Papers NADA’s white papers and special reports aim to inform industry stakeholders on current and expected used vehicle price movement to better maximize today’s opportunities and manage tomorrow’s risk.
Commercial Vehicle Blog Written and managed by Senior Analyst Chris Visser, the Commercial Vehicle Blog analyzes market data, lends insight into industry trends and highlights relevant events.
NADA Perspective
Leveraging data from various industry
sources and NADA’s analysts, NADA
Perspective takes a deep dive into a
range of industry trends to determine
why they are happening and what to
expect in the future.
Guidelines Updated monthly with a robust data set from various industry sources and NADA’s own proprietary analytical tool, Guidelines provides the insight needed to make decisions in today’s market.
Read our Blog nada.com/commercialtruck
Follow Us on Twitter @NADAUsedCarGde
Find Us on Facebook Facebook.com/NADAUsedCarGuide
Watch Us on YouTube Youtube.com/NADAUsedCarGuide
Disclaimer: NADA Used Car Guide makes no representations about future performance or results based on the data and the contents available in this report (“Guidelines”). Guidelines is provided for informational purposes only and is provided AS IS without warranty or guarantee of any kind. By accessing Guidel ines via email or the NADA website, you agree not to reprint, reproduce, or distribute Guidelines without the express written permission of NADA Used Car Guide.
Senior Director, Vehicle Analysis & Analytics Jonathan Banks 800.248.6232 x4709 [email protected]
Senior Analyst and Product Manager Chris Visser 800.248.6232 x4731 [email protected]