Embed Size (px)
Citation preview

Power Factor Correction & Harmonic Distortion Control
3 5Cesium from High Level Liquid Radioactive Waste
Recovery
Bi-monthly • March - April • 2017 ISSN: 0976-2108
N E W S L E T T E R
Cask of Cesium Pencil
transferred to BRIT


Editorial Committee
Chairman
Dr. G.K. Dey
Materials Group
Editor
Dr. G. Ravi Kumar
SIRD
Members
Dr. G. Rami Reddy, RSD
Dr. A.K. Tyagi, Chemistry Divn.
Dr. S. Kannan, FCD
Dr. C.P. Kaushik, WMD
Dr. S. Mukhopadhyay,
Seismology Divn.
Dr. S.M. Yusuf, SSPD
Dr. B.K. Sapra, RP&AD
Dr. J.B. Singh, MMD
Dr. S.K. Sandur, RB&HSD
Dr. R. Mittal, SSPD
Dr. Smt. S. Mukhopadhyay, ChED
C O N T E N T S
Automation System for Fuel Pellet Handling & Inspection in Shielded Facility
Recovery of Cesium from High Level Liquid Radioactive Waste for Societal Application: An Important MilestoneC.P. Kaushik, Amar Kumar, Neelima S. Tomar, S. Wadhwa, Darshit Mehta, R.K. Mishra, Jyoti Diwan, Suresh Babu, S.K. Marathe, A.P. Jakhete, Savita Jain, Anand G. and Kailash Agarwal
1
2
3
18
2016 Nobel Prize in Chemistry – They Developed The World's Smallest Machines!Dr. A. C. Bhasikuttan
5
14
Power Factor Correction & Harmonic Distortion Control for AC-DC Fault Tolerant Power Distribution System & Power Quality QualificationTest Results as per IEC 61000-3-2Shantanu Das and P. Sudhakar
Potential of Luminescence Based Molecular Animal Imaging in Research Areas Pertaining to Cancer Biology and TherapyHansa D. Yadav, Neena G. Shetake, Murali MS Balla, Amit Kumar and B.N. Pandey
Development of Geyser Pump for Lifting Solid Particles in a continuous Rotary DissolverShaji Karunakaran, G. Sugilal, K. Agarwal, R. Srinath and K.M. Singh

A Brief Report on the Training Course on “Basic Radiological Safety and Regulatory Measures for Nuclear Facilities”, organised by BSC Secretariat
27
22
Indigenous Development of Pulsed Neutron Generators for Analytical ApplicationsRishi Verma, Rohit Shukla, Ekansh Mishra, Prosenjit Dhang, Premanand Dey, Karuna Sagar, Manraj Meena and Archana Sharma

Machines are an integral part of development, helping us to perform tasks that often fall beyond human capacities. The limit of this endeavour is to make molecular-sized machines, that are a thousand times thinner than a hair strand. Rightly, the contributions in this area bagged the Nobel Prize in Chemistry -2016 and is awarded jointly to Jean-Pierre Sauvage (France), Sir J. Fraser Stoddart (USA) and Bernard L. Feringa (Netherlands) for the design and sy nthesi s of molecular machines. Their work has formed the basis for an entirely new field of r e s e a r c h t h a t s u c c e s s f u l l y demonstrated that rational design and synthesis of molecular machines are indeed possible and here is how they succeeded in linking molecules together to design everything from a tiny lift to motors and minuscule muscles, nanocars etc.
The first step towards a molecular machine was taken by Jean-Pierre Sauvage in 1983, when his group succeeded in linking two ring-shaped molecules together, called a catenane (I). Sauvage was able to show how such interlocked rings can
2016 Nobel Prize in Chemistry –
They Developed The World's Smallest Machines!
Dr. A. C. Bhasikuttan
Radiation & Photochemistry Division
electron-rich, and the ring threaded onto the axle, mimicking piston like movement. Later on Stoddart's group used various such rotaxanes to construct numerous molecular machines, including a lift, which can raise itself 0.7 nanometres above a surface (III), and an artificial muscle (IV), where rotaxanes bend a thin gold lamina.
|BARC Newsletter 2017 1| March-April
Brief Communication
Jean-Pierre Sauvage
J. Fraser Stoddart
Bernard L. Feringa
undergo controlled motion with an external stimulus. The contribution from Fraser Stoddart became notable in 1991, when he developed a rotaxanes (II). He designed molecules that are attracted to each other. His research group built an open ring that lacked electrons, and a long rod, (or axle), that had electron-rich structures in two places (II). When the two molecules met in a solution, electron-poor was attracted to
(I) Synthesis of [2]catenane using metal coordination
(II) Ring on axle
(III) Molecular Lift
Propelling single molecules in a controlled manner along an unmodified surface remains extremely challenging as it requires molecules that can use light, chemical or electrical energy to modulate their interaction with the surface in a way that generates motion. Bernard Feringa utilized isomerisable bonds and molecular asymmetry concepts and succeeded in demonstrating directional motion of a four-wheeled molecule on a metal surface, simulating a four-wheel drive “nanocar” (V).
An important point in the Nobel Prize in Chemistry-2016 is that researchers have driven molecular systems away from the equilibrium to get the work done. Just like the molecules of life (proteins, carbohydrates, lipids and nucleic acids), Sauvage's, Stoddart's and Feringa's artificial molecular systems perform a controlled task. The challenge; these molecular machines will have to be organized into large assemblies and connected to the macroscopic world to realize functional devices operating at visible dimensions.
(IV) Movement like 'muscle'
(V) Movement in a nanocar

Automation System for Fuel Pellet Handling & Inspection in Shielded Facility
Reactor Design & Development Group and Nuclear Fuels Group
233Fabrication of U based fuel for Advance Heavy Water Reactor (AHWR) is a challenging task due to presence of
232highly gamma active U contamination in the fuel. This requires entire operations of this fuel fabrication to be performed remotely in shielded cells. In order to demonstrate fully automated fuel fabrication, a first of its kind mock-up facility was developed and commissioned in BARC. This mock-up facility includes automation systems developed for fuel pellet fabrication, sintered pellet handling & inspection and fuel pin fabrication.
Brief communication articles on the automation systems developed for this mock-up facility, i.e. “Automated Powder Processing, Pelletisation System” and “Automated Fuel Pin Fabrication System” have already been published in recent editions of BARC newsletter.
This article describes, a full scale automation system, recently developed and installed at BARC, to demonstrate automated sintered fuel pellet handling and inspection in shielded facility.
Sintered pellets fabricated through the powder-pellet ceramic route are required to be inspected for their diameters and surface defects; sorted based on their diameters; degassed; stacked to specified lengths and inserted into a tube. The automated operation starts with receiving of sintered pellets in boats and ends with loading accepted pellets into clad tube after thorough inspections, degassing and stack length confirmation. Cylindrical pellets of 9.8±0.4 mm diameter and
13±1 mm length are used for demonstration of system operation.
Following major operations are automated;
Boat transfer & pellets unloading from the BoatŸ
Ÿ Pellet sorting using Mechanical sorting system, LASER Micrometer and LVDT based system
Ÿ Visual Inspection of the pellets
Ÿ Loading the pellets into a Degassing Cage
Ÿ Degassing Cage handling
Ÿ Degassing furnace operations
Ÿ Unloading the pellets from the Degassing Cage
Ÿ Pellet Stacking and stack length measurement
Ÿ Insertion of the pellets & other structural components into the Clad Tube
All equipments are designed for remote maintenance, including their remote removal and remote installation. All operations are controlled automatically and remotely monitored. Operator can intervene and control the system in semi-automated or manual modes. Inspection results of all pellets are logged and are available for analysis. The online status of all stations is available at control station on a SCADA screen. Images from CCTV cameras are monitored continuously to monitor the safe operation. System reliable operation in the given space constraints of shielded cell has been the real challenge in system design.
Brief Communication
Fig 1: Full Scale Mock-up Facility (3D Model) Fig 2: Full Scale Mock-up Facility (Installation)
|BARC Newsletter 2| March-April 2017

Recovery of Cesium from High Level Liquid Radioactive Waste for Societal Application: An Important Milestone
C.P. Kaushik, Amar Kumar, Neelima S. Tomar, S. Wadhwa, Darshit Mehta, R.K. Mishra, Jyoti Diwan, Suresh Babu, S.K. Marathe, A.P. Jakhete, Savita Jain, Anand G. and Kailash AgarwalWaste Management Division, Nuclear Recycle Group
Waste Management Division has achieved a milestone in production of radioactive cesium pencils to be used towards societal benefits, for health care sector in blood irradiation process. India has adopted a closed fuel cycle for energy security as envisaged by our founder Dr Homi J. Bhabha, where reprocessing of spent reactor fuel and generation of radioactive waste is inevitable. The 90% of radioactivity content of waste is on account on Cesium and Strontium radio-isotopes generated during fission process in the nuclear reactor. This radioactive waste is rich in cesium radionuclide, which thereby makes it a potent source of recovery. Challenge lies in the recovery of cesium from the radioactive waste streams, which has presence of other radioactive fission products, long lived minor actinides and inactive constituents added during reprocessing. A chemical, based on calyx crown
ether which is highly selective for recovery of Cesium from waste, has been indigenously developed at Nuclear Recycle Group. The plant scale facility At Waste Immobilization Plant, Trombay for recovery of cesium from High Level Liquid radioactive Waste (HLLW) has been accomplished using solvent extraction process after extensively testing the efficacy of process on laboratory scale. More than 1,20,000 Ci of radioactive Cs-137 has been recovered within a period of one year. This recovered cesium was successfully conditioned into a non dispersive and chemically inert form in specially formulated borosilicate glass matrix. The vitrified cesium glass is poured in Stainless steel pencils. These pencils are subjected to various stringent quality assurance checks, at par with international standards. The mechanism involved in the pencil welding system, leak detection test, surface
|BARC Newsletter 2017 3| March-April
Brief Communication
Fig. 1: An overview of cesium pencil making process

HE detector LE detector
|BARC Newsletter 4| March-April 2017
decontamination system has been in-house developed at WMD. At WIP Trombay, 102 numbers of cesium pencils have been produced till date, (Fig. 1).
These pencils are handed over to BRIT in a lead shielded cask, from where these are subsequently transferred to blood irradiators for shipment to various hospitals. Ten such pencils, containing radioactive cesium, are used in each blood irradiator. This would replace use of Cobalt-60 in these irradiators, which is presently being used as the source for the blood irradiation to save on replacement and isotope production at nuclear reactor. The irradiation of blood is very much essential to prevent Transfusion Associated – Graft Vs Host Disease (TA-GVHD) particularly for immune-deficient patients. Various qualities of Cesium, such as longer half life, lower shielding requirement and amenability to be used in non dispersive glass form makes it a more suitable irradiation source.
India is the fore-runner in this technology for selectively partitioning of Cesium from HLLW, immobilizing in vitreous matrix and thereby deploying in blood irradiator.
This milestone of production of 100 numbers of cesium glass pencils and handing over the tenth cask, was marked on March 17, 2017 where Dr. Sekhar Basu, Chairman, AEC and Secretary, DAE, Government of India; Shri K. N. Vyas, Director, BARC; Shri Kailash Agarwal, Associate Director, NRG; Shri Y. K. Taly, Chairman Barc Safety Council; Shri G. Ganesh, Chief Executive, BRIT; Dr. Pradeep Kumar AD, HS&EG and Dr. C. P. Kaushik, Chief Superitendant, Waste Management Division along with other senior scientists of BARC had graced the occasion at WIP Trombay. (Fig. 2)
It makes us proud to announce that India is the first country to adopt the engineering scale production of cesium glass pencils, by using recovered radioactive cesium from high level waste and thereby redefining the waste as a material of resource.
(From left: Dr. C.P. Kaushik, Chief Superitendent, WMD; Shri Y.K. Taly, Chairman, Barc Safety Council; Dr. Sekhar Basu, Chairman AEC and Secretary
DAE; Shri K.N. Vyas, Director, BARC; Shri Kailash Agarwal, Associate Director, NRG; Shri G. Ganesh, Chief Executive, BRIT; Dr. Pradeep Kumar,
Associate Director, HS&EG)
thFig. 2: Handing over the 10 cask of cesium pencil to CE, BRIT by Director, BARC
Brief Communication

Power Factor Correction & Harmonic Distortion Control for AC-DC Fault Tolerant Power Distribution System & Power Quality Qualification Test Results as per IEC 61000-3-2Shantanu Das
Reactor Control Systems Design Section E & I Group
P. Sudhakar
Electronics Corporation of India Limited, Hyderabad
Increased usage of Switched Mode Power Supplies in the Control & Instrumentation Systems, since late 80's has greatly enhanced the electrical stresses caused by harmonic currents on the alternating-current (AC) power line distribution networks. To maintain the quality of these power line distribution networks, International Electro-technical Commission IEC 61000-3-2 (A2:2009), was created. We have ensured the power quality standards by use of latest 'active circuit' technique to enhance Power-Factor close to unity and reduce the Total Harmonic Distortion; in our product that is called 'Fault Tolerant Power Distribution System'. This product is developed for NPCIL (PHWR700MW plant). The Power Quality Tests were carried out on this new developed circuit that is implemented in the product, as per IEC 61000-3-2; (A2:2009).
Introduction
The Switched Mode Power Supply (SMPS) for use in the Control and Instrumentation Systems of Nuclear Power Plants is designed and engineered as rugged, fault tolerant, hot-pluggable and with equal load sharing feature of (M+N)
TMredundancy [3],[6]. This product is named as ECPS (Electronics Corporation Power Supply). ECPS are modular SMPS and are used as 'Fault Tolerant Power Distribution System' (FTPDS). ECPS are deployed in large numbers for Reactor Protection and Control Systems of NPCIL plants [1], [2], [4], [5] [8], [9] . The latest embodiment [2], [8], [9] of this product is for NPCIL-PHWR700MW plants, which is called ECPS SM100. It has two variants the first one is with DC-DC (input 220V DC), and second one is with AC-DC with input as 230V AC. The AC-DC model is the one having added circuits, for active power factor correction. This added circuit is with boost convertor that is used for Power Factor Correction (PFC) and for Total Harmonic Distortion (THD) controls. This article briefly describe the power quality certification as per IEC 61000-3-2 standard [10], [11], conducted on the latest embodiments, of ECPS SM100, for AC-DC models, and also the latest active circuitry method employed in this embodiment.
Need for Power Factor Control and Harmonic Reduction for SMPS
By definition the resistive load is said to have a power factor of one, meaning that 100% of the load current contributes to the watts of power transferred to the load. In an ideal world all loads would have power factor of unity. However, many types of electrical loads draw some current that do not contribute to the watts of power transferred to the load. These are generally undesirable currents that do not transfer watts because they are not aligned in time with the voltage waveform (i.e. they are out-of-phase currents), or they are of a different frequency
than the source voltage (i.e. they are harmonic currents). An actual load current can be separated into three parts: (i) a part that is in phase with the voltage (the part that transfer watts); (ii) a part that is out-of phase (a part that does not transfer watts); and (iii) a part that carries harmonics (also does not transfer watts). The ratio of the part of the load current that transfers watts to the load divided by the total current (including out of phase and harmonic currents) is called the True Power Factor (TPF) ; defined by three dimensional diagram, represented in Figure-2 [13], [14]. This parameter i.e. TPF is described in subsequent section, along with other important parameters, with useful expressions to compute the figure of merit for input power quality.
Both out-of-phase and harmonic currents contribute to reduction in power factor from the ideal value of unity and can cause problems in AC Power line Distribution Network to the C&I systems. Both cause power line wires, transformers and circuit breakers to be of oversize in order to handle the additional currents. However, harmonic currents create additional unique problems such as excessive heating in transformers, motors, and can cause overheating of the neutral wire of power line. The out-of-phase part of the current, which technically defined as the 'reactive current', affects voltage regulation in the AC power systems. Having a power factor less than one along with harmonics reduces the 'real power' available to run the device. In order to operate a device with these inefficiencies, the power distribution network of plant C&I must supply additional power to make up for losses; that is the AC power line distribution network becomes over stressed.
Power Quality Control Standard
As of 2001, all electrical and electronic equipment that are connected to AC mains power lines up to and including 16A max, rated input current must comply with International
|BARC Newsletter 2017 5| March-April
Article

Power Factor (DPF) related to phase angle and (ii) the Distortion (or Harmonic) Power Factor (HPF) related to wave shape. Therefore, the purpose of the active power factor correction circuit is to minimize the input current distortion and make the current in phase with the voltage.
The parameters Crest-Factor (CF),Total Harmonic Distortion (THD), Displacement power Factor (DPF), True Power Factor (TPF) and Distortion (or Harmonic) Power Factor (HPF) are defined in this section. We have used all these parameters as defined here in the calculations of 'figure of merit' in qualification of power quality of ECPS SM 100 as per IEC 61000-3-2. The detailed explanation with derivations is described in [13] [14].
Crest-Factor (CF): This parameter is defined as ratio of peak current i.e. I to Root Mean Square (RMS) current i.e.I , peak RMS
which defines deviation from ideal sinusoid as following
For ideal sinusoid this crest factor is = =pure sinusoid we have I =I 2.
Total Harmonic Distortion (THD): This parameter is defined as following
Where I is, RMS value of higher harmonic components n
(n=2,3,...40) and I is the fundamental RMS value of the 1
current. IEC-61000-3-2 gives THD values taking 40 harmonic components [13], [14].
CF 2 1.414; that is for Öpeak RMS
Ö
|BARC Newsletter 6| March-April 2017
Article
Electro- technical Commission IEC 61000-3-2 [10], [11]. Passive and active harmonic line current reduction solutions can be used to fulfill the limits of the standards which greatly influences the design of all power supplies. European Standard EN 61000-3-2 came into effect in 1995 and has replaced EN 60555-2 as on 2001. The last version of this
/standard has been accepted by CENELEC (Comite Europeen de Normalisation Electrotechnique) on 2006. It is based on IEC 61000-3-2:2005; in the meantime two amendments (A1:2008 and A2:2009) have been published. Since 2009 only IEC 61000-3-2: 2006 the latest version is applicable [11], for qualification.
Fig. 1 shows the principles of the AC line input current harmonic reduction techniques. Without any harmonic current reduction circuitry the input current achieves very high limits as the current is only limited by the small input impedance (filter and cabling) of the power supply (Fig. 1a). Adding additional inductances (passive solution) reduce the input current as well as its harmonic contents (Fig. 1b). Best harmonic current reduction (Fig. 1c) is achieved by 'Active Power Factor Correction' (PFC) circuitry; which is applied in the latest embodiment of ECPS SM100.
Definitions of Power Quality Measurement Parameters as per IEC 61000-3-2: 2006 standard
The classical lagging power factor triangle is depicted in Figure 1d. This classically stated definition of power factor related to phase angle is valid when considering 'ideal-sinusoidal' wave-forms for both current and voltage. When the current is not sinusoidal and the voltage is sinusoidal, the power factor consists of two factors: (i) the Displacement
Fig. 1: Line current with and without harmonic reduction circuitry
(a) Typical Input Current with-out harmonicline current reduction
(b) Typical Input Current with Passive PFC
(d) Power factor Triangle (lagging)(C) Typical Input Current with-Active PFC
peak
RMS
ICF
I

Displacement power Factor (DPF): For Displacement Power Factor (DPF) we take ratio of the Active Power in Watt (W) to Apparent Power in Volt-Ampere (VA); for the fundamental current i.e.
This is also called Displacement Power Factor (DPF). In Fig.1d this is described as follows
This parameter is valid only for linear loads with sinusoidal voltage and current wave forms.
True Power Factor (TPF): This is ratio of composite wave (current) including all the harmonics, that is
This TPF includes effect of harmonic currents, which is given by Total Harmonic Distortion (THD) [13], [14].
Distortion (or Harmonic) Power Factor (HPF): This parameter is defined as following
From this HPF we get True Power Factor as product of displacement power factor (DPF) and Distortion (Harmonic) power factor i.e. TPF=(DPF)(HPF) [13], [14]. The parameter TPF is represented by a three-dimensional diagram Fig. 2 [13], [14].
Fig. 2: Three-dimensional diagram representing True Power Factor (TPF)
For a non-linear load like SMPS, Rectifiers, Buck-Boost Converters, LED Lamp Drivers etc; the True Power Factor is less that Displacement Power Factor i.e. . For linear loads (like incandescent lamp) while voltage and currents are true sinusoids we have the .
The Boost Converter
The 'Boost Converter' is used to accomplish active PFC in Discontinuous or in Continuous Conduction modes (DCM/CCM) in Switched Mode Converter circuits [14]. First we see how the inductors can produce a very high voltage that is depicted in Fig. 3a. Initially the inductor is assumed to be uncharged; therefore the voltage is equal to . When the switch closes, the inductor starts charging. From this instance of switch closure (at time ), the inductor current gradually increases with time linearly as
The switch opens again when the inductor is charged to . This re-opening of the switch causes the current to decrease from towards zero. The voltage across inductor is now times the change in current per unit time i.e.
At this instance of switch re-opening, the voltage across inductor approaches negative infinity. This is while the inductor reverses the polarity; to oppose the change in current from towards zero. The switch is open while inductor is discharging. During the discharging of inductor the voltage across it ( ) reverses; and becomes additive with the source voltage ( ). This boosted-voltage appears as high output voltage ( ). A diode and capacitor are connected to the output of this inductor circuit (Fig. 3b). The capacitor charges to this high output voltage. This is the operation of Boost Converter.
The input to the converter is full-wave rectified AC line voltage. The boost converter must meet two conditions simultaneously; a) the output voltage of the boost converter must be set higher than the peak value of the line voltage; and b) the current drawn from the AC input at any given instant must be proportional to the line voltage. In circuit of ECPS SM100 we have 390V DC to allow high line voltage as 265V RMS (nominal being 230V). This Boosted DC Voltage (390V DC) of this PFC stage goes to the second stage that is of power converter circuit. The power converter circuit is DC-DC Buck-Converter; which is a current mode PWM controlled circuit of ECPS [1-4], that is operating at 80 KHz. The Fig. 3b circuit is of Boosted converter that operates at Fixed Frequency of 100 KHz. This complete set of circuit is employed in the latest embodiment of ECPS 100W AC-DC system. The Active Power Factor Correction (PFC) scheme to
TPF<DPF
TPF=DPF
V V0 in
t=0 I L
Imax
I V L max L
VL
Imax
VL
Vin
V0
Therefore, 'Total Apparent Power' in this non-sinusoidal case is and with this new defined 'Total Apparent Power' we have TPF defined as following
|BARC Newsletter 2017 7| March-April
Article

Fig. 3: Fly back operation of Inductor and Boost Converter Circuit
control the Boosted converter as implemented in the latest embodiment of ECPS is described next.
Implementation of Active Power Factor Correction Scheme in ECPS
The Continuous Conduction Mode (CCM) typically suits SMPS with higher power levels. In the CCM case the MOSFET of boost converter does not 'switch-on' when boost inductor is at zero current, instead the current in the energy transfer inductor never reaches zero during the switching cycle. This is depicted in Fig. 4b. In the latest embodiment of ECPS, Power Factor Correction (PFC) circuitry the boost converter is operated in fixed-frequency (100 KHz) and in Continuous Conduction Mode (CCM). PFC boost converter is shown in Fig. 4c.
The operation is Discontinuous Conduction Mode (DCM) when the boost converter MOSFET is turned on while the inductor current reaches zero, and tuned off when the inductor current meets the desired input reference voltage as shown in Figure-4a. In this way the current waveform follows the waveform of input voltage, thus attaining PF close to one. The DCM is used for lower powered systems e.g. for LED bulb [15].
As shown in Fig. 4d, the inductor current in a switching period includes a charging phase for duration and then a
IT t 1
L
discharging phase for duration . The voltage conversion ratio is given as
The input filter capacitor and the front-ended EMI filter absorb the high-frequency component of inductor current . Therefore it makes the input current as a low-frequency (LF) signal that is LF part of the inductor current, meaning
, (the suffix 50 means it is with a 50 Hz bandwidth of the original ) .
From expressions of and as expressed above we write expression for input impedance as following
Power Factor is corrected when the input impedance is constant or slowly varying in the 50 Hz bandwidth i.e. behaves as resistive quantity [14]. To achieve this we do 'duty modulation'. The PFC 'duty modulation' and timing diagram is shown in Fig. 5. The MOSFET 'on-time' is generated by the intersection of reference voltage and ramp voltage
, as shown in Fig. 5b. The relationship is following
t
C IL
I
I =Iin L-50
IL
V Iin in
Z in
Z in
t 1
V ref
Vramp
2
filter
in
|BARC Newsletter 8| March-April 2017
Article

that is derived from Fig. 5a. The charging current is specially designed as
which implies
From above set of equations we get input impedance re-formulated as following
I ch Because and are roughly constant with time, the multiplier voltage i.e. is designed to be proportional to in order to have constant for PFC purpose. The multiplier voltage i.e. is generated by sensing the input current via filtered & conditioned inductor current. This 'duty modulation' in CCM is called 'average current mode' the detailed explanation with calculations are described in [14] design note.
V V ref out
V I M L-50
Z in
V M
Fig. 4: Modes of operation of Active PFC and Boost Converter Inductor Current
Fig. 5: CCM PFC Duty Modulation and Timing Diagram
|BARC Newsletter 2017 9| March-April
Article

The Power Quality Testing Set-up & Qualification results
The power quality tests are carried out in EMI/EMC Test Facility of ECIL, with Power Quality Test Equipment. This equipment has Variable 115V-300V 16Hz-1000Hz source and also variable DC 115V-300V source of 15KVA rating. This is used to power the equipment under test, and record the parameters. Figure-6 depicts the Test-Setup where ECPS system is connected to this source. The computer records the data and generates the report about the test that is given in Fig. 7. Fig. 8 gives latest embodiment of ECPS.
The Power Quality Qualification Tests were carried out for (1) Single ECPS, (2) Multiple ECPS. The detailed report of all the tests and records of all harmonic currents up to 40-th harmonics are kept at ECIL. The Fig. 9a shows the record of input voltage and input current for fully loaded 5V ECPS SM 100. The Fig. 9b shows the record of harmonic currents up to 40-th harmonics and the limit lines (as per IEC 61000-3-2 A2:2009). Table-1 gives the measured values for RMS Input Voltage, Peak Input Current, Fundamental Input Current, RMS Input Current, and Crest Factor, Input Power in Watts, Input Power Factor, and Total Harmonic Distortion (THD) for Input Current.
Fig. 6: The Power Quality Testing Equipment Connected to ECPS (left showing testing of single ECPS unit, right showing the testing of Multiple ECPS units)
Fig. 7: The computer record of data for input voltage and input current wave-form and display of harmonic
contents of input current
Fig. 8: Latest embodiment of ECPS SM100 fourteen of them sharing the load
|BARC Newsletter 10| March-April 2017
Article

Fig. 9: ECPS 100 (5V), with PFC Circuitry Input Voltage Current Record at full load current with Harmonic current level display
Table 1: Test Report on Power Quality of ECPS 100 (5V) at full load with PFC Circuitry
Current Test Result Summary (Run time)Test Result: Pass
Highest parameter values during test:V_RMS (Volts): 240.43 Frequency (Hz): 50.00I_Peak (Amps): 0.833 I_RMS (Amps): 0.553I_Fund (Amps): 0.550 Crest Factor: 1.509Power (Watts): 130.2 Power Factor: 0.981I-THD (%): 8.79
Calculations of Power Quality Parameters
From the Table-1, we get current wave as thus we get Crest Factor as
. The Displacement Power Factor (DPF) we calculate from sinusoidal part i.e. the RMS value of fundamental current as
We write from above table Total Harmonic Distortion from this the Distortion (or Harmonic) Power
Factor we obtain as
I = I = 0.553A RMS
CF=1.509
THD=8.79%
0.833A peak and RMS value of the
Thus we get the True Power Factor as . The Test-Result shows 'Pass'.
The earlier embodiment ECPS 100 5V; without active PFC circuitry showed THD as 216.50% and TPF as 0.43, Crest Factor 4.65.; the test result of earlier embodiment of ECPS is depicted in Figure-10, and recorded parameter values in Table-2. From THD value we get HPF value as 0.42; i.e. very low value. Though the DPF calculated from fundamental RMS current comes as 0.99, the high harmonic contents in current makes the TPF very low. The Test-Result also shows 'Fail'.
Nine such results with various configurations of ECPS SM100 AC-DC model for 5V, 15V, 24V with loaded conditions load sharing configurations are in detailed report available with CAD ECIL, Hyderabad.
TPF DPF) (HPF) 0.9811
= ( =
|BARC Newsletter 2017 11| March-April
Article

Fig. 10: Test results of ECPS 100W without PFC Circuitry
Table 2: Test Report on Power Quality of ECPS 100 (5V) at full load without PFC circuitry
Current Test Result Summary (Run time)
Test Result: Fail
Highest parameter values during test:
V_RMS (Volts): 240.40 Frequency (Hz): 50.00
I_Peak (Amps): 5.787 I_RMS (Amps): 1.248
I_Fund (Amps): 0.529 Crest Factor: 4.645
Power (Watts): 126.8 Power Factor: 0.436
Conclusions
In this article, results of Power Quality Qualification Tests as per IEC 61000-3-2 standard done on the newly developed product ECPS SM100 that are to be used in NPCIL-PHWR700MW are presented. The product ECPS SM100 is qualified with implemented active PFC circuitry, in order to improve input power factor and reduce the harmonic current contents. This new embodiment of ECPS after successful prototyping, about 10.000 are manufactured and supplied by ECIL for NPCIL 700MW projects. This is a unique indigenous product which was made from basic concept to bulk manufacturing with several embodiments since early 90's and successfully deployed in various plants of NPCIL and Research Reactors.
Acknowledgements
The authors acknowledge the encouragement, guidance and support of Shri B.B. Biswas (Ex. Head Reactor Control Division-BARC), Shri G.P. Srivastava (Ex. Director E & I Group), Md. Ariffuddin (Ex. Head, CAD ECIL), Staff of SMPS project group of CAD, ECIL, Late Shri R.N. Yadav (of ECIL) and Dr A.P. Tiwari (Head RCSDS E&I Group BARC) to develop this new improved embodiment of ECPS for PHWR700MW. The authors also acknowledge the Staff of EMI/EMC Test Facility, ECIL the support rendered during qualification tests of this product.
|BARC Newsletter 12| March-April 2017
Article

References
1. Shantanu Das , "Robust Switched Mode DC Power Supplies for Safety Significant & Safety-Critical Industrial Control & Instrumentation Systems", Electrical India .Vol. 50 No.4 Issue April 10, 2010, pp. 98-107, 2010.
2. Shantanu Das, Md. Arifuddin "EC-SMPS Hybrid Version for Nuclear Instrumentation & Control Systems", BARC News Letter March 2009.
3. Shantanu Das, B.B.Biswas, "Proprietary Electronics for Reactor Safety & Controls", Int. J. Nuclear Energy Science & Technology Vol. 3, No.4, 2007, pp.358-369, 2008.
4. Shantanu Das, B B Biswas, "Fault Tolerant Power Supplies for safety significant nuclear I&C", Int. J. Nuclear Knowledge Management IJNKM-2008, vol.3, No.1.pp59-72, 2008.
5. Shantanu Das, B B Biswas, "Fault Tolerant Power Distribution SMPS (M+N) -TRADE MARK", for Trade Mark ECPS, 2001.
6. Shantanu Das, M B Patil, DA Roy, B Ganaraj, C K Pithawa, B B Biswas, Umesh Chandra, P Sudhakar (ECIL), "Microcomputer boards for safety and safety critical systems for nuclear power plants and other high reliable industrial application", BARC News letter Nov 2000.
7. International Electro Technical Commission 2010, International Special Committee on Radio Interference (CISPR), http://webstore.iec.ch
8. Brochure “Electronics Corporation Power Supply” ECPS SM 100, 2016, ECIL
9 EC R&D Report 2016-National Technology Day, 11 May, th2016 (Issue on 50 Year of ECIL)
10. Electromagnetic Compatibility (EMC) low frequency standards, “IEC-61000-3-2-Limits for Harmonic Currents Emi ss ions ” ht tp : / /w w w.ds ce . fe e .unic amp.br/ ~antenor/pdffiles/IEC.pdf
11. Bollen M. H. J, “Understanding Power Quality Problems”; New-York: IEEE Press ISBN 0-78083-4713-7; 2000.
12. Shantanu Das, Ramnayan Yadav, “Conducted and Radiated Emission Tests for Fault Tolerant Power Distribution System ECPS 100 developed for PHWR700MW C&I”, BARC News Letter Sept-Oct; 2016.
13. W. Grady and R. Gilleskie, “Harmonics And How They Relate To Power Factor,” Proc. of the EPRI Power Quality Issues & Opportunities Conference (PQA'93), San Diego, CA 1993.
14. Shantanu Das, “Note on Harmonic Distortion Control & Power Factor Correction Circuitry for Switched Mode Power Supply (M+N)”-Detailed Design Note of ECIL-2016.
15. Shantanu Das, “Review of Fly-back Switched Mode Power Convertor Circuits for driving LED lamps with Power Factor Correction and Line Current Harmonic Reduction” -Detailed Design Note of ECIL, 2017.
|BARC Newsletter 2017 13| March-April
Article

Potential of Luminescence Based Molecular Animal Imaging in Research Areas Pertaining to Cancer Biology and TherapyHansa D. Yadav, Neena G. Shetake, Murali MS Balla, Amit Kumar and B.N. Pandey
Radiation Biology and Health Sciences Division
Animal imaging is getting tremendous importance in biomedical research areas including drug delivery, radiobiology and cancer research. Even though, imaging techniques like CT, PET, SPECT, MRI are available for experimental animals, luminescence-based molecular imaging is still considered as crucial and common tool for biomedical laboratories due to easy handling/maintenance, cost effectiveness and various strategies available to manipulate the molecules/cells employed for imaging purposes. The Molecular Animal Imaging System available in our laboratory is being utilized for various cancer research activities including measurement of tumor growth kinetics, angiogenesis, therapeutic efficacy evaluation and metastasis studies. Moreover, the imaging system is also been used for radio-luminescence imaging based on Cherenkov radiation of radio-pharmaceuticals.
Introduction
Imaging of experimental animals is of great interest for biomedical researchers as well as for pharmaceutical industries for various research activities and pre-clinical drug screening/evaluation. In this direction, a range of imaging systems like PET, CT, PET-CT, SPECT and MRI are available. However, compared to these imaging techniques, luminescence-based imaging is the better choice for the researchers since it does not require handling/application of radiation source (CT) and radio-isotopes (PET, PET-CT and SPECT). Moreover, luminescence-based imaging is easy to handle/maintain and is cost effective. The available options for a range of fluorochromes / bio-luminescence materials for manipulation of cells / biomolecules, further puts the technology at an advantage. Emission of photons is the primary prerequisite for luminescence-based imaging, which can be either bioluminescence or fluorescence or delayed fluorescence. Radio-luminescence imaging based on the Cherenkov radiation from the beta-emitting radio-isotopes has also been reported and used for bio-distribution/organ
1; 2; 3 localization and efficacy studies of radio-pharmaceuticals.
Despite a considerable technological progress, fluorescence imaging still faces some of the serious limitations including surface reflectance, autofluorescence, absorption and scattering (deviation of photons from the original path). Out of these, autofluorescence and absorption are the two major issues especially while imaging in the wavelengths of visible region (400-650 nm) since biological tissues (hair, skin and blood) also absorb and emit at this wavelength range. Such limitations could be addressed upto some extent by the use of fluorochromes emitting in near infra-red (NIR) region (650-900 nm) and application of bioluminescence material. Bioluminescence has advantages over fluorescence imaging because it does not require excitation of fluorochromes and
4;5;6.tissue penetration of excitation light Moreover, the limitation of autofluorescence could also be overcomed
7;8substantially during bioluminescence imaging . This improves the signal-to-noise ratio and makes possible the sensitive measurement of fast kinetics biological processes.
Due to various advantages, luminescence-based animal imaging has been proved as a very useful tool in the research areas pertaining to cancer biology and therapy. Like other in vivo imaging techniques, molecular animal imaging system is also a non-invasive and sensitive technique with the possibility to monitor tumor growth at multiple time points and even at smaller tumor sizes. The conventional tumor growth measurement by vernier caliper poses some serious limitations: (i) it requires at least palpable sizes of tumor which for the most of the tumor types can be achieved only after 7-10 days after transplantation; (ii) the inter-individual variation in the measured values (due to manual adjustment of caliper) always keeps the investigator towards disadvantage; (iii) it provides only gross size of the tumor without any specific information about viable number of tumor cells and contribution of the necrotic/dead tissue regions in the tumor mass. On the other hand, the bioluminescence-based animal imaging is more sensitive and conquers most of the above limitations (Table 1). In this regard, imaging of bioluminescent tumor cells is possible when tumors are not even visible. Results are more consistent since the technique does not involve any manual intervention during tumor size measurement. Additionally, the bioluminescence images provide information about the live tumor cells contributing in the tumor growth.
To study the process/modification of cancer metastasis is another application of the bioluminescence-based animal imaging, in which animals need not be sacrificed at multiple time points and even in the same animal metastasis could be monitored in multiple organs at different time points. These are major advantages of the imaging technique over the conventional metastasis methodology, which involves sacrifice of the animals followed by manual identification of
|BARC Newsletter 14| March-April 2017
Article

HE detector LE detector
tumor spread in the different organs. Moreover, imaging can reveal some unknown metastatic sites, which otherwise is not possible to be identified following conventional methodologies.
Imaging Set Up
To investigate the localization/bio-distribution of drugs/cells/molecules/radiopharmaceuticals, efficacy of anti-cancer drugs/therapeutic approaches and metastasis/ angiogenesis in tumor, luminescence-based animal imaging system (Photon Imager, Biospace Lab, France; Fig. 1A) was purchased and installed in our laboratory. The imaging
system is comprised of light source, from which light passes through excitation filter to illuminate the experimental animals (mice/rat). The emitted light from animal body is transmitted through emission filter, which then passes through lens and gets captured in intensified cooled charge-coupled device (CCD) camera. Using this camera, the read-out and thermal noise of the CCD can be minimized through amplification process taking place in the intensifier tube (gain
6~10 ) and by cooling down the photocathode to -25 °C, respectively. These features improve the signal to noise ratio substantially suitable for bio-imaging applications. The captured images are processed and transferred to computer
Table 1: Advantages of Bioluminescence-based Animal Imaging over Conventional Method of Tumor Growth Measurement
Parameters Conventional system Bioluminescence signal based(e.g. Vernier calipers) imaging
Basis of measurement Size Viable cell number
Sensitivity Require visible palpable Even few thousand cells can besize tumors, poor sensitivity detected. Has sensitivity when tumor
is physically undetectable / not visible
Distinction of viable Does not distinguish viable Signal only from viable tumortumor cells and dead cells in tumor mass cells in the tumor mass
Requirement of animals Large number of animals Same animal can be used forfor various time points multiple time points hence require
less number of animals
Deep organ tumor imaging Not possible Possible for primary and secondarytumors
Variation in tumor Inter-individual More accurate and reproduciblemeasurements variation possible results with lesser inter-individual
variation
Fig. 1: (A) Picture of the in vivo imaging system and (B) Schematic representation of the in vivo imaging system
|BARC Newsletter 2017 15| March-April
Article
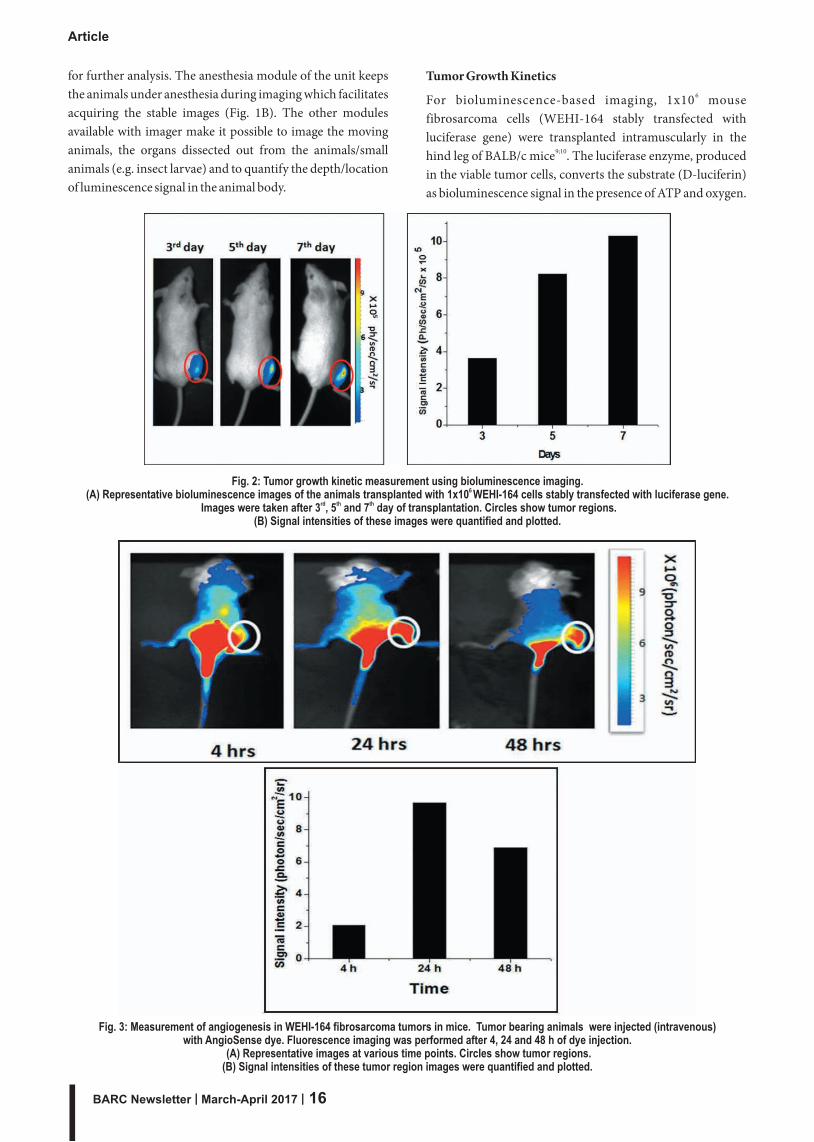
for further analysis. The anesthesia module of the unit keeps the animals under anesthesia during imaging which facilitates acquiring the stable images (Fig. 1B). The other modules available with imager make it possible to image the moving animals, the organs dissected out from the animals/small animals (e.g. insect larvae) and to quantify the depth/location of luminescence signal in the animal body.
Tumor Growth Kinetics6For bioluminescence-based imaging, 1x10 mouse
fibrosarcoma cells (WEHI-164 stably transfected with luciferase gene) were transplanted intramuscularly in the
9;10hind leg of BALB/c mice . The luciferase enzyme, produced in the viable tumor cells, converts the substrate (D-luciferin) as bioluminescence signal in the presence of ATP and oxygen.
Fig. 3: Measurement of angiogenesis in WEHI-164 fibrosarcoma tumors in mice. Tumor bearing animals were injected (intravenous) with AngioSense dye. Fluorescence imaging was performed after 4, 24 and 48 h of dye injection.
(A) Representative images at various time points. Circles show tumor regions. (B) Signal intensities of these tumor region images were quantified and plotted.
Fig. 2: Tumor growth kinetic measurement using bioluminescence imaging. 6 (A) Representative bioluminescence images of the animals transplanted with 1x10 WEHI-164 cells stably transfected with luciferase gene.
rd th th Images were taken after 3 , 5 and 7 day of transplantation. Circles show tumor regions. (B) Signal intensities of these images were quantified and plotted.
|BARC Newsletter 16| March-April 2017
Article

For this, substrate is intra-peritoneally injected in mice a few minutes before the imaging. Before transplantation, tumor cells were cultured under standard culture conditions followed by harvesting them during exponential growth phase using trypsin-EDTA. Cells were washed and suspended in PBS before transplantation in mice. Animals were imaged
rd th thafter 3 , 5 and 7 day of transplantation (Fig. 2 A and B). Results showed a t ime dependent increase in bioluminescence signal intensity. It may be important to
rdmention that in the imaging experiment, tumors even at 3 thand 5 day after transplantation also showed significant
bioluminescence signal when no-palpable tumors could be visible, suggesting high sensitivity of the technique to detect the tumor and its growth.
Tumor Angiogenesis
Angiogenesis is a critical feature of tumor growth and progression, which can be monitored using fluorescence-
11;12based animal imaging . For this, AngioSense 750 EX (Perkin Elmer, USA) dye was used. The dye is known to specifically bind to newly developed blood vasculature. Fluorescence imaging (excitation: 745 nm; emission: 800 nm; high pass filter cut off: 770 nm; illumination: 30 %) was performed in the anesthetized animals at the different time points (4, 24 and 48 h) after intravenous injection of dye through the tail vein (Fig. 3). After 4 h of injection, accumulation of dye was observed in the tumor regions, which however, was increased at 24 h. At longer period of time (48 h), dye concentration was decreased in the tumor areas.
Conclusion
Luminescence based molecular animal imaging has shifted the attention from structures / morphology to the real-time visualization of biological processes and progression of tumor growth. Therefore, in future it will be a promising technology that has translational applications towards developing preclinical diagnosis and to improve the therapeutic efficacy of anti-cancer agents.
Acknowledgment
WEHI-164 cells were stably transfected with luciferase for bioluminescence imaging in collaboration with Dr Pritha Ray, ACTREC, Navi Mumbai.
References
1. Balkin, E.R., Kenoyer, A., Orozco, J.J., Hernandez, A., Shadman, M., Fisher, D.R., et al. "In vivo localization of 90 177Y and Lu radioimmunoconjugates using Cherenkov
luminescence imaging in a disseminated murine leukemia model". Cancer Research 74, (2014): 5846-54.
2. Papineni, R.V. "Radiobioluminescence, Cherenkov luminescence-God light in likes, a potential in radiation therapy imaging". Journal of Cancer Research and Therapeutics 11, ( 2015): 241-242.
3. Spinelli, A.E. and Boschi, F. "Novel biomedical a p p l i c a t i o n s o f C h e r e n k o v r a d i a t i o n a n d radioluminescence imaging". Physica Medica 31, (2015): 120-129.
4. Kelkar, M. and De, A. "Bioluminescence based in vivo screening technologies". Current Opinions in Pharmacology 12, (2012): 592-600.
5. Licha, K. and Olbrich, C. "Optical imaging in drug discovery and diagnostic applications". Advanced Drug Delivery Reviews 57, (2005): 1087-1108.
6. Luker, G.D. and Luker, K.E. "Optical imaging: current applications and future directions". Journal of Nuclear Medicine 49, (2008): 1-4.
7. Sato, A., Klaunberg, B. and Tolwani, R. "In vivo bioluminescence imaging". Comparative Medicine 54, (2004): 631-634.
8. Badr, C.E. Bioluminescence imaging: basics and practical limitations Bioluminescent Imaging of the series Methods in Molecular Biology Book Subtitle: Methods and Protocols, Humana Press, pp. 1-18.2014.
9. Desai, S., Srambikkal, N., Yadav, H., Shetake, N., Balla, M., Kumar, A., et al. "Molecular Understanding of Growth Inhibitory Effect from Irradiated to Bystander Tumor Cells in Mouse Fibrosarcoma Tumor Model". PLoS One 11, (2016): e0161662.
10. Shetake, N., Kumar, A., Gaikwad, S., Ray, P., Desai, S., Ningthoujam, R., et al. "Magnetic nanoparticle-mediated hyperthermia therapy induces tumour growth inhibition by apoptosis and Hsp90/AKT modulation". International Journal of Hyperthermia 31, (2015): 909-919.
11. Lawrence, W.D. and Albert, J.S. " Imaging angiogenesis". Current Opinion in Biotechnology 18, (2007): 90-96.
12. Vasudev, N.S. and Reynolds, A.R. "Anti-angiogenic therapy for cancer: current progress, unresolved questions and future directions". Angiogenesis 17, (2014): 471-494.
|BARC Newsletter 2017 17| March-April
Article

Development of Geyser Pump for Lifting Solid
Particles in a continuous Rotary Dissolver
Shaji Karunakaran, G. Sugilal, K. Agarwal
Nuclear Recycle Group
R. Srinath, K. M. Singh
Nuclear Recycle Board
Geyser pump is a passively operated pump working on the principle of airlift pump. A prototype of the geyser pump was designed and fabricated in order to study its efficacy for handling fine solid particles in a Continuous Rotary Dissolver. Experimental studies were conducted initially to generate two-phase flow characteristics of the geyser pump using compressed air as motive fluid. This was followed by experiments involving three-phase (solid-liquid-gas) flow conditions to study the pumping performance. Flow characteristics were determined by varying motive fluid flow rate and submergence. Design and operating parameters like submergence, riser diameter, particle density and particle size were varied to investigate the pumping performance under different flow conditions. Based on these studies an engineering scale prototype of geyser pump was fabricated and tested successfully.
Introduction
Continuous Rotary Dissolver (CRD) is the equipment developed for dissolution of spent nuclear fuel in continuous mode of operation [1]. A schematic of a CRD is shown in Fig. 1. The chopped spent fuel pieces are received in perforated buckets of CRD periodically. The dissolution of spent fuel takes place while in contact with leaching acid after which the hulls are discharged. The metallic fines and other solid particulates smaller than the perforation are expected to settle at the bottom of the vessel during this process. In order to ensure trouble free operation of the equipment, these solid particles have to be periodically removed from the bottom of the tank. The tank has been provided with a slopping bottom to facilitate accumulation of the solid particles at one area so that it can be removed using a pumping device. Thus, a pumping device is necessitated which could facilitate removal of these fine particles while being remotely operated.
The working area being highly radioactive precludes the use of conventional pumps owing to the maintenance requirements that is associated with any moving part. Airlift pump, being passive in nature, is a natural choice for such an application. However, the suction produced by a traditional
airlift pump is not very effective in pumping solid particles immersed in water.
Geyser pump, a variant of airlift pump offers a plausible alternative to the aforesaid application. Passive operation, high buoyant force and high suction are three vital features of geyser pump that makes it favorable for the current application.
Working Principle of Geyser Pump
Airlift pump is a device for raising liquids or mixtures of liquids (mostly water) and solids through a vertical pipe partially submerged in the liquid, by means of compressed air introduced into the vertical pipe (called as riser) near its lower end by means of an opening. As a result, a mixture of air and water is formed within the riser which flows upward as the density of the air-water mixture is much less than that of water alone. The performance of an airlift pump depends mainly on two groups of parameters. The first group includes geometrical parameters such as pipe diameter, submergence ratio, and geometry of the riser (tapered or straight), while the other group involves operational parameters such as, injected gas flow rate, gas injection pressure, and nature of lifted phase.
A geyser pump (see Fig. 2), unlike an airlift pump, allows air to accumulate in an air chamber (which acts as temporary storage of compressed air) and then lets the entire accumulated air to rush into the riser. This sudden release of air pocket inside the riser pipe creates a significant pressure drop at the bottom of the riser leading to a high suction enabling even the solid particles immersed in water (such as a sludge) to be pumped effectively. The geyser pump essentially performs two functions during the course of transferring the liquids and solids viz. ejection and suction.
I. Ejection: Accumulation of air in the air chamber results in the release of large air pocket instantaneously into the riser. Consequently, a large air bubble is formed in the riser. This large air bubble acts like an air piston, thereby, effectively ejecting water and solids in the riser.
Article
Fig.1: Schematic of a Continuous Rotary Dissolver
|BARC Newsletter 18| March-April 2017

HE detector LE detector
Article
ii. Suction: The presence of single large air bubble in the riser creates higher suction at the riser bottom than several smaller air bubbles for the same air flow rate. And higher the suction better is the chances for the solid particles deposited in the tank to gush into the riser.
threaded hole is for the insertion of riser and the smaller one for the serrated nipple. The air carrying pipe is connected to the air chamber by means of serrated nipple. The air chamber is also provided with a number of slots on its periphery close to the bottom for the liquid and solid phases to flow into it. It mainly facilitates the accumulation of compressed air which results in liquid level going down and as soon as the liquid level reaches the limb of the riser column, releases the accumulated air instantaneously into the riser. The riser is a pipe which eventually discharges the mixture from bottom floor of the reservoir to a higher desired elevation.
The experimental setup consists of air header, pressure regulating valve, rotameter, flow control valve, water reservoir and geyser pump as shown in Fig.4. Compressed air from the air header is set to the requisite pressure by means of the pressure regulating valve. Air rotameter is used for monitoring the air flow rate. The flow regulating valve attached at the downstream of rotameter is used to control the air flow rate before being sent to the geyser pump.
Fig. 2: Schematic of a Geyser pump
Fig. 3: Geyser pump configuration investigated
Experimental Set Up
Fig. 3 shows the geyser pump configuration used for the experimental study. The body of the geyser pump consists of an air chamber, a riser pipe with a limb and a serrated nipple. The air chamber has a cylindrical configuration having well sealed top lid and a bottom kept open for the entry of the liquid and solid phases to be pumped. The top lid of the air chamber is provided with two threaded holes. The bigger
Experimental Procedure
Experiments under Two-phase conditions:
Initially, the water level in the water reservoir was fixed so that the required submergence ratio is achieved. Submergence ratio can be defined as the ratio of vertical distance of free liquid surface in the water filled tank above the air inlet to the vertical distance of the discharge point above the air inlet.
Compressed air supplied from the air header was set to a fixed 2pressure of 1.5 kg/cm by means of a pressure regulating valve.
The air flow rate was adjusted using a flow control valve and was then varied sequentially to obtain corresponding volumetric flow rates of water in order to generate the performance curves. As the air supply was turned on and a particular air flow rate was set, the geyser pump was allowed to establish a stable periodic operation. Once the stability was achieved, the water being discharged at the top end of riser pipe was collected in a calibrated flask for a sampling time of one minute. The experiment was conducted in a closed loop to maintain the submergence constant.
Thus, pumping rate of the water as a function of motive fluid (compressed air) flow rate was found experimentally.
Fig. 4 Schematic of the Experimental Setup
|BARC Newsletter 2017 19| March-April

Parameters like submergence and air chamber diameter were systematically varied to examine their influence on the performance of geyser pump.
Experiments under Three-phase conditions:
Three–phase experiments involved parametric studies on the effects of solid particle conditions on the performance of geyser pump. Two different solid materials (glass beads with a density of 2.5 g/cc and mild steel chips with a density of 7.85 g/cc) and two different particle sizes (average particle diameter 2.80 mm and 3.35 mm) were used for the study.
The water level in the water reservoir was fixed and the solid particles were introduced in the water reservoir such that the required submergence ratio was achieved. The solid particles settled at the floor of the water reservoir and were maintained in the vicinity of the air chamber. Compressed air supplied from air header was fixed to a requisite pressure by means of pressure regulating valve. This pressure was maintained constant throughout the experiment. The flow rate of air was controlled using a flow control valve and was varied sequentially to obtain corresponding solid and water mass flow rate readings. Adequate mass of solid particles in the water reservoir was ensured in order to maintain a sufficient concentration of particles in the riser throughout the sampling time of all the experimental runs. Several trials were conducted to ensure repeatability.
For a given air flow rate, the quantity of solids being pumped for a sampling time of one minute was collected and weighed to obtain the solid mass flow rate. Simultaneously, the water being pumped was also collected in a calibrated flask for the measurement of volume flow rate of water. This step was repeated for the other air flow rates to obtain corresponding solid and water flow rate to generate the performance curves. Influence of particle size and particle density on the performance was also quantified and studied during the course of three phase operation of geyser pump.
Experimental Results
Performance of geyser pumps under two-phase flow:
Influence of submergence and air chamber diameter on the performance of geyser pump operating in two-phase flow was
investigated. Fig. 5 depicts the flow characteristic curve which shows the rise of water flow rate with the increase in air flow rate for a given submergence ratio. It also shows that the water flow rate increases with the increase in submergence for a given air flow rate.
Two different air chamber diameters (viz. 150mm and 200 mm) were used to study the influence of air chamber diameter on the performance of geyser pump. It was observed that variation in air chamber diameter did not have any significant effect on the water flow rate [2].
Performance of geyser pump under three-phase flow:
The ultimate objective of the geyser pump is to lift the metallic fines from the tank floor of the continuous rotary dissolver assembly. Thus, conditions replicating the actual situation were adopted for the geyser pump operating in three-phase (gas-liquid-solid) flow situation. Performance of geyser pump lifting solids was obtained by measuring mass flow rate of solids and volumetric flow rate of water corresponding to each air flow rate for a given submergence ratio and solid particle conditions
Solid mass flow rate corresponding to each air flow rate value was measured to generate the performance curve of a geyser pump pumping solids. The conditions maintained during the experiment are indicated in the Table 1.
.
Fig. 5: Effect of Submergence of liquid pumping rate (riser diameter = 25 mm)
Table 1: Test Conditions
Pipe diameter 25 mm
Pipe Riser length 710 mmlength Suction length 50 mm
Air Length 200 mmchamber Diameter 200 mm
Solid Material Glass beads (2.5 g/cc)particles Diameter 2.80 mm
Submergence Ratio 0.8 , 0.7 and 0.5
As illustrated in Fig.6, solid mass flow rate increases with the increase in air flow rate for a given submergence ratio and solid particle conditions. Also, the solid mass flow rate increases with the increase in submergence for a given air flow rate.
Further studies were carried out by varying the particle size, density and riser diameter [2]. The following observations were made.
Ÿ The mass flow rate of solids decreases with the increase in the particle size for a given air flow rate and submergence. This is attributed to the increase in the free settling velocity with the increase in particle diameter which leads to an increase in the slip between the particles and the mean flow
Ÿ The pumping rate of solids is reduced when a higher density of solid material is used. The mixture density in
Article
|BARC Newsletter 20| March-April 2017

case of a higher material density will be higher which results in reduced driving force and therefore, reduction in solid mass flow rate is observed.
Ÿ The superficial velocity of liquids decreased with increase in the riser diameter for a given gas superficial velocity and submergence ratio. For example, for a gas superficial velocity of 1 m/s, liquid superficial velocity reduces from 6 mm/s to 2 mm/s when the riser diameter is increased from 25 mm to 40 mm. Since, the drag force of water is responsible for the lifting of solids, any decrease in liquid superficial velocity causes a reduction in drag force and hence solid superficial velocity is found to be decreased with an increase in riser diameter
density was associated with the fall in the particle mass flow rate. Superficial velocity of water and particle were found to be decreased with an increase in the riser diameter. Trials with actual sized prototype confirmed the effectiveness of this system for handling fines / particulates for application similar to that of CRD.
Fig. 6: Effect of Submergence on particle mass flow rate for
conditions given in table 1
Engineering Scale Prototype and Trials
An engineering scale prototype simulating actual operating condition was fabricated as shown in Fig.7. In actual operating condition ziracloy fines are expected to be lifted from the vessel bottom filled with 8 M Nitric acid solution the actual. To simulate the particles, chips generated from machining of stainless steel material with a density of 7.85 g/cc were used which consisted of chips of varying size. Water was used in place of Nitric acid. Trials were carried out keeping the submergence condition (60 %) as desired in actual condition. Trials were carried out at varying air flow rates and the solid particulates collected at each trial were measured and recorded as in earlier cases. The results are shown in Fig 8.
Summary
The developmental effort undertaken highlights the suitability of geyser pump in slurry pumping applications. Experimental results establish the significance of motive fluid flow rate and submergence as the pumping performance was found to be extremely sensitive to them. The experimental study especially pertaining to the three –phase flow conditions gave an insight on the pumping performance under different test conditions like particle size, particle diameter and riser diameter. Increase in particle diameter and
Acknowledgements
The authors would like to thank B. R. Meena, V. G. Karande, M. Wagh, Satheesh Kumar and D. D. Pawar for their assistance during the experimental work.
References
1. Shaji Karunakaran, G Sugilal, K. N. S. Nair, Development of continuous rotary dissolver, BARC Internal Report, BARC/2012/I/023,
2. R. Srinath, Flow characteristics of geyser pump for continuous rotary dissolver, M. Tech. Thesis, Homi Bhabha National Institute, 2015
Fig. 7: Engineering scale prototype
Fig. 8: Solid transfer for the engineering scale prototypeat 60 % submergence
Article
|BARC Newsletter 2017 21| March-April
Indigenous Development of Pulsed Neutron
Generators for Analytical Applications
Rishi Verma, Rohit Shukla, Ekansh Mishra, Prosenjit Dhang, Premanand Dey,
Karuna Sagar, Manraj Meena and Archana Sharma
Pulsed Power & Electromagnetics Division
The Pulsed Power & Electromagnetics Division (PP&EMD) at BARCF, Visakhapatnam has developed compact transportable and portable types of plasma focus device based pulsed D-D neutron generators for analytical applications. The high yield transportable
9type pulsed neutron generator with efficient and compact pulsed power system produces an average yield of ~4×10 neutrons (energy ~2.5MeV) in 4πsr for the typical pulse duration of ~50ns. This generator is powered by high current pseudospark switch based low inductance modular capacitor bank that cumulatively delivers peak current of ~600kA at ~7kJ of stored energy in a quarter time period of 2µs. The compact miniature plasma focus device based portable pulsed neutron generator produces yield in
5 6the range of ~10 – 10 neutrons per pulse when a peak current of ~120kA is seeded from directly integrated 320J small capacitor bank. The developed neutron generators are intended to be utilized for exploring the feasibility of active neutron interrogation experiments using short duration intense burst of neutrons.
Keywords: Plasma focus, neutrons, x-rays, pseudospark switch, deuterium, tritium, time-of-flight.
Introduction
In the recent years, compact neutron generators are becoming an attractive alternative to nuclear reactors and passive radioactive neutron sources for variety of non-invasive interrogation applications. Because of the high penetration capability of neutrons an important application for neutron generators is in analyzing bulk materials by Neutron Activation Analysis (NAA). This technique mainly utilizes (n,γ) reaction to identify and quantify a broad range of elements [1]. When a sample is irradiated with a short pulse of neutrons then it becomes activated and emits γ-rays with characteristic and distinct energies. These γ-rays are like the 'fingerprints' denoting qualitative identification and quantitative analysis of the neutron capturing elements present in the sample. A typical NAA setup mainly comprises of compact neutron source, a gamma radiation detector (like HPGe, BGO, LaBr3:Ce etc. ) and a Multi-Channel Analyzer for accumulating the energy spectrum of emitted gamma rays. The stoichiometric relationships are used to convert the elemental information to chemical assays for detecting the elemental content of the major constituents in the bulk material. Other than bulk material analysis, neutrons are also being used in many other applications like – in excitation of fission reactions, micro/nano focus radiography, tomography, defectoscopy etc. [2]. To fulfill these application requirements, there is a large thrust to develop neutron generator that is compact, long lasting, efficient and inexpensive to construct and yet capable of using safe Deuterium-Deuterium (DD)/ Deuterium-Tritium (DT) reactions to produce a sufficiently high neutron yield or flux required as a non-invasive probing tool. Owing to contamination and safety risk involved in the handling of radioactive Tritium in DT generators, usage of DD generators is more prevalent in research laboratories.
Neutrons may be produced using a number of techniques including radioactive isotopic sources, electro-physical neutron generators and large accelerators. As on date, Plasma Focus (PF) device is the simplest and least expensive source of producing short duration burst of fusion neutrons. Due to pulsed nature, the PF machine does not pose any activation problem for storage and handling. The nanosecond duration of neutron pulse generated from plasma focus device also gives advantage in the interrogation of special nuclear materials by detecting secondary neutrons. Utilization of pulsed neutrons emitted from a plasma focus device for obtaining the non-destructive assay of fissile materials through active neutron interrogation technique has been reported by Tomar et al [3]
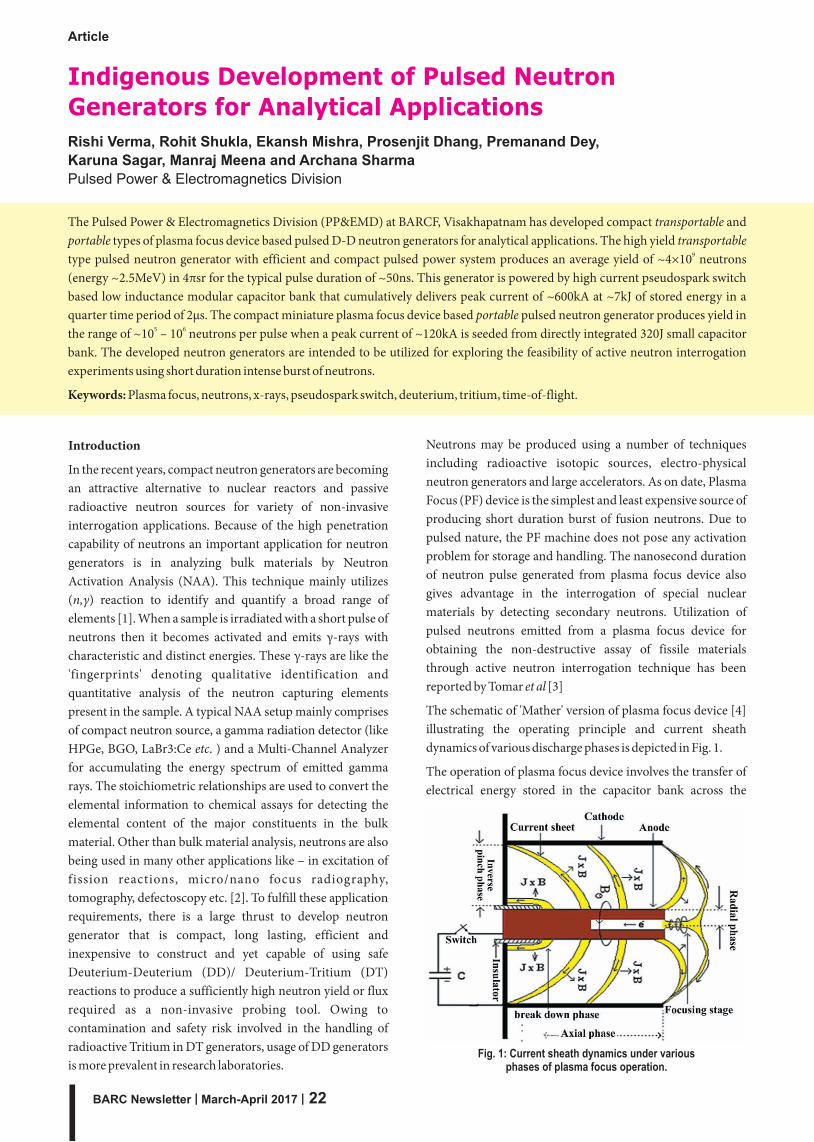
The schematic of 'Mather' version of plasma focus device [4] illustrating the operating principle and current sheath dynamics of various discharge phases is depicted in Fig. 1.
The operation of plasma focus device involves the transfer of electrical energy stored in the capacitor bank across the
Article
Fig. 1: Current sheath dynamics under various phases of plasma focus operation.
|BARC Newsletter 22| March-April 2017

central anode and outer cathode of coaxial cylindrical electrodes assembly in a gas filled chamber that results in initiation of discharge along the surface of an insulator sleeve at closed end of the coaxial electrode assembly (i.e. breakdown phase). In due course of time an axis-symmetric current sheath is formed which then accelerates axially due to J B force (i.e. axial phase) and finally converges radially in on the axis of the anode until a minimum radius is reached (i.e. radial phase) resulting in the formation of magnetically compressed short-lived (~25 – 100ns), high temperature (1 – 2keV), and
19-20 -3dense (~10 cm ) pinched plasma column (focus). The short-lived pinched plasma column is soon disrupted by the rapid growth of magneto-hydrodynamic (MHD) instabilities. Coincident with this disruption, bursts of ions, electrons, soft/hard x-rays and neutrons are produced [4,5]. Using deuterium as fueling gas, a short burst of neutrons (of energy ~2.45MeV) is produced that lasts about few tens of nanoseconds depending on the driver energy and device parameters. It is remarkable to note that for a given device, the neutron yield output depends on the specific design and operating parameters of the PF device. This includes discharge current, stored energy, shape and material of the coaxial electrode assembly components, insulator dimensions and material, gas composition and the filling gas pressure.
II.The high yield transportable pulsed neutron generator 9(Y ≥ 10 neutrons/pulse)
This transportable pulsed neutron generator is driven by a low inductance modular capacitor bank of 10kJ stored energy. It comprises of four parallely connected, 2.5kJ (12.5 F, 20kV) low inductance (<40nH) capacitors having peak current delivering capacity of ~150kA. Simultaneous discharge from four capacitors, cumulatively delivers peak current of about 600kA in the quarter time period of ~2 s. For rapidly transferring the energy stored in capacitors to the PF load, a 150kA/20kV hold-off pseudospark switch has been installed on each capacitor. The photograph of this transportable plasma focus device based neutron generator along with its compact and efficient pulsed power system is shown in Fig. 1 [6]. The total weight of this system is ~300kgs.
The coaxial electrodes of plasma focus head is directly interfaced with collector plate assembly and its chamber has major dimensions of 0.2m ( ) 0.3m (h). The fine-tuned dimensions of coaxial electrode assembly consists of a cylindrical anode of stainless steel (SS) having length of 120mm, radius of 20mm and a squirrel cage cathode, consisting of twelve numbers of 12mm diameter brass rods uniformly spaced on a coaxial circle of radius of 50mm. A 60mm deep cavity of 32mm diameter was bored at the centre of anode to reduce the ablated metal impurity during the pinch phase [7]. An insulator sleeve of Quartz with a breakdown length of 30mm was placed between the anode and cathode. The inner and outer diameter of insulator is 37mm and 40mm respectively [6].
´
m
m
f ´
To obtain maximum neutron yield in a plasma focus device, the deuterium gas (D ) filling pressure is so adjusted that the 2
focusing (or pinching) takes place at the instant when the discharge current driven by capacitor bank reaches its peak. This condition uniquely defines the optimized filling pressure and the maximum neutron yield at a particular stored energy/discharge current. The oscilloscope trace of typical current (I) and current derivative (di/dt) signal at ~17kV/8.5mbar discharge is shown in Fig. 2 [6].
9Fig. 1: Photograph of 10 neutrons/pulse (DD) transportable pulsed neutron generator.
Fig. 2: Typical current and current derivative signal for discharge at ~17kV/8.5mbar.
|BARC Newsletter 2017 23| March-April
Article
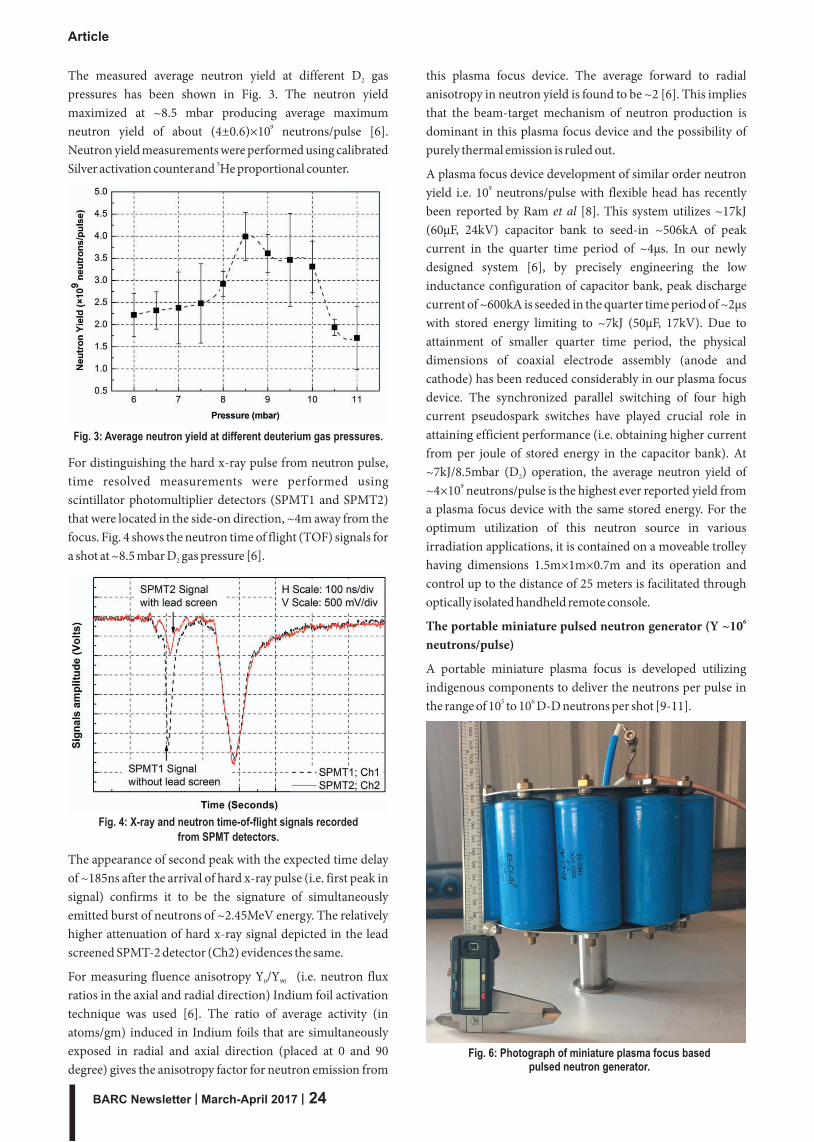
The measured average neutron yield at different D gas 2
pressures has been shown in Fig. 3. The neutron yield maximized at ~8.5 mbar producing average maximum
9neutron yield of about (4±0.6)×10 neutrons/pulse [6]. Neutron yield measurements were performed using calibrated
3Silver activation counterand He proportional counter.
this plasma focus device. The average forward to radial anisotropy in neutron yield is found to be ~2 [6]. This implies that the beam-target mechanism of neutron production is dominant in this plasma focus device and the possibility of purely thermal emission is ruled out.
A plasma focus device development of similar order neutron 9yield i.e. 10 neutrons/pulse with flexible head has recently
been reported by Ram et al [8]. This system utilizes ~17kJ (60µF, 24kV) capacitor bank to seed-in ~506kA of peak current in the quarter time period of ~4µs. In our newly designed system [6], by precisely engineering the low inductance configuration of capacitor bank, peak discharge current of ~600kA is seeded in the quarter time period of ~2µs with stored energy limiting to ~7kJ (50µF, 17kV). Due to attainment of smaller quarter time period, the physical dimensions of coaxial electrode assembly (anode and cathode) has been reduced considerably in our plasma focus device. The synchronized parallel switching of four high current pseudospark switches have played crucial role in attaining efficient performance (i.e. obtaining higher current from per joule of stored energy in the capacitor bank). At ~7kJ/8.5mbar (D ) operation, the average neutron yield of 2
9~4×10 neutrons/pulse is the highest ever reported yield from a plasma focus device with the same stored energy. For the optimum utilization of this neutron source in various irradiation applications, it is contained on a moveable trolley having dimensions 1.5m×1m×0.7m and its operation and control up to the distance of 25 meters is facilitated through optically isolated handheld remote console.
6The portable miniature pulsed neutron generator (Y ~10 neutrons/pulse)
A portable miniature plasma focus is developed utilizing indigenous components to deliver the neutrons per pulse in
5 6the range of 10 to 10 D-D neutrons per shot [9-11].
Fig. 3: Average neutron yield at different deuterium gas pressures.
For distinguishing the hard x-ray pulse from neutron pulse, time resolved measurements were performed using scintillator photomultiplier detectors (SPMT1 and SPMT2) that were located in the side-on direction, ~4m away from the focus. Fig. 4 shows the neutron time of flight (TOF) signals for a shot at ~8.5 mbar D gas pressure [6]. 2
Fig. 4: X-ray and neutron time-of-flight signals recorded from SPMT detectors.
The appearance of second peak with the expected time delay of ~185ns after the arrival of hard x-ray pulse (i.e. first peak in signal) confirms it to be the signature of simultaneously emitted burst of neutrons of ~2.45MeV energy. The relatively higher attenuation of hard x-ray signal depicted in the lead screened SPMT-2 detector (Ch2) evidences the same.
For measuring fluence anisotropy Y /Y (i.e. neutron flux 0 90
ratios in the axial and radial direction) Indium foil activation technique was used [6]. The ratio of average activity (in atoms/gm) induced in Indium foils that are simultaneously exposed in radial and axial direction (placed at 0 and 90 degree) gives the anisotropy factor for neutron emission from
Fig. 6: Photograph of miniature plasma focus based pulsed neutron generator.
|BARC Newsletter 24| March-April 2017
Article

This neutron generator can be repetitively operated up to 50Hz with the power supply and the triggering scheme connected to it [11] at 75 J energy. The deuterium is filled inside the plasma focus chamber using from a portable deuterium generator electrolyzing the heavy water filled in it in the presence of suitable electrolyte. Figure 6 shows the experimental arrangement of the plasma focus reported in this article. The operating pressure of the plasma focus deuterium filling is 14mbar and the cathode is made of stainless steel 8mm in diameter with a bore inside. The anode has inner radius of 25mm and is made of Stainless Steel. The insulator is quartz tube of 8mm inner diameter and 10mm outer diameter. The insulator length inside the plasma chamber is 6-7mm. The capacitor bank driving this plasma focus is made up of ~22.5 µF capacitance charged to ~5.3 kV storing a peak energy of ~320 Joules. The discharge current measured is through calibrated current measurement scheme consisting of Rogowski coil with external integrator. The pinch event is observed on the oscilloscope by Rogowski Coil output. The neutrons are being observed in the time of flight
Fig. 7: X-ray and neutron time-of-flight signals recorded from scintillator backed PMT.
Fig. 8: Plasma focus discharge current waveform.
Fig. 9: Neutron pulse seen by Helium-3 detector with Pre-amplifier.
Table 1: Major specifications of PF based pulsed neutron generators at PP&EMD
System type : Transportable Portable9 5 6DD neutron yield per pulse : 4×10 n/p (average) 10 – 10 n/p (average)
Neutron energy (DD) : ~2.45 MeV (typical) ~2.45 MeV (typical)
Pulse duration (FWHM) : ~50 ns (typical) ~25 ns (typical)
Plasma focus head : Replenishable & Replenishable &Demountable type Demountable type
Total energy stored : 10 kJ (maximum) 340 Joules (maximum)
Total capacitance : 50 µF (12.5 µF × 4 Nos.) 22.5 µF (1.9 µF × 12 Nos.)
Charging voltage : 20 kV (maximum) 5.5 kV (maximum)
Energy transfer switch : Pseudospark (4 Nos.) Sparkgap (1 No.)
Peak discharge current : 600 kA (maximum) 120 kA (maximum)
Minimum time between shots : 180 s 200 ms
Size of plasma focus head : 0.2 m ( ) × 0.3 m (h) 0.025 m ( ) × 0.1 m (h)
Overall weight of system : 300 kgs (approx.) 10 kgs (approx.)
f f
m o d e r e c o r d i n g f r o m t h e Scintillator backed Photomultiplier tube biased to -1800 Volts and kept at a distance of ~1.4 meters from the neutron emitting region of the plasma focus chamber.
Fig. 7 is shows the neutron emission from the miniaturized plasma focus which is associated with the X-ray emission. FWHM of X-ray pulse is ~25 ns indicating that the neutron pulse width at source is within ~25 ns duration. The neutron pulse is emitted from ~730 ns duration from the beginning of the discharge of the capacitor bank in the plasma focus chamber.
Fig. 8 is a current waveform of the plasma focus discharge indicative
of the time to the current peak is ~1microsecond after the beginning of the discharge of the capacitor bank.
Fig. 9 shows typical Helium-3 detector output in charge integration mode. The detector is kept at a distance of nearly
|BARC Newsletter 2017 25| March-April
Article

0.8 meters inside 12mm thick polyethylene cylindrical moderator.
A similar palm-top and compact repetitive miniature plasma focus (MPF) device development has been reported by Rout et al [12] and Ram et al [13] that generate average neutron yield
4 5of ~5.2×10 neutrons/pulse at 100J, 59kA and ~1.3×10 neutrons/pulse at 500J, 85kA, respectively. In repetitive mode, average neutron yield of MPF device for 10Hz operation was
6~1.4×10 neutrons/pulse [13].
The major technical specifications of transportable and portable type of pulsed neutron generators that are indigenously designed and developed at PP&EMD, BARCF (V) are summarized in Table 1.
It is remarkable to note that plasma focus devices with replenishable and demountable head permits easy access, maintenance and replacement of coaxial electrode assembly components resulting in much longer shot life than sealed type devices.
Summary
Research and development of intense pulsed neutron sources to explore active neutron interrogation applications is under prime consideration across the globe. Amongst various contending sources available for intense neutron burst generation, dense plasma focus is a promising source with the major advantage of inherently producing a flash of intense burst of neutrons for short duration that is typically in the range of ~25ns to 100ns. This flash of short duration neutron pulse is supportive in identifying various non-nuclear and special nuclear materials. The precisely engineered device construction and judiciously chosen coaxial electrode parameters and materials has led the development of compact and efficient plasma focus device based pulsed neutron generators that may be effectively utilized various transient activation analysis applications. Another envisioned use of these pulsed neutron generators is in the production of radioactive isotopes.
Acknowledgement
The authors are grateful to Shri D. Venkateswarlu, Regional Director, BARC Facility, Visakhapatnam and Shri R.K. Rajawat, Associate Director, Beam Technology Development Group, BARC for their consistent encouragement, interest and support in the development of pulsed neutron generators. Authors are also thankful to Shri Debashis Das, Chairman & Managing Director, ECIL and Associate Director, Electronics & Instrumentation Group, BARC, Dr. K.S. Pradeepkumar, Associate Director, Health Safety & Environment Group, BARC, Dr. M.S. Kulkarni, Head, Radiation Standards Section, BARC, Shri V. Sathian, Radiation Safety Systems Division, BARC and Dr. (Smt.) P. M. Dighe, Electronics Division, BARC for their valuable suggestions, guidance and help in maturing the performance of these pulsed neutron generators.
References1. G. Vourvopoulos and P.C. Womble, Pulsed fast/thermal
neutron analysis: a technique for explosives detection, Talanta, 54, 459 (2001).
2. Sanjay Andola, Ram Niranjan, A.M. Shaikh, R.K. Rout, T.C. Kaushik, and S.C. Gupta, Characterization of pulsed (plasma focus) neutron source with image plate and application to neutron radiography, AIP Conf. Proc. 1512, 528-529 (2013).
3. B.S. Tomar, T.C. Kaushik, Sanjay Andola, Ram Niranjan, R. K. Rout, Ashwani Kumar, D.B. Paranjape, Pradeep Kumar, K.L. Ramakumar, S.C. Gupta, and R.K. Sinha, Non-destructive assay of fissile materials through active neutron interrogation technique using pulsed neutron (plasma focus) device, Nucl. Instr. and Meth A, 703, 11 (2013).
4. J. W. Mather, Formation of a high-density deuterium plasma focus, Phys. Fluids, 8, 366 (1965).
5. M. Mathuthu, T. G. Zengeni and A. V. Gholap, The three-phase theory for plasma focus devices, IEEE Trans. Plasma Sci., 25(6), 1382 (1997).
6. Rishi Verma, Ekansh Mishra, Prosenjit Dhang, Karuna Sagar, Manraj Meena, and Anurag Shyam, Development and characterization of a high yield transportable pulsed neutron source with efficient and compact pulsed power system, Rev. Sci. Instrum., 87 (9), 095102 (2016) doi: 10.1063/1.4961646.
7. M. F. Lu, Plasma motion and neutron emission in an 18-kJ plasma Focus, Nucl. Instrum. Methods Phys. Research B, 117, 452 (1996).
8. Ram Niranjan, R. K. Rout, R. Srivastava, T. C. Kaushik 9and Satish C. Gupta, A 10 neutrons/pulse transportable
pulsed D-D neutron source based on flexible head plasma focus unit, Rev. Sci. Instrum., 87, 033504 (2016) doi: 10.1063/1.4942666.
9. Rohit Shukla & Anurag Shyam, Compact Pulsed Power Driven Plasma Devices for Radiation Application & Diagnostic Development in the Relevant Field, Annals of the Indian National Academy of Engineering Vol. XII, April 2015 (pp 271-277).
10. Rohit Shukla, S. K. Sharma, P. Banerjee, R. Das, P. Deb, T. Prabahar, B. K. Das, B. Adhikary, and A. Shyam, Low voltage operation of plasma focus, Review of Scientific I n s t r u m e n t s , 8 1 , 0 8 3 5 0 1 ( 2 0 1 0 ) ; d o i : http://dx.doi.org/10.1063/1.3470917.
11. Rohit Shukla Anurag Shyam, Note : Repetitive operation of the capacitor bank of the low voltage miniature plasma focus at 50 Hz, Review of Scientific Instruments Vol. 84, No. 10, 106112 (2013).
12. R.K. Rout, Ram Niranjan, P. Mishra, R. Srivastava, A.M. Rawool, T.C. Kaushik and Satish C. Gupta, Palm top plasma focus device as a portable pulsed neutron source, Rev. Sci. Instrum., 84, 063503 (2013) doi: 10.1063/1.4808309.
13. Ram Niranjan, R. K. Rout, Rohit Srivastava and Satish C. Gupta, The smallest plasma accelerator device as radiation safe repetitive pulsed neutron source, Indian Journal of Pure & Applied Physics, 50, pp. 785-788 (2012).
|BARC Newsletter 26| March-April 2017
Article

A Brief Report on the Training Course on
“Basic Radiological Safety and Regulatory Measures
for Nuclear Facilities”, organised by BSC Secretariat
BSC Secretariat (BSCS) conducts many short-term training courses for the working personnel of BARC facilities as part of its mandate. One such regular training course is on “Basic Radiological Safety and Regulatory Measures for Nuclear Facilities”. The thirty third course of this series was conducted
, during March 15-18, 2017.
regulatory framework of BARC; radiation protection in fuel
at Raja Ramanna Centre, Rare Material Projects (RMP), Mysuru
During the inauguration of the training course on March 15, 2017, Shri K. Jayarajan, Head, BSCS briefed the role of such training courses towards improving safety in the BARC facilities. Shri Y. K. Taly, Chairman, BARC Safety Council (BSC) introduced the course and explained its relevance to the participants. Chief Guest of the function, Dr. G. Gouthaman, RRF and Former Chairman, BSC explained the necessity of adhering to regulatory codes, guides and procedures. The key note speaker, Shri K. C. Guha, AD, ChTG thanked BSCS for conducting the programme at RMP, Mysuru and expressed that this would improve safety awareness among the participants and other facility personnel. Shri B. S. Arun Kumar, Training Superintendent, RMP, Mysuru proposed vote of thanks.
The training course was carried out through classroom lectures and video displays. It covered topics, such as
fabrication facilities; dosimetry and dose control; radiation detection and measurement; radiation monitoring around nuclear facilities; occupational health care; management of internal contamination; preparedness and response for nuclear and radiological emergencies; biological effects of radiation; transportation of radioactive materials and improvement of safety culture in the facilities.
A written test was conducted at the end of the course.
RMP, Mysuru and MDD, BARC, Trombay
The function was graced by Dr. T. K. Bera, Former Director, ChTG; Shri Srikanthan, Former Project Director, RMP; Shri A. Nandakumar, Senior Project Engineer, RMP and Shri S. K. Garai, BSCS.
In addition to the faculties from BSCS, experts from Radiation Safety Systems Division, Radiological Physics & Advisory Division, Medical Division, Industrial Hygiene & Safety Section, Fire Services Section, Centre for Design & Manufacture, BARC, Trombay, and RMP, Mysuru have shared their knowledge and experience to the participants.
Feedback on the training course was taken from the participants for improving the future courses. Forty participants from
attended the course.
Certificates were distributed to the participants during valedictory function held on March 18, 2017.
The training programme was well appreciated by the participants and the RMP management.
|BARC Newsletter 2017 27| March-April
News & Event
Shri K. Jayarajan, Shri Y. K. Tally, Dr. G. Gouthaman and Shri K. C. Guha during the release of compiled lecture notes
Shri Y. K. Taly, Chairman, BSC giving remarks on the mandate of BSC on safety.

Edited & Published by:Scientific Information Resource Division
Bhabha Atomic Research Centre, Trombay, Mumbai 400 085, IndiaBARC Newsletter is also available at URL:http://www.barc.gov.in
Central Complex at BARC