Embed Size (px)
Citation preview

MYTHBUSTING MODERN HARDWARE
TO GAIN “MECHANICAL SYMPATHY”
Martin Thompson
@MJPT777


Myth - 1
“CPUs are not getting
faster”

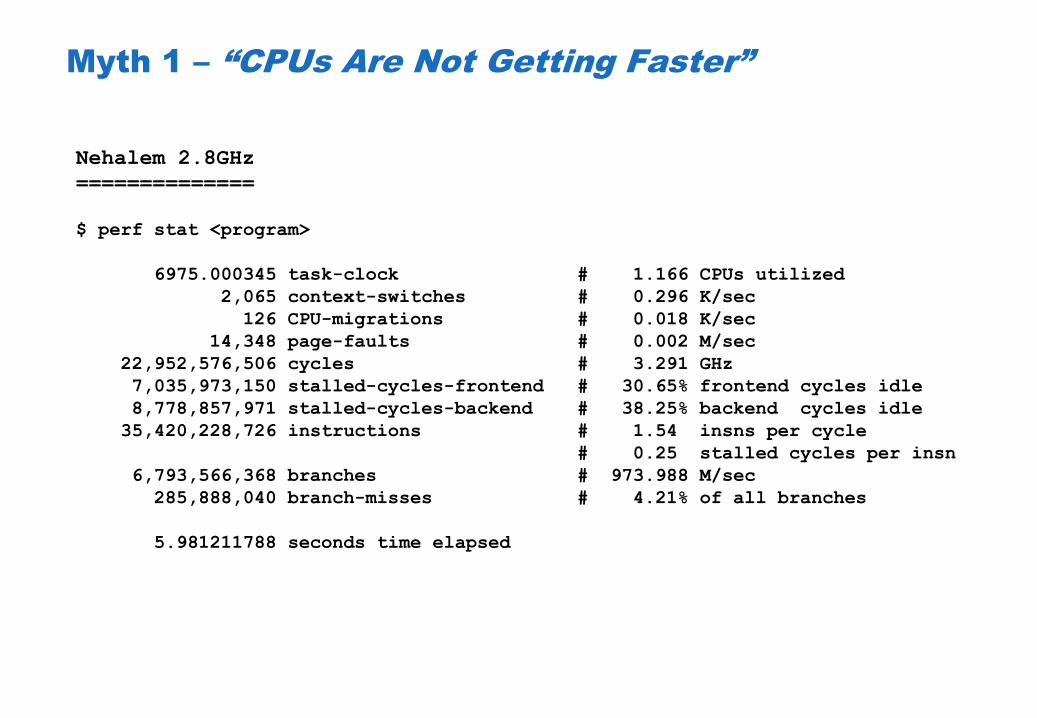
Myth 1 – “CPUs Are Not Getting Faster”
Processor Model Operations/sec Release
Intel Core 2 Duo CPU P8600 @ 2.40GHz 1434 (2008)
Intel Xeon CPU E5620 @ 2.40GHz 1768 (2010)
Intel Core CPU i7-2677M @ 1.80GHz 2202 (2011)
Intel Core CPU i7-2720QM @ 2.20GHz 2674 (2011)
• “The Free Lunch Is Over” – Herb Sutter
> The issue is clock speeds cannot continue to get faster.
> However clock speeds are not everything!
• Let’s word split of the “Alice in Wonderland” text

Myth 1 – “CPUs Are Not Getting Faster”
Nehalem 2.8GHz
==============
$ perf stat <program>
6975.000345 task-clock # 1.166 CPUs utilized
2,065 context-switches # 0.296 K/sec
126 CPU-migrations # 0.018 K/sec
14,348 page-faults # 0.002 M/sec
22,952,576,506 cycles # 3.291 GHz
7,035,973,150 stalled-cycles-frontend # 30.65% frontend cycles idle
8,778,857,971 stalled-cycles-backend # 38.25% backend cycles idle
35,420,228,726 instructions # 1.54 insns per cycle
# 0.25 stalled cycles per insn
6,793,566,368 branches # 973.988 M/sec
285,888,040 branch-misses # 4.21% of all branches
5.981211788 seconds time elapsed

Myth 1 – “CPUs Are Not Getting Faster”
Sandy Bridge 2.4GHz
===================
$ perf stat <program>
5888.817958 task-clock # 1.180 CPUs utilized
2,091 context-switches # 0.355 K/sec
211 CPU-migrations # 0.036 K/sec
14,148 page-faults # 0.002 M/sec
19,026,773,297 cycles # 3.231 GHz
5,117,688,998 stalled-cycles-frontend # 26.90% frontend cycles idle
4,006,936,100 stalled-cycles-backend # 21.06% backend cycles idle
35,396,514,536 instructions # 1.86 insns per cycle
# 0.14 stalled cycles per insn
6,793,131,675 branches # 1153.565 M/sec
186,362,065 branch-misses # 2.74% of all branches
4.988868680 seconds time elapsed

Myth - 1
“CPUs are not getting
faster”
Myth - 2
“Memory Provides
Random Access”

Myth 2 – “Memory Provides Random Access”
• What do we mean by “Random Access”?
> Should it not really be “Arbitrary Access”?
> Ideally we would like O(1) latency, where 1 is small
CPU Registers & Buffers
L1 Cache
L2 Cache
L3 Cache
Main Memory
Local Storage
Remote Storage
Speed Power Cost

Memory Ordering
Registers
L1
L2
L3
Execution Units
MOB
LF/WC
Buffers
Core 1
Registers
L1
L2
Execution Units
MOB
LF/WC
Buffers
Core 2 Core n
Load Buffer Store Buffer
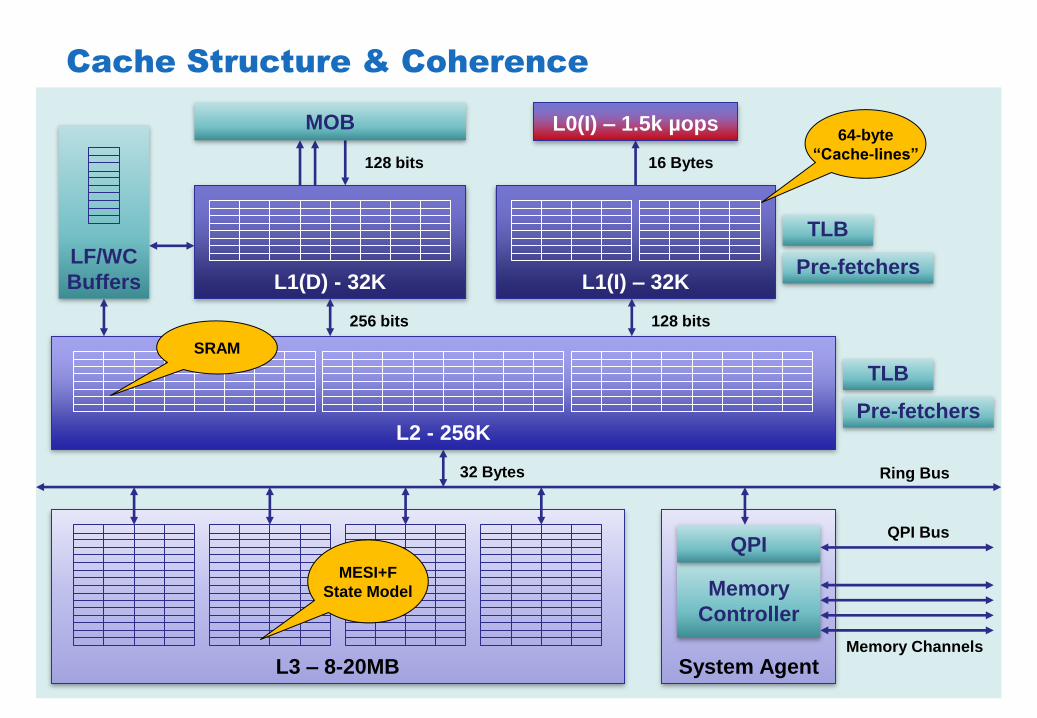
Cache Structure & Coherence
L1(D) - 32K
L2 - 256K
L3 – 8-20MB
LF/WC
Buffers L1(I) – 32K
64-byte
“Cache-lines”
L0(I) – 1.5k µops
256 bits 128 bits
32 Bytes
System Agent
SRAM
TLB
Pre-fetchers
TLB
Pre-fetchers
128 bits
MOB
Memory
Controller
QPI QPI Bus
Memory Channels
16 Bytes
Ring Bus
MESI+F
State Model

DRAM
Main Memory
DRAM
Bank Select, Pre-charge + RAS + CAS
Bank 1 Bank 0 Bank n
Columns
Rows
Memory Module
Ch
an
ne
l
Row Buffer C
ha
nn
el
Ch
an
ne
l
Channel
Memory Controller
Write Buffer
Memory Array
4096 * 1024 * 16
Ranks are Banks
in parallel

Myth 2 – “Memory Provides Random Access”
L1D L2 L3 Memory
Sequential 3 clocks 11 clocks 14 clocks 6.0 ns
In-Page Random 3 clocks 11 clocks 18 clocks 22.0 ns
Full Random 3 clocks 11 clocks 38 clocks 65.8 ns
• “The real design action is in the memory sub-systems – caches, buses, bandwidth, and latency.” – Richard Sites (DEC Alpha Architect)
> No point making faster CPUs when we cannot feed them fast enough
• Let’s look at the latencies measured by the SiSoftware tool
> Intel i7-3960X (Sandy Bridge E)

Myth - 2
“Memory Provides
Random Access”

Myth - 3
“HDDs Provide
Random Access”

Myth 3 – “HDDs Provide Random Access” Sectors
512/4096 Bytes
Zone Bit Recording (ZBR)
Read/Write
Cache +
Pre-fetcher
Command
Queue

4KB Block
Myth 3 – “HDDs Provide Random Access”
What Makes up an IO operation?
• Command Overhead
> Time for the electronics to process and schedule the request – Sub millisecond
• Seek Time
> Time to move the read/write arm to the appropriate cylinder
> Seek and Settle – 0-6ms Server Drive, 0-15ms Laptop Drive
• Rotational Latency
> For a 10K RPM disk a rotation takes 6ms so average will be 3ms
• Data Transfer
> Dependent on media and interface transfer speeds – 100-200 MB/s
Average
10ms latency?
Average
<1 MB/s?
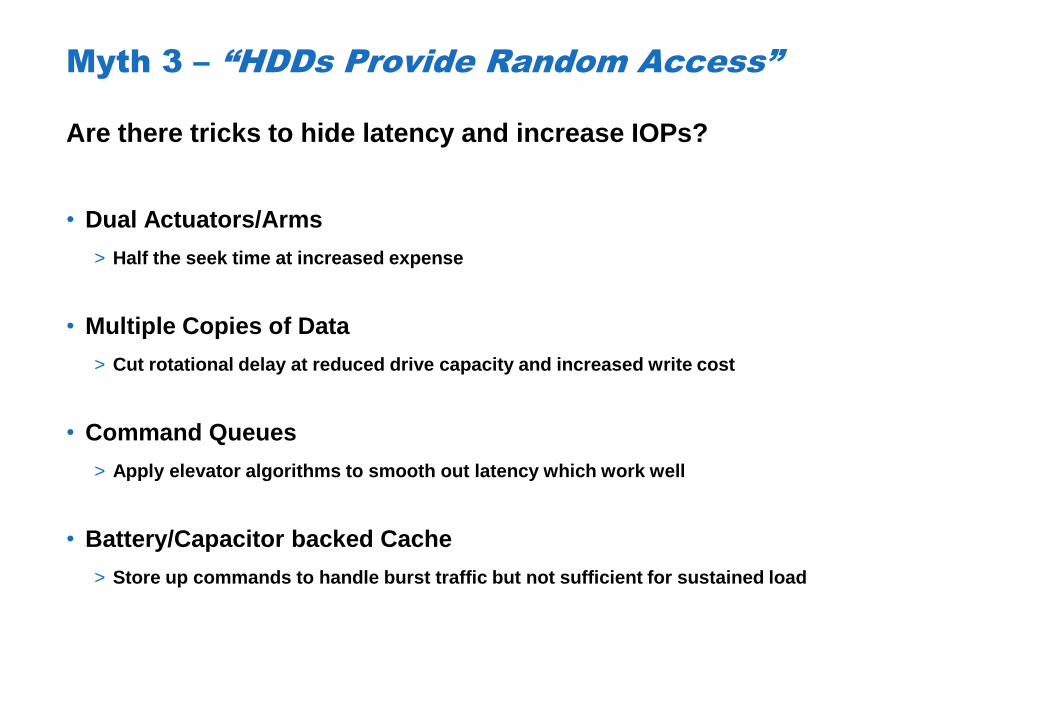
Myth 3 – “HDDs Provide Random Access”
Are there tricks to hide latency and increase IOPs?
• Dual Actuators/Arms
> Half the seek time at increased expense
• Multiple Copies of Data
> Cut rotational delay at reduced drive capacity and increased write cost
• Command Queues
> Apply elevator algorithms to smooth out latency which work well
• Battery/Capacitor backed Cache
> Store up commands to handle burst traffic but not sufficient for sustained load
Myth - 3
“HDDs Provide
Random Access”

Myth - 4
“SSDs Provide
Random Access”
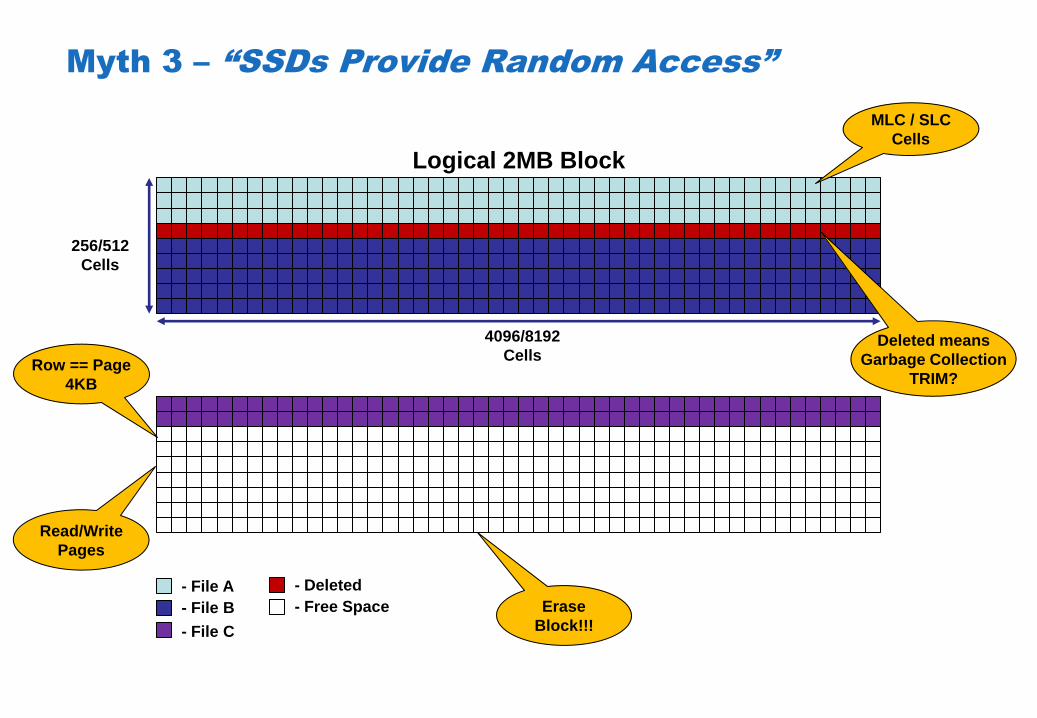
Myth 3 – “SSDs Provide Random Access”
Logical 2MB Block
4096/8192
Cells
256/512
Cells
- File A
- File B
- File C
- Deleted
- Free Space
MLC / SLC
Cells
Deleted means
Garbage Collection
TRIM? Row == Page
4KB
Read/Write
Pages
Erase
Block!!!
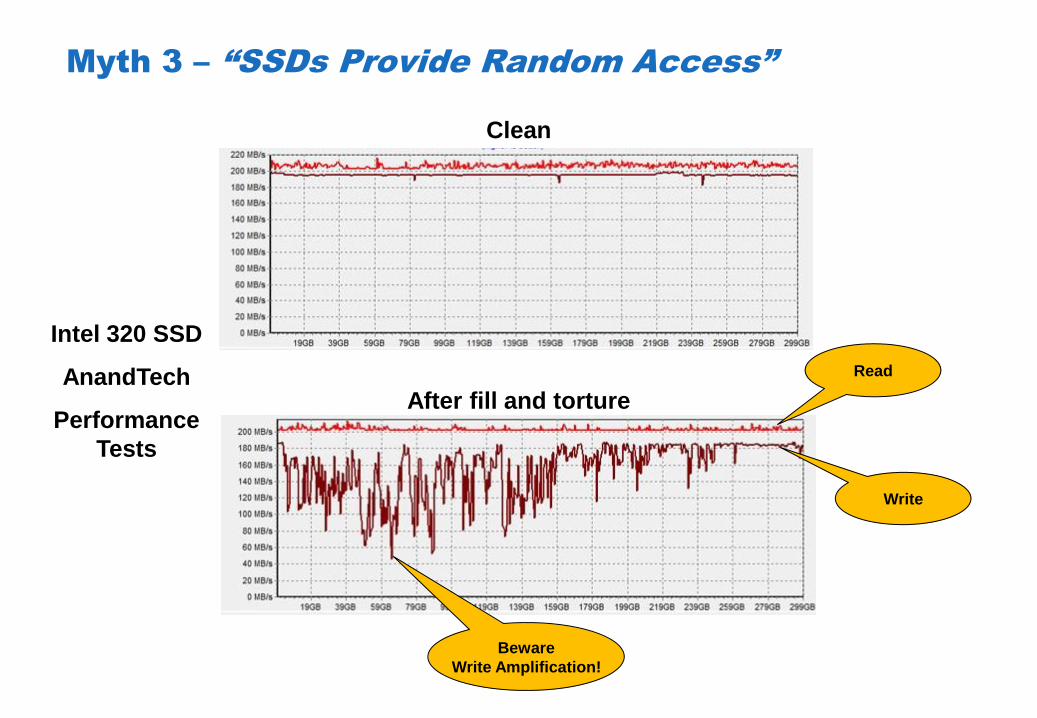
Myth 3 – “SSDs Provide Random Access”
Clean
After fill and torture
Intel 320 SSD
AnandTech
Performance
Tests
Read
Write
Beware
Write Amplification!

@40K IOPs Average (ms) Max (ms)
Read 4K Random 0.1 - 0.2 2 - 30
Write 4K Random 0.1 - 0.3 2 - 500
• Random re-writes hurt performance and wear out the drive
> Block erase is 2ms!
• Reads have great random and sequential performance
• Append only writes have great random and sequential performance
Myth 3 – “SSDs Provide Random Access”
GC
Compaction

Myth - 4
“SSDs Provide
Random Access”
Questions?
Blog: http://mechanical-sympathy.blogspot.com/
Twitter: @mjpt777