Embed Size (px)
DESCRIPTION
Insights into Malaysia's foresight & future oriented programs and activities.
Citation preview
Private Sector R&D Vital To Boost Growth
Foresight in Determining Priority Research Directions
Spearheading 2nd Frontier of Sustainability in Malaysian Rubber Industry
Does PRT Have a Place in the Greater KL Transportation Infrastructure
MALAYSIA’S SHIPBUILDING INDUSTRYShifting Towards Sustainability
JANUARY 2012
p13
1/2012
ISSN NO: 2229-9637


EDITOR’S NOTEp02 Initial Thoughts
LEADER’S INSIGHTSp04 Private Sector R&D Vital To Boost Growth
EXPERTS’ INSIGHTSp06 Application of Foresight Methods for the Determination of Priority Research Directions of the Future
INDUSTRY INSIGHTSp13 Spearheading Second Frontier of Sustainability in Malaysian Rubber Industryp21 Innovating Innovation: Innovation In the Age of Disruption And Black Swansp24 Towards A High Income Society - The Offset Programs
YOUTH INSIGHTSp20 Creative Multimedia p48 Foresight Outreach: What Say Youth
COVER STORYp28 Malaysia’s Shipbuilding Industry - Shifting Towards Sustainability
TRENDS & ISSUESp33 Driving Technological Catch Up In The IC Industry In Malaysiap38 Does PRT Have a Place in the Greater KL Transportation Infrastructurep40 Megatrends in Railways
VIEWPOINTSp43 Future of Halal: From Niche to Mainstream
p52 THE WORLD MOVING FORWARD
FORESIGHT INTERCONNECT™p54 myForesight™ Bookclub
p19 Letter From The Future
EDITOR-IN-CHIEFRushdi Abdul Rahim
WRITERSProf. Emeritus Dato’ Dr. Zakri Abdul HamidDatuk Dr. Salmiah AhmadBeata PoteralskaProfessor Rajah RasiahIr. Dr. Aziz HassanMajor (R) Zailani SafariAzim PawanchikDr. Suraya SulaimanMohd Afzanizam Mohd BadrinNatrah Mohd EmranFarah Abu BakarFatin NuramaninaMuhammad Ridhwan Naim SuhaimeHazim Adly Harun
CONTRIBUTORSMohd Nurul Azammi Mohd NudriAmallia Ahmad ZainiAni Suzila AnasAhmad Nazri AbudinMohd Kamaruzaman AbdullahMuhammad Hasif Hasan
PUBLISHED BYMalaysian Industry-Government Group for High Technology Prime Minister's Department 3517, Jalan Teknokrat 563000 Cyberjaya Selangor Darul Ehsanwww.might.org.my
FOR INQUIRIESmyForesight™
Phone : +603 8315 7888Fax : +603 8312 0300E-mail : [email protected] : www.myforesight.my
DISCLAIMERAny article included in this publication and/or opinions expressed therein do not necessarily reflect the views of the myForesight™ but remain solely those of the author(s).
The Publisher is not to be held responsible for any copyright violation of articles, which have been provided by contributing writers.
PP17630/12/2012(031478)
EDITORIAL BOARD
inside January 2012
21
43
features
28
38

Dr. Rajah Rasiah talks about the Malaysian IC industry and how it’s playing technological catch up to the rest of the world, raising the questions of policy implications and what’s the best strategy to move forward. You could read all about this edition’s trends and issues.
Previously we’ve talked about the technology strategy of the nation. This includes either to develop the technology on our own, do it in partnership collaboratively or outright acquiring the technology required. In this edition we’re providing a viewpoint on technology acquisition and how to maximize its benefits through a national offset program.
We are glad to say that we have garnered positive reviews so far on the magazine and hope to continually do so in making the magazine beneficial and thought provoking.
After reading the magazine, we expect you to have your opinion on certain matters. You might agree or disagree. Whichever it goes, we want to hear them. We welcome your feedback and contributions.
“Difficult to see. Always in motion is the future” - Yoda
The previous quote underlines the difficulty of trying to look beyond the present. If the all-powerful Jedi Master with fictional powers like Yoda from the Star Wars Hexalogy would not be able to see what the future lays ahead, where does this leave mere mortal like us. So called experts and futurist have all tried to predict something about the future with mixed results. Nowadays, the use of foresight tools and methodology has provided some means towards looking ahead with confidence.
However through my interactions I am still greeted by the question, why foresight?
Everybody knows that every decision that we make today, either as individuals or as organisations will have an impact on the future. Therefore it makes sense to explore the potential impact of such decisions before they are made, and to make the best decisions that we can today. There are, however no future facts, and in a world obsessed by data driven decision making, the challenge for advocates of foresight is to demonstrate how exploring the future today will add value to the planning processes.
What foresight attempts to do is to create a better understanding of the drivers of change and the megatrends as well as its impact that will enable us to have a new understanding about the future. The future will be nothing like the past. If you were to go back only five or ten years and think about whether you could have imagined the details of the future that is now, what would you have thought was possible?
However, given the complexity of the external environment, the thinking that goes into strategy development needs to be divergent and expansive. Foresight approach facilitates, in fact encourages this line of thinking, and then bringing this back to the present and now, to the strategic decisions that need to be made today. The aim is to strengthen those strategic decisions - to make them wiser and more robust, and able to withstand the change and uncertainties that the future will bring.
The articles that were, is and will be published in myForesightTM reflects this line of thoughts; exploring the possibilities and how the future oriented thinking are embedded into the formulation of strategy and recommendations to be taken now.
Beata Poteralska’s piece on how Poland uses foresight methodology and approach in defining their defining national research priority areas is a prime example of future oriented analysis and recommendations. You could read all about it on page 06.
On the home front the Malaysian ship building ship repairs industry is also undertaking a revolution of sorts; developing a roadmap to ensure future sustainability, whereas Datuk Dr. Salmiah’s piece provide us with insights of what it takes to spearhead the rubber industry into the future.
With the growing concern of energy security, the focus on public transport especially in Malaysia has grown considerably; Dr Aziz’s take on the future of KL public transport infrastructure and the possibility of PRT being introduced provides interesting food for thought.
“Everybody knows that every decision that we make today, either as individuals or as organisations will have an impact on the future”
editor’s note
2
January 2012
BYRUSHDI ABDUL RAHIM Director myForesight™[email protected]
Initial Thoughts


BYPROF EMERITUS DATO’ DR. ZAKRI ABDUL HAMID Science Advisor to the Prime Minister of Malaysia /Joint Chairman - Government, MIGHT
Because the private sector is closer to the
market, it is better positioned to create
wealth through R&D — transforming
knowledge into products and services
that Malaysians and others in today’s global
marketplace need, want and will pay for.
Private Sector R&D Vital To Boost Growth
MALAYSIA has successfully transformed its economy from its original agricultural base to one characterised by strong
manufacturing and service sectors.
This ongoing transition moves Malaysia ever closer to its official Vision 2020: a high income economy based on innovation and knowledge generation.
Underpinning a high income economy are science, technology and innovation, which together form an important contributor to economic growth and help determine the competitiveness of firms in the marketplace, nationally and internationally.
A prerequisite for technological advancement is research and development (R&D). The level of R&D expenditure is a reliable indicator of innovative capacity and the 10th Malaysia Plan aims to achieve R&D investment of at least one per cent of GDP by 2015. Reaching that goal will require a bold commitment, including large injections of funds from the government and, more importantly, the private sector.
Across the world, the private sector carries out two-thirds to three-quarters of R&D activities.
Private sector involvement in research-driven activities, therefore, is key to Malaysia’s economic growth and competitiveness.
Because the private sector is closer to the market, it is better positioned to create wealth through R&D — transforming knowledge into products and services that Malaysians and others in today’s global marketplace need, want and will pay for. Private sector R&D will also strengthen the firms involved in innovation, which in turn allow them to improve productivity, succeed in competitive markets, and meet environmental and regulatory standards.
Although the private sector traditionally develops research capabilities in-house, they also establish collaborative links with other organisations, such as universities, and acquire the results of innovation from other enterprises through licensing or takeovers. Finally, private sector R&D creates highly skilled human capital.
Various mechanisms were introduced globally to promote private sector R&D. Widely used financial instruments include subsidies/grants and tax incentives. For example: A generation ago the United States was one of the first nations to encourage private sector R&D through tax credits. Since then, a range of economists have agreed that every tax credit dollar stimulates from US$1 (RM3) to US$3 in additional private investment by US companies.
In the case of Malaysia, the main R&D incentives are granted in the form of “pioneer status”, investment tax allowance and double deduction or tax exemption. However, an innovative, bolder approach is needed to enhance private sector R&D activities, attract foreign investment and stimulate domestic investment to achieve Vision 2020.
Toward this end, the Malaysian Industry-Government Group for High Technology (MIGHT), under the Prime Minister’s Department, was instrumental in nurturing and encouraging private sector R&D in the past. MIGHT has come a long way since its
leader's insights
4
January 2012
MIGHT is working closely with ministries and industry
players to ensure that the offset programs are
developed and structured to address issues related
to the development of strategic industry in
the country, leveraging major acquisitions by the
government and government linked companies.
This article was published in The News Straits Times, 20 August 2011
establishment in 1993 as a not for- profit, industry-government partnership with a mission to promote high technology development in Malaysia.
MIGHT’s agenda remains focused on two major challenges.
First: provide measured opinions on cross-sectoral issues or cross-cutting technologies, and, second: take actions needed to harness the commercial applications of technology to foster a better economic future for the nation.
MIGHT believes the nation’s future rests on its ability to continuously harness technology for business and create new industries. What is needed is a continuous, systematic effort to prospect for strategic technologies in both the traditional fields like manufacturing and new fields, such as biotechnology and nanotechnology.
One interesting initiative to boost private sector R&D was the offset management activities through MIGHT’s Technology Depository Agency for the Finance Ministry. The service plays a strategic government role undertaken for the purpose of ensuring that national procurement programmes support the country’s development objectives through acquisitions of technology, industrial participation and market access.
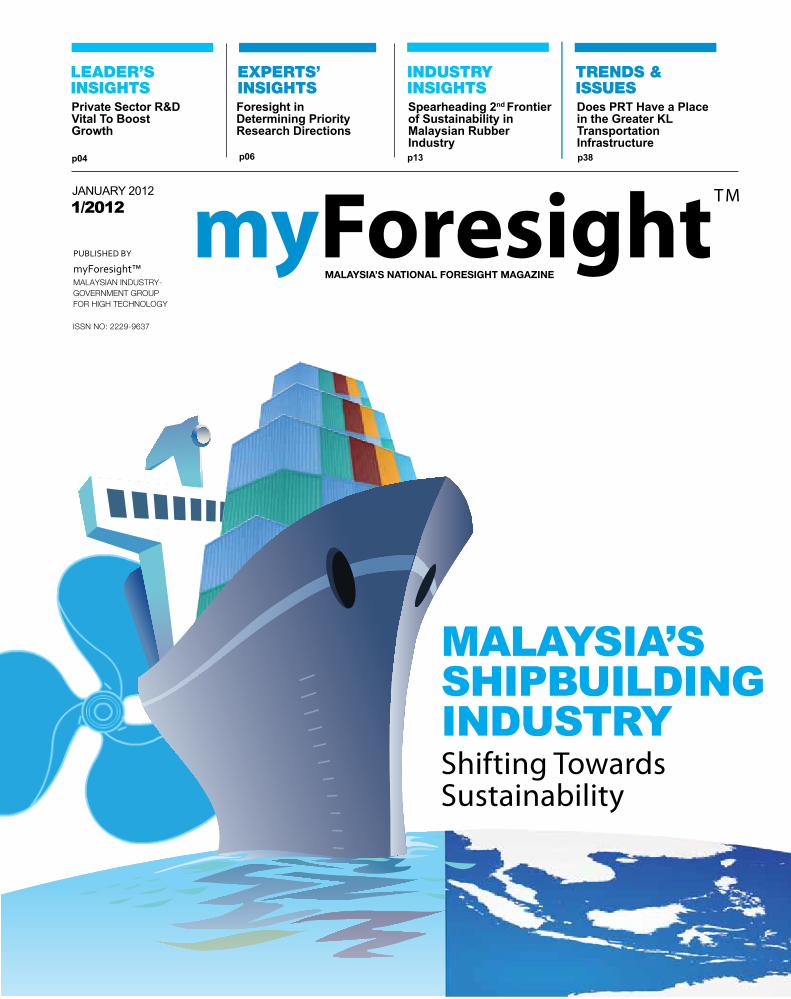
MIGHT is working closely with ministries and in-dustry players to ensure that the offset programmes are developed and structured to address issues related to the development of strategic industry in the country, leveraging major acquisitions by the government and government-linked companies.
These efforts respond to the prime minister’s call to create more revenue-based projects, and for the private sector to lead in creating wealth for Malaysia.
An innovative approach championed by MIGHT to encourage private sector R&D is the recent founding of the Aerospace Manufacturing In-novation Centre (AMIC). Jointly funded by the government and industry, the centre’s participants include the European Aeronautic Defence and Space Company, Rolls-Royce and Composite Technology Research Malaysia.
A significant feature of AMIC is that the R&D, conducted by a university consortium, will en-courage local industry to participate and base its research pursuits on industry needs.
AMIC will also train local talent with courses at Master’s and PhD levels in the field of aerospace technology.
The AMIC R&D centre of excellence is modelled on the Advanced Manufacturing Research
Centre (AMRC) in Sheffield, United Kingdom. It is founded on the shared scientific excellence, expertise and technological innovation of the world’s leading aerospace companies, and world-class research within the University of Sheffield’s Faculty of Engineering.
It develops innovative and advanced technology solutions for materials forming, metal working and castings.
It also has internationally acknowledged research in the field of composite materials, an area crucial to the development of Boeing’s next generation aircraft.
Achieving the right balance between the public sector and private industry is a complicated economic endeavour for a country like Malaysia — a small country with relatively limited resources. But neither the private sector’s invisible hand nor governmental heavy-handedness can be the solution.
It is true that the private sector cannot spur an innovation agenda without the government, but it is equally true that the government cannot replace private-sector market forces. It is imperative that the public and private sectors work together well.
Launching of Aerospace Malaysia Innovation Centre (AMIC) By YAB Dato’ Sri Mohd Najib Tun Abdul Razak on 6th December 2011 during LIMA 2011.
leader's insights
5
January 2012

SUMMARY The article presents methodology of forecasting research directions crucial for the development of the competitiveness and innovativeness of the Polish enterprises and technological institutes. The application of the methodology is presented on the basis of environmental technologies, one of the key areas of technical support for the economy’s sustainable development. With the use of the developed methodology, future research directions have been identified together with key incremental and emerging technologies within them, for whom technology characteristics cards have been created. Following that, R&D directions have been roadmapped and scenarios of technological and educational (qualifications and competences) development have been designed.
The priority research directions identified in the scenarios, and the incremental and emerging technologies within them, should be the core theme for the realisation of research projects, such as national strategic programmes, for instance. The proof of the successful implementation of the methodology developed, is “Innovative Systems of Technical Support for Sustainable Development of the Economy” strategic project launched in the thematic area generated with the use of the methodology designed, co-financed from the European structural funds, prepared and co-ordinated by the Institute represented by the author of the paper.
APPLICATION OF FORESIGHT Methods for the Determination of Priority Research Directions of the Future
InTRODUcTIOn Innovativeness and competitiveness of advanced product and process technologies are the deciding factors in the selection of development directions and the development pace of a contemporary
BYBEATA POTERALSKAInstitute for Sustainable Technologies – National Research Institute, ul. K. Pulaskiego 6/10, 26-600 [email protected]
knowledge-based economy. The actions taken to design and implement environmental solutions are one of the key areas of technical support for the sustainable economic development. As far as this particular area is concerned, the design of future short- and long term environmental
solutions including, among others, the elimination of inefficient, energy consuming and high-waste industrial technologies as well as the limit on raw materials and resources wasteful management is really necessary.
experts' insights
6
January 2012

Introduction of the EU and national regulations and documents stimulating the development of environmental technologies and the inclusion of ecological priorities in strategic research programmes confirm the importance of research activities for the development of ecological solutions. An example of the document of the key importance are the directives of the European Union directed at the creation of system requirements for the development of eco-friendly technological processes and the undertaking of activities minimising and managing the amount of waste created through pure ecological utilisation, for instance. Strategic research directions are identified in governmental documents and long term plans for the organisation of the scope of activity of the European and national technology platforms. The problem of environmental technologies ranks high on the priority list of national and international research programmes as well.
DETERMInIng PRIORITY RESEARcH DIREcTIOnS AnD KEY TEcHnOLOgIESIn order to use the existing resources effectively and improve the level of competitiveness of national economy, it is necessary to indicate strategic research directions that would comply with the European and national priorities and take the existing scientific and infrastructure potential in the undertaken thematic area into consideration.
To determine priority future research directions, the methodology of their identification in the areas of strategic importance was designed.1
The article presents procedures for conducting research and the effects of the application of the designed methodology in relation to the area of environmental technologies.2
It was assumed that priority research directions would be determined with consideration of the existing scientific and technological potential and its growth forecast for the next 5-10 years, which is the time brackets for the realisation of generated research tasks and directions.
Both the micro scale – understood as the generation of research directions realised at scientific institutions, and the macro scale – understood as the consideration of research directions strategic for the country’s development and inspired by the results of sectoral foresights, and the consideration of the strategic documents and directives of the European Union were applied.
It was assumed that the determined research directions should comply with the following criteria:
a. The application potential of research results and their implementation in the process of innovative technologies development on the 5-15 year horizon;
b. The interdisciplinarity of solutions and their potential influence on economy’s sustainable development;
c. The scientific and technological level of solutions complying with the highest global standards.
The analyses of research projects realised at R&D institutions dealing with the subject matter of environmental technologies were the starting point for conducted research. They were the basis for the formulation of general, leading research directions realised by scientific institutes.
Among the key mechanisms of generating future research directions were the analysis of the state-of-the-art and the expert analyses.
The convergence of identified research directions with directions of research conducted by national and international R&D institutes played an important role. For this purpose the analyses of the state-of-the-art were conducted on the basis of the following:
a. Strategic Documents For The Creation Of Country’s Industrial Policy And Eu Documents;
b. Subject And Results Of National And International Foresight Project;
c. Selected Publications (I.E. In Journals By Elsevier And Springer);
d. Conference Materials From Selected Significant International And National Conferences;
e. Reports On The Research Activity Of Leading Technological Institutes And Catalogues Of Innovative Products In The Area Of Environmental Technologies;
f. Patent Databases.
The analysis of the state-of-the-art was done in the iterative system and formed the basis for the identification of priority research directions, within which the literature analysis of the current state-of-the-art allowing to determine the most important, and previously not incorporated research directions was conducted. The verification of the priority research
directions was thus possible. The description of the state-of-the-art included both the cognitive performance of Polish, European or international scientific institutions leading in a given domain and the technological achievements resulting in innovations complying with worldwide standards and ready to be commercially deployed. The results obtained embrace general research directions on the national and global level and integrated groups of these directions in a selected area of strategic importance comprising environmental technologies.
The aim of the expert analyses was to support the analysis of the state-of-the-art. External experts representing the science, industry and public administration sectors, who had not participated in the initial identification of future research directions, assessed the priority research directions in the scale of the country and the sector. The consideration of the experts’ remarks enabled the modification and extension of the proposed research directions, and in consequence the selection of new future research directions.
Within realised tasks, future research directions for the strategic research institute – Institute for Sustainable Technologies – National Research Institute (ITeE-PIB) in Radom, Poland were determined and on that basis, leading research directions were generated for the sector conducting environmental research with the attention paid to the needs of the country and incorporating integrated leading directions of research conducted in that domain globally.
The analysis of the key development trends and the research results in the domain of industrial technologies influencing the improvement of the environment condition enabled the identification of priority research areas that would allow for the development of innovative technological solutions with high implementation potential. In a presented thematic area, the priority directions of environmental technologies include:
a. technologies of producing maintenance materials with increased maintenance values,
b. technologies for the rationalisation of the use of raw materials and resources,
1Tasks realised within the framework of the sectoral foresight project
“Advanced Industrial and Ecological Technologies for the Sustainable
Development of Poland” in the 2008-2010 period, coordinated by the
institute represented by the author of this paper.2 Within the framework of the foresight project, the designed methodology
has been applied in the process of the identification of the future research
directions in such thematic areas, besides environmental technologies, as
material technologies and nanotechnologies; machatronic technologies
and control systems; specialised test and research apparatus; and
technologies of technical and environmental safety.
experts' insights
7
January 2012

technologies was created5. Within that database it is possible to modify and add information about the technologies.
DEvELOPMEnT ScEnARIO BUILDIngLists of priority research directions of the future and incremental and emerging technologies in priority directions within environmental technologies were the basis for the creation of scenarios of technological development.
In an original methodology developed, it was assumed that the first stage of works conducted would include the creation of scenarios with the application of the analysis of the results of the influence of key factors identified for a given thematic area on technologies and research directions selected in this area.
Within the domain of environmental technologies, the following key factors were identified after consultations with external experts:
• The research and technological potential (laboratory base, technical infrastructure – r&d institutions and innovative enterprises);
• The levels of innovativeness and implementation readiness of research results;
• The dynamics and effectiveness of industrial deployment of obtained solutions;
• The national R&D priorities.
Following that, the impact the key factors have on individual technologies and groups of technologies in the area of environmental technologies was analysed. The experts evaluated two elements:6
• The influence of one of the three identified key factor development tendencies (increasing, decreasing, constant) on the development of individual technologies and groups of technologies;
• The probability of the occurrence of a given tendency.
The development scenarios in the field of environmental technologies were then built on the
Fig. 1. Procedure of the realisation of works concerning the development of technology characteristics. Source: Author
c. technologies of waste recycling and utilisation,
d. low-waste technologies of manufacturing and regenerating machines and devices,
e. pro-ecological technologies of producing energy,
f. logistics systems for waste and energy management.
Detailed key research directions were identified in aforementioned priority areas.
The next stage of the undertaken research concerned the generation of lists of priority technologies and the design of characteristics of identified technologies. Works focused on the development of priority technologies and the creation of forms for the design of characteristics were conducted simultaneously by the internal experts – representatives of the project coordinator and the external experts. The outline of realised activities is presented in (Fig. 1).
Generated priority technologies were then assigned to two groups: incremental and emerging technologies. The first of them influences a short and long term subject area of R&D activity in Poland and it concerns the 5-year planning period, whereas the latter enables the development of guidelines for a long term strategy of R&D institutes research activity, and it deals with the 10-15-year prognosis. Incremental technologies3 are technologies directed at a gradual improvement of existing solutions
3A. Mazurkiewicz, Mechanisms of knowledge transformation in the area
of advanced technologies of surface engineering. Proceedings of the
15th IFHTSE & SMT 20 International Federation for Heat Treatment and
Surface Engineering Congress, Vienna 2006, pp. 270–277.4O. D. Soares, oth., Innovation and technology: Strategies and policies,
Kluwer Academic Publishers, Dordrecht 19975http://www.foresight.itee.radom.pl/chartech/index.php6G. Gierszewska, M. Romanowska, Analiza strategiczna przedsiębiorstwa,
PWE Warsaw 2009, pp. 199-212
through the systematic implementation of product and process innovations. Emerging technologies4, on the other hand, are technologies characterised by a dynamic development in a given area of knowledge and research practice, that facilitates increased competitiveness level.
The initial technologies proposal was elaborated by field experts that participated in the project, and was then consulted with external experts specialising in the domain of environmental technologies.
Simultaneously to works concerning the identification of priority technologies, internal experts in the field of methodology participated in tasks concerning the design of technology characteristics forms, which were consulted with external experts experienced in the realisation of foresight projects. Due to their specificity, separate forms for emerging and incremental technologies were created.
The characteristics include such elements as: the phase of technological development, the objective of the application of technologies, the description of technological process, areas of current and potential applications, capital and employment requirements and potential effects of the implementation of technologies (i.e. ecological, economic, social).
Technology characteristics cards were then created in the form of an on-line questionnaire filled in with data necessary for the identification of characteristics of individual technologies. As a result, an on-line database of incremental and emerging
INTERNAL EXPERTS
DATABASE
SUBSTAnTIAL WORK cOnSULTATIOnS
METHODOLOgIcAL WORK
EXTERNAL EXPERTS
List of Incremental Technologies
Set of Incremental and Emerging Technologies
Design of Technology Characteristics Forms
Incremental Technologies Characteristics Form
(Supplement, modification, suggestions, etc. )
List of Emerging Technologies Emerging Technologies
Characteristics Form
experts' insights
8
January 2012

Dynamic Development Scenario• Increasing tendency
of factors• High probability
of the occurrence of that tendency
Stabilisation Scenario• Constant tendency
of factors at the high probability of the occurrence of this tendency
• Increasing and decreasing tendencies of factors at the low probability of the occurrence of these tendencies
Decline scenario• Decreasing
tendency of factors• High probability
of the occurrence of this tendency
Fig. 2. Types of scenarios of technological development – key factors’ development tendencies and the probability of the occurrence of this tendencies taken into account. Source: Author
Fig. 3. Outline of technologies prioritisationSource: Author
Fig. 4. Outline of technology readiness assessment Source: Author
basis of the results of expert analyses. The creation of three scenarios: dynamic development scenario, stabilisation scenario and decline scenario (Fig. 2) was proposed with consideration of development tendencies of individual factors and the probability of the occurrence of these tendencies.
It was assumed that at the next stage of scenario building, the ranking of priority technologies and the results of technology implementation readiness assessment would be used. The list of priority technologies assessed according to the following criteria: sustainable development (embracing the sub-criteria of ecological, economic and social effects) and the critical nature of technologies including the level of the interdisciplinarity of the solutions were applied.7 (Fig. 3)
Technologies with ascribed level of priority were then compared with the results of the assessment of technological readiness of detailed research directions, within which incremental and emerging technologies had been identified (Fig. 4). Technological readiness level concerned the possibility of undertaking or continuing the activity in the selected research direction, which should result in a design of advanced incremental and emerging technologies. It was assumed that technologies at the commercialisation and diffusion level, crucial for the development of competitiveness, and the incremental technological progress, together with the generic technologies of basic importance for the creation of technological competitiveness guaranteeing technological progress were the technologies of high technological readiness.
In order to simultaneously consider the level of priority and technological readiness of priority technologies, a matrix, was designed which hypothetically allowed to identify the following lists of technologies:
• High-priority technologies with a high level of technological readiness,
• High-priority technologies with a low level of technological readiness,
• Low-priority technologies with a high level of technological readiness,
• Low-priority technologies with a low level of technological readiness.
The matrix for the area of environmental technologies is presented in (Fig. 5). The individual quarters of the matrix hold the technologies
EXPERTPANELS
Technologies Prioritisation
Criterion: SustainableDevelopment
Economic Effects
List of Incremental Technologies
List of Emerging Technologies
Interdisciplinarity Level of Technology
Ecological Effects
Social Effects
Criterion: Critical Nature of Technology
List of Priority Technologies
EXPERTPANELS
Assessment of technological
readiness of particular
research directions for commercial application
Assessment of Technological
Readiness
List of Technologies with High Level of Technological
Readiness
7Mazurkiewicz A., Sacio-Szymańska B., Poteralska B. Symela K.: „Mapy
technologii w obszarze zrównoważonego rozwoju” report from the
realisation of the „Advanced Industrial and Ecological Technologies for
the Sustainable Development of Poland”, Radom 2010.
experts' insights
9
January 2012

8Mazurkiewicz A., Poteralska B., Sacio-Szymańska A., Łabędzka J.
Zintegrowane scenariusze rozwoju technologicznego. In: Mazurkiewicz
A., Poteralska B. (red.) Zaawansowane technologie przemysłowe i
ekologiczne dla zrównoważonego rozwoju kraju. Wybrane zagadnienia.
Instytut Technologii Eksploatacji – Państwowy Instytut Badawczy, Radom
2011.
(research directions) complying with the priority and technological readiness levels.
Within the framework of this stage of the research in the domain of environmental technologies, the following results were confronted:
• list of technologies of high priority and high level of technological readiness and technologies and research directions identified in the dynamic development scenario built with the consideration of development tendencies of key factors together with the probability of the occurrence of these tendencies;
• list of technologies of low priority with high level of technological readiness and technologies and research directions identified in the stabilisation scenario built with the consideration of development tendencies of key factors together with the probability of the occurrence of these tendencies
The results obtained, formed the basis for the creation of technological progress scenarios identifying priority research directions and technologies, for which there are great development possibilities in Poland and whose development is determined by the changes of tendencies of key factors influencing the dynamics of the R&D work in the area of environmental technologies. At the time of their building, it was assumed that scenarios should take into consideration the research directions and within their framework the technologies whose development and implementation would result in a higher technological level and the growth in competitiveness of businesses in which innovative environmental solutions are applied. Additionally, the identification and forecasting of needs concerning knowledge, skills and competences necessary for the creation and application of new technologies, as well as the development of recommendations for future occupations, qualifications and modular system solutions are also of great importance, as they result in an effective organisation and realisation of educational processes and the retraining of personnel to meet the requirements of advanced industrial technologies.
On the basis of the confrontation of technologies assessed according to the priority and technological readiness criteria with technologies and research directions indicated by the scenarios considering the development tendencies of key factors and the probability of the occurrence of these tendencies in the area of environmental technologies, the dynamic development and the stabilisation scenario were built8 .
Dynamic Development Scenario For Environmental Technologies The research carried out in the domain of environmental technologies is mainly determined by the research directions in other scientific areas, including: material technologies, nanotechnologies, mechatronic technologies, test and research apparatus and technical and environmental safety technologies, as well as the necessity to comply with legal regulations concerning environmental protection.
Environmental technologies are characterised by a high level of interdisciplinarity, technical advancement and flexibility as well as high complexity and multiscale. Emerging technologies that are currently being developed in this scientific domain are innovations creating the possibility to rank high on competitiveness. The examples of such technologies include: technologies of biomass liquidation and gasification, production of energy from waste, recycling of resources and materials and technologies of co-combustion of scrap biomass with conventional fuels. The development of highly effective technologies of gaining energy from reusable sources is characterised by its growing importance among emerging environmental technologies.
As far as environmental technologies are concerned, the ratio of costs to immediate financial benefits is higher when taking short term perspective into consideration. This apparent dominance of costs over the effects mainly stems from the public’s habit to concentrate on short term objectives, lack of consideration towards greater time scale
of sustainable development and the difficulty to estimate ecological advantages the implementation of these technologies would bring. In many cases, this attitude leads to growing ignorance and sometimes even the lack of society’s approval towards spending public funds on the development and implementation of these technologies. Usually that happens in the case of technologies whose development and implementation result from the necessity to adjust national economy to international requirements and legislation concerning protection of the environment and the climate. The development of advanced environmental technologies has one extremely crucial effect, though – it leads to the rationalisation of the use of raw materials and resources, which is the requisite of a permanent sustainable development of the economy.
Stabilisation Scenario For Environmental TechnologiesThe development of environmental technologies is characterised by low dynamics and the continuation of research activity in existing directions leading to the improvement of already known solutions. The technologies analysed are of average priority for sustainable development and have either high or average level of technological readiness. Many solutions are designed and implemented to meet the norms and standards concerning environmental protection and their character is rather temporary
Fig. 5. Juxtaposition of priority level and technological readiness of selected technologies (T1I, T2I… - incremental technologies; T1E, T2E, …- emerging technologies) Source: Author
Stabilisation Scenario-High Priority Technologies
Dynamic Development Scenario
Decline ScenarioStabilisation scenario - technologies with high level of technological readiness
Proecological Technologies
T4E
T3E
T2ET141
T4I
T10I
T11PT21
T13I
T21
T3IT12I
T9I
T1I
T5I
T7IT6I
T8I
T1E
PRIO
RITY LEVEL
TECHNOLOGICAL READINESS LEVEL
100
90
80
70
60
50
40
30
20
10
00 1 2 3 4 5 6 7 8 9 10
experts' insights
10
January 2012
and incidental. Long term ecological actions for the protection of the environment for future generations are of secondary importance and the emphasis is put on the development of technologies that enable the removal and repair of already existing environmental damage.
The most intensive is the development of incremental solutions directed at the improvement of existing solutions exercised through the gradual implementation of novel ideas based on new knowledge. Incremental research concerns the advancement of current technologies or their implementation in new application areas. Technologies developed include technologies for the rationalisation of the use of materials and resources, with greatest attention paid to waste recycling and utilisation technologies, technologies of textile and thermoplastic polymer composites recycling, technical systems for the support of environmental maintenance of operating fluids, application of membrane systems in recycling and utilisation technologies for aqueous operating fluids and sewage, technologies of production and regeneration of elements of machines and devices with the application of polymer nanocomposites. Besides, technologies of co-combustion of flammable waste with conventional fuels and methods of stabilisation and improvement of operational properties of biofuels. This is accompanied by the development of logistics systems for waste and energy management including: systems for on-line measurement of volatile and solid products of combustion and devices for their realisation. Parallel is the development of production technologies for maintenance materials with increased ecological qualities, among which there are specialised ecological operating fluids on the basis of non-toxic, biodegradable natural and synthetic components.
Qualifications and Competences Development Scenarios Environmental technologies, rationalisation of the use of raw materials and resources and reusable energy sources are an important element of knowledge transfer to education, which facilitates country’s sustainable development. Constant progress characterises the process of gaining knowledge, skills and competences in the domain of environmental technologies. Technical faculties should offer complex, interdisciplinary vocational training mingled with knowledge of specialised innovative environmental technologies, as well as knowledge of the environment itself and its protection complying with the principles of sustainable development.
Specialised and interdisciplinary knowledge together with the latest knowledge of chemistry,
physics, material engineering, ecology, biotechnology and nanotechnology for instance, are needed for the development of environmental technologies. The existing educational system focuses on formal education, which results in the lack of legal and institutional regulations and procedures that would acknowledge the process of informal and non-formal education of the employee within or outside their work place. Promotion of continuing environmental education needs to be accompanied by its development consisting of the creation and reorganisation of the continuing education centres offering educational programmes suitable for the needs and capabilities of various specialists. Moreover, it is important to extend the educational field of activity of technology transfer offices (i.e. technology parks, technology transfer offices, entrepreneurship incubators) and incorporate into their curricula professional training courses for the needs of development and implementation of innovative technologies.
IMPLEMEnTATIOn OF THE ScEnARIOS In THE FORM OF STRATEgIc PROgRAMMES The priority research directions and incremental and emerging technologies identified in the scenarios form the scope for future thematic areas that should be considered for realisation within the framework of research projects, especially in the form of national strategic programmes. It is assumed, that there will be two kinds of research projects conducted in the future: highly specialist programmes limited to the selected thematic area, characterised by a very high level of minuteness of details and a close participation of scientific organisations specialising in that particular field, and interdisciplinary programmes covering vast thematic areas penetrating one another. The success of research and scientific institutions will depend on their participation in both of those types of projects as well as on the development and implementation of effective procedures of research results transfer and industrial deployment in the form of advanced process and product technologies.
Selected priority research directions and technologies have been included in the “Innovative Systems for the Technical Support of Sustainable Development of Economy” approved for realisation in the 2010-1014 period within European Structural Funds co-financing the Innovative Economy Operational Programme, within which the research realised focuses on incremental technologies development in a short (3-5 years) run. The technologies considered for realisation within this programme are the incremental technologies identified in the stabilisation scenario.
Proposed detailed research directions in the strategic programme “Innovative Systems for the Technical Support of the Development of Economy” correspond with the directions identified as priority directions in the sectoral foresight project. Some examples of the correlation of research directions is presented in (Tab. 1). The thematic area of environmental technologies ranks high on importance within the framework of the strategic research programme. The growing importance of this particular thematic area within the strategic programme is also confirmed by the increasing role of the aspects of energy saving and new, ecological sources of its acquisition and the question of environment protection and technical safety to maintain economic growth according to the principles of sustainable development, which has been emphasised in the new development strategy of the European Union – “Europe 2020.”
Furthermore, as a result of conducted research, a thematic scope for the strategic programme “Advanced Technologies of the Future for Sustainable Development” encompassing the subjects directed at the development of research in priority directions in the long (10-15 years) run was identified. Within the framework of the programme, emerging technologies, indicated in the scenario of the dynamic development within the sectoral foresight project, will be mainly considered.
It has been assumed that the proposed structure of the strategic programme will only encompass those thematic areas which are of key importance from the perspective of the current strategic documents of the European Union, including “Europe 2020” Strategy, complying with the priorities concerning the support for power engineering industry, technical and environmental protection and safety. Among the thematic areas proposed in the strategic9 programme, there are groups particularly connected with ecology: innovative energy systems and the rationalisation of the usage of resources; environmental protection and technical safety technologies.
cOncLUSIOnSDue to great significance of the effective development and implementation of environmental technologies, as well as the necessity to create technological solutions in this area, there is a need for the identification of priority research areas and their correlation in accordance to the research potential of the entire country, region and the strategic research institute. For that, methodology of identifying and selecting priority research
9EUROPE 2020. A European strategy for smart, sustainable and inclusive
growth, Communication from the Commission, Brussels, 3.3.2010,
KOM(2010).
experts' insights
11
January 2012

directions has been designed. Its application is an effective tool enabling the generation of future research directions with the consideration of their development and implementation capability, for instance through strategic research programmes realised within European and national funds. An example of the strategic programme whose subject matter has been generated with the use of the methodology developed, is the “Innovative Systems of Technical Support for Sustainable Development of Economy” project coordinated by the Institute for Sustainable Technologies-National Research Institute in Radom, Poland, co-financed by the European Structural Funds.
On the basis of the state-of-the-art and expert analyses, selected research directions and technologies should be continuously updated to incorporate latest trends in technological development, and then introduced for realisation in scientific organisations. The computer system, which is planned to assist the forecasting of research directions crucial for the development of competitiveness and innovativeness of Polish enterprises and technological institutes, will support this area of research activity. The adaptation of technological foresight methods for the application in research institutions in order to identify the probable development tendencies of research directions and technologies was the
underlying assumption in the creation of the computer system. Moreover, it has been assumed that the computer system will enable the integration of qualitative, semi-quantitative and quantitative methods with expert knowledge.
The computer system will be equipped with a medium- and long-term forecasting module that will allow for the automation of the process of generating multidimensional spheres of key change factors, ranking technologies according to their innovativeness and competitiveness, and identifying the sets of the most probable hypotheses. The expertise of both internal and external experts will be fed into the computer system.
The designed system will comprise a useful tool for the support of generation of future research directions and technologies and the creation of scenarios of their development. It will assist in the creation and implementation of strategies for a research organisation in the area of generating the directions of the research both in the short and the long term. It will also assist in the planned and realised development of its infrastructure according to the priority research areas selected for the institution.
REFERENCES
Albright R., Nelson B. Product and Technology Mapping Tools for Planning and Portfolio Decision Making. In: Belliveau P., Griffin A., Somermeyer S. (eds.). John Wiley & Sons, Inc. 2004.
EUROPE 2020. A European strategy for smart, sustainable and inclusive growth, Communication from the Commission, Brussels, 3.3.2010, KOM(2010).
Foresight Methodologies, Technology Foresight Initiative, Training Module 2, UNIDO, Vienna, Austria, 2004
Gierszewska G., Romanowska M., Analiza strategiczna przedsiębiorstwa, PWE Warsaw 2009.
Mazurkiewicz A., Mechanisms of knowledge transformation in the area of advanced technologies of surface engineering. Proceedings of the 15th IFHTSE & SMT 20 International Federation for Heat Treatment and Surface Engineering Congress, Vienna 2006.
Mazurkiewicz A., Poteralska B., Sacio-Szymańska A., Łabędzka J. Zintegrowane scenariusze rozwoju technologicznego. In: Mazurkiewicz A., Poteralska B. (ed.) Zaawansowane technologie przemysłowe i ekologiczne dla zrównoważonego rozwoju kraju. Wybrane zagadnienia. Instytut Technologii Eksploatacji – Państwowy Instytut Badawczy, Radom 2011.
Mazurkiewicz A., Poteralska B., Technological innovations supporting sustainable development of the economy. Selected problems., w: Memorias de 15 Convencion Scientifica de Ingenieria y Arquitectura, Ministerio de Educacion Superior, 2010, ISBN: 978-959-261-317-1, Cuba
Mazurkiewicz A., Sacio-Szymańska B., Poteralska B. Symela K.: „Mapy technologii w obszarze zrównoważonego rozwoju” report from the realisation of the „Advanced Industrial and Ecological Technologies for the Sustainable Development of Poland”, Radom 2010.
Phaal R., Farrukh C. J. P., Probert D. R., Fast-start technology roadmapping, Management of Technology, the Key to Prosperity in the Third Millennium, Proceedings of the IAMOT 9th International Conference, Pergamon, 2000.
Soares O. D., oth., Innovation and technology: Strategies and policies, Kluwer Academic Publishers, Dordrecht 1997.
Tab.1. Examples of the correlation of the scope of the research activity of the sectoral foresight project and the strategic programme in the area of environmental technologies Source: Author
SECTORAL FORESIGHT PROJECT “ADVANCED INDUSTRIAL AND
ECOLOGICAL TECHNOLOGIES FOR THE SUSTAINABLE DEVELOPMENT OF
POLAND”
STRATEGIC PROGRAMME “INNOVATIVE SYSTEMS FOR THE TECHNICAL SUPPORT
OF THE DEVELOPMENT OF ECONOMY”
Research Direction
Research Direction
Technology Group
Technology Group
Production technologies of maintenance materials with higher ecological value
• Production technologies of specialised, ecological operating fluids based on natural and synthetic components
• Methods of the utilisation of waste fluids from the processes of surface treatment and material removal processes in metals
• Application of membrane systems for aqueous technological fluids recycling and utilisation,
• Technical systems for the support of environmental maintenance of technological fluids
Development of ecological technologies of production, maintenance, recycling and utilisation of operating materials
• Ecological operating fluids based on natural and synthetic components
Technologies of the rationalisation of the use of raw materials and resources
Technologies of waste recycling and utilization
Systems and methods of scrap operating materials management
Application of biotechnological processes in industrial waste management
• Technologies of recycling of textile and polymer composite waste
• Catalytic fillings for bioreactors for technologies of industrial sewage purification
• Methods of the utilisation of waste fluids from the processes of surface treatment and material removal processes in metals
• Membrane processes in maintenance, recycling and utilisation of operating fluids
Development of methods and technical systems increasing environmental safety
Development of ecological technologies of production, maintenance, recycling and utilisation of operating materials
• Technologies for the recycling of textile and thermoplastic polymer composites
• Biotechnological means of industrial waste purification
experts' insights
12
January 2012

SPEARHEADING SECOND FRONTIER
BYDATUK DR. SALMIAH AHMADDirector General,Malaysian Rubber [email protected]
of Sustainability in Malaysian Rubber Industry
industry insights
13
January 2012

SUSTAInABILITYBrundtland Commission in 19871 defined sustainability as the development seeking to meet the need of the present generation without compromising the ability of future generations to meet their own needs or development that achieve a balance, interdependent and mutually reinforcing economic, social and environmental aspects. In the commodities fraternity sustainability is normally discussed in terms of the effect of an industry to the profit, people and planet (3P). (Diagram 1)
The natural rubber (NR) industry in Malaysia started after the seeds brought by Sir Wickham from the South America were planted in Kuala Kangsar in the 1880’s and started the first commercial planting of rubber in Malaysia. (Diagram 2)
After more than a century, the industry has evolved from being an important component in the agricultural sector to an element to be reckoned with in the manufacturing sector. The diversification strategy implemented under three Industrial Master Plans (IMPs) had stimulated the expansion and the industry evolved from a relatively small and unknown entity to become a reputable major world rubber trader. (Diagram 3)
The introduction of Standard Malaysian Gloves and green material for tyres has placed Malaysian NR gloves superior to the other producers in terms of quality and competitiveness. Currently there is a capacity to produce about 1.5 million tonnes of processed NR and products derived from NR. Majority of the semi-finished or finished rubber products produced are exported to China, EU and USA. When the rubber prices fell in the late nineties, the glory of the rubber industry was quickly forgotten and replaced with the oil palm industry.
Strong demand and good product performance revitalized the industry. In fact, in 2010, the industry as a whole contributed about RM34.00 billion in export revenue, increased by more than three times than that of RM10.6 billion in 1990. (Diagram 4)
The socio-economic importance of the rubber industry cannot be denied as it sustains the livelihood of about 400,000 smallholder families throughout Malaysia. Currently the area covered by rubber in the country is approximated to be about 1.02 million hectares
and 95% of the area is owned by smallholders, with average productivity of about 1.5tonne rubber/ha/yr. The other 5% is owned by estate with a slightly higher productivity of 1.6tonne rubber/ha/yr . (Diagram 5)
Assuming an average holding of 2.3hectares, rubber smallholders in Malaysia can now earn more than RM2,500 per month. (Diagram 6)
The potential negative effect of the country’s involvement in the rubber industry to the environment is controlled via the introduction of appropriate regulatory measures in place by the year 1979
Technologies for effluent treatment, air pollution and sludge treatment and disposal were established by Malaysian Rubber Board and implemented by the industry. These were found to be sufficient to minimize the possible negative impact of the industry to the environment. Thus to date, after more than 130 years of involvement, no serious detrimental effect on the environment has been detected.
nATIOnAL KEY EcOnOMIc AcTIvITIES (nKEA)Under the 10th Malaysian Plan, the government has outlined various new approaches in order to transform this country to become a high income and high productivity economy, in line with the New Economic Model. The inclusion of the rubber industry in the 12 sectors under the National
The first commercial rubber plantation in Malaya (The rubber industry began in Malaysia in 1880s)
Diagram 1 Diagram 2
400,000Sustained by small holders families
DIVERSIFICATION IN RUBBER INDUSTRY
Note : * Rest of the World
Total Capacity1,500,000 tonne
Diagram 3
Area 1.02 mil ha
Production
Cuplump
Latex
Latex Latex BG
Export
Compounded Rubber
Dry Rubber Goods
SMR
Latex
Dry Rubber
Imports Export
Export
Gloves80%
Others20%
ROW*
ROW*
China
China
industry insights
14
January 2012

Felda Settlers holding size 4ha,Independent Smallholders holding size 2.3 ha,Productivity 1,500 kg/ha
2010 Income
(RM) SMR 20(sen/kg)
Jan 2,504.90 994.38 Feb 2,538.43 1,010.13 Mac 2,608.41 1,038.00
Apr 2,646.32 1,045.55 May 2,263.49 919.60 Jun 2,330.17 932.45 Jul 2,316.69 915.00
Ogos 2,373.11 955.40 Sep 2,542.38 1,033.84 Oct 2,892.70 1,155.45 Nov 3,194.11 1,283.55 Dec 3,725.00 1,415.69
0
500
NET INCOME NET INCOME
Income of FELDA settlers planting rubber )
1000
1500
2000
2500
3000
3500
4000
1990
1991
1992
1993
1994
1995
1996
1997
1998
1999
2000
2001
2002
2003
2004
2005
2006
2007
2008
2009
2010
Income of FELDA settlers planting rubber )MALAYSIA’S TOTAL TRADE OF RUBBER PRODUCTS (1986-2009)
2,810
10,588
13,413
0
2,000
4,000
6,000
8,000
10,000
12,000
14,000
16,000
1986
1987
1988
1989
1990
1991
1992
1993
1994
1995
1996
1997
1998
1999
2000
2001
2002
2003
2004
2005
2006
2007
2008
2009
RM Million
Total Trade
ImportsExports
IMP1
517.0
134.2382.8
4,500.5
3,867.0633.5
10,025.7
8,031.0
1,994.7
IMP2 IMP3
Source : Department of Statistics, MalaysiaPERFORMANCE
Key Economic Area (NKEA) indicates that this industry is recognised as one of the important contributors in the economic transformation of Malaysia. (Diagram 7)
Four Entry Point Projects (EPPs) have been identified to be implemented and anticipated to contribute about RM52.9billion to the Gross National Income (GNI) by 2020, compared to RM20 billion in 2010. The four EPP are:-
1. Maintaining the rubber tappable area of one million hectares through replanting and new planting
2. Increasing yield performance from the current 1.5tonne rubber/ha/yr to 2tonne rubber/ha/yr by the year 2020.Malaysian NR production needs to be increased to 2.0 million by the 2020 to fulfill domestic demands. These targets could be reached through the replanting of 40,000 hectares of old and low yielding clones with new and high yielding clones to enhance productivity. In addition, 30,000 hectares of new areas will be planted with rubber annu-ally for the next five years particularly in East Malaysia.
3. Accelerating the growth of existing downstream activities.Domestic demand for NR is expected to raise in tandem with increasing global demand for Malaysian rubber products particularly rubber gloves. It is estimated that NR consumption in this country will reach 0.65 million tonnes in 2015 and 1.0 million tonnes
2009 (current) Upstream Developments
Growth of Existing Downstream Products
Introduction of New Downstream Products
Baseline Growth
2020 GNI
18.5
6.35
20.75 1.3
6.0 52.9
RM 34.4 Billion
2000 � 2001 � 2002 � 2003 � 2004 2005 � 2006 � 2007 � 2008 � 2009 � 20101,000
1,100
1,200
1,300
1,400
1,500
1,600
1,700
1,289
1,358 1,3611,344
1,372 1,381
1,525 1,520
1,6001,620 1,630
1,2261,211
1,2371,280
1,300
1,320
1,3701,420 1,430
1,450
1,500
1,184 1,167 1,211 1,270 1,296 1,320 1,358 1,414 1,420 1,440 1,500
Estate Smallholder Average
Kg/
Ha/
Year
The production increase despite decrease in hectarage: Productivity increase
Financial Services
Wholesale & Retail
Tourism
Oil, Gas & Energy
Education
Electrical & Electronics
Healthcare
Palm Oil
Comms ContentInfrastructure
Agriculture
Business Services
Greater KL
by Implementing 4 EPPs
RUBBER
Diagram 5
Diagram 7
Diagram 4 Diagram 6
industry insights
15
January 2012

in 2020. Malaysia NR consumption is driven by glove manufacturing sector where Malaysia controls major world market share in terms of trade. This project aims to increase market dominance to 65% from the current 63%.
4. Introduction of new downstream rubber products (such as Ekoprena and Pureprena).Malaysia needs to create differentiation in order to remain competitive. This project aims to spearhead the commercial production of niche rubber materials, EKOPRENA and PUREPRENA for the production of green products
The production capacities of these materials are anticipated to be 300,000 tonnes by the year 2020.
LIFE cYcLE IMPAcT ASSESSMEnT (LcIA)Life Cycle Impact Assessment is a tool that can be used to evaluate the impact of a product from its inception to its end-use life – cradle to grave. It is an environmental management method for the quantitative evaluation of material resources invested, the environmental burden and the environmental impact of a product or service through all stages of its life cycle (Diagram 8).
Life cycle assessment requires a manufacturer to quantify the amount of input and output during the manufacture, usage and disposal of the product. The outputs are quantified in terms of their contribution to the environment (Diagram 9) where:-
• The impact to the atmosphere are measured in terms of the impact to global warming; usually measured in term carbon dioxide equivalent.
• The impact to the water resources are measured in terms of biological, chemical loading and potential to create fouling due to overloading of nutrients (euthrophication).
• The impact of the industry to the soil is measured in terms of acidity, organic loading and biodiversity.
SEcOnD FROnTIER OF SUSTAInABILITYLCIA will be able to highlight areas for improvement especially in terms of the utilization of resources. Defining Second Frontier of Sustainability (SFS) as the ability of the industry to optimize the utilization of resources and improving productivity with no or better impact to the environment, (Diagram 10) below are four examples of research and development spearhead by MRB to transform the industry toward SFS.
Current Practices (Example 1)• Ninety-five percent of the rubber area
in Malaysia is owned by smallholders (smallholders are those owning less than 40hectares of land). Survey by RISDA indicates that their trees are old and they are getting older too. Many smallholders complained of not getting the right NR clone during replanting and as a result getting lower productivity. But it is uncertain whether the smallholders have the competencies to distinguish the different types of clones.
• The current method of producing the planting material is by germinating and growing the rubber seeds to rootstocks, followed by bud grafting with the bud eyes from the right clones, allowing for the new tree to develop and growing to 2 whorls, and then planted in the field. The time taken to grow 2-whorl planting materials from seeds is almost one year.
• Smallholders therefore need to book the 2-whorl planting materials a year ahead from the licensed nurseries. Upon receiving a confirmed order, the nurseries will collect or purchase seeds and then followed through until 2-whorl planting materials are produced. The bottle neck in the production of high quality rubber planting materials is the seeds where there are only two seeds seasons per year. If the seeds falling seasons are missed, the smallholder needs to wait for a year for the supply of new planting materials. Thus smallholders, who do not make prior bookings, usually resort to either buying any planting material available in the market or by planting seedlings grown from seeds. This will of course result in low productivity.
CO7
CH4
CFCS
SOX
NOX
NH3
HCIVOC
Global Warming
Ozone Layer Depletion
Acidification
Photo Oxidation
Eutrophication
Human ToxicityPO43-
NO3
BOD
EMISSION TO AIR
BETTER PRODUCTS?
EMISSION TO WATER
LIFE CYCLE IMPACT ASSESSMENT (LCIA)
RAW MATERIAL ACQUISITION
PRODUCTION
USE
DISPOSAL
INVENTORY(e.g. emission/kg)
IMPACT CATEGORY LCIA
USE OF RAW MATERIALS
Recycle
Resources PackagingWaste
DISTRIBUTIONMANUFACTURE PRODUCT USE END OF LIFE
ENVIRONMENT IMPACT
LIFE CYCLE ASSESSMENT (LCA)
Life cycle impact assessment is a tool that can be used to analyze the input and output of an industry and their impact to environment
Diagram 8
Diagram 9
industry insights
16
January 2012

EXAMPLE 1: HIGH QUALITY PLANTING MATERIAL TO SMALLHOLDERS
EXAMPLE 2: POOR RUBBER TAPPING SYSTEM
EXAMPLE 3 : POOR SUPPLY CHAIN
SEEDS
MANUALTAPPING LATEX
SMR OR LATEX-BASED PRODUCTS
MANUALTAPPING LATEX
SMR OR LATEX-BASED PRODUCTS
IN POLYBAG ROOTSTOCK BUD GRAFTING
NEW GROWTH
2-WHORLPLANTING MATERIALS
Dealer Dealer
SFS-1: TRAcEABILITY TO EnSURE THE SUPPLY OF HIgH QUALITY PLAnTIng MATERIALS TO THE SMALLHOLDERSUnder Entry Point Project (EPP) 1 in Rubber NKEA, the MRB research team proposed to ensure the supply of high quality planting materials to the smallholders through the following activities:-
• Establishment of Seeds Production Areas (SPA): Seeds are the cause of the bottle neck in the supply of high quality planting materials. SPA has been established to supply seeds should this be necessary and government to government agreement to supply seeds shall be made should this be necessary. Research into the production of rootstock from tissue culture materials will also be looked into.
• Reduce the number of MRB-recommended clones: Since the smallholders have limited expertise/competency to identify clones, the numbers of recommended clones are optimized to reduce confusion with the hope that the smallholders will slowly learn to at least recognize the characteristics of the recommended clones.
• No Rogue Clones: Rogue clones in the source bushes are destroyed and bud-eyes
are obtained from the source bushes in the nurseries. MRB team has verified all trees in the source bushes of the licensed nurseries.
• Establishment of Malaysian Rubber Budwood Center: MRB has been given funding to establish at least 4 Malaysian Rubber Budwood Center (MRBC) to supply bud-eyes for budding purposes.
• Production of iKLON: To assist the smallholders and the officers to indentify rubber clone, a special hand-held gadget will be fabricated by MRB Team to enable recognization/identification of the clones – without relying on human-eyes.
• Bar-code for Traceability: Planting materials to be attached with bar-code tag to ensure traceability. Employers involved in the production of the planting materials shall register their company’s name and staff involved in the production of planting materials onto the barcode. This barcode tag will be attached to the planting material. If smallholders are unsure of the clones of the planting materials received, iKLON can be used to identify clones. Nurseries supplying rogue clones to the smallholders will be penalized and MRB is equipped with the right resources and procedures to ensure adherence to this new concept.
• Clone Inspectors; Clone inspectors have been trained by MRB – to support the use of iKLON
• Training on Good Agricultural Practices (GAP): Smallholders will be trained and required to follow GAP to improve productivity.
• Anticipated impact: The number of rogue clones supplied to smallholders will be reduced (to zero) and o nly good quality planting material shall be supplied to smallholders. Wastage will be reduced and the productivity/hectare basis of the smallholders areas will be improved due to better clones (zero rogue clones) and implementation of GAP.
Current Practices (Example 2)• The smallholders will go out in the morning
to manual tapped rubber trees.
• Rubber is collected in the form of coagulated latex instead of the liquid latex since collecting latex requires more time.
• The coagulated rubber can be easily contaminated. MRB noted high incidences of this malpractice when the rubber price is high. Contaminated rubber requires additional processing to ensure good quality
EXAMPLE 1: HIGH QUALITY PLANTING MATERIAL TO SMALLHOLDERS
EXAMPLE 2: POOR RUBBER TAPPING SYSTEM
EXAMPLE 3 : POOR SUPPLY CHAIN
SEEDS
MANUALTAPPING LATEX
SMR OR LATEX-BASED PRODUCTS
MANUALTAPPING LATEX
SMR OR LATEX-BASED PRODUCTS
IN POLYBAG ROOTSTOCK BUD GRAFTING
NEW GROWTH
2-WHORLPLANTING MATERIALS
Dealer Dealer
Environment not affected/improved
REDUCE UTILIZATION
OF RESOURCES
INCREASE OUTPUT/
PRODUCTIVITY/PROFITABILITY
SECOND FRONTIER
OF SUSTAINABILITY+ =
Diagram 10
industry insights
17
January 2012

for effluent treatment will be reduced as well. The process water can be recycled therefore reducing cost. The gain in profit may be shared with smallholders.
Current Practice (Example 4)• Malaysian processors are producing solid
rubber similar to those produced by the neighbouring countries
• The market is moving towards “green products”
SFS-4: EKOPREnA AnD PUREPREnACommercialization of EKOPRENA and PUREPRENA: EKOPRENA and PUREPRENA can be produced by new technologies developed by MRB. These new materials have unique properties and can also be used to produce products that can qualify for “green Label”. The technologies to produce these new materials are patented by
SMR. Additional processing indicates greater utilization of resources and increase environmental loading.
• Rubber latex can be used to produce solid rubber as well as latex-based goods. Currently there is a high demand of latex in Malaysia and the shortage in supplied through imports from neighboring countries such as Thailand. As stated above the smallholders in Malaysia prefer to produce coagulated rubber.
• Due to old age, about 40% of the smallholders rely on hired help (foreign labours) to tap and manage the fields.
• The number of tapping days will be reduced during rainy days.
SFS-2: AUTOMATIc RUBBER TAPPIng SYSTEM (ARTS)ARTS is supposed to automatically tap rubber trees at pre-determined time and the latex is pumped to a collection centre. This system will address the issues of:-
• Shortage of Labour – as it reduces labour requirement (+ foreign labour)
• Shortage of latex – as the system will allow for the production of latex
• Reduce the physical burden of carrying the heavy latex.
• Reduce the supply-chain and
• Increase productivity since it will not be affected by the rainy days.
It is anticipated that, the commercial production of ARTS will also create sizable spin-off companies.
Current Practice (Example 3)• Smallholders will sell their coagulated rubber
to one or more dealers.
• The dealers will sell the rubber to processors – the coagulated rubber is not segregated and high quality rubber is therefore mixed with the poor quality.
• Smallholders will not enjoy better prices even if high quality rubber is produced.
• High value co-product is not recovered.
• The rubber need to be thoroughly washed due to contaminations.
• Effluent need to be treated before it can be discharged.
• Large pieces of land are required to treat the effluent.
SFS-3: InTEgRATED PROcESSIng cEnTER (IPc) Close proximity of processing center: Processing center is placed close to sources of rubber (close to smallholders) to reduce logistic cost and giving better return to smallholders. The rubber will be transferred fresh to the processing unit thereby improving the quality of rubber or the high value co-product to be recovered.
High-value co-product(s) is (are) recovered: Co-products in the process are extracted and processed into high value pharmaceutical products. After extraction the amount of waste that needs to be treated will be reduced and the area required
EXAMPLE 1: HIGH QUALITY PLANTING MATERIAL TO SMALLHOLDERS
EXAMPLE 2: POOR RUBBER TAPPING SYSTEM
EXAMPLE 3 : POOR SUPPLY CHAIN
SEEDS
MANUALTAPPING LATEX
SMR OR LATEX-BASED PRODUCTS
MANUALTAPPING LATEX
SMR OR LATEX-BASED PRODUCTS
IN POLYBAG ROOTSTOCK BUD GRAFTING
NEW GROWTH
2-WHORLPLANTING MATERIALS
Dealer Dealer
EXAMPLE 4 : COMMODITY PRODUCT
MANUALTAPPING
LATEX OR CUPLUMPS SMR
PRODUCTDISPOSAL
industry insights
18
January 2012

MRB. Due to unique properties, EKOPRENA and PUREPRENA can fetch higher prices than the commodity material like SMR (Standard Malaysian Rubber).
cOncLUSIOnThe rubber industry in Malaysia has proven to be a sustainable industry as even after more than 130 years of involvement, the industry continues to contribute to the export earnings of the countries. Strong demand and good product performances are some of the factors responsible for the continued favourable price trend.
Rubber remains relevant even under the New Economic Model which aspires to transform the country from middle to high income economy. Rubber/Oil Palm are one of the twelve national key economic activities identified under the economic transformation programmes.
Life cycle impact assessment is a tool that can be used by management to improve process and optimized resources utilization. This article define second frontier of sustainability (SFS) as the optimization of resources utilization to enhance productivity, reduce cost, differentiate itself from the commodity markets and with the possibility to improve on the positive impact of the industry activities on the environment. With more than 80 years of research, the Malaysian Rubber Board has accumulated technologies and know-how to enable the organization to spearhead the industry towards SFS. This article highlights four specific areas where MRB hopes to spearhead these SFS.
LETTERFROM THE FUTURE
BY HAZIM ADLY HARUnUniversiti Malaysia Pahang
Dear friend,
How’s the weather there? Down here the weather is fine because Malaysia has been able to handle the greenhouse effect effectively.
Are we still having doubts about the halal status of our food? The answer is no! There is now a mini device that can help Muslims detect non-halal products.
Remember my mom? She’s coping better with her health now, thanks to the health system that’s in place. Doctors and nurses make free house calls regularly.
I’ve just bought a new car that seats ten people comfortably. It’s a really big MPV that runs on food waste as fuel.
I wish you have not migrated as life in Malaysia is better compared to life in most other parts of the world. Anyway, you’re always welcome to come back.
Regards,Hazim Adly Harun12 August 2032
1. World Commission on Environment and Development of United Nations (1987). Our Common Future (Brundtland Report), New York (1987).
2. Extracted from the paper presented at the International Rubber Economic Conference 2011, July 2011. Malaysian Rubber Board.
Rubber remains relevant even under the New
Economic Model which aspires to transform the
country from middle to high income economy
19
January 2012
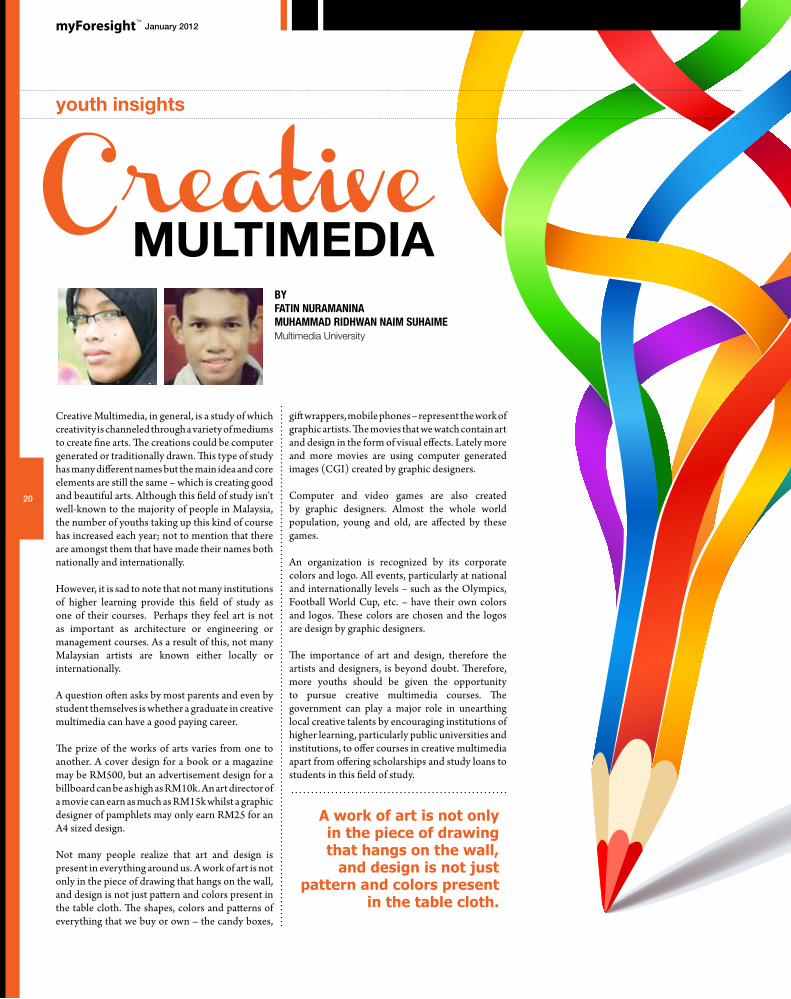
youth insights
Creative Multimedia, in general, is a study of which creativity is channeled through a variety of mediums to create fine arts. The creations could be computer generated or traditionally drawn. This type of study has many different names but the main idea and core elements are still the same – which is creating good and beautiful arts. Although this field of study isn’t well-known to the majority of people in Malaysia, the number of youths taking up this kind of course has increased each year; not to mention that there are amongst them that have made their names both nationally and internationally.
However, it is sad to note that not many institutions of higher learning provide this field of study as one of their courses. Perhaps they feel art is not as important as architecture or engineering or management courses. As a result of this, not many Malaysian artists are known either locally or internationally.
A question often asks by most parents and even by student themselves is whether a graduate in creative multimedia can have a good paying career.
The prize of the works of arts varies from one to another. A cover design for a book or a magazine may be RM500, but an advertisement design for a billboard can be as high as RM10k. An art director of a movie can earn as much as RM15k whilst a graphic designer of pamphlets may only earn RM25 for an A4 sized design.
Not many people realize that art and design is present in everything around us. A work of art is not only in the piece of drawing that hangs on the wall, and design is not just pattern and colors present in the table cloth. The shapes, colors and patterns of everything that we buy or own – the candy boxes,
gift wrappers, mobile phones – represent the work of graphic artists. The movies that we watch contain art and design in the form of visual effects. Lately more and more movies are using computer generated images (CGI) created by graphic designers.
Computer and video games are also created by graphic designers. Almost the whole world population, young and old, are affected by these games.
An organization is recognized by its corporate colors and logo. All events, particularly at national and internationally levels – such as the Olympics, Football World Cup, etc. – have their own colors and logos. These colors are chosen and the logos are design by graphic designers.
The importance of art and design, therefore the artists and designers, is beyond doubt. Therefore, more youths should be given the opportunity to pursue creative multimedia courses. The government can play a major role in unearthing local creative talents by encouraging institutions of higher learning, particularly public universities and institutions, to offer courses in creative multimedia apart from offering scholarships and study loans to students in this field of study.
CreativeBYFATIn nURAMAnInAMUHAMMAD RIDHWAn nAIM SUHAIMEMultimedia University
MULTIMEDIA
A work of art is not only in the piece of drawing that hangs on the wall,
and design is not just pattern and colors present
in the table cloth.
20
January 2012

Innovating Innovation: Innovation in the age of disruption and Black swans
BYAZIM PAWAncHIKAlpha Catalyst [email protected]
DR. SURAYA SULAIMAnAlpha Catalyst [email protected]
Over the past decade, quality, efficiency and safety have, to a certain degree permeated many organizations, forming an integral component of the organization’s quest to be competitive. However, in recent years, the hype has been to add another word to the companies’ load of initiatives; Innovation! Despite the move, many organizations have not been successful at diffusing innovation throughout their organization, seemingly remaining just a buzz word. Nonetheless, as organizational leaders sit in their lofty pseudo cocoon, when many giants are crashing down around them, are they truly aware of the need for their organization to innovate?
industry insights
21
January 2012

Source: Leading InnovAsian: Embedding Innovation Culture in Malaysian Organizations.
(financial/non-financial) for an organization.” At the end of it all, organizations need to innovate the way that they approach innovation.
APPROAcHES TO InnOvATIOnOur analysis reveals three distinct approaches towards innovation; 1.0 which is predominantly driven by the lone inventor or technopreneur, producing products with very limited resources. Innovation 2.0 on the other hand has a large budget,
between using the foresight information to drive long term strategy yet be sensitive to the emergence and impact of disruptive innovations and black swans at the same time. Organizations need to be dexterous enough to deviate from the charted course and redirect resources to more valuable projects. Secondly, organizations should explore more effective strategies towards creating innovations; this may range from strategic collaborations with external parties or tapping on channels for open innovation. Organizations would doubly benefit from such activities from a financial and risk management perspective. On the upside, organizations need to explore how the disruptive situations may be used to their own advantage. In short we need to look at how we define innovation and more importantly, how we approach innovation.
WHAT IS InnOvATIOn?In the 2010 Malaysian Innovation Climate Survey Report, which collated views from employees in organizations, many Malaysians viewed innovation as strongly related to creativity, R&D and technology, and least associated it with risk and processes as shown in Figure A. In fact many current incentives and innovation initiatives are strongly tied to R&D, science and technology and less on processes, services and business models.
resulting in a positive impact to the economy, business, public service delivery system, social well-being or the environment”.
With so many definitions floating around, it is understandable that there is much confusion on what is innovation exactly. The OECD has also defined innovation in four areas - product innovation, process innovation (a markedly improved production or delivery method), marketing innovation (involves a new marketing method involving significant changes in product design or packaging, product placement, promotion or pricing) and organizational innovation (involves introducing a new organizational method in the firm’s business practices, workplace organization or external relations). According to Figure B, Malaysian companies are already practicing these various types of innovation; however the majority focused much more on incremental innovation with a smattering few that practiced radical innovation.
In the era of disruptive innovation and black swans, organizations need to broaden the definition of innovation and not limit themselves to R&D, patents and technology, but to focus more on value creation. We believe that innovation should be defined as “the introduction of new products, services, processes, technologies, business models or management practices that have created significant value
In an era where change occurs in the blink of an eye, investments into foresight and scenarios planning are important to guide organizations develop strategies for future investments. However equally important are how these strategies are translated into action and the willingness of the organization to change pathways with the emergence of new events or circumstances.
In late July 2011, floodwaters drowned a third of Thailand causing billions of dollars in damage, putting 14,000 factories underwater and nearly 700,000 people temporarily out of work. Toyota, Honda and Western Digital are only a few of the giants that had to suspend their operations in Thailand. How would any foresight or scenarios planning session have predicted this disaster? If this were your predicament, how agile is your organization in exploring new strategies and how well would you be able to implement them?
DISRUPTIvE InnOvATIOn AnD BLAcK SWAnSClayton Christensen in his book The Innovator’s Dilemma made famous the concept of disruptive innovation, where the introduction of a new technology or business model disrupts the traditional market practices. This is the space where CDs replaced the 3-inch floppy disk drives but are now on the endangered list themselves due to the emergence of mega-thumb drives/flash drives. Digital photography has also practically caused the extinction of the 35mm film rolls. In more recent times, Skype disrupted revenues of many traditional telecommunication companies as consumers were able to communicate globally at a fraction of the cost.
Black swans, also cause disruption and the causative factor may be an environmental, economic, political, societal or a technological event. ‘Black Swan’ was a term made popular by Nassim Nicholas Taleb, a finance professor and former Wall Street trader, and it referred to an event or occurrence that deviates beyond what is normally expected of a situation or one that would be extremely difficult to predict and commonly has an extreme impact. Situations like the floods in Thailand and its ensuing effect on the automotive, electronics and food supply chain in Asia; the earthquake in Japan and its impact on the Nuclear Power Generation industry; even the political unrests and protest in the Middle East and North Africa with its impact on oil prices would encompass black swans.
The combination of these events and circumstances has enormous implications on organizations. Not to undermine the role that foresight and scenarios planning play, organizations, we feel must balance
Figure A Elements innovation is most associated with.
When we look at definitions, the US Advisory Committee on Measuring Innovation in the Twenty-First Century Economy describes innovation as “the design, invention, development and/or implementation of new or altered products, organizational structures, or business models for the purpose of creating new value for customers and financial returns for the firm.” Malaysia’s own Innovation Bill 2010 defines innovation as “any idea or knowledge in whatever form which brings about changes in the form of product, service or process,
Source: Leading
InnovAsian:
Embedding Innovation
Culture in Malaysian
Organizations (2010)10%
11%
15%
15%
15%
18%
19%
36%
40%
45%
0% 20% 40% 60% 80%
75%
industry insights
22
January 2012
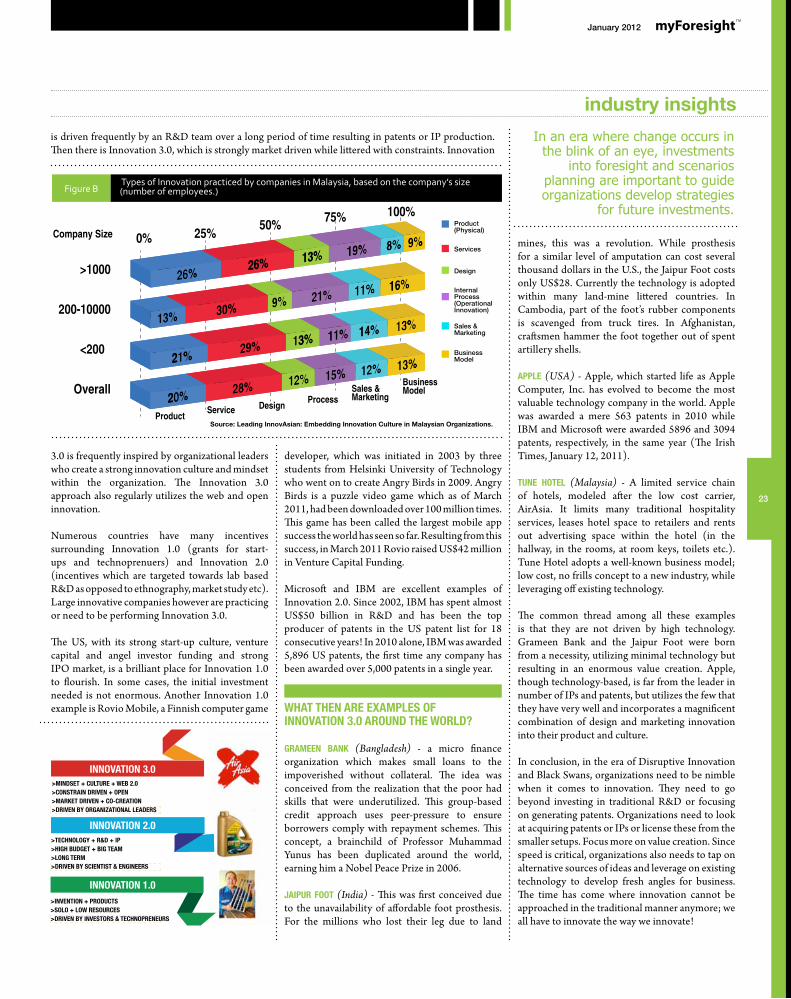
developer, which was initiated in 2003 by three students from Helsinki University of Technology who went on to create Angry Birds in 2009. Angry Birds is a puzzle video game which as of March 2011, had been downloaded over 100 million times. This game has been called the largest mobile app success the world has seen so far. Resulting from this success, in March 2011 Rovio raised US$42 million in Venture Capital Funding.
Microsoft and IBM are excellent examples of Innovation 2.0. Since 2002, IBM has spent almost US$50 billion in R&D and has been the top producer of patents in the US patent list for 18 consecutive years! In 2010 alone, IBM was awarded 5,896 US patents, the first time any company has been awarded over 5,000 patents in a single year.
WHAT THEn ARE ExAMPLES OF InnOvATIOn 3.0 AROUnD THE WORLD?
gRAMEEn BAnK (Bangladesh) - a micro finance organization which makes small loans to the impoverished without collateral. The idea was conceived from the realization that the poor had skills that were underutilized. This group-based credit approach uses peer-pressure to ensure borrowers comply with repayment schemes. This concept, a brainchild of Professor Muhammad Yunus has been duplicated around the world, earning him a Nobel Peace Prize in 2006.
JAIPUR FOOT (India) - This was first conceived due to the unavailability of affordable foot prosthesis. For the millions who lost their leg due to land
is driven frequently by an R&D team over a long period of time resulting in patents or IP production. Then there is Innovation 3.0, which is strongly market driven while littered with constraints. Innovation
3.0 is frequently inspired by organizational leaders who create a strong innovation culture and mindset within the organization. The Innovation 3.0 approach also regularly utilizes the web and open innovation.
Numerous countries have many incentives surrounding Innovation 1.0 (grants for start-ups and technoprenuers) and Innovation 2.0 (incentives which are targeted towards lab based R&D as opposed to ethnography, market study etc). Large innovative companies however are practicing or need to be performing Innovation 3.0.
The US, with its strong start-up culture, venture capital and angel investor funding and strong IPO market, is a brilliant place for Innovation 1.0 to flourish. In some cases, the initial investment needed is not enormous. Another Innovation 1.0 example is Rovio Mobile, a Finnish computer game
Types of Innovation practiced by companies in Malaysia, based on the company’s size (number of employees.)
mines, this was a revolution. While prosthesis for a similar level of amputation can cost several thousand dollars in the U.S., the Jaipur Foot costs only US$28. Currently the technology is adopted within many land-mine littered countries. In Cambodia, part of the foot’s rubber components is scavenged from truck tires. In Afghanistan, craftsmen hammer the foot together out of spent artillery shells.
APPLE (USA) - Apple, which started life as Apple Computer, Inc. has evolved to become the most valuable technology company in the world. Apple was awarded a mere 563 patents in 2010 while IBM and Microsoft were awarded 5896 and 3094 patents, respectively, in the same year (The Irish Times, January 12, 2011).
TUnE HOTEL (Malaysia) - A limited service chain of hotels, modeled after the low cost carrier, AirAsia. It limits many traditional hospitality services, leases hotel space to retailers and rents out advertising space within the hotel (in the hallway, in the rooms, at room keys, toilets etc.). Tune Hotel adopts a well-known business model; low cost, no frills concept to a new industry, while leveraging off existing technology.
The common thread among all these examples is that they are not driven by high technology. Grameen Bank and the Jaipur Foot were born from a necessity, utilizing minimal technology but resulting in an enormous value creation. Apple, though technology-based, is far from the leader in number of IPs and patents, but utilizes the few that they have very well and incorporates a magnificent combination of design and marketing innovation into their product and culture.
In conclusion, in the era of Disruptive Innovation and Black Swans, organizations need to be nimble when it comes to innovation. They need to go beyond investing in traditional R&D or focusing on generating patents. Organizations need to look at acquiring patents or IPs or license these from the smaller setups. Focus more on value creation. Since speed is critical, organizations also needs to tap on alternative sources of ideas and leverage on existing technology to develop fresh angles for business. The time has come where innovation cannot be approached in the traditional manner anymore; we all have to innovate the way we innovate!
Source: Leading InnovAsian: Embedding Innovation Culture in Malaysian Organizations.
Figure B
In an era where change occurs in the blink of an eye, investments
into foresight and scenarios planning are important to guide organizations develop strategies
for future investments.
>1000
0%
Product
Company SizeProduct (Physical)
Services
Design
Internal Process (Operational Innovation)
Sales & Marketing
Business Model
25%
Service
50%
Design
75%
ProcessSales & Marketing
Business Model
100%
200-10000
<200
Overall
>TEcHnOLOgY + R&D + IP>HIgH BUDgET + BIg TEAM>LOng TERM>DRIvEn BY ScIEnTIST & EngInEERS
>MInDSET + cULTURE + WEB 2.0>cOnSTRAIn DRIvEn + OPEn>MARKET DRIvEn + cO-cREATIOn>DRIvEn BY ORgAnIZATIOnAL LEADERS
InnOvATIOn 3.0
InnOvATIOn 2.0
>InvEnTIOn + PRODUcTS>SOLO + LOW RESOURcES>DRIvEn BY InvESTORS & TEcHnOPREnEURS
InnOvATIOn 1.0
industry insights
23
January 2012

TOWARDS A HIGH INCOME SOCIETYThe Offset Programs
BYMAJOR (R) ZAILAnI SAFARIVice PresidentOffset Management & [email protected]
It is a vision of the Malaysian leadership to create a high income society by the year 2020. In order to achieve this vision Malaysia, a successful commodity and manufacturing nation, needs to develop its technology capability and capacity to become a knowledge-based economy.
Malaysia targets six percent (6%) annual economic growth. To achieve this, Malaysia needs to improve its capacity and capability in high technology and a combination of factories that make high technology products and a vibrant services industry. It must be able to produce a diversity of high-tech products and services with better prospect for exports.
To create a high income society and to achieve a high income economy, Malaysia has to have a focused economy, an economy that focus on a few sectors of high value based on innovation with concrete potential. In order to have a stable economy, Malaysia needs to move into sectors that are not prone to bubble economy.
industry insights
24
January 2012

OFFSET PROgRAMSOffset programs could be used as platform to support the Government aspiration to develop competitive nation and high-income society. In general, offset arrangements are parts of the contract agreements that are designed to help purchasers obtain the desired transfer of technology and provide local employment. Offsets programs can also be viewed as contracts that require the seller to transfer extra economic benefits to the buyer as a condition for the sale of goods and services.
a) Definition and PolicyMalaysia refers to its policy generically as ‘offset management policy‘, usually requiring contractors to discharge obligations with offsets and countertrade in two forms (as shown in Figure 1):
The direct offsets are defined as anything related to main procurement contract comprise of activities and packages agreed by the seller and the procuring Government such as:• CapabilityDevelopment
• Localworkpackages
• Transfer of Technology and CompetencyDevelopment
Indirect offsets are programs that are not directly linked to the base product procured, which can be any activities agreed by the Government: • TransferofTechnology(ToT)andknow-how
• Research,DevelopmentandCommercialization(R&D&C)
• LocalContent
• AccesstoGlobalMarket
• ForeignDirectInvestment(FDI)
At present, the national offset policy was published by the Ministry of Finance in early 2011 and in overall command of the policy. The Malaysian Industry Government Group for High Technology (MIGHT) has assumed a high profile role in addressing the technological development needs for the country. Under the policy, all ministries work closely with MIGHT, which acts as a Technology Depository Agency (TDA) and provides offset management services which include the identification technologies required by the nation.
b) The ApproachThe main objectives of the offset programs are to diversify the economy in-line with the aspiration
Figure 1 Malaysian Offset Program Structure
of developing knowledge-based economy and innovation-led society. To achieve the objectives, the Malaysian National Offset Policy was developed with the following guiding principles:• Foster strategic international partnership that
can contribute to economic and industrialenhancement;
• Maximizetheusageoflocalcontentsandreducetheoutflowofcurrency;
• Establish a sustainable Malaysian industrialand economic basis, with strategic capabilitiesandindustrialparticipationintheglobalsupplychain;
• Promote Transfer of Technology (ToT) andknow-how;
• CollaborateinstrategicResearch,Developmentand Commercialization (R&D&C) projects;and
• FacilitateinvestmentsandcollaborateinstrategicHumanResourceDevelopment(HRD).
Offset arrangements are parts of the
contract agreements that are designed
to help purchasers obtain the desired
transfer of technology and provide local
employment.
CAPITAL ACQUISITION BY MALAYSIAN GOVERNMENT
DIRECT INDIRECT
OFFSET TRIGGERED
Technology Transfer
Product Marketing
Contract Manufacturing
FDI
Capability development
Product design capability
Parts & component making
FDI
INITIATION
OFFSET PROGRAM STRATEGY
industry insights
25
January 2012
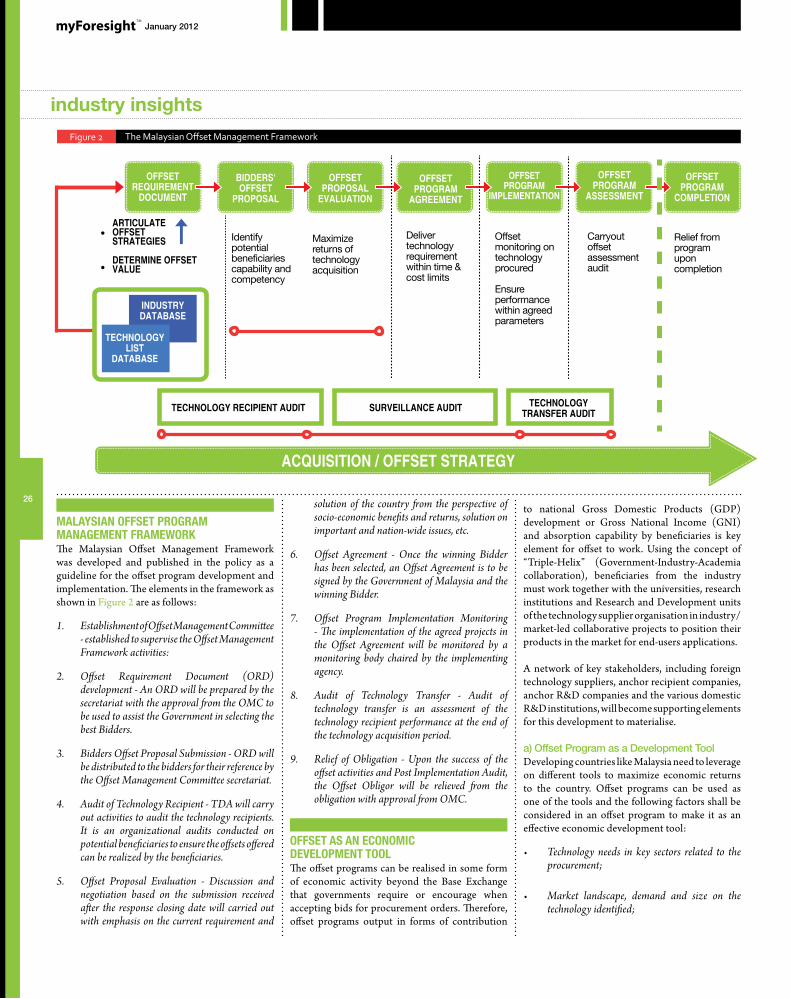
MALAYSIAn OFFSET PROgRAM MAnAgEMEnT FRAMEWORKThe Malaysian Offset Management Framework was developed and published in the policy as a guideline for the offset program development and implementation. The elements in the framework as shown in Figure 2 are as follows:
1. EstablishmentofOffsetManagementCommittee-establishedtosupervisetheOffsetManagementFrameworkactivities:
2. Offset Requirement Document (ORD)development-AnORDwillbepreparedbythesecretariatwiththeapprovalfromtheOMCtobeusedtoassisttheGovernmentinselectingthebestBidders.
3. BiddersOffsetProposalSubmission-ORDwillbedistributedtothebiddersfortheirreferencebytheOffsetManagementCommitteesecretariat.
4. AuditofTechnologyRecipient-TDAwillcarryoutactivitiestoauditthetechnologyrecipients.It is an organizational audits conducted onpotentialbeneficiariestoensuretheoffsetsofferedcanberealizedbythebeneficiaries.
5. Offset Proposal Evaluation - Discussion andnegotiation based on the submission receivedafter the response closing datewill carried outwithemphasison thecurrentrequirementand
solution of the countryfrom the perspective ofsocio-economicbenefitsandreturns,solutiononimportantandnation-wideissues,etc.
6. Offset Agreement - Once the winning Bidderhasbeenselected,anOffsetAgreement is tobesignedbytheGovernmentofMalaysiaandthewinningBidder.
7. Offset Program Implementation Monitoring-The implementationof theagreedprojects inthe Offset Agreement will be monitored by amonitoring body chaired by the implementingagency.
8. Audit of Technology Transfer - Audit oftechnology transfer is an assessment of thetechnologyrecipientperformanceat theendofthetechnologyacquisitionperiod.
9. Relief of Obligation - Upon the success of theoffsetactivitiesandPostImplementationAudit,the Offset Obligor will be relieved from theobligationwithapprovalfromOMC.
OFFSET AS An EcOnOMIc DEvELOPMEnT TOOL The offset programs can be realised in some form of economic activity beyond the Base Exchange that governments require or encourage when accepting bids for procurement orders. Therefore, offset programs output in forms of contribution
to national Gross Domestic Products (GDP) development or Gross National Income (GNI) and absorption capability by beneficiaries is key element for offset to work. Using the concept of “Triple-Helix” (Government-Industry-Academia collaboration), beneficiaries from the industry must work together with the universities, research institutions and Research and Development units of the technology supplier organisation in industry/market-led collaborative projects to position their products in the market for end-users applications.
A network of key stakeholders, including foreign technology suppliers, anchor recipient companies, anchor R&D companies and the various domestic R&D institutions, will become supporting elements for this development to materialise.
a) Offset Program as a Development ToolDeveloping countries like Malaysia need to leverage on different tools to maximize economic returns to the country. Offset programs can be used as one of the tools and the following factors shall be considered in an offset program to make it as an effective economic development tool:
• Technology needs in key sectors related to theprocurement;
• Market landscape, demand and size on thetechnologyidentified;
Figure 2 The Malaysian Offset Management Framework
Identify potential beneficiaries capability and competency
OFFSET REQUIREMENT
DOCUMENT
BIDDERS' OFFSET
PROPOSAL
OFFSET PROPOSAL
EVALUATION
OFFSET PROGRAM
AGREEMENT
OFFSET PROGRAM
ASSESSMENT
OFFSET PROGRAM
IMPLEMENTATION
OFFSET PROGRAM
COMPLETION
TECHNOLOGY LIST
DATABASE
TECHNOLOGY RECIPIENT AUDIT SURVEILLANCE AUDIT TECHNOLOGY TRANSFER AUDIT
ACQUISITION / OFFSET STRATEGY
INDUSTRY DATABASE
ARTICULATE OFFSET STRATEGIES
DETERMINE OFFSET VALUE
Maximize returns of technology acquisition
Deliver technology requirement within time & cost limits
Offset monitoring on technology procured
Ensure performance within agreed parameters
Carryout offset assessment audit
Relief from program upon completion
industry insights
26
January 2012

• Closecollaborationbetweenthepolicymakers,theadministratingagenciesandtheimplementersin implementing the technology acquisitionprocesses;and
• Identification of the ‘right’ beneficiaries toimplementtechnologyacquisitioneffectively.
b) Long Term Strategic GoalThe framework developed for technology acquisition in Government procurement, will make possible the “matching-up” of offset with the country’s technological needs and market demand. Therefore, national procurement can be better positioned to serve as a crucial entry-point for new technologies into Malaysia as well as positioning of local technology in the global supply chain. As such, dynamic offset program plans are needed to address current national technology development needs, guided by relevant national economic development plans and strategies including the 5-year and 10-year Malaysia Plans, Industrial Master Plans, Science and Technology Policy, and other documents endorsed by the Government. Inputs from the industry players will be gathered, rationalised and the current needs of the country must be identified to ensure the strategic goals are valid and doable. The Malaysian Offset Executive Committee (MOEC) chaired by the Ministry of Finance is to ensure that activities identified in the Offset Program are in line with the national strategies and will give maximum benefits to the national technology development.
c) ORD DevelopmentOffset Requirement Document (ORDs) are documents developed by TDA as guideline to the suppliers to propose offset programs as requested by the country. The ORDs provide a wish list so that the offset program will be developed based on requirements by Malaysia rather than being dictated by the suppliers. Evaluations on the proposed programs are carried out using the ‘weightage’ approach on the bidders’ compliances to the requirements specified in the ORD. The evaluation parameters are based on:
• Compliance–itisaresolutiononhowthebiddercompliestotheORD
• Alternatives– it is a resolutionon the optionsofferedbythebidders incase theycannot fullycomplywiththeORD
• Risks–itisanidentification of risks associated with programs from the technology provider and recipient perspectives.
d) Offset management experienceOffset programs interface with multinational industry players and high-valued industries. Therefore, the resources involved in the offset program management shall have adequate experience and knowledge to handle international negotiations and dealings. The offsets do not come in free as such, that the offset obligors will find means and ways to ensure that the offset program cost is minimized and the outcomes are always in favour of them. Therefore, the corporate knowledge management approach to institutionalize the handling of the offset management is crucial to ensure that the long term capability development strategy through offset is achieved.
The overall offset management shall provide provisions for changes due to unforeseen circumstances. Offset management is a long term business management; as such it needs provision for changes and shall be dynamic to cater local and international business landscape change
Offset program was implemented to drive economies. Countries such as Japan, South Korea, United States and Taiwan have used offset program as catalyst for their economic development. Effective management and execution of the programs by dedicated organizations enable those countries to reap maximum benefits leveraging on strategies outlined by the government.
A good offset policy is one that gives attention to the economic situations of both purchasing country as well of the country wishing to make the sale. The difficult task in managing an offset policy is to reach an unbiased balance between the obligations to be imposed, and the cooperation it seeks to establish. In the event of successful balancing act, offsets can be used as a tool of development and positive commercial cooperation. Five important factors for the success of an offset program are realism, anticipation, dialogue, moderation, and imagination.
In ensuring that offset programs satisfies the national needs that contribute to the economic growth, the main procurement evaluation shall acknowledge that offset programs shall contribute significantly to the decision making based on the main contract. In doing so, the offset programs are to be structured that they contain elements of economic growth contributions such as job creations by encouraging the development of local industries and maximise the utilisation of local resources; development of local economic engines capability and capacity; market openings for local products; and technology development through knowledge generations and knowledge transfer.
The offset programs shall be designed to support the economic transformation from manufacturing economy to innovation economy aspired by the government. Therefore, the implementation of the Offset Program Management framework shall be dynamic and has provision for rooms to incorporate elements of innovativeness to allow changes required in supporting vibrant and innovative economic growth. It shall also give emphasis on the importance of technology identification to ensure offset meets the national objectives; ensure commitment of the beneficiaries to absorb technology; establish continuous industrial/academic links; evaluate economic feasibility of the technology and thus ensuring long-term sustainability; and improve the management of technology acquired.
The strategies shall consider the long term impact that lead to the commercialization aspect by establishing of market share for Malaysian good; increase of market share by opening up new markets; product positioning in the market; and attract foreign investment. In conclusion, offset programs as a platform of technology transfer is feasible provided it is managed properly by capable and competent organization.
References
Amesse, F., Cohendet, P. 2001. Technology Transfer Revisited From The Perspective Of The Knowledge-Based Economy. Research Policy 30: 1459–1478
Bureau of Industry and Security, U.S. Department of Commerce (USDC). 1999. Offsets In Defence Trade: Sixth Study
Day, D.L., Fraser, J., Krantz, A., Waugaman, P., 2002. Technology Transfer Basics: A Workshop for Research Administrators, Technology Commercialization Group, Orlando
Fraunhofer. 2007. Signposts to Tomorrow’s Markets
Manufacturing, Services Key To 6pc Annual Growth. 2009. Business Times, November 22
Ministry of Finance. 2011. Policy and Guideline in Offset Programs in Government Procurement
Hew, D., 2007. Offset and PPP - How One Complement The Other. Countertrade and Outlook, 35 (8), April 23
Henry, M., Kneller, R., Milner, C., 2009. Trade, Technology Transfer And National Efficiency In Developing Countries. European Economic Review 53: 237–254
MIGHT. 2002. Study of Offset Programs of the National Defence Procurement
Rush, H., Bessant, J., Hobday, M.,. 2007. Assessing the Technological Capabilities of Firms: Developing A Policy Tool. R&D Management Journal 37 (3), 221–236.
Taylor, T.K. 2000. A Transaction Cost Approach to Offsets In Government Procurement. E. Claiborne Robins School of Business: University of Richmond
The Offset Guidelines Quarterly Bulletin (Offset QB), (3) October 2009
industry insights
27
January 2012
MALAYSIA’S SHIPBUILDING INDUSTRY – SHIFTING TOWARD SUSTAINABILITY
Anuar Mohd noorPrincipal AnalystIndustry Intelligence & [email protected]
cover story
28
January 2012

InTRODUcTIOnThe shipbuilding industry in Malaysia can be defined as those enterprises that are involved in designing, building and constructing, converting and upgrading of vessels as well as marine equipment manufacturing. In this case, ‘vessels’ means various types of ships such as ocean going, near coastal, government, passenger, offshore and fishing vessels, whereas ‘marine equipment’ means parts and components that are fitted and integrated to form the sub-systems and systems of a vessel.
The shipbuilding industry, as addressed in the Third Industrial Master Plan (IMP3), is part and parcel of the marine transport sub-sector of the larger transport equipment industry. Structurally, the shipbuilding industry serves the shipping industry in terms of building and supplying new vessels to vessels operator or ship owners. In ensuring the safety of maritime operations as well as seaworthiness, the shipbuilding activities are regulated in accordance with the international standards and the local regulations.
gLOBAL ScEnARIOGlobally, the industry has seen an emerging giant vis-a-vis China taking over Korea as the world’s largest shipbuilding nation in terms of the number of vessels produced. It is interesting to observe that percentagewise, China together with Korea and Japan represent 85% of the world’s total order book of new shipbuilding.
Year 2009 recorded the lowest number of demand for new vessels, understandably in response to the global economic crisis. Prior to the slowdown, order for new vessels peaked in September 2008 with 11,661 ships in the pipeline. Two thirds of the new build demands were made by corporations operating ocean going vessels such as tankers, bulkers and containers, followed by liquefied natural gas (LNG) carriers or liquefied petroleum gas (LPG) carriers and cruise ships. However, when the recession hit hard on businesses, the global shipbuilding industry recorded a 40% decline, leaving only 6,914 ship orders to fulfil. With economic recovery plans taking the right course, the global demand for new vessels is expected to grow by 26% in the next few years. The case is however, not the same with large container ship and the LNG sectors.
The growth of the fleets around the world has a direct impact on the global demand for ship repair services since the more ships are in operation, the higher repair and maintenance work will be in demand. In fact, the five year statutory dry dock
repairs cycle for big ships with sizes longer than 300m are already taking up dock spaces through to 2015. This can only mean that ship repair sector is enjoying an upward trend steadily.
With offers of business incentives mainly in the form of cheap but skilled labour, the Philippines and India are rising to become shipbuilding nations in South East Asia. In their bid to climb up the ranks, they have been actively engaging different approaches to develop their shipbuilding industries. As a clear result of its foreign direct investment, the Philippines recorded USD420 million in its shipbuilding export in 2009. The Government of Philippines has laid down investor-friendly laws with attractive incentives to lure investors such as Hanjin of South Korea, Tsuneishi of Japan and Keppel of Singapore.
In India, domestic investors play a major role in developing its shipbuilding industry with USD5 billion worth of business dealings in 2009. This figure represents 250 new vessels built in 27 shipyards where eight of them are owned by the government while the rest belongs to the public sector. The Indian Government offers a 30% subsidy on all sales closed on foreign buyers and on local sales of ocean-going vessels of longer than 80 meters.
Singapore is riding high on its world class reputation for being the provider of choice for a broad spectrum of marine services which generates a turnover of SGD10 billion (USD7.7 billion) annually. Out of this, the island nation’s thriving
ship repair and ship conversion businesses have steadily contributed more than half of the total marine industry revenue. Apart from the well-known Keppel, Sembcorp Marine is expected to also significantly contribute to Singapore’s shipbuilding revenue once the new Sembawang Integrated Shipyard in Tuas is in operation from mid 2012.
LOcAL ScEnARIOShipbuilding industry in Malaysia has existed since the 1900s. The earliest Malaysian shipyard was built at Kuching Sarawak. It evolved from under-the-tree along Rajang River to a modern purpose-built yard in clusters near Sungai Bidut and Rantau Panjang in Sibu and Kuala Baram in Miri. In Peninsular Malaysia the shipyards are located in Lumut, Perak; Port Klang, Selangor; Kemaman, Terengganu and Pasir Gudang, Johor. Currently there are about 120 registered shipyards in Malaysia
Despite the fact that the industry is not widely known and, vessels made by local shipbuilders are sold world-wide, shipbuilding is actually a strategic industry due to its numerous spills over effects. It is recognized by the Organization for Economic Co-operation and Development (OECD) as having strategic importance in terms of employment generation, industry capacity and technological capability. Its technological content is directly linked to application in national security and defence. Shipbuilding is a highly capital intensive and technologically driven industry.
Ranking CountriesNumber of Vessels
In thousands of DWT Total as a % of
World TotalTotal Total
1 Greece 3150 186 095 162 15.96
2 Japan 3751 183 319 680 15.73
3 China 3633 104 452 389 8.96
4 Germany 3627 103 895 669 8.91
5 Republic of Korea 1200 44 883 318 3.85
6 United States 1865 41 290 755 3.54
7 Norway 1968 40 518 790 3.48
8 China, Hong Kong 680 34 441 871 2.95
9 Denmark 940 33 198 421 2.85
10 Singapore 985 32 609 444 2.8
22 Malaysia 480 12 439 130 1.07
Source: Review of Maritime Transport, 2010 Vessels of 1,000 GT and above
cover story
29
January 2012

Shipbuilding Cluster in Malaysia
Briefly, the Malaysian shipbuilding cluster can be described as follows:
East Malaysia Cluster – Specializes in steel vessel building of offshore supply, tug, and barge and river ferry. These shipyards were developed most cost-effective, dynamic and viable exporter due to its proximity to its market which is the oil and gas sector. Most of the yards are quite innovative in term of design, building process and material sourcing due to its isolated locations.
Peninsular Malaysia Cluster – Specializes in both steel and aluminium vessel buildings for government and oil and gas. A great number of them have no experience outside government projects, thus becoming less competitive. Compared to their East Malaysia counterparts, most builders in Peninsular Malaysia have not developed as cost-effective and viable exporter.
In terms of product, Malaysia’s small vessel buildings normally involve simple low cost fiberglass boats mainly for the fishing and tourism industries. The medium-sized vessel building includes offshore support vessels (OSV), tugs, barges, patrol crafts and the likes. Large vessel building on the other hand, has seen better days and is fast ceasing in business. This is mainly due to the Malaysian Marine and Heavy Engineering (MMHE) strategy to focus only on repair and conversion which leaves Boustead as the last standing large vessel builder. If large vessel building is relying heavily on government projects, companies in this category may lose their capability to compete healthily in the global market.
Last year, the shipbuilding industry in Sarawak was highly vibrant. It contributed RM762
million in external trades. Sarawak shipyards are responsible for putting Malaysia in the world map as an effective low cost shipbuilder with products accepted worldwide. Most of the shipyards are in the form of family business runs by their second or third generation family members. Compared to their counterpart in Peninsular Malaysia, Sarawak shipyards are more organized but most of them do not market the vessels they make themselves. They rely on brokers from Singapore to market and export their products to Indonesia, Australia and European countries.
The capacity of shipyards and marine equipment manufacturers in Malaysia ranges from construction and maintenance of steel, aluminium or composite vessels with medium to complex sub-systems. They also have the capability to design simple small and medium size vessel. For vessel with complex designs such as Anchor Handling Tug with Dynamic Positional (DP), Offshore Supply Vessel of more than 50 meter length, and Hopper Dredger etc., the shipyards still have to acquire the platform and system designs from foreign countries. In Oil and Gas sector, Malaysia shipyards have the capability to offer a one-stop-centre for marine conversion that includes modification and upgrading design like Floating Production Storage & Offloading (FPSO), FSO, MOPU and MODU.
STRATEgIc AnALYSISThe shipbuilding industry in Malaysia does not evolve by itself. For it to grow and be competitive, a comprehensive development plan would have to be formulated and implemented. The factors for consideration would be: Policy, Institutional Framework, Regulatory Framework, Design
and Technology, Human Capital, Finance and Incentives.
Policy – Although the policy to develop Malaysia as a maritime nation is in place, it does not really address the growth of the local shipbuilding industry.
Malaysia need to take advantage of the opportunity to enlarge the industry as Malaysia is situated near major shipping lanes and 95% of the country’s trade is transported by sea. For the shipbuilding in the industry to grow, it may be wise to review the restriction of domestic waterborne trade by extending the rules from only ‘own flagged’ to ‘build by local’ vessel.
Institutional Frameworks – There are several Government agencies established to look into maritime related matters. However, none of these agencies are concerned with the well-being of shipbuilding industry. A division within Ministry of International Trade (MITI) which is tasked to formulate policies and strategies for the development of Transport and Equipment sector is the closest one can get.
Currently, there is no inter-ministerial at national level platform that discuss matters concerning the development of the shipbuilding industry. The two councils, namely National Maritime Council
cover story
30
January 2012

and National Shipping Council, are having a Term of Reference that does not cover the shipbuilding activities. To-date, the only Government platform that discusses the interest of shipbuilding industry is the Maritime Working Group of Malaysian Industry for Defence, Enforcement and Security (MIDES) under the Ministry of Defence. However, there are non-government agencies (NGOs) that represent their interests of the shipbuilders. They are the Association of Marine Industry of Malaysia (AMIM), Miri Shipyard Association and Sibu Shipyard Association.
Regulatory Frameworks – The framework that regulates the industry has to be strengthened. At the same time it has to be industrial friendly. The marine department should be empowered to regulate safely measures, encourage innovation, ensures the maximum usage of local content and design in vessels built use on domestic routes and inland waterways. Non-convention rules and local regulations may be formulated and regulated for newly built vessels for such routes and waterways.
A competitive analysis of this industry can be summarised as follows:
Design / Technology – Malaysia has sufficient local design houses to support the shipbuilding industry. With the existence of Ship Model Testing Laboratory at University Technology Malaysia, Malaysian designers can satisfy the needs of ship owners as well as increase local content in Malaysian-built vessels.
Another aspect that needs to be stressed on the shipbuilding technology is the migration into modular building method. By doing this, shipyards in Malaysia will have the capability and capacity to undertake to build large and complex vessel.
Human Capital – With the continuous uptrend of Oil and Gas (O&G) sector development, the migration of trained engineers and skilled workers
e.g. welders and fitters to this sector have affected severely the workforce needs of the shipbuilding industry. Although workforce migration into O&G is good for Malaysia’s high income agenda, other alternatives for shipbuilding industry are necessary.
An immediate solution to fill the vacuum created by migration of workers is necessary. One of the
cover story
31
January 2012

is awarded Bona Fide status. The exemption covers the import of raw materials, components, machineries and equipment directly used in shipbuilding activities.
WAY FORWARDMoving forward, the shipbuilding industry must aimed at capturing bigger world’s new build market whilst maximizing all opportunities from the domestic demands for small to medium-sized vessels less than 120m. In achieving this, there is a requirement for the enforcement of appropriate policies to protect the local players so that the home market is effectively used as a catalyst to increase the rate of industrial growth and its strategic agenda to capture more international market.
As far as cost is concerned, local players have to be able to offer competitive price. This can be achieved if the shipbuilding industry maximizes the local contents in 3 aspects of shipbuilding i.e. design and engineering, raw materials/sub-systems/equipment and labour. And finally, to improve on delivery, the industry must have the ability to meet the expected lead time and turn-around time. To make these possible, the government have to remove non-
solutions is to employ foreign workers. Some of the yards in East Malaysia have started doing it. However, due to some rigid rules on work permit for certain nationalities, some yards have employed them illegally.
Finance – Continuous availability of funds to finance new build projects is key to the growth of this industry. Global Maritime Ventures under Bank Pembangunan is the only government incentive available to develop the national shipping sector by jointly acquiring vessels with local partners. However a control mechanism needs to be put in place to minimize the use of Malaysian funds to build vessels in foreign yards as well as encourage indigenous design.
Incentive – It is unfortunate for shipbuilding industry as it is no longer classified as the ‘promoted activities’ under Promotion of Investment Act 1986. Not being classified as ‘promoted activities’ under this Act means players, either local or foreign’ are not eligible for tax holiday when they initiate a new investment project or re-invest in an existing project. The only tax incentive currently enjoyed by the shipbuilders is the tax exemption of import duties and sale tax, provided the company
value add bureaucratic barriers while at the same time the industry should adopt new processes and technologies to increase productivity and speed.
It is essential for shipbuilding industry to uphold its competitiveness if it is to survive through 2020 due to fierce competition from other countries in the region such as Vietnam, Indonesia, Singapore and Philippines as well as China. For shipyard to survive they should have the ability to satisfy ship owners’ demand for quality, cost and delivery expectations are the main factors for survival.
In our quest to uphold the importance of the shipbuilding industry as a strategic contributor to the nation’s economy, the direction that the industry moves will be guided by the following seven strategies:
• Establishment of business-friendly policies that support the growth of the industry
• Strengthen of the institutional framework
• Reinforcement of the regulatory framework to assure the integrity of the shipbuilding local companies and the quality of their products
• Attracting and preparing adequate and capable workforce
• Applying local design and adopting new shipbuilding technologies
• Improving financial and incentive packages in addition to promote of inward investments
• Upgrading competency and the level of sophistication of the industry
Malaysia shipbuilding industry will and can be globally competitive and contribute substantially to the nation’s economy if right policy and strategy is formulated and implemented with all stakeholders working together and unite behind a bold vision. It is not impossible that by 2020, Malaysia’s shipbuilding industry will be a major player, particularly in small to medium-sized shipbuilding market, renowned for quality and high technology products and services.
Launching of Malaysian Shipbuilding/Ship Repair Industry Strategic Plan 2020 By YAB Dato’ Sri Mohd Najib Tun Abdul Razak on 6th December during LIMA 2011
Malaysia shipbuilding industry will and can be globally competitive
and contribute substantially to the nation’s economy if right
policy and strategy is formulated and implemented with all
stakeholders working together and unite behind a bold vision.
cover story
32
January 2012

DRIVING TECHNOLOGICAL CATCH UP IN THE
IC INDUSTRY IN MALAYSIA
BYProfessor Rajah Rasiah D. Phil. (Cambridge)Chair of Regulatory Studies and Professor of Technology and Innovation PolicyUniversity of [email protected]
trends & issues
33
January 2012

When American firms first relocated integrated circuit (IC) assembly in East Asia, Taiwan, Korea and Singapore were the first beneficiaries in the 1960s followed by Malaysia and the Philippines in the early 1970s. National Semiconductor was the first to relocate assembly in Penang, Malaysia in 1971 (Rasiah, 1988). The national firms of Carsem, Unisem and Globetronics emerged in the 1980s and 1990s subsequently in assembly and test activities before Silterra and 1st Silicon began wafer fabrication since 2000.
Whereas Korea, Singapore and Taiwan have evolved into important bases for wafer fabrication and designing, Malaysia has only managed a thin entry into such activities by 2010. In addition, Korea has also become a major research bastion of research and marketing since the 1990s, especially Samsung Semiconductor, which has become the second most investor in R&D and famous brand name in IC markets in the world. Despite significant advances in assembly, test and wafer fabrication activities and government efforts to promote upgrading especially since 1990s both foreign and national firms in Malaysia largely specialize in relatively low value added activities (see Rasiah, 2010).
This article attempts to use an inductive evolutionary approach through a typology of taxonomies and trajectories where Malaysia stands now and how it can reach the technology frontier in ICs
Ic PRODUcTIOn In MALAYSIA, KOREA AnD TAIWAnMalaysia enjoyed a fairly reasonable IC trade surplus in 1990, which fell dramatically to become negative in 2000 and 2007 (see Figure 1). The surplus in 1990 was largely achieved through profits recorded by foreign multinationals that then repatriated a significant share of it back to their parent firms abroad. Also, the incentive structure in that year – through pioneer status and investment tax credits - was favorable for a number of firms to record higher profits by transfer pricing to tax havens such as Malaysia. Hence, the trade balance reversed to become negative once the tax incentives evaporated.
Whereas Korea has enjoyed a positive IC trade surplus, Taiwan’s showed a dramatic improvement from being negative in 1990 to record the highest balance among the three countries in 2007. Given the dominance of national firms in these countries
the expansion of surpluses reflects significant improvements in the capability of national firms.
In addition, while the take up of patents by Korean and Taiwanese IC firms has risen sharply, that of Malaysian firms are too small to be registered (see Figure 2). Samsung, Taiwan Semiconductor Manufacturing Corporation (TSMC), United Microelectronics Company (UMC) and Hynix became among the eight top IC patent takers in the United States since the turn of the millennium.
In contrast, Malaysian firms have registered very few IC patents in the United States. Silterra took 15 patents by 2006 but has since not taken any in the United States. Nevertheless, there are signs of improvement as Silterra increased its investment into designing to 20 percent of annual expenditure in 2010. Interviews show that the firm appears capable of moving up the technology trajectory if more money is made available for R&D and more R&D and designing engineers are made available.
IC Trade Balance, Malaysia, Korea and Taiwan, 1990-2007Figure 1
Note: Trade balance computed with the formular: (exports-imports)/ (exports+imports).Source: WTO (2010: Appendix Tables 11.55 and 11.56).
Malaysian firms have registered very few IC patents with Silterra
registering 15 patents by 2006 but has since not taken
any in the United States.
0.200
0.150
0.100
0.050
0.000
-0.050
-0.100
-0.150
-0.200
-0.250
-0.300
0.063
-0.134
-0.073
0.081 0.0930.070
-0.257
-0.043
0.151
MALAYSIA
KOREA
TAIWAN
199020002007
trends & issues
34
January 2012

Patents granted in the United States, top IC firms, 1982-2009 (Numbers)Figure 2
Source: USPTO (2010)
Malaysian firms also did not figure among the top revenue earners among IC firms (see Table 1). Nevertheless, Silterra has done well to raise its revenue from US$150 million in 2007 to US$180 million in 2010.
Overall, it can be seen that national firms in Malaysia can learn considerably by looking at the trajectories of national IC firms in Korea and Taiwan. Not only have the lead firms in Korea and Taiwan outperformed national firms in Malaysia, they have also reached the technology frontier in a number of product segments.
MAPPIng cOMPOnEnTS OF Ic PRODUcTIOnAttempts to draw for Malaysia would require a profound understanding of the structural composition of the IC industry. Typical of evolutionary approaches any attempt to map IC production would require unbundling its various components as it has evolved and locate them by scale, risk and uncertainty involved, and by knowledge intensities.
INTEL (US)
TEXAS INSTRUMENTS (US)
ADVANCED MICRO DEVICES (US)
TAIWAN SEMICONDUCTOR MANUFACTURING CORPORATION
UNITED MICROELECTRONICS CORPORATION
SAMSUNG ELECTRONICS CO.LTD.
HITACHI
HYNIX SEMICONDUCTOR INC
NOTE: * Because TSMC is a contract manufacturer it does not produce and sell its own chips.Source: RMG and Associates (n.d) http://www.maltiel-consulting.com/Semiconductor_Q2_09_ growth_maltiel_semiconductor.html, downloaded on October 4, 2010
NATION2005 2008
REVENUE RANK REVENUE RANK
INTEL United States 35395 1 34490 1
SAMSUNG ELECTRONICS Korea 17838 2 20272 2
TEXAS INSTRUMENTS United States 11300 3 11618 3
TSMC* Taiwan 8217 8 10556 4
TOSHIBA Japan 9045 4 10422 5
STMICROELECTRONICS Italy 8870 5 10325 6
RENESAS TECHNOLOGY Japan 8266 7 7017 7
QUALCOMM United States 3457 18 6477 8
SONY Japan 6420 9
HYNIX SEMICONDUCTOR Korea 5599 10 6182 10
INFINEON TECHNOLOGIES Germany 8297 6 5903 11
AMD United States 3936 16 5808 12
World’s top integrated circuits firms by revenue, 2005 and 2008 (US$ Millions)Table 1
trends & issues
35
January 2012
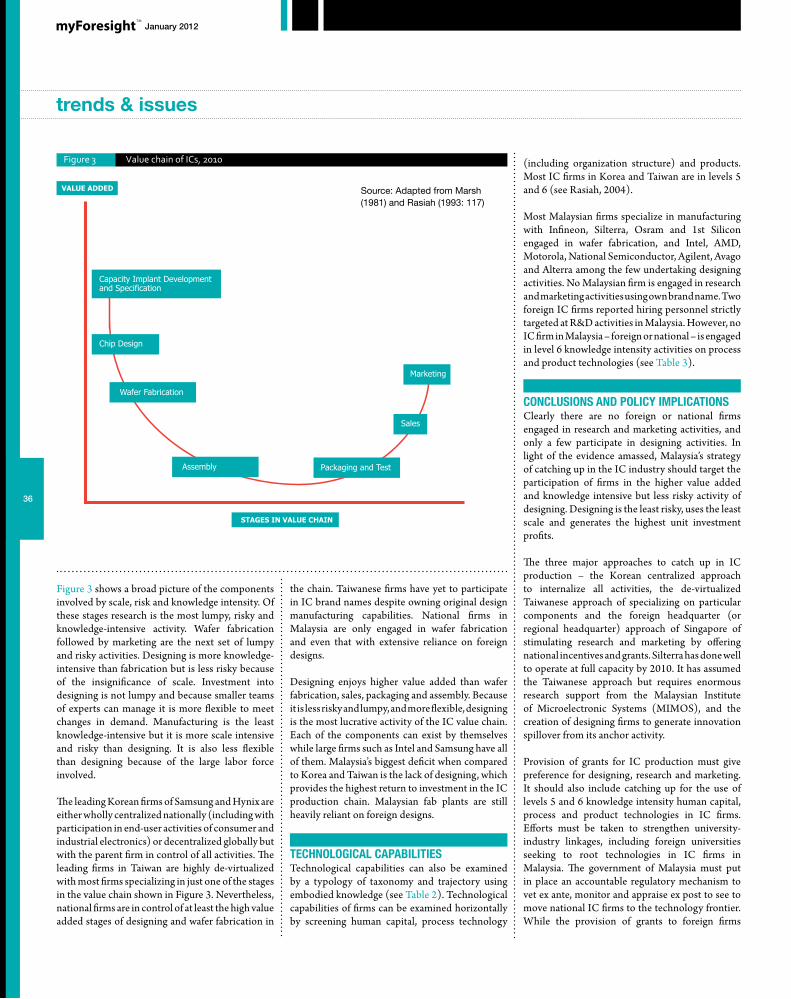
Figure 3 shows a broad picture of the components involved by scale, risk and knowledge intensity. Of these stages research is the most lumpy, risky and knowledge-intensive activity. Wafer fabrication followed by marketing are the next set of lumpy and risky activities. Designing is more knowledge-intensive than fabrication but is less risky because of the insignificance of scale. Investment into designing is not lumpy and because smaller teams of experts can manage it is more flexible to meet changes in demand. Manufacturing is the least knowledge-intensive but it is more scale intensive and risky than designing. It is also less flexible than designing because of the large labor force involved.
The leading Korean firms of Samsung and Hynix are either wholly centralized nationally (including with participation in end-user activities of consumer and industrial electronics) or decentralized globally but with the parent firm in control of all activities. The leading firms in Taiwan are highly de-virtualized with most firms specializing in just one of the stages in the value chain shown in Figure 3. Nevertheless, national firms are in control of at least the high value added stages of designing and wafer fabrication in
the chain. Taiwanese firms have yet to participate in IC brand names despite owning original design manufacturing capabilities. National firms in Malaysia are only engaged in wafer fabrication and even that with extensive reliance on foreign designs.
Designing enjoys higher value added than wafer fabrication, sales, packaging and assembly. Because it is less risky and lumpy, and more flexible, designing is the most lucrative activity of the IC value chain. Each of the components can exist by themselves while large firms such as Intel and Samsung have all of them. Malaysia’s biggest deficit when compared to Korea and Taiwan is the lack of designing, which provides the highest return to investment in the IC production chain. Malaysian fab plants are still heavily reliant on foreign designs.
TEcHnOLOgIcAL cAPABILITIESTechnological capabilities can also be examined by a typology of taxonomy and trajectory using embodied knowledge (see Table 2). Technological capabilities of firms can be examined horizontally by screening human capital, process technology
(including organization structure) and products. Most IC firms in Korea and Taiwan are in levels 5 and 6 (see Rasiah, 2004).
Most Malaysian firms specialize in manufacturing with Infineon, Silterra, Osram and 1st Silicon engaged in wafer fabrication, and Intel, AMD, Motorola, National Semiconductor, Agilent, Avago and Alterra among the few undertaking designing activities. No Malaysian firm is engaged in research and marketing activities using own brand name. Two foreign IC firms reported hiring personnel strictly targeted at R&D activities in Malaysia. However, no IC firm in Malaysia – foreign or national – is engaged in level 6 knowledge intensity activities on process and product technologies (see Table 3).
cOncLUSIOnS AnD POLIcY IMPLIcATIOnSClearly there are no foreign or national firms engaged in research and marketing activities, and only a few participate in designing activities. In light of the evidence amassed, Malaysia’s strategy of catching up in the IC industry should target the participation of firms in the higher value added and knowledge intensive but less risky activity of designing. Designing is the least risky, uses the least scale and generates the highest unit investment profits.
The three major approaches to catch up in IC production – the Korean centralized approach to internalize all activities, the de-virtualized Taiwanese approach of specializing on particular components and the foreign headquarter (or regional headquarter) approach of Singapore of stimulating research and marketing by offering national incentives and grants. Silterra has done well to operate at full capacity by 2010. It has assumed the Taiwanese approach but requires enormous research support from the Malaysian Institute of Microelectronic Systems (MIMOS), and the creation of designing firms to generate innovation spillover from its anchor activity.
Provision of grants for IC production must give preference for designing, research and marketing. It should also include catching up for the use of levels 5 and 6 knowledge intensity human capital, process and product technologies in IC firms. Efforts must be taken to strengthen university-industry linkages, including foreign universities seeking to root technologies in IC firms in Malaysia. The government of Malaysia must put in place an accountable regulatory mechanism to vet ex ante, monitor and appraise ex post to see to move national IC firms to the technology frontier. While the provision of grants to foreign firms
STAGES IN VALUE CHAIN
Capacity Implant Development and Specification
Chip Design
Sales
Wafer Fabrication
Assembly Packaging and Test
Marketing
VALUE ADDED
Value chain of ICs, 2010Figure 3
Source: Adapted from Marsh (1981) and Rasiah (1993: 117)
trends & issues
36
January 2012

should be maintained preference should be given to national firms as it leads to greater rooting at host-sites. Foreign firms should also be required to demonstrate technology transfer – through criteria such as subcontract activities to national firms, exposure of national human capital to high technology (including in R&D) and outsourcing of knowledge-based activities to national labs and universities.
Typology of Firms by Taxonomy and TrajectoryTable 2
Source: Adapted from Marsh (1981) and Rasiah (1993: 117)
References
Marsh, P. (1981) the Silicon Chip Book, London: Sphere Books.
Rasiah, R. (1988) “The Semiconductor Industry in Penang:
Implications for the New International Division of Labour Theories,”
Journal of Contemporary Asia, 18(1): 24-46.
Rasiah, R. (1993) Pembahagian Kerja Antarabangsa: Industri
Separa Konduktor di Pulau Pinang, Kuala Lumpur: Malaysian
Economic Association.
Rasiah, R. (2004) “Technological Capabilities in East and Southeast
Asian Electronics Firms: Does Network Strength Matter?”, Oxford
Development Studies, 32(3): 433-454.
Rasiah, R. (2010) “Are Electronics Firms in Malaysia Catching Up in
the Technology Ladder?”, Journal of Asia Pacific Economy, 15(3):
301-319
RMG and Associates (n.d) http://www.maltiel-consulting.com/
Semiconductor_Q2_09_growth_maltiel_semiconductor.html,
downloaded on October 4, 2010.
USPTO (2010) “Patent Data”, downloaded from http://www.uspto.
gov/ on January 12, 2011.
WTO (2010) International Trade Statistics, Geneva: World Trade
Organization.
KNOWLEDGE DEPTH HR PROCESS PRODUCT
SIMPLE ACTIVITIES (1)
On the job and in-house training
Dated machinery with simple inventory control techniques
Assembly or processing of component, CKD and CBU using foreign technology
MINOR IMPROVEMENTS (2)
In-house training and performance rewards
Advanced machinery, layouts and problem solving
Precision engineering
MAJOR IMPROVEMENTS (3)
Extensive focus on training and retraining; staff with training responsibility
Cutting edge inventory control techniques, SPC, TQM, TPM
Cutting edge quality control systems (QCC and TQC) with original equipment manufacturing (OEM) capability
ENGINEERING (4)
Hiring engineers for adaptation activities; Separate training department
Process adaptation: layouts, equipment and techniques
Product adaptation
EARLY R&D (5)
Hiring engineers for product development activities; Separate specialized training activities
Process development: layouts, machinery and equipment, materials and processes
Product development capability. Some firms take on original design manufacturing (ODM) capability
MATURE R&D (6)
Hiring specialized R&D scientists and engineers wholly engaged in new product research
Process R&D to devise new layouts, machinery and equipment prototypes, materials and processes
New product development capability, with firms taking on original brand manufacturing (OBM) capability
Knowledge Depth, IC Firms, Malaysia, 1974-2010Table 3
Source: Compiled from Author’s research (1986, 2008, 2011)
Source: Rasiah (2010:379)
YEARKNOWLEDGE
DEPTHHUMAN
RESOURCEPROCESS
TECHNOLOGYPRODUCT
TECHNOLOGY
1974
1 10 10 10
2 10 10 8
3 3 4 2
1990
1 12 12 12
2 12 12 12
3 12 12 12
4 10 10 7
5 3 3 0
2010
1 12 12 12
2 12 12 12
3 12 12 12
4 12 12 12
5 7 9 9
6 2 0 0
In light of the evidence amassed, Malaysia’s strategy of catching
up in the IC industry should target the
participation of firms in the higher value
added and knowledge intensive but less risky
activity of designing
trends & issues
37
January 2012

Personal Rapid Transit or PRT is an elevated monorail system with driverless six passenger electric car. These would be controlled and routed by a sophisticated computer system.
Passengers travel with people of their choosing. The PRT approach customised individual route precisely to the final destination.
The PRT Shuttle solves the “last mile” problem, connecting different multimodal transportation alternatives to final destinations. It provides non-stop, no-wait, 50 kph short feeder shuttle services operating in highly populated areas such as airports, shopping centers, and campuses. Stations are located along the route to minimize walking once the trip ends. These stations would be placed off the mainline of the guideway, so that the little vehicles could access the station and embarking or disembarking passengers without stopping other PRT traffic on the main guideway. The light weight vehicle used by the PRT greatly reduces the infrastructure cost.
Modern PRT concepts began around 1953 when Donn Fichter began research on PRT. In 1964,
Fichter proposed an automated public transit system for areas of medium to low population density. One of the key points was that people would not leave their cars for public transit unless the system offered flexibility and shorter end-to-end transit. He felt only a PRT could fulfil these requirements. This approach requires a relatively vast network of guideways and stations
Repeated attempts to implement a working PRT system, even in very small-scale scenarios, have failed. Not a single promotional efforts over the past 40 years, has seen successful implementation even in a small test application, much less in a citywide rapid transit application. Early PRT installations, such as the AirTrans system at Dallas-Ft. Worth Regional Airport, and the PRT at West Virginia University at Morgantown, were implemented as line-haul automated guideway transit (AGT). These were not true PRT system of small-vehicle offering customized services.
The capacity problem has proven to be PRT’s Achilles heel. SkyWeb Express (Taxi 2000) claims the capability of operating at one-second headway and conveying as many as 10,800 passengers per
hour in fully loaded 3-person vehicles. The close headways are questionable for vehicles operating at up to 80 kph. The Morgantown “PRT” system has minimum headways of 15 sec.
PRT station logistics present formidable constraint to PRT operations and capacity. The vehicle traffic jams at the Dallas-Ft. Worth Regional Airport are serious operational problems. Even with larger sized vehicles, AirTrans system operators found that passenger surges would create traffic logjams and fouling the mainline guideway with queues of small vehicles waiting to get into the small stations,.
Technical problems and inherent capacity constraints have dampened past interest in PRT. The issue of cost overruns were more damaging. After more than four decades there is still no working, commercially viable, publicly accessible urban installation which actually implements the core PRT concept of automobile-sized vehicles whisking passengers directly from individual origin points to customized, individual destinations.
As a potentially emergent technology, PRT should be given an opportunity to prove itself. The best
Does PRT Have A Place In The Greater KL Transportation Infrastructure?
1. First generation system in Morgantown
2. The PRT test track in Uppsala
3. The PRT vehicle developed for the Masdar Eco-city project in Abu Dhabi
4. PRT at London’s Heathrow Airport, UK
BYIR. DR. AZIZ [email protected]
1
2
3
4
trends & issues
38
January 2012
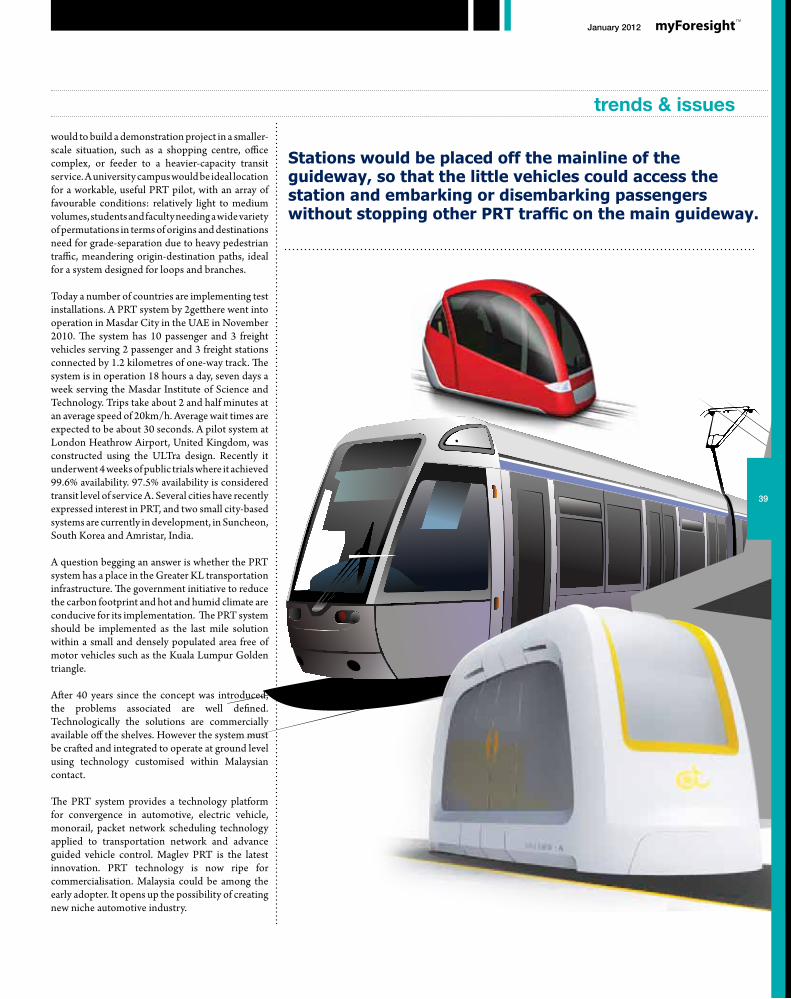
would to build a demonstration project in a smaller-scale situation, such as a shopping centre, office complex, or feeder to a heavier-capacity transit service. A university campus would be ideal location for a workable, useful PRT pilot, with an array of favourable conditions: relatively light to medium volumes, students and faculty needing a wide variety of permutations in terms of origins and destinations need for grade-separation due to heavy pedestrian traffic, meandering origin-destination paths, ideal for a system designed for loops and branches.
Today a number of countries are implementing test installations. A PRT system by 2getthere went into operation in Masdar City in the UAE in November 2010. The system has 10 passenger and 3 freight vehicles serving 2 passenger and 3 freight stations connected by 1.2 kilometres of one-way track. The system is in operation 18 hours a day, seven days a week serving the Masdar Institute of Science and Technology. Trips take about 2 and half minutes at an average speed of 20km/h. Average wait times are expected to be about 30 seconds. A pilot system at London Heathrow Airport, United Kingdom, was constructed using the ULTra design. Recently it underwent 4 weeks of public trials where it achieved 99.6% availability. 97.5% availability is considered transit level of service A. Several cities have recently expressed interest in PRT, and two small city-based systems are currently in development, in Suncheon, South Korea and Amristar, India.
A question begging an answer is whether the PRT system has a place in the Greater KL transportation infrastructure. The government initiative to reduce the carbon footprint and hot and humid climate are conducive for its implementation. The PRT system should be implemented as the last mile solution within a small and densely populated area free of motor vehicles such as the Kuala Lumpur Golden triangle.
After 40 years since the concept was introduced, the problems associated are well defined. Technologically the solutions are commercially available off the shelves. However the system must be crafted and integrated to operate at ground level using technology customised within Malaysian contact.
The PRT system provides a technology platform for convergence in automotive, electric vehicle, monorail, packet network scheduling technology applied to transportation network and advance guided vehicle control. Maglev PRT is the latest innovation. PRT technology is now ripe for commercialisation. Malaysia could be among the early adopter. It opens up the possibility of creating new niche automotive industry.
Stations would be placed off the mainline of the guideway, so that the little vehicles could access the station and embarking or disembarking passengers without stopping other PRT traffic on the main guideway.
trends & issues
39
January 2012

With the rise of total population, massive urbanisation, better household income and increase in economic activities, large concentrations of people can have a positive influence on future mobility. The OECD report on global transport outlook showed that mobility has increased three times globally.
The world economy is growing even more strongly than the world population, especially international trade in the China, India and other emerging economies. If the growth continues on its recent trajectory, it could account for more than half of global Gross Domestic Product (GDP), trade and investment, and enjoy widespread affluence by 20504.According to Deutsche Bank, the worldwide
export of goods as a share of the worldwide production of goods has increased from about 10 to over 25 per cent.
The mobility of people and goods leads to the rapid increase of demand for transport services.
In rail transportation sector, China and India show sustained growth in both passengers and freight traffic. The growth of rail traffic is found to be much stronger in the emerging economies, while in countries such as the EU 15, US and Japan the growth is slower but stable. The general trend in rail transportation is that the growth in freight transport is much stronger than the passenger transport.
Rail transport could be the best mode of transportation for the future as it is found to be
Growing Urban Population3Figure 1
MEGATRENDS IN RAILWAYS
Urban congestion, population growth and rising energy cost are fuelling the growth in the global demand of rail transportation. The world population in 2011 is 7.0 billion and is expected to increase to around 9.2 billion in 20501. It has been a general trend since 2007 that more and more chose to live in towns and cities compared to rural areas. Therefore, the population is not only growing but also becoming increasingly concentrated in a few locations2.
URBAN POPULATION
RURAL POPULATION
1Population Division of the Department of Economic and Social Affairs
of the United Nations Secretariat, World Population Prospects: The
2006 Revision and World Urbanization Prospects: The 2007 Revision2OECD, Transport Outlook: Meeting the Needs of 9 Billion People,
20113Population Division of the Department of Economic and Social Affairs
of the United Nations Secretariat, World Population Prospects: The
2006 Revision and World Urbanization Prospects: The 2007 Revision4Asian Development Bank, Asia 2050: Realizing the Asian Century,
2011
1980
2.7
1.7
4.4
1985
2.9
2.0
4.9
1990
3.0
2.3
5.3
1995
3.2
2.6
5.8
2000
3.3
2.9
6.2
2005
3.4
3.2
6.6
2010
3.4
3.5
6.9
2015
3.5
3.8
7.37.7
8.08.4 8.5
8.89.1
9.2
2020
3.5
4.2
2025
3.4
4.6
2030
3.4
5.0
2035
3.2
5.3
2040
3.1
5.7
2045
3.0
6.1
2050
2.8
6.4
10
8
6
4
2
0
70%
BYMohd Afzanizam Mohd [email protected]
trends & issues
40
January 2012

the most environment-friendly. It only accounts for 0.5% of emissions7. To the extent that rail transport was identified as a potential solution to world-scale energy or emissions problems. Its energy consumption is also very low although the consumption of passenger trains is found to be
World population and world trade5 Figure 2
Integration of rail transportFigure 4
Distribution of passenger and surface freight mobility in 2000 and 2050: Share of OECD and non-OECD countries6 Figure 3
twice the amount consumed by freight trains. This is because passenger trains tend to be less heavily loaded than freight trains8.
The scale of rail transport growth sees the need for it to be integrated with all existing modes of transport.
The integration will create greater capacities of rail transport services for the future. There will be less competition between rail transport and other modes of transport. Instead, there will be more efforts to efficiently combine the various means of transport transportation.
Shares of Passenger mobility (PKM),2000
Shares of Passenger mobility (PKM),2050
Shares of Freight Mobility (TKM),2000
Shares of Freight Mobility (TKM),2050
Interurban: Intercity & High Speed Transport
Commuter Transport
UrbanTransport
FreightTransport
1980� 1985� 1990� 1995� 2000
WORLD TRADE IN $1982 = 100
WORLD POPULATION1980 = 100
NON-OECD46% OECD
54%NON-OECD
78%
OECD22%
NON-OECD69%
OECD31%
NON-OECD48%
OECD52%
Index
trends & issues
41
January 2012

TRANSPORT MODE VEHICLE PRODUCTION FUEL USE TOTAL
(megajoules per passenger-kilometer)
LIGHT RAIL 0.7 1.4 2.1
BUS 0.7 2.1 2.8
HEAVY RAIL 0.9 1.9 2.8
CAR (GASOLINE) 1.4 3.0 4.4
CAR (DIESEL) 1.4 3.3 4.7
Infrastructure development is important for the economic growth of a nation. One of the important components of the infrastructure is transportation, and rail transport is seen as the most effective mode of transportation. This makes it necessary for the policy makers to review the transport infrastructure policy and plan at the regional and national level.
In most developing countries, rail transport is owned and runs by the government. However, the effort to reduce government expenditures and subsidies see more privatization of government utility services and projects. This leads to the formation of government link companies (GLCs) and public participation in infrastructure development.
A study by UNIFE indicates that rail control and infrastructure will display the highest growth among the market segments at around 3.0 %.
Increased investment in railways is needed to create rail capacity in high-density areas and to support the movement of a greater volume of traffic. This means more will be spent on modernisation of railway system, including increase rolling stock and other additions such as new tracks and gauge conversions.
The length of the worldwide rail network is some 1.2 million kilometres. The longest is the transcontinental overland routes in North America, followed by Asia and the Commonwealth of Independent States (CIS). However, most of the railway network is single-track, not electrified, and there are long sections that do not have any point of intersection with other lines9.
Railway electrification is greatly influenced by the uncertainty of energy industry. Many developing countries initiated rail electrification projects as an integral part of rail modernisation and strategies for carbon reduction, as well as to allow the introduction of a fast electric service. Studies showed that “an estimated 34% savings in energy could be achieved by using electric power. Electrification of just 10% of the (then) present rail trackage (in the densest traffic corridors) could result in a 40% reduction in railway diesel fuel consumption10.”
The electrification program radically affects the requirements for train rolling stock over the next decade. There will be far less need for diesel trains and a greater requirement for electric trains; hence the technology powering the railways needs to be evolved accordingly.
Electric trains are over 35% cheaper to operate than diesels11. This is due to the fact that less maintenance is required and the cost of energy is considerably lower since electricity is a significantly cheaper fuel
than diesel. As the electric train is lighter, it gives speed advantage with less damage to the track. Although there are additional costs involved in maintaining electrification infrastructure, these are significantly outweighed by the train operating cost savings.
There is strong growth predicted for rolling stocks especially in light rail and high speed rail. While
Existing infrastructure worldwide
Energy use by Urban Transport Mode12
Figure 5
Table 1
5UNO, Fischer Weltalmanach6International Transport Forum calculations using MoMo version 2011.7International Transport Forum calculations using MoMo version 20118Louis S. Thompson, A Vision for Railways in 2050, 20109Maria Leenen, SCI Verkehr GmbH: Worldwide Rail Market, October 200310Practical Guide, Chapter 9, American Railway Engineering and Maintenance-of-Way Association, viewed 7 December 2011, <www.arema.org/
publications/pgre/ Practical_Guide/PGChapter9.pdf>.11Network RUS: Electrification Strategy (Draft for Consultation), May 2009, Network Rail
http://www.networkrail.co.uk/.12IAPT, Better Urban Mobility in Developing Countries (Brussels: December 2003), p. 2213UNIFE/BCG, World Rail Market Study: Status quo and outlook 2020, May 2010
Western Europe showed low but stable growth of 1 - 2% of the market volume, Asia/Pacific registered strong growth in all transport segments. The high growth in high speed rail is contributed by the development in three countries namely China, Japan and South Korea13. However, more cities in Asia, including in Malaysia, are developing the infrastructure for light and high speed rail transport.
North America311,732km
Latin America108,474km
W.Europe176,685km
E.Europe83,710km
CIS193,925km
Asia263,384km
Africa/N&M East90,406km
Australia/Pacific63,523km
trends & issues
42
January 2012

Originating from an Arabic word, Halal is defined as permitted or allowed by Islamic law. JAKIM defines Halal in accordance to the definition of Order of the Trade Descriptions (Use of Expression “Halal”) 1975 are as follows:
When used in relation to food in any form in the course of trade or business as a trade description or as part of a trade description applied to food, the expressions ‘Halal’, ‘Borne Halal’ or ‘Muslim Food’ or any other expression which shows or may be read as indicating that Muslims are allowed by their religion to eat food that is the expression shall have the following meanings, namely food in relation to the expression or expressions are used:
1. Not consist of or contain any animal parts or products from which muslims are banned by islamic law to eat or not slaughtered according to islamic law;
2. Does not contain any substance declared to be unclean according to islamic law;
3. Not prepared, processed or manufactured using any device that is not free from these things unclean according to islamic law and
4. Not in the preparation, processing or storage, or close contact with any food that does not meet the requirements of paragraph (a), (b) or (c) or any substance declared to be unclean according to islamic law.
Due to the strict Islamic Law on permissible food, the Halal Industry emerged specifically and exclusively to cater the needs of the Muslims.
Hence, the need for Halal certification arose. Like many other industrial activities and trades many years ago, Halal Certification has been driven by the export business to Muslim countries. The first certified products were poultry, cookies and toothpaste. This expanded to frozen meat and poultry, processed meat and food service items.
THE gLOBAL PATHWAYEarlier on, the Halal Industry was primarily targeting the Muslim population that has been steadily increasing. Based on The Pew Forum on Religion & Public Life report, twenty years ago, the world had about 1.1 billion Muslims. The population trend reflects that twenty years from now, the Muslim population will increase by two fold - and they’ll represent more than a quarter of all people on earth, which indicated an increase from less than 20% in 1990. Pew further projected that Pakistan will overtake Indonesia as the home of the largest number of Muslims, as its population goes beyond 256 million. Additionally, Asia Pacific homes to some 1005 million Muslims, the largest Muslim population among the regions. And the trend continues to grow.
The increase of the Muslim demographics has generously contributed to the expansion of the global Halal Industry. The value of global Halal Market in
2010 was claimed to reach USD2.1 trillion. A study conducted by The Halal Journal indicated that the largest Halal market portion lies in the Asia region at the value of USD 418 billion, which is where the largest Muslim population resides.
The increasing awareness of the global community on food safety, security and health has further defined Halal from revolving mainly on food, to a broader perspective. Not too long ago, in non-Arabic-speaking countries, the term was most commonly used in the narrower context of just Muslim dietary laws, especially where meat and poultry are concerned. Today, Halal has become important in almost every sector of the market. It is interesting to note that the awareness has driven the cosmetics/personal care sector to thrive as the next new shiny toy of the Halal Industry. However, the agriculture sector which largely contributes to many resource-based countries is still recognized as one of the growth sector in the global Halal landscape.
THE ADvAncED HALAL gLOBAL MARKET vALUE cHAInGetting out of a niche-market to serve almost everyone in the world is not easy. Certain require-ments need to be accomplished in order to be widely accepted. Basically, the Halal products and services must endure four (4) strict requirements in order to
FUTURE OF HALALFROM NICHE TO MAINSTREAM
BYFARAH ABU [email protected]
The Halal Industry, which started out as a compliant to strict pre-requisites for Muslim consumptions and way of life, has now become a lucrative market that goes beyond geographical and religious borders.
viewpoints
43
January 2012

achieve the important missions to be in the center stage.
First, and most importantly, is the fulfillment of tedious global standards such as HACCP, EU Regu-lations, GMP, GHP etc. This shall indicate that the products are produced from a secured and hygiene supply chain environment and are traceable.
Reaching the upmarket which demands products to be safe, sensitive to ethnicity needs and environ-mental friendly is the next thing on the checklist. Accomplishing this means your products are not only traceable, but also of exceptional quality. By hitting these two (2) marks, the products are certainly closer to be in the mainstream, moving to influence the global trends.
It is clear that the trend of the market acceptance has moved from organic to green and popular. At this stage, Halal products which are already at a broader perspective will be a more popular choice regardless of culture and religion.
However, once the products have made a global presence, with diverse applications and varieties, as well as being widely accepted, we know that it has hit the mainstream.
One clear commercial example is nasyeed. Once upon a time, it was clearly a Dakwah tool amongst the Muslims themselves. Through musical revolu-tion and globalization, our once narrow-spectrum nasyeed has increased its popularity since the mid ‘90s. This was where we witnessed mushrooming local nasyeed groups such Raihan and Rabbani that is now enjoying global popularity of its unique nasyeed approaches. The trend continues to grow where we begin to see international acts such as Yusuf Islam, Maher Zain, Sami Yusuf and Mesut Kurtis, just to name a few, in the nasyeed scene. Today, the nasyeed sings more of humanity, peace and spiritual issues but still, in a delicate way, preaches the humankind towards all the goodness in the world.
Another fine example is the Islamic Banking and finance services. Over the years, the finance services has been improved and repackaged to attract more non-Muslims without compromising the Syariah laws. Now most commercial banks would offer Islamic Finance services to its clients. Today many has learnt that Islamic finance forges a closer link between real economic activity that creates value and financial activity that facilitates it. Islamic finance is global and cosmopolitan. Having com-mitted itself to a text accessible to all and prophetic precedents easily available, Islamic finance is open to any innovations that are in congruence with its fundamentals. It is not a closed system. It has no regional, ethnic or class affiliations.
Cosmetics/Personal Care
USD$ 177B f
64.6%
Islamic Finance
USD$ 25.0b***
9.1%
Agricultural (Food/Non Food)
USD$ 41.5B**
15.1%
Pharmaceuticals
USD$ 30.0B ff
11.0%
Travel Industry
USD$ 0.13B fff
0.1%
Logistic
USD$ 0.17B*
0.1%
Total Values for Halal New Growth ClustersUSD 274.1 Billion
North AmericaUSD 15.3 Billion
CENTRAL&SOUTH AMERICA
USD 0.82 Billion
EuropeUSD 69.3 Billion
AsiaUSD 418.1 Billion
AfricaUSD 155.9 Billion
Australia/PacificUSD 1.6 Billion
REgIOn POPULATIOn(Million)
Europe 44.1
Sub Saharan African
242.5
Middle East-north Africa
321.9
Asia Pacific 1005.5
Americas 5.3
Percentages are calculated from unrounded numbers. Cross hatching denotes projected figuresPew Research Center’s Forum on Religion & Public Life. The Future of the Global Muslim Population, January 2011
10 Billion
8
6
4
2
01990
1.1B
4.2B
4.8B
5.3B
5.8B
6.1B
2000
1.3B
2010
1.6B
2020
1.9B
2030
2.2B
MUSLIMS
NON MUSLIMS
19.9%21.6%
23.4%24.9%
26.4%of world population is Muslim
Muslims as a Share of World Population, 1990-2030
Source: Halal Industry Development Corporation (HDC)
viewpoints
44
January 2012

earlier on due to terrorism (which was supposedly connected to Islam), a large share of meat sold in Britain are imported from New Zealand, where the slaughterhouses have expanded Halal production as they try to boost their already robust exports to Islamic countries.
The Halal industry in the Middle East is estimated to be worth more than 73 billion UAE dirham (USD19.8billion), according to industry reports. Middle East countries, especially the members of the Cooperation Council for the Arab States of the Gulf (GCC), have higher incomes and consequently higher per capita rates of consumption. In addition, the region must import 80% of its food requirements. Saudi Arabia and the United Arab Emirates (UAE) are seen as the most important import markets in the region. Currently Brazil is the largest exporter to the two countries followed by the EU and the US. Saudi Arabians companies involved in the Halal
industry include Al-Radwa Farms, Al- Watania, Supreme Foods, Nash Meat and Sunbullah. UAE companies involved in the Halal industry include Almarai, Al-Islami Foods, Al-Babeer, Al-Areesh, Arctic Gold, Royal Meat and Emirates Meat. Turkey is a growing Halal market and a potential supplier of Halal products, particularly to EU countries with large Muslim populations such as Germany. Egypt was recently seen as the most important market for Halal food in North Africa. However, it has been noted that the “complex regulatory system” in Egypt has led to a number of potential suppliers to serve the market through investment rather than exports.
THE MALAYSIAn HALAL cERTIFIcATIOn STORYQuite a few names would figure dominantly in the Malaysian Halal Industry landscape, but its success lies in the hands of not one, but at least three organizations namely Jabatan Kemajuan Islam Malaysia ( JAKIM), Halal Industry Development Corporation. (HDC) and Department of Standards Malaysia. Today, we can proudly claim that Malaysia is definitely the main reference center pertaining to the Halal certification. Malaysia’s Halal Standard MS 1500:2009 has been the most sought after certification worldwide.
However, this success does not occur overnight. The Malaysian Halal story started in 1974 when the first certification was introduced. In September 2002, the Government of Malaysia mandated JAKIM to fully implement all Halal-related verification via its Food and Products Division of Applied Research. In 2004, the first Malaysian Halal Standard MS 1500:2004 was published. Realizing the vast development and evolution of the Halal Industry and its needs, by 2005 this division has been expanded and fortified – into the Halal Hub Division.
REgIOnAL InDUSTRY gROWTHA few years ago not many people in US were familiar with Halal products. A study was made by Imarat Consultants to compare the Halal and Kosher products in 2006. Despite the fact that the awareness of food security is on the rise, Halal products barely made it to the supermarket shelves. The ratio then was 1 Halal product to 86 Kosher products. Due to the shortage of Halal items in the scene, the Muslims opted for Kosher instead. This has contributed to 16% of the US Kosher USD 100 billion market.
However, the atmosphere in the US has changed. Popular American companies such as McDonald’s (which already has a popular Halal menu overseas) and Wal-Mart have entered the Halal arena. The natural grocery giant, Whole Foods, has also begun selling its first nationally distributed Halal food product — frozen Indian entrees called Saffron Road.
The wind of change seems to also spread in other regions such as the European continent. With the increasing number of immigrant Muslim communities for the past few years, many corporations have taken initiatives to entice them to their products. For instance Nestle, which already has more than 20 factories in Europe with Halal-certified production lines, is planning to increase its ethnic and Halal offerings in Europe in the coming years. To date, Nestle has become the largest food manufacturer in the Halal sector with more than USD3 billion in annual sales in the Islamic countries alone. In September 2010, the Daily Mail of London reported that many British supermarkets, fast-food chains, hospitals, schools and sporting arenas such as the Wembley Stadium, were serving some Halal meat and poultry. Despite some protests received
GLOBAL STANDARD• HACCP• GMP• GHP• Profesisional
MAINSTREAM• Supermarket• Global presence• Full Product Range• Diverse Applications
UPMARKET• Natural• Organic• Ethnic• Environment• Animal Welfare
LIFESTYLE CHOICE• New ‘Green’• Ethical• Popular Culture• Fashion, Music, Film
Source: Adopted from Imarat Consultants
Influence & Trend Setting
Track & Trace Secure Supply
ChainWorldwide Availability
& Acceptance
High Level Quality Assurance Mark
HALAL
Source: Department of Standards Malaysia
Halal Industry Development Corporation
viewpoints
MS1500:2009 (RM20)Halal Food - Production, Preparation, Handling And Storage-General Guidelines (Second Revision) English & Malay Version Available
MS2200: PART 1: 2008 (RM20)Islamic Consumer Goods - Part 1: Cosmetic And Personal Care-General Guidelines
MS1900:2005 (RM50)Quality Management Systems-Requirements From Islamic Perspectives
MS2300:2009 (RM20)Value Based Management Systems-Requirements From An Islamic Perspective
MS2400-2:2010 (P) (RM40)Halalan-Toyyiban Assurance Pipeline-Management System Requirements For Warehousing And Related Activities
MS 2400-1:2010 (P) (RM40)Halalan-Toyyiban Assurance Pipeline-Management System Requirements For Transportation Of Goods And/Or Cargo Chain Services
MS 2400-3:2010 (P) (RM50)Halalan-Toyyiban Assurance Pipeline-Part 3: Management System Requirements For Retailing
45
January 2012
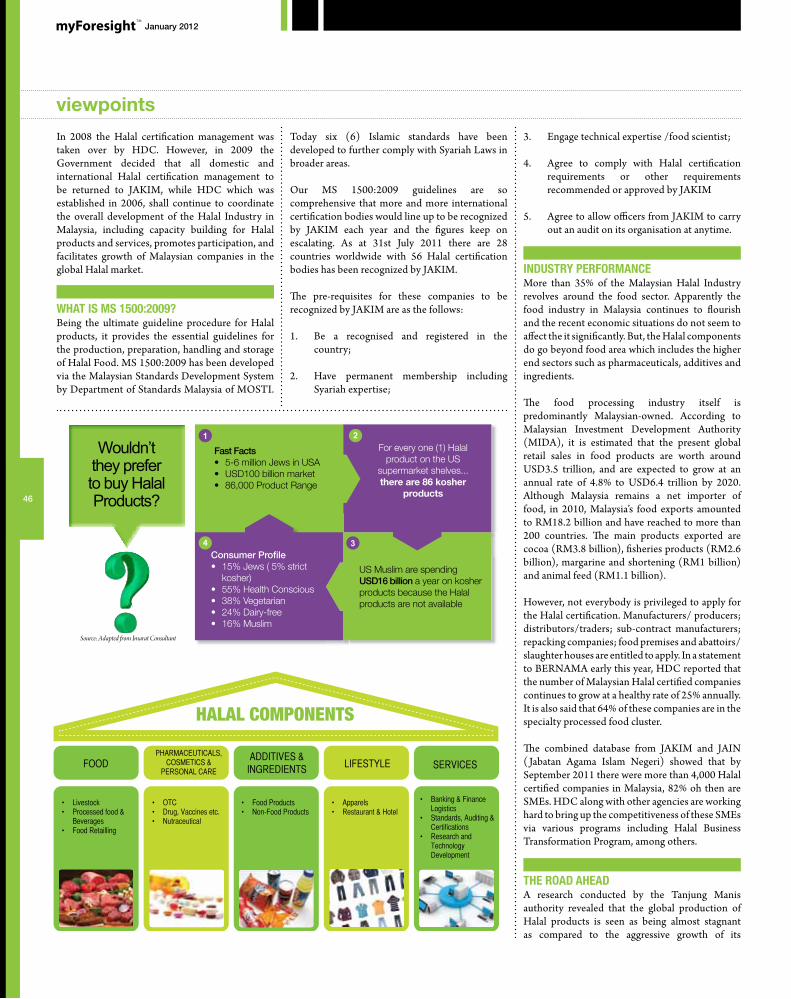
In 2008 the Halal certification management was taken over by HDC. However, in 2009 the Government decided that all domestic and international Halal certification management to be returned to JAKIM, while HDC which was established in 2006, shall continue to coordinate the overall development of the Halal Industry in Malaysia, including capacity building for Halal products and services, promotes participation, and facilitates growth of Malaysian companies in the global Halal market.
WHAT IS MS 1500:2009? Being the ultimate guideline procedure for Halal products, it provides the essential guidelines for the production, preparation, handling and storage of Halal Food. MS 1500:2009 has been developed via the Malaysian Standards Development System by Department of Standards Malaysia of MOSTI.
Today six (6) Islamic standards have been developed to further comply with Syariah Laws in broader areas.
Our MS 1500:2009 guidelines are so comprehensive that more and more international certification bodies would line up to be recognized by JAKIM each year and the figures keep on escalating. As at 31st July 2011 there are 28 countries worldwide with 56 Halal certification bodies has been recognized by JAKIM.
The pre-requisites for these companies to be recognized by JAKIM are as the follows:
1. Be a recognised and registered in the country;
2. Have permanent membership including Syariah expertise;
3. Engage technical expertise /food scientist;
4. Agree to comply with Halal certification requirements or other requirements recommended or approved by JAKIM
5. Agree to allow officers from JAKIM to carry out an audit on its organisation at anytime.
InDUSTRY PERFORMAncEMore than 35% of the Malaysian Halal Industry revolves around the food sector. Apparently the food industry in Malaysia continues to flourish and the recent economic situations do not seem to affect the it significantly. But, the Halal components do go beyond food area which includes the higher end sectors such as pharmaceuticals, additives and ingredients.
The food processing industry itself is predominantly Malaysian-owned. According to Malaysian Investment Development Authority (MIDA), it is estimated that the present global retail sales in food products are worth around USD3.5 trillion, and are expected to grow at an annual rate of 4.8% to USD6.4 trillion by 2020. Although Malaysia remains a net importer of food, in 2010, Malaysia’s food exports amounted to RM18.2 billion and have reached to more than 200 countries. The main products exported are cocoa (RM3.8 billion), fisheries products (RM2.6 billion), margarine and shortening (RM1 billion) and animal feed (RM1.1 billion).
However, not everybody is privileged to apply for the Halal certification. Manufacturers/ producers; distributors/traders; sub-contract manufacturers; repacking companies; food premises and abattoirs/slaughter houses are entitled to apply. In a statement to BERNAMA early this year, HDC reported that the number of Malaysian Halal certified companies continues to grow at a healthy rate of 25% annually. It is also said that 64% of these companies are in the specialty processed food cluster.
The combined database from JAKIM and JAIN ( Jabatan Agama Islam Negeri) showed that by September 2011 there were more than 4,000 Halal certified companies in Malaysia, 82% oh then are SMEs. HDC along with other agencies are working hard to bring up the competitiveness of these SMEs via various programs including Halal Business Transformation Program, among others.
THE ROAD AHEADA research conducted by the Tanjung Manis authority revealed that the global production of Halal products is seen as being almost stagnant as compared to the aggressive growth of its
Fast Facts• 5-6 million Jews in USA• USD100 billion market• 86,000 Product Range
Consumer Profile• 15% Jews ( 5% strict
kosher)• 55% Health Conscious• 38% Vegetarian• 24% Dairy-free• 16% Muslim
For every one (1) Halal product on the US
supermarket shelves... there are 86 kosher
products
US Muslim are spending USD16 billion a year on kosher products because the Halal products are not available
Source: Adapted from Imarat Consultant
HALAL COMPONENTS
FOODPHARMACEUTICALS,
COSMETICS & PERSONAL CARE
ADDITIVES & INGREDIENTS LIFESTYLE SERVICES
• Livestock• Processed food &
Beverages• Food Retailling
• OTC• Drug, Vaccines etc.• Nutraceutical
• Food Products• Non-Food Products
• Apparels• Restaurant & Hotel
• Banking & Finance Logistics
• Standards, Auditing & Certifications
• Research and Technology Development
Wouldn’t they prefer to buy Halal Products?
viewpoints
1
3
2
4
46
January 2012

consumption over the years. In 2005, there was an oversupply of Halal products by almost three times as opposed to the consumption. By 2010, the table has turned and the scenario has changed to overconsumption and undersupply.
WHAT AcTUALLY WEnT WROng? While Halal has managed to surface on the mainstream, the production line has to work three times harder to cater to the increasing needs.
Halal products are considered as premium goods in many countries, especially in Europe where strict requirements must be met in order to obtain the Halal certification. This includes the Good Manufacturing Practice (GMP) and Hazard Critical Control Points (HACCP). Many of European major food manufacturers are beginning to switch their production to Halal in order to reap the market opportunities.
Up to recent times, too many Malaysian companies were keen and able to penetrate the global market due to lack of compliance to these standards. However, the increase of Malaysian Halal companies mark the wave of change where these companies are now more willing to invest in quality assurance and brand development.
Due to the higher demand of more high quality of Malaysia’s Halal products, worlds first Halal research center, Halal Products Research Institute (HPRI) was established in 2006. The establishment of HPRTI was the result of restructuring Halal Food Institute to undertake research and development (R & D) in the Halal products industry.
13992000
Expected More Than
50% Increase of Halal
Companies by 2020
HPRI does not only serves as a one-stop center to study all aspects of Halal products at the national and global levels, but also aims to be the center of excellence in Halal products research, as well as providing a professional services in realizing the countries’ aim in developing the field of agriculture and make Malaysia a Global Halal Hub.
The Government of Malaysia, through its various ministries and authorities, has taken aggressive actions in order to further propel the Halal productions in Malaysia. The Ministry of International Trade and Industry (MITI) via its agencies such as SIRIM and HDC is conducting The GroomBIG Program and Satu Desa Satu Industri Program to nurture and establish more globally certified SMEs that will eventually be export ready.
Apart from that, HDC, through its various incentives and training programs, is overseeing the development of the Halal Industry and its players. This also includes monitoring and assisting the growth of Halal parks around the country. Halal parks will be one of the infrastructures that will facilitate the growth of the Malaysian Halal Industry. HDC is helping to make Halal parks become a success in Malaysia by attracting foreign companies, particularly multi-national corporations, to invest in the 20 Halal parks located across the country.
There are more major Halal-related events taking place now. These events, which used to be exclusive and closed, changed when The Malaysian International Halal Showcase (MIHAS) was inaugurated in 2004. The sole aim of the
inauguration is to facilitate the sourcing and selling of quality Halal consumables, products and services globally. This annual trade fair is claimed to be the largest congregation of Halal industry players.
World Halal Forum was organized in the same year, followed by many more Halal events including World Halal Research Summit and Halfest. All the evenrs shared one similar purpose: To bring the global attention and global Halal market to Malaysia.
With all the on-going efforts by the government in place, the Halal scene in Malaysia has become more interesting, lucrative and conducive for business collaborations. This shall enable Malaysia to become the Global Halal Hub soon.
Specialty Processed Food Cluster
Healthcare
Ingredients
Personal Care & Cosmetics
MALAYSIAN HALAL INDUSTRY MANUFACTURERS BREAKDOWNNOS. OF MALAYSIAN
HALAL COMPANIES
3000
2500
1500
1000
500
0
1679
2519
2010
2020
Information and data are extracted and compiled from various sources (public domains) includes:
• Ministry of International Trade and Industry (MITI),
• Jabatan Kemajuan Islam Malaysia (JAKIM),
• Halal Industry Development Corporation (HDC),
• Department of Standards, Malaysia, BERNAMA,
• World Halal Forum,
• The Halal Journal,
• CNN – Religious Blog,
• PEW Research Center,
• Imarat Consultants,
• www.siddiqi.com,
• www.halalindustries.com,
• www.muslimmatters.org
Production
Consumption
GLOBAL PRODUCTION VS. CONSUMPTION OF HALAL PRODUCTS
20052006
20072008
20092010
250
200
150
100
50
0
Mil Tons
2009
11%
6% 6%
64%
Source: HDC via BERNAMA (10th March 2011) Source: Tanjung Manis 2011 Investors Guide
viewpoints
47
January 2012
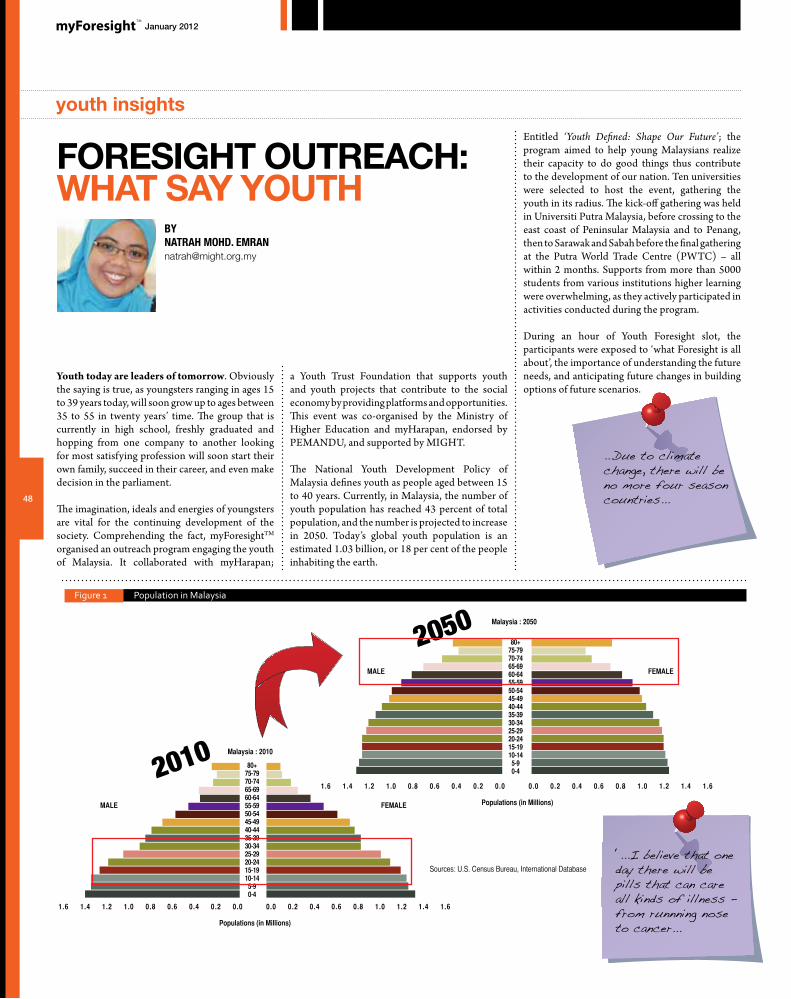
1.6 1.4 1.2 1.0 0.8 0.6 0.4 0.2 0.0 0.0 0.2 0.4 0.6 0.8 1.0 1.2 1.4 1.6
80+75-7970-7465-6960-6455-5950-5445-4940-4435-3930-3425-2920-2415-1910-145-90-4
Populations (in Millions)
MALE FEMALE
Malaysia : 2010
20101.6 1.4 1.2 1.0 0.8 0.6 0.4 0.2 0.0 0.0 0.2 0.4 0.6 0.8 1.0 1.2 1.4 1.6
80+75-7970-7465-6960-6455-5950-5445-4940-4435-3930-3425-2920-2415-1910-145-90-4
Populations (in Millions)
Malaysia : 2050
MALE FEMALE
2050
FORESIGHT OUTREACH:WHAT SAY YOUTH
Youth today are leaders of tomorrow. Obviously the saying is true, as youngsters ranging in ages 15 to 39 years today, will soon grow up to ages between 35 to 55 in twenty years’ time. The group that is currently in high school, freshly graduated and hopping from one company to another looking for most satisfying profession will soon start their own family, succeed in their career, and even make decision in the parliament.
The imagination, ideals and energies of youngsters are vital for the continuing development of the society. Comprehending the fact, myForesightTM organised an outreach program engaging the youth of Malaysia. It collaborated with myHarapan;
Population in MalaysiaFigure 1
a Youth Trust Foundation that supports youth and youth projects that contribute to the social economy by providing platforms and opportunities. This event was co-organised by the Ministry of Higher Education and myHarapan, endorsed by PEMANDU, and supported by MIGHT.
The National Youth Development Policy of Malaysia defines youth as people aged between 15 to 40 years. Currently, in Malaysia, the number of youth population has reached 43 percent of total population, and the number is projected to increase in 2050. Today’s global youth population is an estimated 1.03 billion, or 18 per cent of the people inhabiting the earth.
BYnATRAH MOHD. [email protected]
Entitled ‘Youth Defined: Shape Our Future’; the program aimed to help young Malaysians realize their capacity to do good things thus contribute to the development of our nation. Ten universities were selected to host the event, gathering the youth in its radius. The kick-off gathering was held in Universiti Putra Malaysia, before crossing to the east coast of Peninsular Malaysia and to Penang, then to Sarawak and Sabah before the final gathering at the Putra World Trade Centre (PWTC) – all within 2 months. Supports from more than 5000 students from various institutions higher learning were overwhelming, as they actively participated in activities conducted during the program.
During an hour of Youth Foresight slot, the participants were exposed to ‘what Foresight is all about’, the importance of understanding the future needs, and anticipating future changes in building options of future scenarios.
...Due to climate change, there will be no more four season countries...
‘...I believe that one day there will be pills that can care all kinds of illness - from runnning nose to cancer...
Sources: U.S. Census Bureau, International Database
youth insights
48
January 2012

The participants were made to realize that the future is actually portrayed in our daily lives; be it in films, fiction novels, newspaper articles, taglines of advertisements, company’s mission and vision or even government’s policy plan. Thus, thinking outside the box is not sufficient without intelligence and comprehensive analysis of pertinent elements while planning the future.
In the ‘Letter from the Future’ activity, p a r t i c i p a n t s ’ i m a g i n a t i o n and critical thinking were tested to predict technologies that are most likely to happen and
technologies that they wish to happen. Participants were asked to state their imaginations and thoughts
to gauge an initial response from youth in Foresight and obtaining the insights towards Malaysia 2020 and beyond. The survey was also concurrently ran online at myForesightTM ‘s website and Facebook page in order to reach out to more respondents; particularly youth.
Subsequent to the gatherings was a three days’ workshop where a group of students discussed on how the young people can play their roles in supporting the government’s transformation initiatives; economically and socially. On 12 December 2011, the ‘Plans for the future by youth’ was forwarded to the Prime Minister, Dato’ Sri Najib Tun Abdul Razak, during the Summit Dinner. The document presented the proposals and ideas from the youth based on ten selected NKEAs and NKRAs; namely agriculture, business services, communications content & infrastructure, education, healthcare, improving students outcome, fighting corruption, improving urban public transport, addressing cost of living, and raising living standards of low income household.
What’s next on Youth Foresight? ‘Youth Defined: Shape Our Future’ was just a starter for many more plans of myForesightTM outreach program. Next would be to establish the Youth Foresight Club in universities. The main activity of the club would be to organize discussions among more focus groups and treasuring their input.
‘...I want self-cleaning clothes, as it will solve the clothes drying problems in hostel...
of the future in creative writing. As predicted, their imaginations and thoughts on technologies were mostly related to communications, transportations and entertainment. Additionally, in imagining technologies they wished to happen, the participants were more focused on overcoming resource scarcity and security problems especially in food, water, energy and healthcare.
It was interesting to note that some their creative ideas were sometimes repeated at different venues by different individuals. It showed that some of the ideas, though sounded crazy, were commonly shared by our youth and they reflected the hope and vision of the future generation.
Throughout the event, myForesightTM optimised the opportunities in tapping youth’s opinion via the ‘Youth Foresight Survey’. The survey questions were designed based on the 9+5 key areas identified in the National Foresight Study 2010. The objective was
...there will also hologram pets, with minimal care and safer...so people wirh allergies can also have their own pets...
Current youth population in Malaysia
youth insights
49
January 2012

50
JANUARY 2012
50

5151
JANUARY 2012
51

the world moving forward
Space Tourism - USAThe 2.5-hour flights will offer five minutes of weightlessness. Tickets cost $200,000. Expected to launch in 2013. A project under Virgin Galactic Tourism.
Volkswagen to Open Plant in Brazil
Europe’s largest carmaker, is negotiating with Brazilian authorities the construction
of a $2 billion factory in the nation’s northeastern corner, Valor Economico.
The new facility could produce as many as 200,000 subcompact vehicles a year.
To spend $20M factory for soybeans production
- NigeriaNigeria-based Karma Foods Limited is
establishing a $20 million factory that will take delivery of locally produced soybeans at the end
of this year’s harvest, and open up new marketing opportunities for Nigerian soybean farmers.
To Build World’s Largest Telescope - ChileThe largest investment in infrastructure for space exploration in Chile. Chile currently has 42% of the world’s astronomical infrastructure and with the addition of European Extremely Large Telescope (E-ELT), this figure will soon rise to 70%.
Qatar Develops Solar Powered Clouds to cool 2022 World Cup StadiumsThe ‘cloud’, which looks more like a spacecraft is built with ultra-light carbon material which is crammed with helium and therefore it is light in weight. It is powered with solar-energy and is operated by the use of a remote control. The cost is estimated to be in the range of $500,000.
South Africa$8.5 billion- the amount earmarked for transport infrastructure improvements this year (2011/12). It will rise to $10.3 billion by 2013/14. The improvements are spread across the country, with both urban and rural areas set to benefit.
SpainThe first country to use concentrated solar power integrated with molten salt storage and is fast becoming the major large-scale solar power contributor to the European Community’s 20/20/20 goal, which aims at generating 20 percent of all power from renewable sources, reducing emissions by 20 percent and increasing energy efficiency by 20 percent by 2020, utilizing the ability of Extresol II technology.
Airbus Shows Its Vision of Future Flight - France
The European aircraft manufacturer has offered a sneak peek at its “Concept Cabin,” which aims to
both enhance the flying experience for air passengers and improve the environment. Airbus says the new
cabin will be operational by 2050 and offer different “zones,” such as the “Vitalising Zone” — focused
on relaxation and complete with aromatherapy and acupressure treatments — and the “Interaction
Zone,” which provides virtual pop-up projections that can create whatever scene a passenger wants.
52
JANUARY 2012

Producing Methionine from Renewable Resources - Malaysia
South Korean Cheiljedang (CJ) has partnered with French chemical maker Arkema to build
the world’s first commercial facility to produce methionine from renewable sources. This facility is
expected to cost $400 million split equally between the partners and open by the end of 2013.
AkzoNobel plans new paint plant in ChinaAkzoNobel is planning to invest around 60 million euro (U$84 million) to increase the production capacity of its automotive and aerospace coatings business in China. The project will increase capacity by around 25 million liters and the site is projected to be operational in early 2014.
Czechs bet on nuclear power for their futureCEZ produce one-third of the country’s total power output but the share is expected to grow to 50 percent around 2025 with two new reactors at Temelin. By 2060, nuclear power is expected to account for 80 percent of the mix.
AustraliaGlobal diversified miner Anglo American PLC is considering investing up to $15B over eight years in Australian metallurgical coal projects. Company aims to increase its metallurgical coal output at a 12% compounded annual growth rate from 2010-2020.
Russian Railways to develop first hybrid locomotiveThe SinaraHybrid will be equipped with a hybrid engine with four axles, electric transmission generating a variable alternating current individual drive to each wheel pair, and a capacity of 1,200hp. The new locomotive
will offer better technical performance compared with the TEM9base model, consuming 40% less diesel and emitting 55% fewer greenhouse
gases. The main high-tech components - an asynchronous traction drive and microprocessor control systems for the locomotive’s hybrid drive - and the
algorithms needed for the operation are being developed by experienced Russian scientists and designers. The SinaraHybrid prototype will be produced
at the Lyudinovsky locomotive plant later this year, and a development batch of the locomotives is expected to begin production in 2013.
To improve Defence Industry with new Jetfighter - IndiaIndia, the biggest importer of military hardware among emerging nations is issuing contract includes the outright purchase of 18 combat aircraft by 2012 with another 108 to be built in India. International consultancy firm KPMG estimates New Delhi will hand out military contracts worth $112 billion by 2016.
DenmarkDenmark’s DONG Energy to test wind turbine manufacturer Vestas’ new 7 megawatt offshore turbine at a new site in which it will invest around $44.6 million. It could install a total of six of the 7 MW turbines in 2013 at the demonstration site.
Nissan aims to sell 1.5 million zero-emissions cars by 2016 - JapanNissan Motor Co., the world’s largest maker of battery-powered cars, expects to sell 1.5 million zero-emission models with partner Renault SA in five years, betting consumers will accept cars that need charging. The automaker plans to invest more than 300 billion yen ($3.9 billion) in environmentally friendly technologies by 2017. The automaker expects to cut its carbon footprint by 20 percent and improve fuel economy by 35 percent and will introduce a plug-in hybrid model by 2015.
53
JANUARY 2012

ScEnARIO PLAnnIng: THE LInK BETWEEn FUTURE AnD STRATEgYMats LindgrenHans BandholdPublisher: Palgrave Macmillan
• Keywords: strategy, future, link, planning, scenario
• Number of Pages: 240• Published: 2003-02-22• ISBN-10: 0333993179• ISBN-13: 9780333993170
Recent research in the field of business strategy has shown that strategic flexibility can be achieved through a scenario planning perspective for long term competition and performance. The authors have drawn upon examples and cases to develop a new model for scenario planning that are closely integrated with strategy. They argue that the concept of scenario planning is as much an art as a practical management tool. This volume offers a global perspective on education initiatives by and for young people that promote a transition to sustainability.
• ISBN 0415398150, 9780415398152 • Length 282 pages
Since the early 1990s interest in foresight has undergone one of its periodic resurgences and has led to a rapid growth in formal foresight studies backed by governments and transnational institutions, including many from the United Nations. However, texts that counterbalance in depth practical experience with an exposition and integration of the many theoretical strands that underpin the art and theory of foresight are rare.
Foresight: The Art and Science of Anticipating the Future provides entrepreneurs, business leaders, investors, inventors, scientists, politicians, and many others with a succinct, integrated guide to understanding foresight studies and using them as means for strategy development. The text dispels the belief that anticipations are 'mere guesswork', and conveys the depth of thought needed, implicitly or explicitly, to understand human foresight.
The book examines:
• Theroleofforesightanditsinstitutionalcounterpartinthemodernworld• Theepistemologyunderlyingforesight• Theneedtoextendforesightactivityintowiderspheres,includingsustainabledevelopment• Therolethatforesightplaysinplanningprocesses(includingscenarioplanning)• MuchofthematerialinthebookisbasedupontheinternationallyknownforesightcourseattheManchesterBusiness
School's Institute of Innovation Research (MIoIR) formerly PREST, which the author developed and directedfrom1999to2003.
FORESIgHT: THE ART AnD ScIEncE OF AnTIcIPATIng THE FUTURE Denis Loveridge Publisher Taylor & Francis, 2008
• Keywords: foresight, strategic, guidelines, future, thinking
• Number of Pages: 253• Published: 2007-02-28• ISBN-10: 097893170X• ISBN-13: 9780978931704
Thinking about the Future distils the expertise of three dozen senior foresight professionals into a set of essential guidelines for carrying out successful strategic foresight.
Presented in a highly scannable yet personable style, each guideline includes an explanation and rationale, key steps, a case example, and resources for further study. The 115 guidelines are organized into six sequential categories that mirror the phases of a strategic foresight activity, namely Framing, Scanning, Forecasting, Visioning, Planning, and Acting.
Executives will find both the guidelines and the framework invaluable for understanding what it takes to successfully explore the future, while analysts who actively carry out strategic foresight projects will find the book an indispensable reference that they turn to again and again.
LEARnIng FROM THE FUTURE: cOMPETITIvE FORESIgHT ScEnARIOSAndy Hines, Peter BishoPublisher: Social Technologie
bookclub
54
December 2011
Aviation & Marine • Property & Pecuniary • Liability & Casualty • Construction & Engineering •Employee Benifits • Energy, Oil & Gas
Main OfficeUnit 2-3 & 2-4 2nd Floor, Wisma Bandar,No.18, Jalan Tuanku Abdul Rahman,50100 Kuala Lumpur, MalaysiaTel : +603 2698 7150Fax : +603 2698 7155
www.sepakatinsbro.com.my
We provide acomplete product
range of insurancesand there are
always new onesto develop
SEPAKAT INSURANCE BROKERS (M) SDN BHD(43697-V)
Sepakat At A Glance
Established in 1978, Sepakat Insurance Brokers (M) Sdn Bhd operates from the heart of Kuala Lumpur city, Malaysia. As an independent and privately and privately owned Insurance & Reinsurance and Takaful Brokers, it has undergone several transition passages and the time has also blessed us to stand where we are now today.
In the fast growing and dynamic economies of today, we work very intimately and have strong business relationship with all major insurers, reinsurers and brokers within Malaysian and international markets whereby it creates the advantages to our Customers, giving them coverage over major and sophisticated risks across the countries.
Indeed, we are able to offer professional and specialised services to our Customers regardless natures of the industries, the risks or the needs involved. Today, we are well established business with clientele nationwide diversed from various sectors such as aviations, industrial and manufacturing, oil & gas, logistics, engineering, marines, commercials, individuals and the list goes on.
Our organization is staffed by high achievers and experts with the best of their knowledge and experiences able to deliver solutions that create business value to our Customers. We are agile and nimble enough to take advantage of market volatility for the benefits of our Customers, and to always ensure them receive the highest quality advices and services.
Moving forward, we are continuously developing our ability to deliver the broadest possible competitive products range, the highest level of service, in particular claims services, with a degree of flexibility our Competitors would find difficult to match.
Proudly, Sepakat offers our Customers:-
1. Customised insurance solutions for all industries2. Specialised in Principal Controlled Insurance Program for Projects3. Lenders Advisory Services4. Customised Employee Benefits & Loyalty Scheme5. Treaty Reinsurance Services6. Risks Managements Services7. Claims Management & Advocacy
We provide 2 complete product range of insurances and there are always new ones to develop.
Therefore, we look forward to being able to meet your needs and become your “first choice“ for insurance.