Embed Size (px)
Citation preview

Mycobacterium leprae infection triggers a type I interferon-dependent oligoadenylate synthetase-like (OASL) anti-microbicidal gene

Approaches used in our research group: functional genomics and genetic epidemiology (fungen-genepi)
Functional genomics (microarrays, reanalysis of
GEO data and gene expression in low/moderate
scale)
Genetic epidemiology (case-control
studies, meta-analysis)
validation of candidate
genes
Confirmation of the association and pathways of susceptibility and resistance
Confirmation of pathways of susceptibility and resistance
functional validation

Type I interferon signature in M. leprae infection
Primary Schwann cells M. leprae (live)
Mycobacterial infection
Global gene expression
Type I Interferon signature
OASL: the most expressed gene during M. leprae infection.

Type I interferon signature in mycobacterial diseases

Type I IFN signature gene expression in mdTHP-1 cells infected with viable M. leprae.
Normalized expression values (deltaCt) of described genes in mdTHP-1 cells infected with viable M. leprae at MOIs of 10:1 and 100:1 for 3h, 24h and 48h. Results are represented as mean ± SEM of 3 or more independent biological replicates.
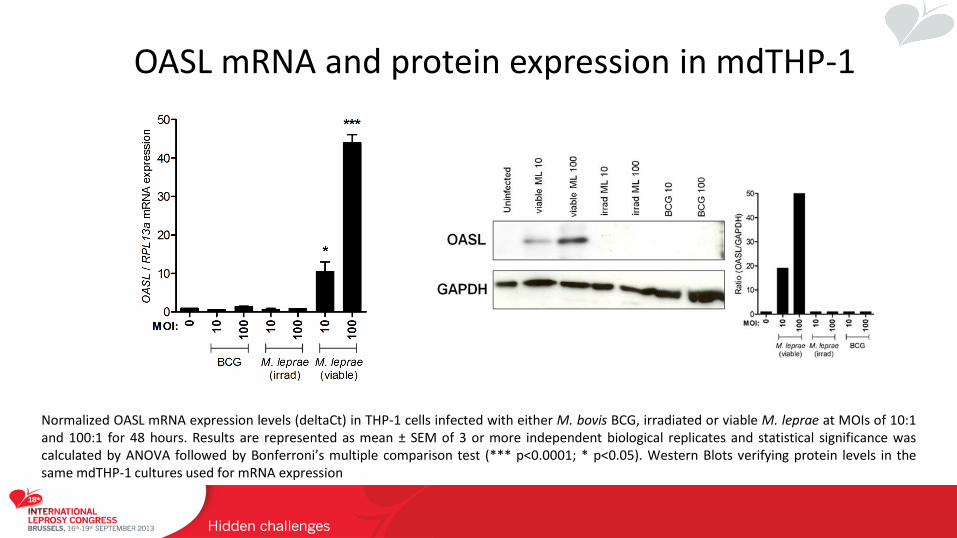
OASL mRNA and protein expression in mdTHP-1
Normalized OASL mRNA expression levels (deltaCt) in THP-1 cells infected with either M. bovis BCG, irradiated or viable M. leprae at MOIs of 10:1 and 100:1 for 48 hours. Results are represented as mean ± SEM of 3 or more independent biological replicates and statistical significance was calculated by ANOVA followed by Bonferroni’s multiple comparison test (*** p<0.0001; * p<0.05). Western Blots verifying protein levels in the same mdTHP-1 cultures used for mRNA expression

OASL mRNA and protein expression in mdTHP-1
Imunocytochemistry detecting Alexa 633 labeled OASL protein in THP-1 cells infected with either viable M. leprae, PKH green labeled irradiated M. leprae or GFP labeled BCG (d). Nuclei are labeled by DAPI. Scale bar: 10 µm. Quantitative analysis of the immunocytochemistry. Results are represented as mean ± SEM of 3 or more independent biological replicates and statistical significance was calculated by ANOVA followed by Bonferroni’s multiple comparison test (*** p<0.0001; ** p<0.001).

M. leprae DNA triggers cytoplasmic DNA sensing pathway
Normalized OASL and IFIT1 mRNA expression (deltaCt) of mdTHP-1 cells at 24h post-transfection with lipofectamine alone (control), M. leprae DNA or RNA (1g/4x105 cells) and M. leprae DNA treated with DNAse. Cells were also treated with nucleic acid without transfection reagent. Results are represented as mean ± SEM of 3 or more independent biological replicates and statistical significance was calculated by ANOVA followed by Bonferroni’s multiple comparison test (** p<0.001). Confocal microscopy image showing M. leprae cell wall components in mdTHP-1 phagosomes (RAB7 and LAM positive labeling; arrow) and cytoplasm (RAB7 negative labeling and LAM positive labeling; arrowhead). Normalized mycobacterial ESAT-6 mRNA expression levels in mdTHP-1 cells infected with viable M. leprae at MOIs of 10:1 and 100:1.

Many pathways to trigger type I interferon . . .

M. leprae activates the type I interferon pathway in a STING/TBK1/IRF3 manner
E6446: a nucleic acid sensing TLRs antagonist
BX795: Inhibits the catalytic activity of TBK1
Normalized OASL expression (deltaCt) of mdTHP-1 cells stimulated with CpG (TLR9 agonist; 1 µM) or infected with viable M. leprae alone or in the presence of E6446 (TLR9 antagonist; 2 µM). (e) Normalized OASL expression (deltaCt) of mdTHP-1 cells lipofected with c-di-AMP (STING ligand; 1 µg/ml) or infected with viable M. leprae alone or in the presence of BX795 (TBK1 inhibitor; 6 µM). Results are represented as mean ± SEM of 3 or more independent biological replicates and statistical significance was calculated by two-tailed Student’s t test (* p=0.01; ** p=0.001; *** p=0.0006).

M. leprae activates the type I interferon pathway in a STING/TBK1/IRF3 manner
Imunofluorescence for nuclear IRF3 nuclear detection in mdTHP-1 cells infected with live M. leprae at MOI 100:1. Quantitative analysis of the imunofluorescence. Results are represented as mean ± SEM of 3 or more independent biological replicates and statistical significance was calculated by two-tailed Student’s t test.

OASL gene silencing affects the release of an important chemokine and hinders M. leprae viability
Normalized gene expression measurements for OASL in THP-1 cells transfected with siRNA for OASL and infected with viable M. leprae for 24 or 48 hours. M. leprae viability as given by the ratio of 16S RNA/DNA in control and OASL siRNA tranfected THP-1 cells following 24 or 48 hours of infection; Detection of CCL2/MCP-1 in the supernatants of silenced THP-1 cultures. Results are represented as mean ± SEM of 3 or more independent biological replicates and statistical significance was calculated by ANOVA followed by Bonferroni’s multiple comparison test (* p<0.05).

Induction of type I interferon is crucial to the success of mycobacterial infection
THP-1 cultures infected with BCG or BCG+DNA for 72h and (a) viability was measured by the ratio of 16S RNA/DNA in control; (b) Detection of CCL2/MCP-1 in the supernatants of THP-1 cultures infected with BCG or BCG+DNA. Results are represented as mean ± SEM of 3 independent biological replicates and statistical significance was calculated by two-tailed Student’s t test (* p=0.05).

Genetic analysis confirms functional association SNP Genotype/Allele N (frequency %) Logistic Regression
Cases Controls OR (p-value) OR (p-value)* rs2258227 AA 318 (0.61) 311 (0.62) Reference Reference
AT 168 (0.32) 171 (0.34) 0.96 (0.767) 1.07 (0.636) TT 35 (0.07) 16 (0.03) 2.14 (0.015) 2.31 (0.009)
521 498
Allele A 804 (0.77) 793 (0.80) Reference Reference Allele T 238 (0.23) 203 (0.20) 1.16 (0.341) 1.25 (0.16) T Carriers 203 (0.39) 187 (0.37) 1.06 (0.643) 1.18 (0.225)
rs4403877 GG 322 (0.74) 360 (0.76) Reference Reference GA 104 (0.24) 107 (0.22) 1.09 (0.598) 1.02 (0.918) AA 8 (0.02) 9 (0.02) 0.99 (0.990) 0.922 (0.874)
434 476
Allele G 748 (0.86) 827 (0.87) Reference Reference Allele A 120 (0.14) 125 (0.13) 1.06 (0.759) 1.00 (0.995) A Carriers 112 (0.26) 116 (0.24) 1.08 (0.618) 1.01 (0.951)
rs3213545 GG 327 (0.62) 266 (0.53) Reference Reference GA 176 (0.34) 207 (0.41) 0.69 (0.005) 0.66 (0.003) AA 21 (0.04) 33 (0.07) 0.52 (0.024) 0.45 (0.007)
524 506
Allele G 830 (0.79) 739 (0.73) Reference Reference Allele A 218 (0.21) 273 (0.27) 0.71 (0.020) 0.627 (0.009) A Carriers 197 (0.37) 240 (0.47) 0.67 (0.001) 0.63 (0.0005)

Investigation of the role of OASL in leprosy: case-control association study
Normalized gene expression values for the OASL gene in nerve biopsies obtained from leprosy suspects diagnosed as leprosy (L; n=25) or other non-leprous neuropathy (NL; n=26), and stratified by SNP rs3213545 genotypes as GG homozygotes or A allele carriers. Results are represented as mean ± SEM and statistical significance was calculated by non-parametric Mann-Whitney-Wilcoxon test (* p=0.026).


In conclusion . . .
This work provides the first evidence that OASL mRNA expression is up-regulated early on the infection of the host cell by M. leprae.
M. leprae-triggered type I interferon response is an effective strategy of virulent mycobacteria to escape the bactericidal responses.
OASL should be considered a pivotal gene to both leprosy and other immune-based diseases and may aid in the development of strategies to treat and prevent these diseases.

Leprosy laboratory
ASA Ana M Sales José A Nery Nádia Duppre Ximena Ilharramendi
Euzenir N Sarno
Sérgio Antunes
Patologia
Acknowledgments
LMC Cristina Pessolani Flávio Lara Luciana Rodrigues
ILSL, Bauru
PROCC Antônio Pacheco
Ida Batista Patrícia Rosa
Hansen Program, Baton Rouge
Diana Williams


![[Micro] mycobacterium leprae](https://img.dokumen.tips/doc/110x75/55d6fd2cbb61eb344d8b45f6/micro-mycobacterium-leprae.jpg)