Embed Size (px)
Citation preview

SUPPLEMENTAL MATERIAL
CRISPR-Cas9 Screen Reveals a MYCN-amplified Neuroblastoma Dependency on EZH2
Liying Chen, Gabriela Alexe, Neekesh V. Dharia, Linda Ross, Amanda Balboni Iniguez, Amy
Saur Conway, Emily Jue Wang, Veronica Veschi, Norris Lam, Jun Qi, W. Clay Gustafson,
Nicole Nasholm, Francisca Vazquez, Barbara A. Weir, Glenn S. Cowley, Levi D. Ali, Sasha
Pantel, Guozhi Jiang, William F. Harrington, Yenarae Lee, Amy Goodale, Rakela Lubonja, John
M. Krill-Burger, Robin M. Meyers, Aviad Tsherniak, David E. Root, James E. Bradner, Todd R.
Golub, Charles W. M. Roberts, William C. Hahn, William A. Weiss, Carol J. Thiele, and
Kimberly Stegmaier
SUPPLEMENTAL METHODS
Cell Lines
SIMA and MHH-NB-11 were maintained in RPMI (Cellgro) supplemented with 10% fetal bovine
serum (Sigma-Aldrich) and 1% penicillin-streptomycin with glutamine (Cellgro). All other
neuroblastoma cell lines were maintained in DMEM (Cellgro) supplemented with 10% fetal
bovine serum (Sigma-Aldrich) and 1% penicillin-streptomycin with glutamine (Cellgro). All cell
lines were cultured at 37°C in a humidified atmosphere containing 5% CO2.
Determination of cell viability
Cell viability was assessed using the CellTiter-Glo Luminescent Cell Viability Assay (Promega).
Luminescent readings were obtained using the FLUOstar Omega microplate reader (BMG
Labtech). Cells were treated across a range of concentrations and area under curve was calculated
from ATP luminescence measurements after 5 days of treatment using log-transformed,
normalized data in GraphPad Prism 6.0 (GraphPad Software, Inc.). Cell viability was also
determined following pLKO.1 lentiviral shRNA-mediated knockdown or CRISPR-Cas9-
mediated knockout of EZH2. ATP content was measured at multiple time points after
transduction.
Flow Cytometry
Apoptosis was measured using the Annexin V: APC Apoptosis Detection Kit as per the
manufacturer’s protocol (BD Pharmingen). Cell cycle was determined by measuring DNA
content using propidium iodide staining.
1

In Vivo Studies
Inducible shRNA experiment: The human neuroblastoma cell line NGP was stably transduced
with a TET-inducible EZH2 shRNA to generate an NGP-shEZH2 cell line. Tumor xenografts
were established by injecting 2 × 10⁶ NGP-shEZH2 cells in the left flank of 5-week-old female
athymic nude mice (Taconic). When tumors reached 75-150 mm3, animals were stratified into
cohorts that received doxycycline-chow or regular chow (n=10 per group). Tumor growth was
monitored with a caliper 3 times a week. In each group, 5 tumors were collected and protein
lysate analyzed for EZH2 expression and target inhibition on Day 20 after starting treatment.
Statistical significance of survival curves was determined by a log-rank (Mantel-Cox) test and
variance of the tumor volume between doxycycline and control was determined by two-way
ANOVA. All xenograft studies were approved by the Animal Care and Use Committee of the
National Cancer Institute, and all mice treatments, including their housing, were in accordance
with the institutional guidelines (PB-023).
Drug treatment experiment with JQEZ5: Tumor xenografts were established in
NOD/SCID/gamma female mice using 2 × 10⁶ Kelly cells resuspended in 30% matrigel and
injected into the flank. After cell implantation, mice were randomized into cohorts to be treated
with 100 mg/kg JQEZ5 (n=10) or vehicle (10% HP-β-CD/90% water) (n=10) delivered by daily
IP injection for 7 days, followed by a 5-day holiday and subsequently treated with 75 mg/kg
JQEZ5 or vehicle for 9 days. Tumor volume was measured by caliper twice weekly and animals
were sacrificed when tumor volumes exceeded 2,000 mm3. All animal studies were conducted
under the auspices of protocols approved by the Dana-Farber Cancer Institute Animal Care and
Use Committee.
Drug treatment experiment with GSK126: Tumor xenografts were established in
NOD/SCID/gamma female mice using 2 × 10⁶ human neuroblastoma cell CHP-212, SK-N-BE(2),
or SH-SY-5Y, resuspended in 30% matrigel and injected into the flank. After cell implantation,
mice were randomized into cohorts to be treated with 150 mg/kg GSK126 or vehicle (20%
Captisol pH4.5) delivered by daily IP injection. Tumor volume was measured by caliper twice
weekly and animals were sacrificed when tumor volumes exceeded 2,000 mm3. All animal
studies were conducted under the auspices of protocols approved by the Dana-Farber Cancer
Institute Animal Care and Use Committee.
2
CRISPR-Cas9 Screening
The CRISPR-Cas9 screen was performed using the Avana library containing 73,372 guides and
an average of 4 guides per gene. The library contains approximately 1,000 guides that do not
target any location in the reference genome as negative controls.
The version of Avana data is available on the Achilles Portal with the recent publication of the
CERES algorithm (1). This dataset contains 341 cell lines, including 11 neuroblastoma lines:
CHP-212, IMR-32, Kelly, KP-N-YN, MHH-NB-11, NB1, SK-N-BE(2), SK-N-AS, SK-N-DZ,
SK-N-FI, and SIMA. Initially, cancer cell lines were transduced with Cas9 using a lentiviral
system. Cell lines that met criteria, including acceptable Cas9 activity measuring ability to
knockout transduced GFP, appropriate growth properties and other parameters, were then
screened with the Avana library. A pool of guides was transduced into a population of cells. The
cells were cultured for 21 days in vitro, and at the end of the assay, barcodes for each guide were
sequenced for each cell line in replicate.
The sgRNA read count data were deconvoluted from sequence reads by using PoolQ. A series of
quality control pre-processing steps was performed to remove samples with poor replicate
reproducibility, as well as guides that have low representation in the initial plasmid pool. The
replicates that failed fingerprinting and the replicates with less than 15 million reads were
removed and then the replicate read counts were scaled to 1 million total reads per replicate. The
replicate pairs with Pearson correlation coefficients < 0.7 and the sgRNAs with low
representation in the pDNA reference library were filtered out. Next, the log fold-change (logFC)
from pDNA reference was calculated and the replicates with logFC SSMD between positive and
negative control sgRNAs > -0.5 were removed. The replicate logFC data were Z-MAD
normalized and the gene scores were inferred by running the computational tool CERES (1) and
then normalized with lists of core cell-essential and non-essential genes. CERES was developed
to computationally correct the copy-number effect and to infer true underlying effect of gene-
knockout as described in (1). CERES models the observed normalized log-fold change for each
sgRNA and cell line as the linear combination of gene-knockout and copy-number effects with
coefficients giving the guide activities. Copy-number effects are fit with a linear piece-wise
model in each cell line. Once all parameters have been fit, the inferred gene scores and guide
activity scores are extracted and reported.
3

Independent Component Analysis
Independent Component Analysis (ICA) (2, 3) was applied to the CERES CRISPR-Cas9 gene-
level data to identify the dependencies significantly associated with the neuroblastoma lineage.
ICA is a machine learning data decomposition technique for revealing hidden non-Gaussian
independent factors that are able to accurately deconvolve the data signal.
ICA models the CERES CRISPR-Cas9 gene dependency scores as a weighted sum of
independent component signals, each component capturing a different biological process
associated with the tumor lineage dependencies. The genes having the largest projection onto a
component (estimated based on the cut-off ICA Z-score ≥ 2.5) are representative for the
biological process associated with the component and are assigned as the “leading edge” gene set
for the component.
Prior to performing ICA, the CERES gene scores were rank normalized per sample, i.e., the gene
level dependency scores were replaced with their rank within each sample. A robust set of 100
independent components was identified from the CERES CRISPR-Cas9 screening rank
normalized data by averaging 500 runs of the FastICA v1.2.1 procedure (4) implemented in R
v3.2 (https://cran.r-project.org/web/packages/fastICA).
The comparative marker selection method implemented in GenePattern v3.9.10 was applied for
ranking the independent components based on the Signal to Noise Ratio (SNR) scores that
differentiate the neuroblastoma cell lines from all other cell lines. The top 3 independent
components that were identified as significantly associated with depletion in neuroblastoma cells
vs. other cell lines (SNR ≤ -0.5, permutation P ≤ 0.05, False Discovery Rate (FDR) ≤ 0.05) were
labeled IC1, IC2 and IC3 and used to project the CERES dependency data (Figure 1A).
The k-nearest neighbor classification model implemented in the R v3.2 package rminer,
(http://cran.r-project.org/package=rminer) was trained for k = 3 on the CERES data projected on
the independent components IC1, IC2 and IC3, which are associated with neuroblastoma
depletion. This model was shown to accurately separate the neuroblastoma cells from the other
cell lines (mean error for 10-fold cross validation 0.026).
The top 100 leading edge genes associated with the components IC1, IC2 and IC3 are presented
in Supplementary Table S1A. The PRC2 complex genes EZH2, EED, SUZ12 were included in
4

the leading edge gene set for the component IC3. Gene set enrichment analysis (GSEA) vs. the
MSigDB c2.all v5.1 collection (Broad Institute) was performed for the leading edge genes of the
independent components IC1, IC2 and IC3 and revealed that each of the leading gene sets were
enriched in “PRC2 targets” gene set signatures.
Single-sample Gene Set Enrichment Analysis for Neuroblastoma Dependencies
A single-sample GSEA (ssGSEA) analysis (5-7) on the CERES dependency data across the
Mammalian Protein Complexes in the CORUM Database available from the ConsensusPathDB
platform (8, 9) was performed to further validate the functional association of the PRC2 complex
with neuroblastoma dependencies in the CRISPR-Cas9 screening data.
Single-sample GSEA (ssGSEA) is a variant of the GSEA method that assigns to each individual
sample, represented as a ranked list of genes, an Enrichment Score (ES) with respect to each gene
set in a given collection of pathways. The ssGSEA ES is calculated as a running sum statistic by
walking down across the ranked list of genes, increasing the sum when encountering genes in the
gene set and decreasing it when encountering genes not in the gene set. The significance of the
ES is estimated based on a permutation P-value and adjusted for multiple hypotheses testing
through FDR. A positive ES denotes a significant overlap of the signature gene set with groups of
genes at the top of the ranked list, while a negative ES denotes a significant overlap of the
signature gene set with groups of genes at the bottom of the ranked list. For each sample, the ES
was further transformed into a Z-score by subtracting the average of the ES’s assigned to all other
samples and by dividing the result to their standard deviation.
While GSEA generates a gene set’s enrichment score with respect to phenotypic differences
across a collection of samples within a dataset, ssGSEA calculates a separate enrichment score
for each pairing of sample and gene set, independent of phenotype labeling. In this manner,
ssGSEA transforms a single sample's gene expression profile to a gene set enrichment profile. A
gene set's enrichment score represents the activity level of the biological process in which the
gene set's members are coordinately up- or down-regulated. The gene set representation has an
unsupervised biological interpretability and can be further analyzed with statistical and machine
learning methods.
5

The ssGSEA Z-scores for a gene set vs. a tumor cell line in the CRISPR-Cas9 screening data
describe the level of dependency of the gene set vs. the cell line, based on the significance cut-off
Z-score for depletion ≤ -1.
The EED_EZH2 protein complex (gene members EED, EZH2, SUZ12, RBBP4, AEBP2) showed
a significant dependency associated with the neuroblastoma cell lines vs. all other cell lines (P =
0.006, Mann-Whitney non-parametric t-test) and scored as most depleted in the neuroblastoma
lineage (average Z-score = -1.48 across the neuroblastoma lineage, average Z-score = 0.05 across
all other lineages). The distribution of the ssGSEA Z-scores for the EED_EZH2 protein complex
across the lineages showed a significant variability across the lineages in the CERES data (1-way
ANOVA F score = 3.05, P < 0.0001).
ChIP-seq and ChIP-qPCR
Crosslinking was performed in fresh cell culture medium containing 1% formaldehyde with
gentle rotation for 5 mins in room temperature. Fixation was stopped by the addition of glycine
(125 mM final concentration). Fixed cells were trypsinized, washed twice in ice-cold PBS, and
then resuspended in 3-x106 cells/130 µl SDS lysis buffer (1% SDS, 10 mM EDTA, 50 mM Tris-
HCl, pH 8.1, supplemented with fresh Complete mini-protease inhibitor cocktail (Roche,
Indianapolis, IN)). Chromatin was sheared to about 200bp fragments by Covaris ultrasonication.
Centrifugation was used to remove debris at 4°C for 10 mins at top speed. The supernatant was
diluted 1:10 using ice-cold ChIP dilution buffer (0.01% SDS, 1.1% Triton-X100, 1.2 mM
EDTA, 16.7 mM Tris-HCl, 167 mM NaCl pH 8.1, supplemented with fresh Complete mini-
protease inhibitor cocktail). Five percent of the diluted sample was saved as input controls and the
remainder of the diluted sample was used for immunoprecipitation with antibodies overnight at
4°C. Precipitates were washed sequentially with ice cold low salt wash (0.1% SDS, 1% Triton-X-
100, 2 mM EDTA, 20 mM Tris-HCl, pH 8.1, 150 mM NaCl), high salt wash (0.1% SDS, 1%
Triton-X-100, 2 mM EDTA, 20 mM Tris-HCl, pH 8.1, 500 mM NaCl), LiCl wash (0.25 M LiCl,
1% IGEPALCA-630, 1% deoxycholic acid, 1 mM EDTA, 10 mM Tris-HCl, pH 8.1) and then
twice with TE (1 mM EDTA, 10 mM Tris-HCl, pH 8.1). They were then eluted and reverse
cross-linked in elution/reverse cross-linking buffer (1% SDS, 0.1 M NaHCO3, 0.2 M NaCl) for 5
hours. Eluted DNA fragments were purified with Qiagen PCR purification kit and analyzed by
qPCR, or barcoded with a NEBNext DNA library preparation kit (NEB, Ipswich, MA) and
subjected to sequencing on Illumina HiSeq 2000 platform.
6

Antibodies used in ChIP experiments are: anti-EZH2 (Cell Signaling 5246S); anti-MYCN (Santa
Cruz sc-53993); anti-H3K27me3 (Millipore 07-449); anti-H3K4me3 (Abcam ab8580).
Primer sequences for ChIP-qPCR: MCM7 forward: GCGGGAGGTGAAGAAGGCC; MCM7
reverse: CTGTGGCCGGCCAACCG; ZIC3 forward: CGGTGTGTAATTCGGGAAGTG; ZIC3
reverse: GCCAAGCGTTGACCCTTTAG; EZH2 (TSS-300bp) forward:
CTGCACACCGCCTTCCT; EZH2 (TSS-300bp) reverse: CCGCCGTCTCTTTGTTCTT; EZH2
(TSS-200bp) forward: CCAGTGGCGTCCCTTACAG; EZH2 (TSS-200bp) reverse:
TGCGCTCAGGGCTCGT; EZH2 (TSS) forward: AAAAGCGATGGCGATTGG; EZH2 (TSS)
reverse: GGCTCCACTGCCTTCTGAGT.
ChIP-seq Data Analysis
All of the ChIP-seq data sets were aligned using Bowtie v2.2.3 (10, 11) to the build version
NCBI37/hg19 of the human genome. Quality control tests were performed based on the FastQC
v.0.11.2 software (Babraham Bioinformatics,
http://www.bioinformatics.babraham.ac.uk/projects/fastqc/) and by using the ChIPQC library
available from Bioconductor v3.2 (12).
The ChIP-seq peaks for EZH2 and H3K4me3 were identified using MACS v1.4.3, and the ChIP-
seq broad peaks for H3K27me3 were identified using MACS v.2.0.10 (13) with the cut-off 1e-05
for the P-value. The peaks were annotated by using the Annotate Peaks function available in the
Homer v4.7 package (14).
The relative ChIP occupancy signal in the gene promoter regions expressed in units of reads per
million mapped reads per bp (rpm/bp) was computed for each mark by using the DeepTools
v2.2.3 software (15) as the ratio between the area under curve (AUC) of the mark normalized
signal vs. the AUC of the background input signal. Gene promoters were defined as the +/- 5 kb
regions around the gene transcription start site (TSS). The gene targets for EZH2 and H3K27me3
were identified separately for each of the Kelly and LAN-1 cells as the genes with high relative
occupancy of EZH2 or H3K27me3, respectively, ChIP signal in the promoter. The “high” level
for the relative occupancy signal in the promoter regions was estimated based on the cut-off 1.5
for the ratio of the AUC signal of the mark vs. the AUC signal of the input. In addition, “core”
lists of gene targets for EZH2 andH3K27me3 were defined by intersecting the target gene sets for
Kelly and LAN-1 cell lines. The lists of gene targets for EZH2 and H3K27me3 are provided in
7

Supplemental Table 3. The correlation between the relative promoter signal for H3K27me3 and
the relative promoter signal for EZH2 across the hg19 genes was tested for significance by using
the rcorr function available in the Hmisc R v3.4 library.
Actively transcribed genes were assessed based on the existence of significantly enriched regions
of H3K4me3 within +/- 5 kb of the TSS, combined with the Z-score of genome-wide
expression > 1. In order to verify that these genes were not bivalently marked or repressed, we
assayed the repressive histone mark H3K27me3 and required that no significantly enriched region
for H3K27me3 overlapped within +/- 5kb of the TSS gene promoter region.
The ChIP-seq data for this study is available for download from the Gene Expression Omnibus
(GEO) repository (GSE85432) upon manuscript publication.
Metagene Representation of Gene Promoter Occupancy
The metagene representations of global genome-wide average ChIP-seq signal promoter
occupancy for EZH2, H3K27me3 and H3K4me3 were performed as described in (16) based on
the expression data for cells cultured in baseline growth conditions, available for the Kelly cells
in the CCLE database (17) and for the LAN-1 cells in the Gene Expression Omnibus GSE56552
data (18). The genes for each data set were grouped into three categories: highly expressed (Z-
score for genome-wide log2 RMA expression ≥ 1.5), medium expressed (absolute Z-score for
genome-wide log2 RMA expression ≤ 0.5) and poorly expressed (Z-score for genome-wide log2
RMA expression ≤ -1.5). The metagenes for the EZH2, H3K27me3 and H3K4me3 relative ChIP
signal occupancy at promoters were created for 500 randomly selected genes from each of the
three categories. The ChIP-seq signal was mapped to the +/- 10kb regions flanking TSS. The TSS
+/- 10kb regions were aligned and split into 50 bp bins. The normalized ChIP-seq signal
occupancy with background input subtracted was then computed as the “Area under the Curve”
density signal in rpm/bp units in the flanked regions. Finally, the meta-representations were
derived based on the average normalized ChIP signal across the 500 genes selected from the
highly expressed, medium expressed and poorly expressed categories.
GSEA for EZH2 and H3K27me3 Target Genes
The GSEA v2.2.0 software (6, 7) was utilized to identify gene sets that have a significant overlap
with the genes marked by EZH2 and by H3K27me3. First the hg19 genes were ranked based on
the H3K27me3, respectively based on the EZH2 relative ChIP-seq occupancy signal in the
8

promoter. The goal of GSEA was to identify the gene sets that are distributed at the top or at the
bottom of the ranked list of genes. For this purpose, the Pre-Rank GSEA module was run across
the comprehensive collection c2 of 4,726 curated canonical pathways and gene sets, available in
the MSigDB v5.1 database http://www.broadinstitute.org/gsea/msigdb/index.jsp (6). Gene sets
with a nominal P ≤ 0.05 and an FDR ≤ 0.25 for the Kolmogorov-Smirnov enrichment test were
considered significant hits. The gene sets identified as significantly enriched in gene targets for
EZH2 and H3K27me3 were further tested for association with the PRC2 complex by applying the
two-tailed Fisher exact test. Of the 4,726 gene sets available in the c2 collection of MSigDB, 83
were manually annotated as related to the PRC2 complex.
In addition, the lists of core gene targets for EZH2 (361 genes) and H3K27me3 (428 genes) were
further tested for significant overlap with the MSigDB v5.1 c2 collection of 4,726 curated
canonical pathways based on the “Investigate GeneSets” module available in MSigDB. The
significance of the overlap was assessed based on a hypergeometric test, with the 0.05 cut-offs for
the P-value and the FDR.
Genome-wide Expression Analysis
Kelly and LAN-1 cells were treated in duplicate with 2 μM GSK126 or DMSO for 2 or 5 days.
Total RNA was extracted with an RNeasy Kit (Qiagen) and profiled by RNA sequencing (HiSeq,
Illumina) at the Center for Cancer Computational Biology (CCCB) at the Dana-Farber Cancer
Institute.
RNA-seq Data Processing
Quality control tests for the mapped reads were performed using the FASTQC software
(www.bioinformatics.babraham.ac.uk/projects/fastqc/). The reads were aligned to the
GRCh37/hg19 human genes by using Tophat2 v2 (19). Quality control tests for the aligned reads
and for the replicate consistency were performed by using the qualimap v2.2 (20) and the
SARTools (21) pipelines. The total number of reads for individual samples ranged from 17 to 24
Mb. The average percentage of uniquely mapped reads in the aligned data was 86.50%, with a
standard deviation 2.3%. The RNA-seq data for this study is available for download from the
Gene Expression Omnibus (GEO) repository (GSE85432) upon manuscript publication.
Gene level reads and gene level expression estimated as log2(FPKM) scores were computed
using the Feature Counts method implemented in the Bioconductor v3.2 RSubread package (22).
9

The genome-wide expression data were projected onto a heatmap by using the GENE-E software
(http://www.broadinstitute.org/cancer/software/GENE-E/). The overall significance of the
differential expression between the control and treatment phenotypes was estimated by using the
EdgeR method available from the Bioconductor v3.2 EdgeR library (23) with the significance
cut-off P ≤ 0.05 for the posterior probability.
Comparative Marker Analysis
The 16 samples available in the data were analyzed for changes in expression induced by
GSK126 vs DMSO at days 2 and 5 in individual cell lines and in both cell lines. The Comparative
Marker Selection module from GenePattern v3.9.6 (24) was employed to identify individual
genes that were differentially expressed between treated and vehicle conditions. The analysis was
performed on the gene level expression data estimated as log2(FPKM) by applying a 2-sided
signal-to-noise ratio (SNR) test followed by 1,000 permutations of the phenotype labels. The
settings for the SNR parameters were log-transformed-data: yes, complete: no, balanced: no,
smooth P-values: yes. Molecular signatures for genes down-regulated (respectively up-regulated)
by GSK126 vs. DMSO were defined based on the cut-offs: absolute fold change for log2(FPKM)
expression ≥ 1.5 (for “stringent” signatures), absolute fold change for log2(FPKM) expression ≥
0.5 (for “relaxed” signatures), permutation P ≤ 0.05, Benjamini-Hochberg false discovery rate
(FDR) ≤ 0.05.
The differential changes in expression induced by GSK126 were first identified separately for the
Kelly and LAN-1 cells. “Core” lists of differentially upregulated and downregulated genes were
defined by intersecting the lists of genes differentially upregulated or downregulated by GSK126
in each of the Kelly and LAN-1 cell lines. The GSK126 “stringent” de-repression signature at day
5 consists of 348 genes upregulated between treated samples vs. vehicle in Kelly cells 244 genes
upregulated in LAN-1 cells, and 30 core genes upregulated in both cell lines. The GSK126
“relaxed” de-repression signature at day 5 consists of 1,346 genes upregulated between treated
samples vs. vehicle in Kelly cells, 1,187 genes upregulated in LAN-1 cells, and 248 core genes
up-regulated in both cell lines.
GSEA for the Expression Changes Induced by GSK126
GSEA v2.1.0 software (6, 7) was used to identify functional associations of the molecular
phenotypes induced by GSK126 with a compendia of gene signatures: (a) the MSigDB v5.1
collection c2 of 4,726 curated pathways and experimental gene sets, (b) the MSigDB v5.1
10

collection c5 of 825 Gene Ontology – Biological Processes gene sets, (c) the lists of gene targets
for EZH2 and H3K27me3 identified in our ChIP-seq experiments, and (d) signatures of genes
repressed in MYCN-amplified and high-risk neuroblastoma tumors.
The signatures of genes repressed in MYCN-amplified or high-risk neuroblastoma tumors were
derived from two primary neuroblastoma gene expression datasets: the Affymetrix U133 A
GSE12460 (25) data describing 64 tumors, and the RNA-seq GSE49711 (26) data describing 498
tumors. Gene sets with less than 15 genes or more than 500 genes were excluded from the
analysis. Gene sets with a nominal P ≤ 0.05 and FDR ≤ 0.25 were considered significant hits. The
results were visualized on GSEA plots, heatmaps and networks for selected gene signatures.
The Enrichment Map v2.1.0 software (27) was employed to organize the significantly enriched
gene sets into a network called an “enrichment map.” In the enrichment map, the nodes
correspond to the gene sets and the edges reflect the overlap between the gene sets corresponding
to the nodes according to the two-tailed Fisher exact test. The size of a node correlates with the
enrichment P-value for the gene set associated to the node. The hubs correspond to collections of
gene sets with a unifying functional group label.
Association of the EZH2 Target Gene and GSK126 De-repression Signatures with MYCN-
amplified Status in Primary Neuroblastoma Tumors
The EZH2 gene signatures identified in the ChIP-seq and the RNA-seq experiments in our study
were further tested for association with the MYCN-amplified status and the high-risk
neuroblastoma phenotypes in primary tumors. The two neuroblastoma gene expression datasets:
GSE12460 (25), describing 64 tumors, and GSE49711 (26), describing 498 tumors, were
analyzed for this purpose.
Drug Synergy Screening and Analysis for Combinations with GSK126
The EZH2 inhibitor GSK126 was screened in vitro for the synergistic combination with a panel
of 10 small molecules. The screening was performed on Kelly cells. The synergistic activity of
the in vitro GSK126 combinations was assessed based on the Delta Bliss Sum Negative
(DBSumNeg) score with the conservative synergy cutoff DBSumNeg < -3 (28). The DBSumNeg
score was introduced as a new metric to quantify the synergy of the combination of two drugs
across all dose combinations tested and was computed simply as the sum of the synergistic
deviations from the Excess over Bliss model (29).
11

Chou-Talalay Combination Index for Loewe Additivity
To assess whether individual treatment combinations were synergistic, additive, or antagonistic
we computed the combination index (CI) scores for Loewe Additivity based on the Chou-Talalay
Median Effect model (30-32) as implemented in CalcuSyn v2.11
(http://www.biosoft.com/w/calcusyn.htm). The median effect model states that the effect x of a
dose of a drug is described by the equation x/(1-x) = (d/DIC50)m , where DIC50 is the IC50 dose of
the drug, and m is a parameter that estimated from the dose-effect curve kinetics of the drug: m =
1 (hyperbolic), m > 1 (sigmoidal), m < 1 (flat sigmoidal). Loewe additivity is a dose-effect model
which states that additivity occurs in a two-drug combination if the sum of the ratios of the dose
vs. the median-effect for each individual drug is d1/DIC50, 1 + d2/DIC50, 2 = 1, where d1, d2 are the
doses for the two drugs, and DIC50, 1 and DIC50, 2 represent the IC50 doses (median-effect) for the
two drugs, respectively. Chou and Talalay (30) showed that Loewe equations are valid for
enzyme inhibitors with similar mechanisms of action -- either competitive or non-competitive
toward the substrate.
The Chou-Talalay Combination Index for Loewe Additivity model assigns a quantitative measure
to any given effect x produced by the combination of dose d1 of drug 1 and dose d2 of drug 2: CI
= d1/Dx1 + d2/Dx2 , where Dx1 is the dose of drug 1 that alone produces the effect x and Dx2 is
the dose of drug 2 that alone produces the effect x, as estimated from the median effect model.
For any given endpoint of the effect measurement CI estimates synergism (CI < 0.8), strong
synergism (CI < 0.6), antagonism (CI > 1.2), strong antagonism (CI > 1.4) or additive effect (CI
in the range 0.8-1.2). The drug combinations were analyzed based on two types of diagnostic
plots:
Effect-oriented plots: the effect x of the drug combination on the X axis, and CI = d1/Dx1 + d2/Dx2
on the Y axis
Dose-oriented (isobologram) plots: d1/Dx1 on the X axis, d2/Dx2 on the Y axis, along with the
Loewe additivity isobole line: d1/DIC50, 1 + d2/DIC50, 2 = 1
12
SUPPLEMENTAL FIGURE LEGENDS
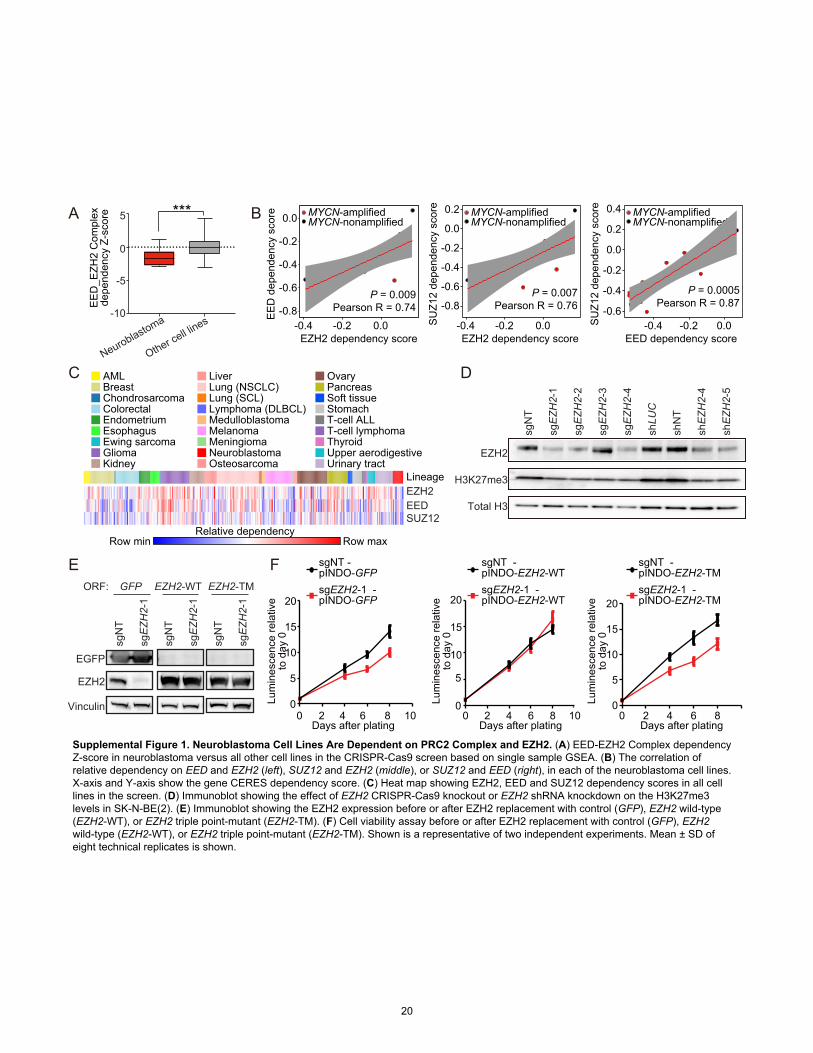
Supplemental Figure 1. Neuroblastoma Cell Lines Are Dependent on PRC2 Complex and
EZH2. (A) EED-EZH2 Complex dependency Z-score in neuroblastoma versus all other cell lines
in the CRISPR-Cas9 screen based on single sample GSEA. (B) The correlation of relative
dependency on EED and EZH2 (left), SUZ12 and EZH2 (middle), or SUZ12 and EED (right), in
each of the neuroblastoma cell lines. X-axis and Y-axis show the gene CERES dependency score.
(C) Heat map showing EZH2, EED, and SUZ12 dependency scores in all cell lines in the screen.
(D) Immunoblot showing the effect of EZH2 CRISPR-Cas9 knockout or EZH2 shRNA
knockdown on the H3K27me3 levels in SK-N-BE(2). (E) Immunoblot showing the EZH2
expression before or after EZH2 replacement with control (GFP), EZH2 wildtype (EZH2-WT), or
EZH2 triple point-mutant (EZH2-TM). (F) Cell viability assay before or after EZH2 replacement
with control (GFP), EZH2 wildtype (EZH2-WT), or EZH2 triple point-mutant (EZH2-TM).
Shown is a representative of two independent experiments. Mean ± SD of eight technical
replicates is shown.
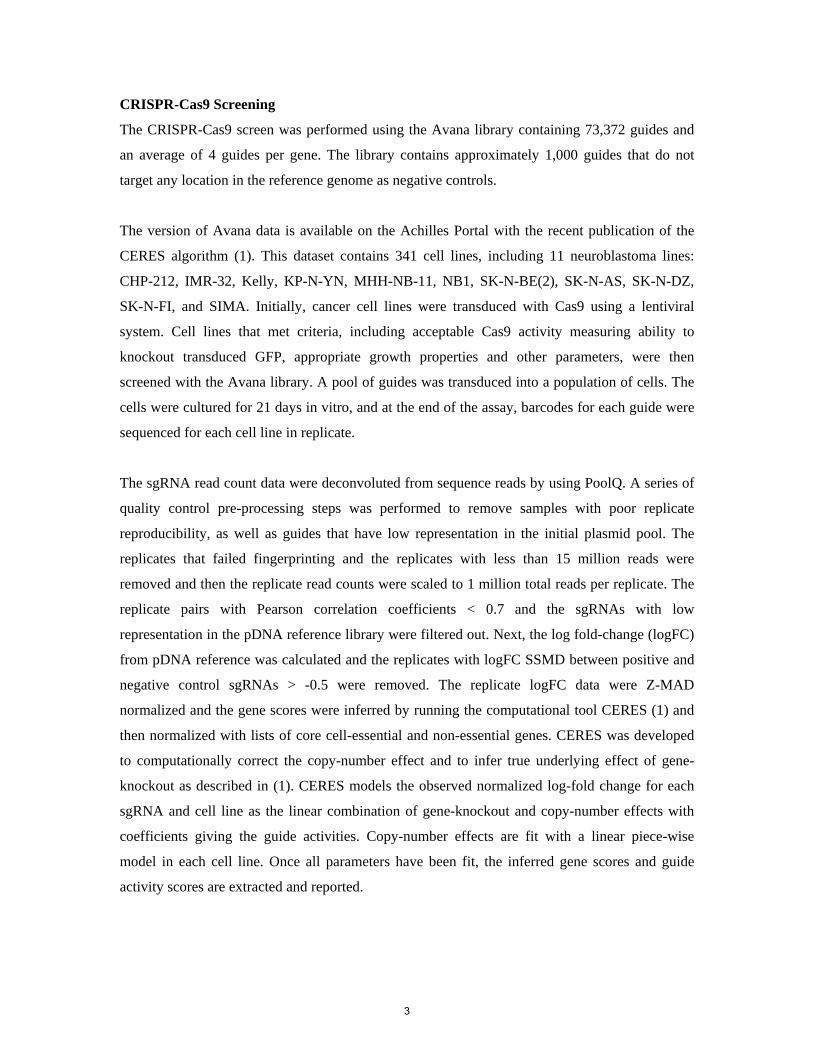
Supplemental Figure 2. Pharmacological Inhibition of EZH2 in MYCN-amplified
Neuroblastoma in Vitro. (A) Immunoblot showing dose-dependent target inhibition by JQEZ5
(left) or GSK126 (right) in neuroblastoma cell lines. Total H3 served as control for H3K27me3.
(B) Mann-Whitney test of area under curve response to EZH2 inhibitors comparing MYCN-
amplified and MYCN-nonamplified neuroblastoma. (C) Flow cytometry analysis for Annexin V
and PI staining in neuroblastoma cell lines treated with 3 μM JQEZ5, GSK126 or DMSO control
for 8-10 days.
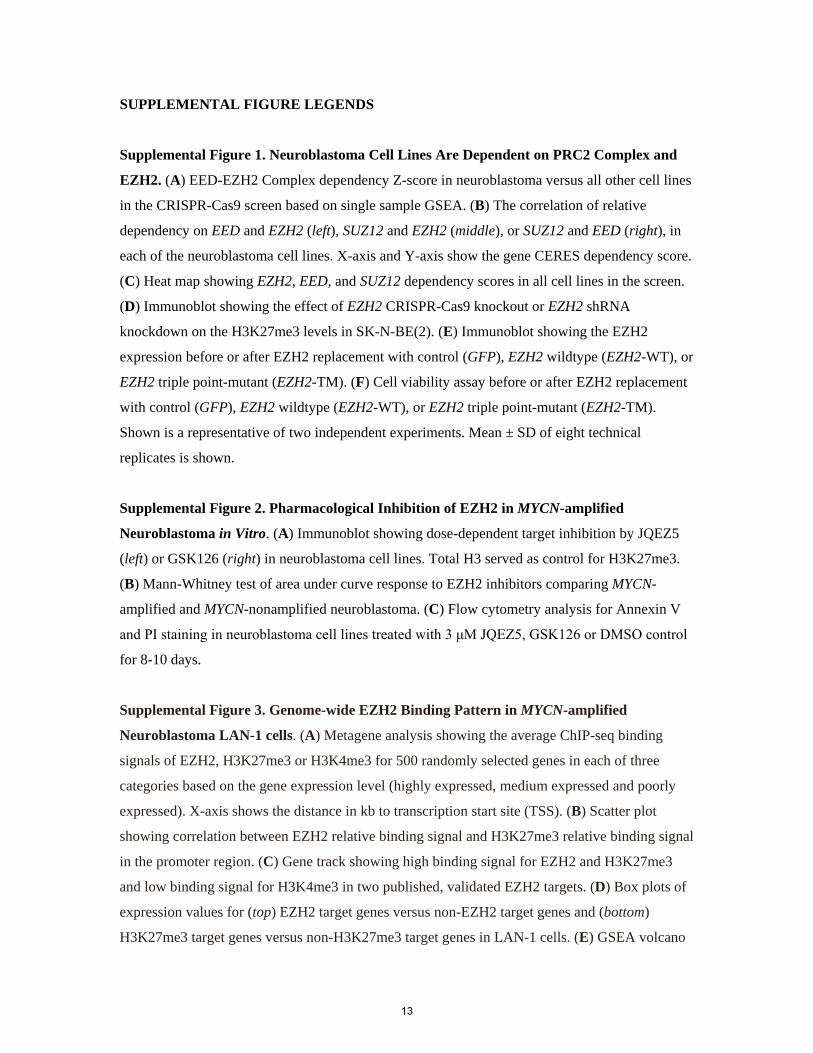
Supplemental Figure 3. Genome-wide EZH2 Binding Pattern in MYCN-amplified
Neuroblastoma LAN-1 cells. (A) Metagene analysis showing the average ChIP-seq binding
signals of EZH2, H3K27me3 or H3K4me3 for 500 randomly selected genes in each of three
categories based on the gene expression level (highly expressed, medium expressed and poorly
expressed). X-axis shows the distance in kb to transcription start site (TSS). (B) Scatter plot
showing correlation between EZH2 relative binding signal and H3K27me3 relative binding signal
in the promoter region. (C) Gene track showing high binding signal for EZH2 and H3K27me3
and low binding signal for H3K4me3 in two published, validated EZH2 targets. (D) Box plots of
expression values for (top) EZH2 target genes versus non-EZH2 target genes and (bottom)
H3K27me3 target genes versus non-H3K27me3 target genes in LAN-1 cells. (E) GSEA volcano
13

plot showing enrichment of published PRC2 target signatures from MSigDB v5.1 among genes
with (top) high EZH2 binding signal or (bottom) high H3K27me3 binding signal in LAN-1 cells.
(F) Enrichment of Benporath PRC2 target signature among genes with (top) high EZH2 promoter
binding signal or (bottom) high H3K27me3 promoter binding signal in LAN-1 cells.
Supplemental Figure 4. Side-by-side Heatmaps of EZH2 and H3K27me3 ChIP-seq AUC
Signal. The 4,536 EZH2 peaks ±4kb in Kelly cells are shown on the left and the 1,936 EZH2
peaks ±4kb in LAN-1 cells on the right. The color scale indicates average signal on a 10-base pair
window.
Supplemental Figure 5. GSEA Showing the Effect of GSK126 Treatment on Neuroblastoma
Cell Lines (Kelly and LAN-1) and Single Sample GSEA of Neuroblastoma Tumors. (A)
GSEA showing enrichment for the previously published gene signatures after treatment with
EPZ-6438 (GSE79859) in the expression profiles following GSK126 treatment. (B) GSEA
showing enrichment of neurite development and axonogenesis signatures in genes upregulated by
GSK126. (C) Single sample GSEA in primary neuroblastoma tumor expression datasets
GSE12460 and GSE49711.
Supplemental Figure 6. Isobologram Plots Demonstrate Synergy of Panobinostat and
GSK126 in Kelly, SK-N-BE(2), LAN-1 and CHP-212 on Day 6. Shown is a representative of
two to three independent experiments.
SUPPLEMENTAL TABLE LEGENDS
Supplemental Table 1. (A) Top 100 leading edge genes for the top 3 independent components
IC1, IC2 and IC3 that are associated with the neuroblastoma lineage in the CRISPR-Cas9 CERES
dependency data. The genes are ranked based on their Z-score per component. Leading edge
genes were selected based on cut-off Z-score ≥ 2.5. PRC2 complex genes are highlighted bold. (B)
Sensitivity AUC scores for the EZH2 inhibitors GSK126 (day 5), JQEZ5 (day 5) and dependency
scores for EZH2, EED, and SUZ12 across the neuroblastoma cell lines in the study.
Supplemental Table 2. Top 50 GSEA significant hits for EZH2 and H3K27me3 ChIP-seq target
genes in Kelly and LAN-1 cells using the MSigDB v5.1 collection c2 of 4,726 pathways and
14

experimental gene sets. For each significant gene set hit the table shows if the gene set is related
to the PRC2 complex (1= yes, 0=no), the size of the gene set, the GSEA normalized enrichment
score (NES), P and false discovery rate (FDR). The MSigDB gene sets are ranked in decreasing
order based on the NES. (A) Top 50 GSEA hits for EZH2 ChIP-seq target genes in Kelly cells.
PRC2 related gene sets are significantly over-represented in the collection of GSEA hits (odds-
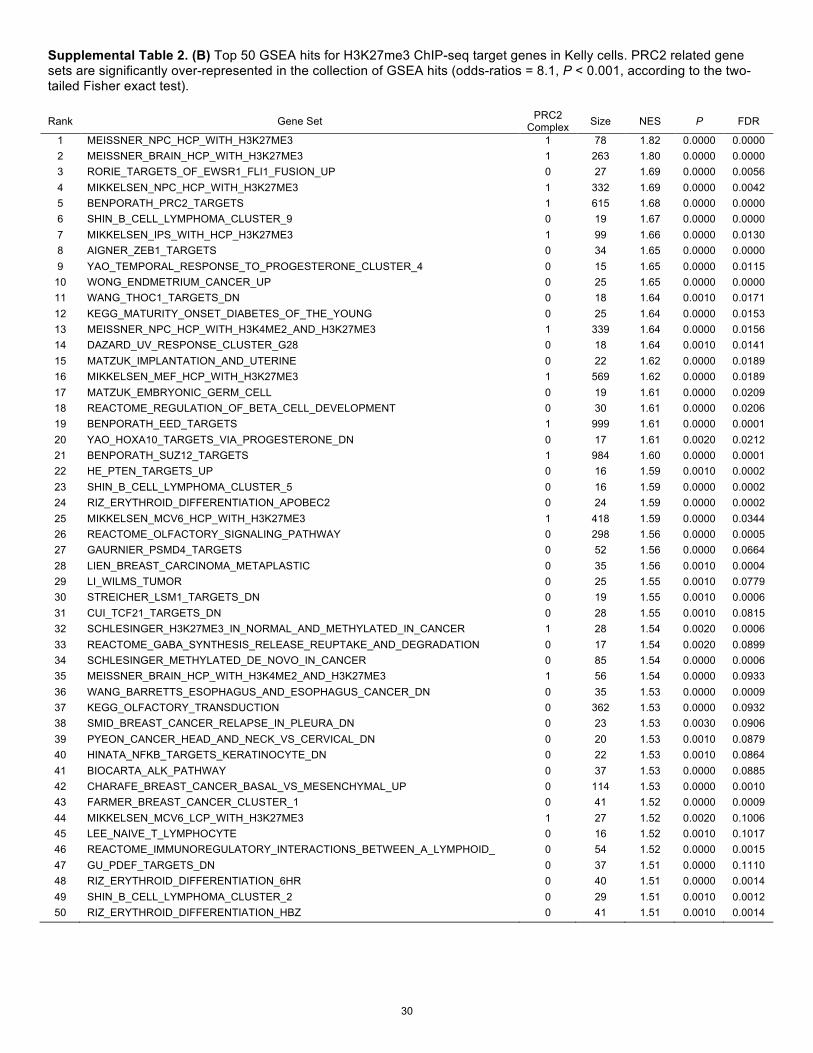
ratios = 9.5, P < 0.001, according to the two-tailed Fisher exact test). (B) Top 50 GSEA hits for
H3K27me3 ChIP-seq target genes in Kelly cells. PRC2 related gene sets are significantly over-
represented in the collection of GSEA hits (odds-ratios = 8.1, P < 0.001, according to the two-
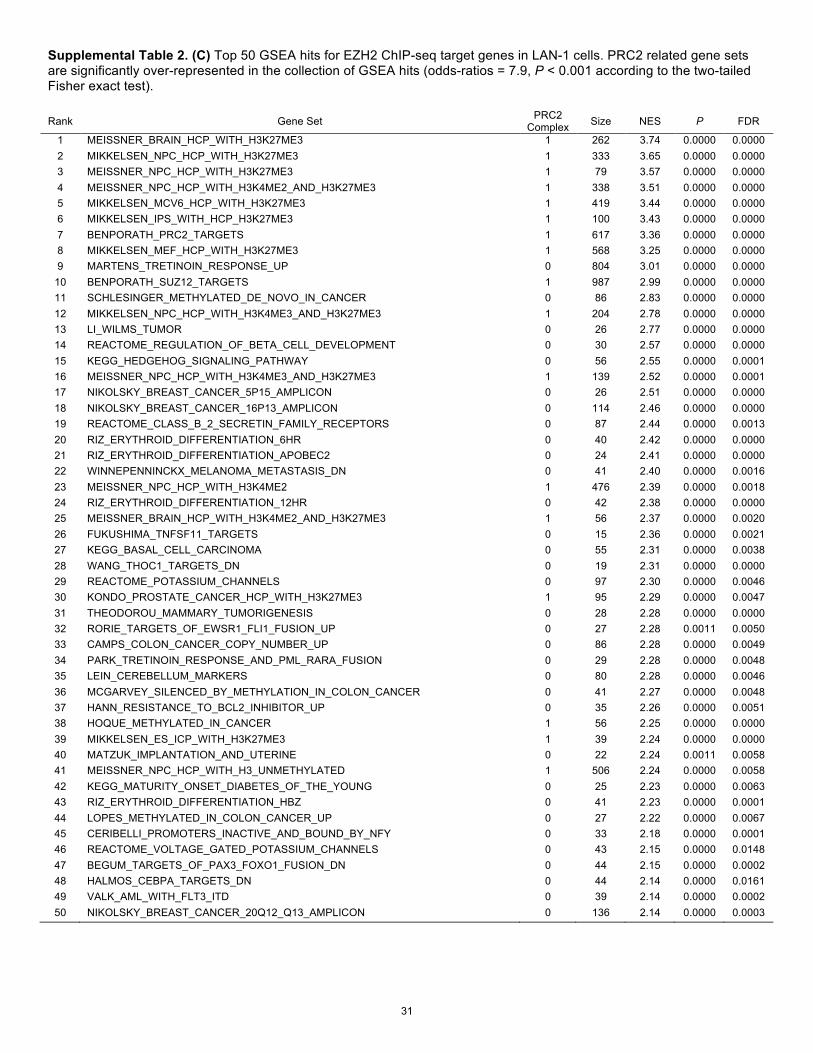
tailed Fisher exact test). (C) Top 50 GSEA hits for EZH2 ChIP-seq target genes in LAN-1 cells.
PRC2 related gene sets are significantly over-represented in the collection of GSEA hits (odds-
ratios = 7.9, P < 0.001 according to the two-tailed Fisher exact test). (D) Top 50 GSEA hits for
H3K27me3 ChIP-seq target genes in LAN-1 cells. PRC2 related gene sets are significantly over-
represented in the collection of GSEA hits (odds-ratios = 9.5, P < 0.001 according to the two-
tailed Fisher exact test).
Supplemental Table 3. Custom neuroblastoma PRC2 signatures consisting of the top 300 EZH2
and H3K27me3 ChIP-seq target genes in Kelly and LAN-1 cell lines. Shown in table are the
EZH2 and H3K27me3 promoter relative binding signal in Kelly and LAN-1 cells. Genes were
ranked in decreasing order based on the promoter binding signal in the highlighted ranking score
column. The high level for the relative occupancy signal in the promoter regions was estimated
based on the cut-off 1.5 for the ratio of the AUC ChIP-seq signal of the mark vs. the AUC signal
of the input. (A) Custom neuroblastoma PRC2 signature consisting of the top 300 EZH2 ChIP-
seq target genes in Kelly cells. (B) Custom neuroblastoma PRC2 signature consisting of the top
300 H3K27me3 ChIP-seq target genes in Kelly cells. (C) Custom neuroblastoma PRC2 signature
consisting of the top 300 EZH2 ChIP-seq target genes in LAN-1 cells. (D) Custom neuroblastoma
PRC2 signature consisting of the top 300 H3K27me3 ChIP-seq target genes in LAN-1 cells.
Supplemental Table 4. Top 60 significant GSEA hits for EZH2 and H3K27me3 ChIP-seq target
genes in Kelly and LAN-1 cells using the MSigDB v5.1 c5 collection of 25 Gene Ontology (GO)
gene sets related to biological processes. For each gene set hit the table shows if the gene set is
related to any of the 15 Neural Development signatures available in the MSigDB c5 collection
(1= yes, 0=no), the size of the gene set, the GSEA normalized enrichment score (NES), P and
false discovery rate (FDR). The significance cut-offs were 0.05 for P and 0.25 for FDR. The top
60 gene set hits are ranked in decreasing order based on the NES. (A) Top 60 GSEA hits for
15

EZH2 ChIP-seq target genes in Kelly cells. Neural Development related gene sets are
significantly over-represented in the collection of GSEA hits (odds-ratios = 51.03, P < 0.001,
according to the two-tailed Fisher exact test). (B) Top 60 GSEA hits for EZH2 ChIP-seq target
genes in LAN-1 cells. Neural Development related gene sets are significantly over-represented in
the collection of GSEA hits (odds-ratios = 39.73, P < 0.001, according to the two-tailed Fisher
exact test).
Supplemental Table 5. The shRNA sequences and the CRISPR-Cas9 sgRNA sequences
targeting MYCN and EZH2 that were used in this study.
16

REFERENCES
1. Meyers RM, Bryan JG, McFarland JM, Weir BA, Sizemore AE, Xu H, Dharia NV, Montgomery PG, Cowley GS, Pantel S, et al. Computational correction of copy-number effect improves specificity of CRISPR-Cas9 essentiality screens in cancer cells. Nature Genetics. 2017: in press.
2. Comon P. Independent component analysis, a new concept? Signal processing. 1994;36(3):287-314.
3. Hyvärinen A, Karhunen J, and Oja E. Independent component analysis. Willey, New York. 2001.
4. Hyvärinen A. Fast and robust fixed-point algorithms for independent component analysis. IEEE Trans Neural Netw. 1999;10(3):626-34.
5. Barbie DA, Tamayo P, Boehm JS, Kim SY, Moody SE, Dunn IF, Schinzel AC, Sandy P, Meylan E, Scholl C, et al. Systematic RNA interference reveals that oncogenic KRAS-driven cancers require TBK1. Nature. 2009;462(7269):108-12.
6. Subramanian A, Tamayo P, Mootha VK, Mukherjee S, Ebert BL, Gillette MA, Paulovich A, Pomeroy SL, Golub TR, Lander ES, et al. Gene set enrichment analysis: a knowledge-based approach for interpreting genome-wide expression profiles. Proc Natl Acad Sci U S A. 2005;102(43):15545-50.
7. Mootha VK, Lindgren CM, Eriksson KF, Subramanian A, Sihag S, Lehar J, Puigserver P, Carlsson E, Ridderstrale M, Laurila E, et al. PGC-1alpha-responsive genes involved in oxidative phosphorylation are coordinately downregulated in human diabetes. Nat Genet. 2003;34(3):267-73.
8. Kamburov A, Pentchev K, Galicka H, Wierling C, Lehrach H, and Herwig R. ConsensusPathDB: toward a more complete picture of cell biology. Nucleic Acids Res. 2011;39(Database issue):D712-7.
9. Kamburov A, Wierling C, Lehrach H, and Herwig R. ConsensusPathDB--a database for integrating human functional interaction networks. Nucleic Acids Res. 2009;37(Database issue):D623-8.
10. Langmead B. Aligning short sequencing reads with Bowtie. Curr Protoc Bioinformatics. 2010;Chapter 11(Unit 11 7.
11. Langmead B, and Salzberg SL. Fast gapped-read alignment with Bowtie 2. Nat Methods. 2012;9(4):357-9.
12. Carroll TS, Liang Z, Salama R, Stark R, and de Santiago I. Impact of artifact removal on ChIP quality metrics in ChIP-seq and ChIP-exo data. Front Genet. 2014;5(75.
13. Feng J, Liu T, Qin B, Zhang Y, and Liu XS. Identifying ChIP-seq enrichment using MACS. Nat Protoc. 2012;7(9):1728-40.
14. Heinz S, Benner C, Spann N, Bertolino E, Lin YC, Laslo P, Cheng JX, Murre C, Singh H, and Glass CK. Simple combinations of lineage-determining transcription factors prime cis-regulatory elements required for macrophage and B cell identities. Mol Cell. 2010;38(4):576-89.
15. Ramirez F, Dundar F, Diehl S, Gruning BA, and Manke T. deepTools: a flexible platform for exploring deep-sequencing data. Nucleic Acids Res. 2014;42(Web Server issue):W187-91.
17

16. Loven J, Hoke HA, Lin CY, Lau A, Orlando DA, Vakoc CR, Bradner JE, Lee TI, and Young RA. Selective inhibition of tumor oncogenes by disruption of super-enhancers. Cell. 2013;153(2):320-34.
17. Barretina J, Caponigro G, Stransky N, Venkatesan K, Margolin AA, Kim S, Wilson CJ, Lehar J, Kryukov GV, Sonkin D, et al. The Cancer Cell Line Encyclopedia enables predictive modelling of anticancer drug sensitivity. Nature. 2012;483(7391):603-7.
18. Dassi E, Greco V, Sidarovich V, Zuccotti P, Arseni N, Scaruffi P, Tonini GP, and Quattrone A. Multi-omic profiling of MYCN-amplified neuroblastoma cell-lines. Genom Data. 2015;6(285-7.
19. Kim D, Pertea G, Trapnell C, Pimentel H, Kelley R, and Salzberg SL. TopHat2: accurate alignment of transcriptomes in the presence of insertions, deletions and gene fusions. Genome Biol. 2013;14(4):R36.
20. Garcia-Alcalde F, Okonechnikov K, Carbonell J, Cruz LM, Gotz S, Tarazona S, Dopazo J, Meyer TF, and Conesa A. Qualimap: evaluating next-generation sequencing alignment data. Bioinformatics. 2012;28(20):2678-9.
21. Hugo Varet J-YC, Marie-Agnès Dillies. SARTools: a DESeq2- and edgeR-based R pipeline for comprehensive differential analysis of RNA-Seq data. bioRxiv. 2015.
22. Liao Y, Smyth GK, and Shi W. featureCounts: an efficient general purpose program for assigning sequence reads to genomic features. Bioinformatics. 2014;30(7):923-30.
23. Robinson MD, McCarthy DJ, and Smyth GK. edgeR: a Bioconductor package for differential expression analysis of digital gene expression data. Bioinformatics. 2010;26(1):139-40.
24. Reich M, Liefeld T, Gould J, Lerner J, Tamayo P, and Mesirov JP. GenePattern 2.0. Nat Genet. 2006;38(5):500-1.
25. Janoueix-Lerosey I, Lequin D, Brugieres L, Ribeiro A, de Pontual L, Combaret V, Raynal V, Puisieux A, Schleiermacher G, Pierron G, et al. Somatic and germline activating mutations of the ALK kinase receptor in neuroblastoma. Nature. 2008;455(7215):967-70.
26. Wang C, Gong B, Bushel PR, Thierry-Mieg J, Thierry-Mieg D, Xu J, Fang H, Hong H, Shen J, Su Z, et al. The concordance between RNA-seq and microarray data depends on chemical treatment and transcript abundance. Nat Biotechnol. 2014;32(9):926-32.
27. Merico D, Isserlin R, Stueker O, Emili A, and Bader GD. Enrichment map: a network-based method for gene-set enrichment visualization and interpretation. PLoS One. 2010;5(11):e13984.
28. Mott BT, Eastman RT, Guha R, Sherlach KS, Siriwardana A, Shinn P, McKnight C, Michael S, Lacerda-Queiroz N, Patel PR, et al. High-throughput matrix screening identifies synergistic and antagonistic antimalarial drug combinations. Sci Rep. 2015;5(13891.
29. Bliss CI. The calculation of microbial assays. Bacteriol Rev. 1956;20(4):243-58. 30. Chou TC, and Talalay P. Quantitative analysis of dose-effect relationships: the
combined effects of multiple drugs or enzyme inhibitors. Adv Enzyme Regul. 1984;22(27-55.
18

31. Chou T-C. Theoretical basis, experimental design, and computerized simulation of synergism and antagonism in drug combination studies. Pharmacological reviews. 2006;58(3):621-81.
32. Chou TC. Drug combination studies and their synergy quantification using the Chou-Talalay method. Cancer Res. 2010;70(2):440-6.
19
H3K27me3
Total H3
EZH2
sgE
ZH
2-1
sgE
ZH
2-2
sgE
ZH
2-3
sgE
ZH
2-4
sgN
T
shLU
C
shN
T
shE
ZH
2-4
shE
ZH
2-5
EZH2
Vinculin
EGFP
ORF:
sgN
T
sgE
ZH
2-1
sgN
T
sgE
ZH
2-1
sgN
T
sgE
ZH
2-1
GFP EZH2-WT EZH2-TM
0 2 4 6 8 100
5
10
15
20
sgNT - pINDO-GFP
sgEZH2-1 - pINDO-GFP
0 2 4 6 8 100
5
10
15
20
sgNT - pINDO-EZH2-WTsgEZH2-1 - pINDO-EZH2-WT
0 2 4 6 80
5
10
15
20
Days after plating
sgNT - pINDO-EZH2-TMsgEZH2-1 - pINDO-EZH2-TM
Lum
ines
cenc
e re
lativ
eto
day
0
B
EZH2 dependency score
EE
D d
epen
denc
y sc
ore
-0.8
-0.6
-0.4
-0.2
0.0
-0.4 -0.2 0.0EED dependency score
SU
Z12
depe
nden
cy s
core
EZH2 dependency score
SU
Z12
depe
nden
cy s
core
E
A
D
F
EZH2EEDSUZ12
EE
D_E
ZH2
Com
plex
depe
nden
cy Z
-sco
re
0
5
-5
-10
Neuroblastoma
Lineage
MYCN-amplified MYCN-nonamplified
P = 0.009Pearson R = 0.74
Other cell lines
P = 0.007Pearson R = 0.76
P = 0.0005Pearson R = 0.87
Days after platingDays after plating
Lum
ines
cenc
e re
lativ
eto
day
0
Lum
ines
cenc
e re
lativ
eto
day
0
Supplemental Figure 1. Neuroblastoma Cell Lines Are Dependent on PRC2 Complex and EZH2. (A) EED-EZH2 Complex dependency Z-score in neuroblastoma versus all other cell lines in the CRISPR-Cas9 screen based on single sample GSEA. (B) The correlation of relative dependency on EED and EZH2 (left), SUZ12 and EZH2 (middle), or SUZ12 and EED (right), in each of the neuroblastoma cell lines. X-axis and Y-axis show the gene CERES dependency score. (C) Heat map showing EZH2, EED and SUZ12 dependency scores in all cell lines in the screen. (D) Immunoblot showing the effect of EZH2 CRISPR-Cas9 knockout or EZH2 shRNA knockdown on the H3K27me3 levels in SK-N-BE(2). (E) Immunoblot showing the EZH2 expression before or after EZH2 replacement with control (GFP), EZH2 wild-type (EZH2-WT), or EZH2 triple point-mutant (EZH2-TM). (F) Cell viability assay before or after EZH2 replacement with control (GFP), EZH2
wild-type (EZH2-WT), or EZH2 triple point-mutant (EZH2-TM). Shown is a representative of two independent experiments. Mean ± SD of eight technical replicates is shown.
MYCN-amplified MYCN-nonamplified
MYCN-amplified MYCN-nonamplified
-0.6
-0.4
-0.2
0.0
0.2
-0.4 -0.2 0.0
-0.8 -0.6
-0.4
-0.2
0.0
0.2
0.4
-0.4 -0.2 0.0
***
C
Urinary tractUpper aerodigestiveThyroidT-cell lymphomaT-cell ALLStomachSoft tissuePancreasOvary
OsteosarcomaNeuroblastomaMeningiomaMelanomaMedulloblastomaLymphoma (DLBCL)Lung (SCL)Lung (NSCLC)Liver
KidneyGliomaEwing sarcomaEsophagusEndometriumColorectalChondrosarcomaBreastAML
Relative dependencyRow min Row max
20

MYCN amplified MYCN wt0
50
100
150
200
GSK126_D6_AUC_boxplots
Difference AUC medians MYCN wt va MYCN amplified = 13.97Mann-Whitney P-value = 0.0079
AUC
for%
drug
viab
ility
vsba
selin
eY=
0
MYCN amplified MYCN wt0
50
100
150
200
JQEZ5_D6_AUC_boxplots
Difference AUC medians MYCN wt vs MYCN amplified = 20.5 Mann-Whitney P-value = 0.0003
AUC
for%
drug
viab
ility
vsba
selin
eY=
0
Kelly
SK-N-BE(2)
PI
PI
PI
Annexin V
DMSO 3µM JQEZ5 3µM GSK126
LAN-1
101
102
103
104
101 102 103 104
10% 15%
21%54%
7%
46% 38%
9% 3% 8%
32% 57%
5% 5%
76% 14%
13% 9%
29%49%
11% 4%
64% 21%
36%
6% 6%
39%49%
10%9%
45%18%
8%
59%
15%
GSK126:JQEZ5:
H3K27me3
total H3
SK-N-BE(2) LAN-1Kelly
DM
SO
0.6µ
M
5µM
A
B
CMYCN-amplified
200
150
100
50
0
JQE
Z5 A
UC
for
% v
iabi
lity
P = 0.0079P = 0.0003
GS
K12
6 A
UC
for
%
via
bilit
y
DM
SO
0.6µ
M
5µM
DM
SO
0.6µ
M
5µM
SK-N-BE(2) LAN-1Kelly
DM
SO
0.6µ
M
5µM
DM
SO
0.6µ
M
5µM
DM
SO
0.6µ
M
5µM
H3K27me3
total H3
MYCN-nonamplified MYCN-amplified
200
150
100
50
0MYCN-nonamplified
Supplemental Figure 2. Pharmacological Inhibition of EZH2 in MYCN-amplified Neuroblastoma in Vitro. (A) Immunoblot showing dose-dependent target inhibition by JQEZ5 (left) or GSK126 (right) in neuroblastoma cell lines. Total H3 served as control for H3K27me3. (B) Mann-Whitney test of area under curve response to EZH2 inhibitors comparing MYCN-amplified and MYCN-nonamplified neuroblastoma. (C) Flow cytometry analysis for Annexin V and PI staining in neuroblastoma cell lines treated with 3 μM JQEZ5, GSK126 or DMSO control for 8-10 days.
21

Rel
ativ
e si
gnal
(R
PM
)
Distance to TSS (kb)
4 -
2 -
0 - --- - -
-10 -5 0 5 10
EZH2
Distance to TSS (kb)
4 -
2 -
0 - --- - -
-10 -5 0 5 10
H3K27me3 H3K4me3
Distance to TSS (kb)
120 -
60 -
0 - --- - -
-10 -5 0 5 10
NES = 3.36P < 0.001 FDR < 0.001
Benporath PRC2 targets0.8
0.6
0.4
0.2
0.0
Enr
ichm
ent S
core
(E
S)
High EZH2 binding Low EZH2 bindingEZH2targets
non-targets Z-s
core
log 2
RN
A e
xpre
ssio
n P < 0.001
0
-1
-2
1
2
3
Rel
ativ
e si
gnal
of E
ZH
2
Relative signal of H3K27me3
- -
0 5 10 15 20
-
10
5
0
20
15
10kb
-3
0
-1
-2
1
2
3
-3
H3K27me3targets
non-targets
P < 0.001
Z-s
core
log 2
RN
A e
xpre
ssio
n
-log 10
(P
)
0
1
2
3
-3 -2 -1 0 1 2 3Normalized Enrichment Score (NES)
-3 -2 -1 0 1 2 3Normalized Enrichment Score (NES)
0
1
2
3 NES = 1.82P < 0.001 FDR < 0.001
Benporath PRC2 targets
0.6
0.4
0.2
0.0
Enr
ichm
ent S
core
(E
S)
High H3K27me3 Low H3K27me3
0.8
: All other gene sets : PRC2 related gene sets
ChI
P-s
eq s
igna
l (R
PM
)
Pearson R = 0.82P < e-11
B
C
D E
25kb[
[
[
[
50 EZH2
35 H3K27me3
500 H3K4me3
[50 EZH2
35 H3K27me3
500 H3K4me3
[
[
[
5kb
-
A
FHOXA clusters NGFR
-log 10
(P
)
Highly expressed genesMedium expressedgenesPoorly expressed genes
Supplemental Figure 3. Genome-wide EZH2 Binding Pattern in MYCN-amplified Neuroblastoma LAN-1 cells. (A) Metagene analysis showing the average ChIP-seq binding signals of EZH2, H3K27me3 or H3K4me3 for 500 randomly selected genes in each of three categories based on the gene expression level (highly expressed, medium expressed and poorly expressed). X-axis shows the distance in kb to transcrip-tion start site (TSS). (B) Scatter plot showing correlation between EZH2 relative binding signal and H3K27me3 relative binding signal in the promoter region. (C) Gene track showing high binding signal for EZH2 and H3K27me3 and low binding signal for H3K4me3 in two published, validated EZH2 targets. (D) Box plots of expression values for (top) EZH2 target genes versus non-EZH2 target genes and (bottom) H3K27me3 target genes versus non-H3K27me3 target genes in LAN-1 cells. (E) GSEA volcano plot showing enrichment of published PRC2 target signatures from MSigDB v5.1 among genes with (top) high EZH2 binding signal or (bottom) high H3K27me3 binding signal in LAN-1 cells. (F) Enrichment of Benporath PRC2 target signature among genes with (top) high EZH2 promoter binding signal or (bottom) high H3K27me3 promoter binding signal in LAN-1 cells.
22

Kelly
EZH2 H3K27me315
0
15
0
ChI
P-s
eq p
eaks
-4kb 4kbPeak -4kb 4kbPeak
Distance from the center of the EZH2 peaks (bp)
LAN-1
EZH2 H3K27me315
0
15
0
ChI
P-s
eq p
eaks
-4kb 4kbPeak -4kb 4kbPeak
Distance from the center of the EZH2 peaks (bp)
Supplemental Figure 4. Side-by-side Heatmaps of EZH2 and H3K27me3 ChIP-seq AUC Signal. The 4,536 EZH2 peaks ±4kb in Kelly cells are shown on the left and the 1,936 EZH2 peaks ±4kb in LAN-1 cells on the right. The color scale indicates average signal on a 10-base pair window.
23

MYCN status
Core.GSE12460.49711_stagePvsG.300_UPCore.GSE12460.GSE49711_MYCN.300_UPKELLY.GSK126.vs.DMSO_stringent_UPKELLY_EZH2_TSS.3k_R1.5_top500KELLY_H3K27me3_TSS.3k_R1.5_top500LAN1_EZH2_TSS.3k_R1.5_top500LAN1_H3K27me3_TSS.3k_R1.5_top500LAN1.GSK126.vs.DMSO_stringent_UP
StageMYCN status
Row min Row maxRelative expression
0.5 0.6
Neurite development signature
GSK126 up
0.4
0.2
0.0
Enr
ichm
ent S
core
(ES
)
0.1
0.3
GSK126 down
NES = 1.69P = 0.0024FDR = 0.1490
Axonogenesis signature
0.4
0.2
0.0
Enr
ichm
ent S
core
(ES
)
0.1
0.3
NES = 1.79P < 0.001FDR = 0.107
0.6 0.5
B
CGSK126 up GSK126 down
Supplemental Figure 5. GSEA Showing the Effect of GSK126 Treatment on Neuroblastoma Cell Lines (Kelly and LAN-1) and Single Sample GSEA of Neuroblastoma Tumors. (A) GSEA showing enrichment for the previously published gene signatures after treatment with EPZ-6438 (GSE79859) in the expression profiles following GSK126 treatment. (B) GSEA showing enrichment of neurite development and axonogenesis signatures in genes upregulated by GSK126. (C) Single sample GSEA in primary neuroblastoma tumor expression datasets GSE12460 and GSE49711.
A
0.40.20.0
Enr
ichm
ent S
core
(ES
)
-0.2
Post-EPZ-6438 treatmentsignature in SK-N-BE(2)-C
NES = 1.41P = 0.002FDR = 0.005
0.40.20.0
Enr
ichm
ent S
core
(ES
)
0.6
Post-EPZ-6438 treatment signature in IMR5-75
NES = 1.60P < 0.001FDR < 0.001
0.40.20.0
Enr
ichm
ent S
core
(ES
)
-0.2
Post-EPZ-6438 treatment signature in SK-N-BE(2)-C
NES = 1.52P < 0.001FDR = 0.001
0.40.20.0
Enr
ichm
ent S
core
(ES
)
-0.2
Post-EPZ-6438 treatmentsignature in IMR5-75
NES = 1.62P < 0.001FDR < 0.001
GSK126 in Kelly GSK126 in LAN-1
GSK126 up GSK126 down GSK126 up GSK126 down GSK126 up GSK126 down GSK126 up GSK126 down
StageMYCN-nonamplifiedMYCN-amplifiednot available
12344snot available
24

0
0.5
1.0
1.5
0 0.5 1.0 1.5
LAN-1
Kelly
d 2 / D
x 2 (p
anob
inos
tat)
d1 / Dx1 (GSK126)
SK-N-BE(2)
CHP-212
0
0.5
1.0
1.5
0 0.5 1.0 1.5
d 2 / D
x 2 (p
anob
inos
tat)
d1 / Dx1 (GSK126)
0
0.5
1.0
1.5
0 0.5 1.0 1.5
d 2 / D
x 2 (p
anob
inos
tat)
d1 / Dx1 (GSK126)
0
0.5
1.0
1.5
0 0.5 1.0 1.5
d 2 / D
x 2 (p
anob
inos
tat)
d1 / Dx1 (GSK126)
Supplemental Figure 6. Isobologram Plots Demonstrate Synergy of Panobinostat and GSK126 in Kelly, SK-N-BE(2), LAN-1 and CHP-212 on Day 6. Shown is a representative of two to three independent experiments.
25

Supplemental Table 1. (A) Top 100 leading edge dependencies for the top 3 independent components IC1, IC2 and IC3 that are associated with the neuroblastoma lineage in the CRISPR-Cas9 CERES dependency data. The dependencies are ranked based on their Z-score per component. Leading edge dependencies were selected based on cut-off Z-score ≥ 2.5. PRC2 complex dependencies are highlighted bold.
# IC1 leading dependencies
IC1 component
Z-score
IC2 leading dependencies
IC2 component
Z-score
IC3 leading dependencies
IC3 component
Z-score 1 TXK 7.20 AFMID 7.99 TAF5L 24.03 2 CWH43 6.94 TMEM105 7.93 SUPT20H 23.13 3 TLR6 6.74 ITGB4 7.64 TADA2B 22.74 4 FBXL5 6.74 SPHK1 7.32 TADA1 22.32 5 WDR19 6.52 TNRC6C 7.20 SUPT7L 16.68 6 MRFAP1L1 6.46 SSTR2 7.13 TAF6L 13.21 7 FAM114A1 6.17 P4HB 6.93 MED13 12.20 8 GRXCR1 6.01 TRIM65 6.80 KAT2A 11.20 9 CLRN2 5.95 TK1 6.76 USP22 11.15
10 CNGA1 5.91 CCDC40 6.72 MED19 10.12 11 RELL1 5.88 CD300LF 6.51 SMARCD1 8.87 12 LDB2 5.82 ST6GALNAC2 6.48 MED24 8.63 13 UBE2K 5.76 CACNG4 6.42 CCNC 8.54 14 S100P 5.72 C17orf77 6.40 MED13L 8.28 15 UCHL1 5.67 FADS6 6.37 BRD9 8.12 16 ZAR1 5.65 ABCA8 6.32 PAXIP1 7.71 17 ZCCHC4 5.65 VEZF1 6.23 MED15 7.61 18 PCDH7 5.63 PRCD 6.19 EP300 7.53 19 TMEM33 5.60 TEX19 6.09 NIPBL 7.39 20 LRPAP1 5.57 FOXK2 5.94 ATXN7 7.36 21 BLOC1S4 5.55 CBX2 5.91 MED23 7.01 22 TMEM156 5.51 CYTH1 5.85 GLTSCR1 6.77 23 DOK7 5.39 ST6GALNAC1 5.85 MED16 6.74 24 USP17L13 5.37 LOC100653515 5.76 MLLT1 6.34 25 LGI2 5.10 WBP2 5.75 PRR12 6.11 26 SEL1L3 5.09 MRC2 5.71 CCDC101 5.90 27 TBC1D1 4.97 CPSF4L 5.63 MBNL1 5.70 28 CD38 4.94 GPRC5C 5.58 CREBBP 5.22 29 KCTD8 4.93 TMEM235 5.56 ANKRD52 5.17 30 MFSD10 4.89 RNF213 5.55 DOT1L 5.00 31 ACOX3 4.65 SCAF8 5.55 EED 5.00 32 PHOX2B 4.60 SYNGR2 5.55 TCEB3 4.95 33 CHRNA9 4.60 WDR45B 5.49 KLHDC3 4.88 34 GRK4 4.59 FOXJ1 5.38 CHD2 4.85 35 ATP10D 4.59 CD79B 5.37 PTP4A1 4.80 36 DCAF4L1 4.59 TIMP2 5.33 PAGR1 4.77 37 CORIN 4.55 MIF4GD 5.32 YWHAE 4.64 38 HMX1 4.55 LLGL2 5.24 SUZ12 4.63 39 APBB2 4.48 GDPD1 5.17 TNFAIP3 4.61 40 ABLIM2 4.48 PPP1R27 5.09 RING1 4.58 41 CCKAR 4.42 FAM195B 5.08 TADA3 4.50 42 WHSC1 4.42 GGA3 5.06 EZH2 4.49 43 STIM2 4.40 SDK2 5.04 HDAC2 4.44 44 LCORL 4.40 CACNG5 4.97 C11orf30 4.42 45 SLC30A9 4.38 ACOX1 4.95 MAPKAPK2 4.41 46 ATE1 4.36 PRR29 4.95 TAF11 4.35 47 MXD4 4.32 DNAI2 4.94 KEAP1 4.30 48 RNF212 4.24 OXLD1 4.90 MAU2 4.23 49 RBKS 4.23 PRPSAP1 4.89 ATF7IP 4.19 50 SH3TC1 4.20 SEC14L1 4.80 STAG1 4.13
26

# IC1 leading dependencies
IC1 component
Z-score
IC2 leading dependencies
IC2 component
Z-score
IC3 leading dependencies
IC3 component
Z-score 51 HHAT 4.18 PRKCA 4.80 MED1 4.11 52 KCNIP4 4.16 ENDOV 4.75 PITPNB 4.01 53 HMGXB3 4.16 SLC38A10 4.72 ATXN2L 3.94 54 POLN 4.13 SECTM1 4.69 EHMT2 3.89 55 SH3BP2 4.11 PTRH2 4.65 MED25 3.88 56 TBC1D23 4.10 GPR142 4.62 SPIN1 3.86 57 CRIPAK 4.10 CD300C 4.59 ASB7 3.86 58 KLB 4.03 CEP95 4.58 TRAF3 3.78 59 HS3ST1 4.02 CARD14 4.52 FOXA2 3.70 60 KLHL5 4.01 UNK 4.50 CSRNP1 3.70 61 CPZ 4.01 BAIAP2 4.48 MORF4L1 3.67 62 GNG10 3.97 FBF1 4.48 C10orf12 3.67 63 PHLDB1 3.94 LRRC45 4.48 PCGF1 3.61 64 MYL12B 3.91 SMIM5 4.46 SIN3B 3.59 65 FGFBP2 3.90 SGSH 4.43 BTAF1 3.57 66 GNPDA2 3.90 MAFG 4.41 FOXA1 3.48 67 FAM174B 3.89 DHX40 4.41 ACPT 3.37 68 CC2D2A 3.85 KIAA0195 4.40 KAT6A 3.32 69 CCAR2 3.84 GH1 4.40 SIRT1 3.30 70 SMIM20 3.82 CDR2L 4.37 CCNF 3.26 71 ISL1 3.81 CASKIN2 4.37 LACTB2 3.25 72 NSUN7 3.78 GALK1 4.35 APOA5 3.22 73 DCAF16 3.77 KCNJ16 4.34 MTA2 3.21 74 TLR1 3.74 NAT9 4.33 ATXN7L3 3.21 75 PPARGC1A 3.73 ENGASE 4.31 SP1 3.20 76 DEFB131 3.73 EDF1 4.30 NABP2 3.16 77 YIPF7 3.72 HID1 4.28 CLC 3.16 78 SLIT2 3.71 SMIM6 4.26 POLR2M 3.15 79 TLR10 3.69 ZNF750 4.25 PAIP1 3.14 80 LARP4B 3.63 CYGB 4.22 FBXL14 3.14 81 UBE3D 3.61 AANAT 4.15 CCNE1 3.14 82 BEND4 3.60 OTOP2 4.13 UBE2K 3.14 83 CASP7 3.59 PRR11 4.13 MTHFD1 3.10 84 FGFR3 3.59 RNF157 4.12 HEATR3 3.10 85 FZD8 3.58 MAP2K6 4.12 FAM159B 3.10 86 TNNI1 3.58 TMC6 4.09 HTT 3.09 87 ZNF292 3.57 RFNG 4.04 ZNF143 3.09 88 ADD1 3.56 CANT1 4.03 ARF6 3.09 89 NWD2 3.55 KIRREL3 4.02 THAP4 3.08 90 QDPR 3.55 EVPL 4.01 ROCK1 3.07 91 RBPJ 3.54 EFCAB3 4.01 MYCN 3.07 92 SLC34A2 3.53 KPNA2 4.00 AFF4 3.06 93 SPICE1 3.52 NOTUM 3.99 CAB39 3.06 94 LRRTM3 3.49 YPEL2 3.97 KDM1A 3.06 95 SHISA3 3.49 DUS1L 3.97 CKS1B 3.04 96 LARP7 3.49 TRAPPC13 3.97 ZNF217 3.04 97 TEC 3.47 MFSD11 3.93 ATG101 3.04 98 OCIAD1 3.46 UNC13D 3.93 SERTAD2 3.03 99 BOD1L1 3.45 PCTP 3.93 KLF5 3.03
100 SLC26A1 3.44 RNFT1 3.92 RANBP9 3.03
27

Supplemental Table 1. (B) Sensitivity AUC scores for the EZH2 inhibitors GSK126 (day 5), JQEZ5 (day 5) and dependency scores for EZH2, EED and SUZ12 across the neuroblastoma cell lines in the study.
# Cell line MYCN status AUC score GSK126 day 5
AUC score JQEZ5 day 5
EZH2 dependency
score
EED dependency
score
SUZ12 dependency
score 1 CHP-212 Amplified 89.150 95.720 -0.335 -0.536 -0.446 2 IMR-32 Amplified 92.850 79.670 0.098 -0.134 -0.234 3 Kelly Amplified 87.230 80.270 -0.188 -0.474 -0.510 4 LAN-1 Amplified 92.880 92.250 na na na 5 MHH-NB-11 Amplified 90.510 82.370 0.095 -0.268 -0.135 6 NB-1 Amplified 82.350 71.890 0.068 -0.535 -0.419 7 NGP Amplified 79.980 88.700 na na na 8 SIMA Amplified 84.230 81.000 -0.085 -0.461 -0.315 9 SK-N-BE(2) Amplified 63.240 74.070 -0.105 -0.438 -0.605
10 ACN Non-amplified 122.400 110.200 na na na 11 CHLA-15 Non-amplified 100.100 97.660 na na na 12 GI-M-EN Non-amplified 101.200 95.670 na na na 13 SH-SY-5Y Non-amplified 86.250 98.660 na na na 14 SK-N-AS Non-amplified 92.440 101.500 -0.392 -0.529 -0.531 15 SK-N-FI Non-amplified 137.700 127.000 0.163 0.069 0.191 16 SK-N-SH Non-amplified 114.500 105.700 na na na
28

Supplemental Table 2. Top 50 GSEA significant hits for EZH2 and H3K27me3 ChIP-seq target genes in Kelly and LAN-1 cells using the MSigDB v5.1 collection c2 of 4,726 pathways and experimental gene sets. For each significant gene set hit the table shows if the gene set is related to the PRC2 complex (1= yes, 0=no), the size of the gene set, the GSEA normalized enrichment score (NES), P and false discovery rate (FDR). The MSigDB gene sets are ranked in decreasing order based on the NES. (A) Top 50 GSEA hits for EZH2 ChIP-seq target genes in Kelly cells. PRC2 related gene sets are significantly over-represented in the collection of GSEA hits (odds-ratios = 9.5, P < 0.001, according to the two-tailed Fisher exact test). Rank Gene Set PRC2
Complex Size NES P FDR
1 MEISSNER_BRAIN_HCP_WITH_H3K27ME3 1 263 3.57 0.0000 0.0000 2 BENPORATH_PRC2_TARGETS 1 615 3.44 0.0000 0.0000 3 MIKKELSEN_NPC_HCP_WITH_H3K27ME3 1 332 3.30 0.0000 0.0000 4 MEISSNER_NPC_HCP_WITH_H3K4ME2_AND_H3K27ME3 1 339 3.27 0.0000 0.0000 5 MEISSNER_NPC_HCP_WITH_H3K27ME3 1 78 3.27 0.0000 0.0000 6 BENPORATH_EED_TARGETS 1 999 3.25 0.0000 0.0000 7 BENPORATH_SUZ12_TARGETS 1 984 3.24 0.0000 0.0000 8 MIKKELSEN_IPS_WITH_HCP_H3K27ME3 1 99 3.18 0.0000 0.0000 9 MIKKELSEN_MEF_HCP_WITH_H3K27ME3 1 569 3.15 0.0000 0.0000
10 MIKKELSEN_MCV6_HCP_WITH_H3K27ME3 1 418 3.13 0.0000 0.0000 11 SCHLESINGER_METHYLATED_DE_NOVO_IN_CANCER 1 85 3.03 0.0000 0.0000 12 MEISSNER_BRAIN_HCP_WITH_H3K4ME2_AND_H3K27ME3 1 56 2.86 0.0000 0.0000 13 REACTOME_REGULATION_OF_BETA_CELL_DEVELOPMENT 0 30 2.73 0.0000 0.0000 14 RORIE_TARGETS_OF_EWSR1_FLI1_FUSION_UP 0 27 2.66 0.0000 0.0000 15 MIKKELSEN_NPC_HCP_WITH_H3K4ME3_AND_H3K27ME3 1 205 2.61 0.0000 0.0000 16 KEGG_MATURITY_ONSET_DIABETES_OF_THE_YOUNG 0 25 2.61 0.0000 0.0000 17 MCGARVEY_SILENCED_BY_METHYLATION_IN_COLON_CANCER 0 40 2.55 0.0000 0.0002 18 KEGG_HEDGEHOG_SIGNALING_PATHWAY 0 56 2.55 0.0000 0.0002 19 RIZ_ERYTHROID_DIFFERENTIATION_6HR 0 40 2.52 0.0000 0.0000 20 THEODOROU_MAMMARY_TUMORIGENESIS 0 28 2.49 0.0000 0.0000 21 LI_WILMS_TUMOR 0 25 2.48 0.0000 0.0007 22 WANG_LSD1_TARGETS_UP 0 23 2.46 0.0000 0.0008 23 LIEN_BREAST_CARCINOMA_METAPLASTIC 0 35 2.45 0.0000 0.0000 24 MATZUK_IMPLANTATION_AND_UTERINE 0 22 2.43 0.0000 0.0013 25 RIZ_ERYTHROID_DIFFERENTIATION_APOBEC2 0 24 2.43 0.0000 0.0000 26 NIKOLSKY_BREAST_CANCER_5P15_AMPLICON 0 25 2.43 0.0000 0.0000 27 MARTENS_TRETINOIN_RESPONSE_UP 0 803 2.41 0.0000 0.0015 28 WONG_ENDMETRIUM_CANCER_UP 0 25 2.41 0.0000 0.0000 29 RIZ_ERYTHROID_DIFFERENTIATION_HEMGN 0 31 2.40 0.0000 0.0000 30 SCHLESINGER_H3K27ME3_IN_NORMAL_AND_METHYLATED_IN_CANCER 1 28 2.39 0.0000 0.0000 31 LEIN_CEREBELLUM_MARKERS 0 80 2.36 0.0000 0.0035 32 WANG_THOC1_TARGETS_DN 0 18 2.36 0.0000 0.0035 33 RIZ_ERYTHROID_DIFFERENTIATION_HBZ 0 41 2.35 0.0000 0.0000 34 SHIN_B_CELL_LYMPHOMA_CLUSTER_9 0 19 2.35 0.0000 0.0000 35 LIU_CDX2_TARGETS_UP 0 35 2.34 0.0000 0.0000 36 MEISSNER_NPC_HCP_WITH_H3K4ME2 1 477 2.31 0.0000 0.0070 37 KEGG_BASAL_CELL_CARCINOMA 0 55 2.31 0.0000 0.0069 38 AIGNER_ZEB1_TARGETS 0 34 2.31 0.0000 0.0001 39 REACTOME_CLASS_B_2_SECRETIN_FAMILY_RECEPTORS 0 87 2.29 0.0000 0.0001 40 KONDO_PROSTATE_CANCER_HCP_WITH_H3K27ME3 1 95 2.28 0.0000 0.0115 41 DAWSON_METHYLATED_IN_LYMPHOMA_TCL1 0 57 2.27 0.0000 0.0001 42 PEREZ_TP53_AND_TP63_TARGETS 0 194 2.26 0.0000 0.0001 43 NIKOLSKY_BREAST_CANCER_16P13_AMPLICON 0 113 2.26 0.0000 0.0001 44 WANG_MLL_TARGETS 0 280 2.25 0.0000 0.0155 45 SCHRAETS_MLL_TARGETS_DN 0 32 2.23 0.0000 0.0200 46 BEGUM_TARGETS_OF_PAX3_FOXO1_FUSION_DN 0 45 2.23 0.0000 0.0002 47 ROZANOV_MMP14_TARGETS_DN 0 33 2.23 0.0000 0.0002 48 MEISSNER_NPC_HCP_WITH_H3K4ME3_AND_H3K27ME3 1 139 2.21 0.0000 0.0242 49 YAO_TEMPORAL_RESPONSE_TO_PROGESTERONE_CLUSTER_4 0 15 2.20 0.0000 0.0286 50 MEISSNER_NPC_HCP_WITH_H3_UNMETHYLATED 1 505 2.19 0.0000 0.0301
29
Supplemental Table 2. (B) Top 50 GSEA hits for H3K27me3 ChIP-seq target genes in Kelly cells. PRC2 related gene sets are significantly over-represented in the collection of GSEA hits (odds-ratios = 8.1, P < 0.001, according to the two-tailed Fisher exact test). Rank Gene Set PRC2
Complex Size NES P FDR
1 MEISSNER_NPC_HCP_WITH_H3K27ME3 1 78 1.82 0.0000 0.0000 2 MEISSNER_BRAIN_HCP_WITH_H3K27ME3 1 263 1.80 0.0000 0.0000 3 RORIE_TARGETS_OF_EWSR1_FLI1_FUSION_UP 0 27 1.69 0.0000 0.0056 4 MIKKELSEN_NPC_HCP_WITH_H3K27ME3 1 332 1.69 0.0000 0.0042 5 BENPORATH_PRC2_TARGETS 1 615 1.68 0.0000 0.0000 6 SHIN_B_CELL_LYMPHOMA_CLUSTER_9 0 19 1.67 0.0000 0.0000 7 MIKKELSEN_IPS_WITH_HCP_H3K27ME3 1 99 1.66 0.0000 0.0130 8 AIGNER_ZEB1_TARGETS 0 34 1.65 0.0000 0.0000 9 YAO_TEMPORAL_RESPONSE_TO_PROGESTERONE_CLUSTER_4 0 15 1.65 0.0000 0.0115
10 WONG_ENDMETRIUM_CANCER_UP 0 25 1.65 0.0000 0.0000 11 WANG_THOC1_TARGETS_DN 0 18 1.64 0.0010 0.0171 12 KEGG_MATURITY_ONSET_DIABETES_OF_THE_YOUNG 0 25 1.64 0.0000 0.0153 13 MEISSNER_NPC_HCP_WITH_H3K4ME2_AND_H3K27ME3 1 339 1.64 0.0000 0.0156 14 DAZARD_UV_RESPONSE_CLUSTER_G28 0 18 1.64 0.0010 0.0141 15 MATZUK_IMPLANTATION_AND_UTERINE 0 22 1.62 0.0000 0.0189 16 MIKKELSEN_MEF_HCP_WITH_H3K27ME3 1 569 1.62 0.0000 0.0189 17 MATZUK_EMBRYONIC_GERM_CELL 0 19 1.61 0.0000 0.0209 18 REACTOME_REGULATION_OF_BETA_CELL_DEVELOPMENT 0 30 1.61 0.0000 0.0206 19 BENPORATH_EED_TARGETS 1 999 1.61 0.0000 0.0001 20 YAO_HOXA10_TARGETS_VIA_PROGESTERONE_DN 0 17 1.61 0.0020 0.0212 21 BENPORATH_SUZ12_TARGETS 1 984 1.60 0.0000 0.0001 22 HE_PTEN_TARGETS_UP 0 16 1.59 0.0010 0.0002 23 SHIN_B_CELL_LYMPHOMA_CLUSTER_5 0 16 1.59 0.0000 0.0002 24 RIZ_ERYTHROID_DIFFERENTIATION_APOBEC2 0 24 1.59 0.0000 0.0002 25 MIKKELSEN_MCV6_HCP_WITH_H3K27ME3 1 418 1.59 0.0000 0.0344 26 REACTOME_OLFACTORY_SIGNALING_PATHWAY 0 298 1.56 0.0000 0.0005 27 GAURNIER_PSMD4_TARGETS 0 52 1.56 0.0000 0.0664 28 LIEN_BREAST_CARCINOMA_METAPLASTIC 0 35 1.56 0.0010 0.0004 29 LI_WILMS_TUMOR 0 25 1.55 0.0010 0.0779 30 STREICHER_LSM1_TARGETS_DN 0 19 1.55 0.0010 0.0006 31 CUI_TCF21_TARGETS_DN 0 28 1.55 0.0010 0.0815 32 SCHLESINGER_H3K27ME3_IN_NORMAL_AND_METHYLATED_IN_CANCER 1 28 1.54 0.0020 0.0006 33 REACTOME_GABA_SYNTHESIS_RELEASE_REUPTAKE_AND_DEGRADATION 0 17 1.54 0.0020 0.0899 34 SCHLESINGER_METHYLATED_DE_NOVO_IN_CANCER 0 85 1.54 0.0000 0.0006 35 MEISSNER_BRAIN_HCP_WITH_H3K4ME2_AND_H3K27ME3 1 56 1.54 0.0000 0.0933 36 WANG_BARRETTS_ESOPHAGUS_AND_ESOPHAGUS_CANCER_DN 0 35 1.53 0.0000 0.0009 37 KEGG_OLFACTORY_TRANSDUCTION 0 362 1.53 0.0000 0.0932 38 SMID_BREAST_CANCER_RELAPSE_IN_PLEURA_DN 0 23 1.53 0.0030 0.0906 39 PYEON_CANCER_HEAD_AND_NECK_VS_CERVICAL_DN 0 20 1.53 0.0010 0.0879 40 HINATA_NFKB_TARGETS_KERATINOCYTE_DN 0 22 1.53 0.0010 0.0864 41 BIOCARTA_ALK_PATHWAY 0 37 1.53 0.0000 0.0885 42 CHARAFE_BREAST_CANCER_BASAL_VS_MESENCHYMAL_UP 0 114 1.53 0.0000 0.0010 43 FARMER_BREAST_CANCER_CLUSTER_1 0 41 1.52 0.0000 0.0009 44 MIKKELSEN_MCV6_LCP_WITH_H3K27ME3 1 27 1.52 0.0020 0.1006 45 LEE_NAIVE_T_LYMPHOCYTE 0 16 1.52 0.0010 0.1017 46 REACTOME_IMMUNOREGULATORY_INTERACTIONS_BETWEEN_A_LYMPHOID_ 0 54 1.52 0.0000 0.0015 47 GU_PDEF_TARGETS_DN 0 37 1.51 0.0000 0.1110 48 RIZ_ERYTHROID_DIFFERENTIATION_6HR 0 40 1.51 0.0000 0.0014 49 SHIN_B_CELL_LYMPHOMA_CLUSTER_2 0 29 1.51 0.0010 0.0012 50 RIZ_ERYTHROID_DIFFERENTIATION_HBZ 0 41 1.51 0.0010 0.0014
30
Supplemental Table 2. (C) Top 50 GSEA hits for EZH2 ChIP-seq target genes in LAN-1 cells. PRC2 related gene sets are significantly over-represented in the collection of GSEA hits (odds-ratios = 7.9, P < 0.001 according to the two-tailed Fisher exact test). Rank Gene Set PRC2
Complex Size NES P FDR
1 MEISSNER_BRAIN_HCP_WITH_H3K27ME3 1 262 3.74 0.0000 0.0000 2 MIKKELSEN_NPC_HCP_WITH_H3K27ME3 1 333 3.65 0.0000 0.0000 3 MEISSNER_NPC_HCP_WITH_H3K27ME3 1 79 3.57 0.0000 0.0000 4 MEISSNER_NPC_HCP_WITH_H3K4ME2_AND_H3K27ME3 1 338 3.51 0.0000 0.0000 5 MIKKELSEN_MCV6_HCP_WITH_H3K27ME3 1 419 3.44 0.0000 0.0000 6 MIKKELSEN_IPS_WITH_HCP_H3K27ME3 1 100 3.43 0.0000 0.0000 7 BENPORATH_PRC2_TARGETS 1 617 3.36 0.0000 0.0000 8 MIKKELSEN_MEF_HCP_WITH_H3K27ME3 1 568 3.25 0.0000 0.0000 9 MARTENS_TRETINOIN_RESPONSE_UP 0 804 3.01 0.0000 0.0000
10 BENPORATH_SUZ12_TARGETS 1 987 2.99 0.0000 0.0000 11 SCHLESINGER_METHYLATED_DE_NOVO_IN_CANCER 0 86 2.83 0.0000 0.0000 12 MIKKELSEN_NPC_HCP_WITH_H3K4ME3_AND_H3K27ME3 1 204 2.78 0.0000 0.0000 13 LI_WILMS_TUMOR 0 26 2.77 0.0000 0.0000 14 REACTOME_REGULATION_OF_BETA_CELL_DEVELOPMENT 0 30 2.57 0.0000 0.0000 15 KEGG_HEDGEHOG_SIGNALING_PATHWAY 0 56 2.55 0.0000 0.0001 16 MEISSNER_NPC_HCP_WITH_H3K4ME3_AND_H3K27ME3 1 139 2.52 0.0000 0.0001 17 NIKOLSKY_BREAST_CANCER_5P15_AMPLICON 0 26 2.51 0.0000 0.0000 18 NIKOLSKY_BREAST_CANCER_16P13_AMPLICON 0 114 2.46 0.0000 0.0000 19 REACTOME_CLASS_B_2_SECRETIN_FAMILY_RECEPTORS 0 87 2.44 0.0000 0.0013 20 RIZ_ERYTHROID_DIFFERENTIATION_6HR 0 40 2.42 0.0000 0.0000 21 RIZ_ERYTHROID_DIFFERENTIATION_APOBEC2 0 24 2.41 0.0000 0.0000 22 WINNEPENNINCKX_MELANOMA_METASTASIS_DN 0 41 2.40 0.0000 0.0016 23 MEISSNER_NPC_HCP_WITH_H3K4ME2 1 476 2.39 0.0000 0.0018 24 RIZ_ERYTHROID_DIFFERENTIATION_12HR 0 42 2.38 0.0000 0.0000 25 MEISSNER_BRAIN_HCP_WITH_H3K4ME2_AND_H3K27ME3 1 56 2.37 0.0000 0.0020 26 FUKUSHIMA_TNFSF11_TARGETS 0 15 2.36 0.0000 0.0021 27 KEGG_BASAL_CELL_CARCINOMA 0 55 2.31 0.0000 0.0038 28 WANG_THOC1_TARGETS_DN 0 19 2.31 0.0000 0.0000 29 REACTOME_POTASSIUM_CHANNELS 0 97 2.30 0.0000 0.0046 30 KONDO_PROSTATE_CANCER_HCP_WITH_H3K27ME3 1 95 2.29 0.0000 0.0047 31 THEODOROU_MAMMARY_TUMORIGENESIS 0 28 2.28 0.0000 0.0000 32 RORIE_TARGETS_OF_EWSR1_FLI1_FUSION_UP 0 27 2.28 0.0011 0.0050 33 CAMPS_COLON_CANCER_COPY_NUMBER_UP 0 86 2.28 0.0000 0.0049 34 PARK_TRETINOIN_RESPONSE_AND_PML_RARA_FUSION 0 29 2.28 0.0000 0.0048 35 LEIN_CEREBELLUM_MARKERS 0 80 2.28 0.0000 0.0046 36 MCGARVEY_SILENCED_BY_METHYLATION_IN_COLON_CANCER 0 41 2.27 0.0000 0.0048 37 HANN_RESISTANCE_TO_BCL2_INHIBITOR_UP 0 35 2.26 0.0000 0.0051 38 HOQUE_METHYLATED_IN_CANCER 1 56 2.25 0.0000 0.0000 39 MIKKELSEN_ES_ICP_WITH_H3K27ME3 1 39 2.24 0.0000 0.0000 40 MATZUK_IMPLANTATION_AND_UTERINE 0 22 2.24 0.0011 0.0058 41 MEISSNER_NPC_HCP_WITH_H3_UNMETHYLATED 1 506 2.24 0.0000 0.0058 42 KEGG_MATURITY_ONSET_DIABETES_OF_THE_YOUNG 0 25 2.23 0.0000 0.0063 43 RIZ_ERYTHROID_DIFFERENTIATION_HBZ 0 41 2.23 0.0000 0.0001 44 LOPES_METHYLATED_IN_COLON_CANCER_UP 0 27 2.22 0.0000 0.0067 45 CERIBELLI_PROMOTERS_INACTIVE_AND_BOUND_BY_NFY 0 33 2.18 0.0000 0.0001 46 REACTOME_VOLTAGE_GATED_POTASSIUM_CHANNELS 0 43 2.15 0.0000 0.0148 47 BEGUM_TARGETS_OF_PAX3_FOXO1_FUSION_DN 0 44 2.15 0.0000 0.0002 48 HALMOS_CEBPA_TARGETS_DN 0 44 2.14 0.0000 0.0161 49 VALK_AML_WITH_FLT3_ITD 0 39 2.14 0.0000 0.0002 50 NIKOLSKY_BREAST_CANCER_20Q12_Q13_AMPLICON 0 136 2.14 0.0000 0.0003
31

Supplemental Table 2. (D) Top 50 GSEA hits for H3K27me3 ChIP-seq target genes in LAN-1 cells. PRC2 related gene sets are significantly over-represented in the collection of GSEA hits (odds-ratios = 9.5, P < 0.001 according to the two-tailed Fisher exact test). Rank Gene Set PRC2
Complex Size NES P FDR
1 MEISSNER_NPC_HCP_WITH_H3K27ME3 1 79 2.03 0.0000 0.0000 2 MEISSNER_BRAIN_HCP_WITH_H3K27ME3 1 262 1.99 0.0000 0.0000 3 MIKKELSEN_NPC_HCP_WITH_H3K27ME3 1 333 1.92 0.0000 0.0003 4 MIKKELSEN_IPS_WITH_HCP_H3K27ME3 1 100 1.88 0.0000 0.0004 5 NIKOLSKY_BREAST_CANCER_5P15_AMPLICON 0 26 1.87 0.0000 0.0000 6 LI_WILMS_TUMOR 0 26 1.85 0.0000 0.0011 7 MEISSNER_NPC_HCP_WITH_H3K4ME2_AND_H3K27ME3 1 338 1.85 0.0000 0.0009 8 BENPORATH_PRC2_TARGETS 1 617 1.82 0.0000 0.0000 9 KEGG_MATURITY_ONSET_DIABETES_OF_THE_YOUNG 0 25 1.80 0.0000 0.0035
10 MIKKELSEN_MCV6_HCP_WITH_H3K27ME3 1 419 1.80 0.0000 0.0039 11 SCHLESINGER_METHYLATED_DE_NOVO_IN_CANCER 0 86 1.78 0.0000 0.0000 12 MIKKELSEN_MEF_HCP_WITH_H3K27ME3 1 568 1.78 0.0000 0.0061 13 KEGG_HEDGEHOG_SIGNALING_PATHWAY 0 56 1.78 0.0000 0.0060 14 REACTOME_REGULATION_OF_BETA_CELL_DEVELOPMENT 0 30 1.77 0.0000 0.0000 15 RORIE_TARGETS_OF_EWSR1_FLI1_FUSION_UP 0 27 1.77 0.0000 0.0000 16 CERIBELLI_PROMOTERS_INACTIVE_AND_BOUND_BY_NFY 0 33 1.74 0.0000 0.0163 17 LOPES_METHYLATED_IN_COLON_CANCER_UP 0 27 1.74 0.0000 0.0001 18 MARTENS_TRETINOIN_RESPONSE_UP 0 804 1.72 0.0000 0.0261 19 BEGUM_TARGETS_OF_PAX3_FOXO1_FUSION_DN 0 44 1.72 0.0000 0.0002 20 BENPORATH_SUZ12_TARGETS 1 987 1.71 0.0000 0.0002 21 FUKUSHIMA_TNFSF11_TARGETS 0 15 1.70 0.0011 0.0420 22 WATANABE_COLON_CANCER_MSI_VS_MSS_UP 0 26 1.70 0.0000 0.0003 23 ZHENG_RESPONSE_TO_ARSENITE_UP 0 18 1.69 0.0000 0.0002 24 THEODOROU_MAMMARY_TUMORIGENESIS 0 28 1.69 0.0000 0.0003 25 RIZ_ERYTHROID_DIFFERENTIATION_APOBEC2 0 24 1.69 0.0000 0.0004 26 SHIN_B_CELL_LYMPHOMA_CLUSTER_5 0 16 1.69 0.0000 0.0003 27 VALK_AML_WITH_FLT3_ITD 0 39 1.69 0.0000 0.0452 28 REACTOME_NA_CL_DEPENDENT_NEUROTRANSMITTER_TRANSPORTERS 0 17 1.69 0.0010 0.0005 29 KEGG_BASAL_CELL_CARCINOMA 0 55 1.68 0.0000 0.0513 30 MAHADEVAN_IMATINIB_RESISTANCE_DN 0 20 1.68 0.0020 0.0005 31 MATZUK_IMPLANTATION_AND_UTERINE 0 22 1.68 0.0000 0.0536 32 VANDESLUIS_COMMD1_TARGETS_GROUP_4_DN 0 15 1.68 0.0011 0.0526 33 WANG_THOC1_TARGETS_DN 0 19 1.67 0.0000 0.0540 34 RIZ_ERYTHROID_DIFFERENTIATION_12HR 0 42 1.67 0.0000 0.0007 35 REACTOME_ACTIVATED_POINT_MUTANTS_OF_FGFR2 0 16 1.66 0.0021 0.0669 36 LOPES_METHYLATED_IN_COLON_CANCER_DN 0 28 1.66 0.0000 0.0005 37 HALMOS_CEBPA_TARGETS_DN 0 44 1.66 0.0000 0.0005 38 RIZ_ERYTHROID_DIFFERENTIATION_HBZ 0 41 1.66 0.0000 0.0008 39 REACTOME_CLASS_B_2_SECRETIN_FAMILY_RECEPTORS 0 87 1.65 0.0000 0.0010 40 MEISSNER_BRAIN_HCP_WITH_H3K4ME2_AND_H3K27ME3 1 56 1.65 0.0000 0.0813 41 MIKKELSEN_NPC_HCP_WITH_H3K4ME3_AND_H3K27ME3 1 204 1.65 0.0000 0.0792 42 LU_TUMOR_ANGIOGENESIS_UP 0 25 1.65 0.0020 0.0776 43 REACTOME_REGULATION_OF_GENE_EXPRESSION_IN_BETA_CELLS 0 20 1.64 0.0021 0.0012 44 KORKOLA_CORRELATED_WITH_POU5F1 0 34 1.64 0.0010 0.0894 45 ALONSO_METASTASIS_DN 0 23 1.63 0.0020 0.0928 46 PARK_TRETINOIN_RESPONSE_AND_PML_RARA_FUSION 0 29 1.63 0.0000 0.0924 47 HANN_RESISTANCE_TO_BCL2_INHIBITOR_UP 0 35 1.63 0.0000 0.0008 48 MIKKELSEN_MCV6_LCP_WITH_H3K27ME3 1 27 1.62 0.0010 0.1012 49 FIGUEROA_AML_METHYLATION_CLUSTER_5_DN 0 47 1.62 0.0000 0.1020 50 RIZ_ERYTHROID_DIFFERENTIATION_6HR 0 40 1.62 0.0000 0.0016
32

Supplemental Table 3. Custom neuroblastoma PRC2 signatures consisting of the top 300 EZH2 and H3K27me3 ChIP-seq target genes in Kelly and LAN-1 cell lines. Shown in table are the EZH2 and H3K27me3 promoter relative binding signal in Kelly and LAN-1 cells. Genes were ranked in decreasing order based on the promoter binding signal in the highlighted ranking score column. The high level for the relative occupancy signal in the promoter regions was estimated based on the cut-off 1.5 for the ratio of the AUC ChIP-seq signal of the mark vs the AUC signal of the input. (A) Custom neuroblastoma PRC2 signature consisting of the top 300 EZH2 ChIP-seq target genes in Kelly cells.
# Gene Kelly rel AUC EZH2 (ranking score)
Kelly rel AUC H3K27me3
LAN-1 rel AUC EZH2
LAN-1 rel AUC H3K27me3
1 NFATC1 32.51 23.21 8.52 11.65 2 PAX2 18.04 13.13 9.27 11.36 3 PDGFA 17.82 12.54 6.60 9.41 4 LBX1 17.76 10.41 5.29 8.45 5 NKX1-1 17.14 8.88 2.30 3.80 6 SOX8 16.45 12.54 5.57 11.05 7 PRDM12 15.81 8.51 5.55 6.50 8 SIGIRR 13.33 18.72 1.50 2.04 9 LHX5 12.77 10.54 5.23 7.65
10 ZIC1 12.60 10.24 0.88 0.39 11 FOXL2 12.53 10.62 4.23 6.50 12 EN2 12.41 10.34 6.53 9.53 13 SORCS3 12.35 11.54 3.49 6.60 14 HOXC12 12.26 10.61 4.52 7.43 15 LMX1B 12.23 10.09 6.93 9.23 16 FOXF1 12.13 7.53 5.56 8.73 17 GATA4 12.04 10.44 3.35 5.17 18 FOXF2 12.04 7.84 4.29 6.86 19 HES4 11.41 10.22 1.18 0.49 20 IRX1 11.30 7.80 3.52 7.59 21 ZIC2 11.22 7.69 6.31 9.76 22 TBX15 10.94 8.77 3.14 6.40 23 EVX1 10.74 9.50 3.28 7.78 24 OLIG2 10.30 9.01 4.33 8.13 25 GBX2 10.23 9.71 1.19 1.74 26 IRX2 10.20 7.85 3.54 6.33 27 HOXB8 10.05 7.42 8.66 12.41 28 BARX1 10.02 6.81 2.71 5.38 29 EMX1 9.97 8.39 5.55 8.53 30 NKX2-2 9.70 7.01 5.16 9.46 31 GATA6 9.63 7.77 4.69 8.26 32 MN1 9.51 7.56 6.66 12.22 33 TFAP2C 9.41 7.83 2.67 5.29 34 OTX2 9.36 8.40 2.81 5.81 35 LHX2 9.36 8.05 3.08 5.21 36 EGR3 9.29 8.00 2.30 3.47 37 FLT4 9.28 12.36 2.97 7.02 38 ATHL1 9.17 12.57 1.56 1.63 39 SOX21 9.15 9.13 2.51 5.47 40 HOXB7 8.92 7.41 7.55 12.16 41 NKX2-5 8.84 7.82 3.05 5.01 42 SOX3 8.83 6.40 3.18 5.20 43 SIM2 8.78 6.87 3.54 5.86 44 PRDM16 8.72 7.89 8.90 15.23 45 ALX4 8.59 8.11 3.48 7.03 46 VENTX 8.56 8.51 5.50 11.58 47 OVOL1 8.56 7.78 2.62 6.07 48 ZIC5 8.54 7.21 3.91 7.16 49 PAX7 8.40 7.11 5.88 8.93 50 BNC1 8.38 7.42 2.35 3.49 51 TNFRSF18 8.31 10.59 2.88 7.59 52 GATA5 8.28 7.51 4.87 9.10 53 SALL3 8.15 8.20 1.79 4.52 54 NKX2-3 8.14 7.07 5.10 9.02 55 SOX14 8.04 8.74 2.79 5.51 56 FOXB1 8.04 8.62 2.70 6.34 57 HOXA6 8.04 7.37 3.08 6.71 58 HOXA5 8.04 7.37 3.08 6.71 59 HOXA7 8.04 7.37 3.08 6.71 60 PRDM13 7.89 8.12 2.00 3.95 61 ZIC4 7.82 7.84 0.89 0.58 62 HOXA11 7.81 8.34 4.68 9.05 63 PPL 7.71 9.56 2.13 5.44 64 DMRTA2 7.70 7.32 1.51 3.30 65 GCGR 7.69 7.45 1.23 3.03 66 KLF2 7.66 8.67 2.82 5.26
33

# Gene Kelly rel AUC EZH2 (ranking score)
Kelly rel AUC H3K27me3
LAN-1 rel AUC EZH2
LAN-1 rel AUC H3K27me3
67 IRX4 7.61 8.30 6.13 10.81 68 NKX2-8 7.59 7.92 3.05 7.71 69 SLC32A1 7.47 9.07 2.24 5.10 70 LHX1 7.46 8.95 5.24 7.60 71 TBX1 7.40 7.56 5.43 9.21 72 UTF1 7.39 8.17 2.56 6.89 73 EBF2 7.34 8.07 4.17 8.26 74 NOTCH1 7.30 5.72 5.71 11.09 75 GPR123 7.18 8.41 3.10 5.83 76 HOXB9 7.13 7.04 4.66 8.97 77 SHH 7.02 7.95 4.44 7.17 78 INHBB 6.99 7.35 5.49 8.34 79 CBFA2T3 6.95 8.67 4.14 10.05 80 HOXB6 6.94 7.83 4.51 9.53 81 HOXB5 6.94 7.83 4.51 9.53 82 BARX2 6.94 6.93 3.52 5.40 83 LHX6 6.90 7.47 2.69 4.31 84 CACNA1H 6.89 7.06 1.75 2.00 85 FOXC2 6.81 6.05 2.35 5.54 86 FIBCD1 6.78 9.20 5.36 11.43 87 ONECUT1 6.77 7.06 1.84 4.11 88 DMRT3 6.77 7.01 3.36 8.10 89 TPSG1 6.75 6.30 1.86 1.40 90 PRDM14 6.72 7.58 1.70 1.96 91 SLC24A4 6.64 9.46 2.18 5.48 92 RREB1 6.63 5.92 2.33 4.45 93 HOXB4 6.61 7.13 2.95 5.82 94 THPO 6.57 8.06 2.02 2.76 95 TTLL10 6.57 6.47 2.62 5.85 96 FOXA1 6.56 6.96 1.37 2.21 97 EFNA2 6.51 8.34 1.27 1.50 98 FOXP2 6.49 6.79 2.95 4.56 99 NEUROD2 6.45 6.48 6.29 9.43
100 CXCL16 6.44 10.12 3.15 7.32 101 TLX1 6.43 6.76 3.29 6.68 102 MSX1 6.42 6.87 2.69 4.67 103 COMP 6.40 7.23 3.43 5.72 104 CHRD 6.37 7.82 2.22 2.94 105 ESPN 6.37 7.44 2.99 6.65 106 GAD2 6.23 7.11 2.79 6.86 107 PAX3 6.23 6.80 3.34 6.17 108 AJAP1 6.22 8.11 3.91 8.24 109 LHX4 6.22 5.80 2.08 3.66 110 ZMYND15 6.18 9.62 3.15 7.36 111 GAD1 6.18 7.14 2.02 5.26 112 LMX1A 6.17 5.86 2.23 4.89 113 FGFRL1 6.15 8.12 1.69 2.00 114 NR2E1 6.13 6.13 2.45 5.08 115 CDX2 6.12 5.20 11.43 19.24 116 C1ORF94 6.11 9.61 2.77 5.73 117 MUC5B 6.04 8.93 3.85 9.44 118 OVOL2 6.03 6.56 2.42 5.27 119 DRD4 6.02 6.10 1.38 0.59 120 OTP 6.02 6.02 2.48 5.32 121 EN1 5.94 5.66 3.19 6.39 122 HES2 5.92 6.57 3.95 8.22 123 RELN 5.90 9.95 1.72 3.82 124 PRKCZ 5.89 7.47 3.29 7.65 125 NPTX1 5.89 6.01 6.66 10.93 126 KLHDC7B 5.88 6.71 1.71 2.95 127 SLC30A3 5.84 7.27 1.25 0.63 128 POU4F3 5.84 7.03 2.42 4.85 129 COL12A1 5.81 7.17 0.81 1.07 130 GSC 5.81 6.41 2.56 4.98 131 ICAM5 5.80 8.51 1.33 0.54 132 HBB 5.79 2.15 2.06 1.55 133 NTN1 5.78 5.89 2.09 5.38 134 DGKQ 5.77 7.79 1.26 0.74 135 GPC4 5.77 7.36 2.91 6.04 136 TFAP2A 5.75 5.83 3.45 6.21 137 FZD10 5.72 6.68 2.64 6.25 138 HOXC13 5.67 7.55 1.93 5.08 139 HTRA1 5.67 7.30 2.40 4.04 140 HOXC11 5.67 5.50 3.26 5.74 141 PAX9 5.67 5.27 4.15 6.77 142 ATP2A3 5.66 7.38 2.13 5.91
34

# Gene Kelly rel AUC EZH2 (ranking score)
Kelly rel AUC H3K27me3
LAN-1 rel AUC EZH2
LAN-1 rel AUC H3K27me3
143 OLIG3 5.62 5.29 2.88 7.35 144 RASSF7 5.55 6.14 2.50 4.68 145 DSP 5.53 5.78 3.27 5.91 146 ITGB2 5.47 8.13 3.50 8.17 147 GABRD 5.45 6.21 4.40 10.95 148 DLX4 5.43 6.36 2.61 6.21 149 EMX2OS 5.41 5.62 3.05 5.72 150 GRWD1 5.41 3.46 0.76 0.75 151 SIX1 5.40 7.25 2.66 4.73 152 HOXA10 5.39 6.64 2.80 6.33 153 BARHL1 5.38 5.73 5.29 8.60 154 ATAD3C 5.37 7.68 1.28 0.98 155 WNT7B 5.34 6.44 4.23 7.47 156 HS3ST6 5.33 6.64 2.23 4.82 157 TPSD1 5.31 6.81 1.66 1.57 158 ADAM3A 5.27 3.14 0.53 0.48 159 HMX2 5.22 6.65 3.79 6.95 160 LHX3 5.22 3.61 3.77 4.98 161 OLIG1 5.21 8.98 1.96 4.63 162 FOXQ1 5.21 6.59 4.25 9.51 163 NFIX 5.20 5.28 2.65 4.57 164 FOXD2 5.20 4.79 2.40 4.90 165 MMP25 5.18 5.95 2.74 4.96 166 NOG 5.15 6.75 2.74 6.11 167 OSR1 5.14 6.57 1.85 4.65 168 FGF3 5.14 4.72 3.92 7.28 169 CSMD2 5.11 8.14 2.74 5.74 170 TCF21 5.10 9.71 1.84 4.65 171 FOXL1 5.10 7.18 1.88 5.11 172 NEUROG3 5.08 6.19 3.22 6.91 173 SIX6 5.08 4.86 2.53 4.39 174 NRK 5.04 7.20 1.04 1.75 175 FOXE1 5.03 6.18 1.13 2.84 176 ACSS1 5.01 6.90 1.88 3.88 177 SIM1 5.01 5.82 1.34 3.10 178 SLC4A11 5.01 5.62 1.97 3.05 179 PTRF 5.00 6.52 3.08 5.68 180 PPAP2C 4.98 7.77 1.91 4.34 181 WTIP 4.98 5.11 1.29 0.55 182 MAF 4.97 6.50 2.05 5.02 183 HOXA13 4.96 5.46 2.15 5.17 184 ITGB4 4.94 8.19 2.05 5.52 185 CRLF1 4.93 5.45 2.29 4.78 186 SP8 4.90 5.50 6.33 11.39 187 GUCY2D 4.88 5.64 1.45 3.94 188 PRDM6 4.87 6.81 2.25 4.10 189 T 4.85 5.25 1.93 4.51 190 FEZF2 4.82 5.55 3.51 6.40 191 FAM110C 4.81 7.04 1.90 3.44 192 IGF2BP2 4.81 6.92 1.67 3.60 193 SCN4B 4.78 8.17 1.95 5.22 194 GRIN3B 4.78 6.07 1.61 3.06 195 SMARCA2 4.78 5.41 1.76 2.20 196 ALDH1A2 4.77 8.75 1.29 1.97 197 IHH 4.76 5.31 1.49 2.76 198 KCNA1 4.76 4.64 2.44 4.45 199 FOXD3 4.75 5.43 4.14 7.56 200 SOX17 4.74 5.11 1.66 4.03 201 ICOSLG 4.74 4.56 3.57 8.03 202 TWIST2 4.73 4.78 1.66 3.88 203 FAM83H 4.72 6.27 2.36 3.78 204 SCO2 4.71 4.93 1.32 1.30 205 CYP26A1 4.68 5.70 2.77 6.30 206 HOXA2 4.68 4.71 3.84 7.46 207 LONRF3 4.63 5.97 1.59 3.04 208 NRN1 4.63 5.48 1.50 3.30 209 KRTAP10-12 4.58 7.05 2.06 4.25 210 C21ORF90 4.58 7.05 2.06 4.25 211 KRTAP10-11 4.58 7.05 2.06 4.25 212 MUC2 4.58 6.12 2.27 6.64 213 WNT1 4.54 5.06 4.12 8.96 214 BMP4 4.53 5.65 1.35 2.33 215 KISS1R 4.52 4.93 2.14 3.89 216 RIPK4 4.51 7.77 2.22 5.85 217 SLITRK2 4.48 7.13 2.35 7.34 218 HEY2 4.48 5.81 1.68 3.64
35

# Gene Kelly rel AUC EZH2 (ranking score)
Kelly rel AUC H3K27me3
LAN-1 rel AUC EZH2
LAN-1 rel AUC H3K27me3
219 SLC1A1 4.47 7.16 2.12 4.99 220 BMP6 4.46 5.44 2.88 5.72 221 ATP8A2 4.45 5.99 3.18 8.23 222 LOC401463 4.45 5.58 1.01 2.50 223 HOXB3 4.42 5.69 2.82 6.31 224 HOXB2 4.42 5.69 2.82 6.31 225 TFAP2E 4.42 5.22 1.19 0.58 226 SSTR5 4.39 3.92 1.69 2.07 227 RAX 4.38 7.16 0.70 0.67 228 IRF4 4.36 5.31 1.89 4.79 229 ACHE 4.35 4.17 2.55 3.26 230 FOXE3 4.34 5.63 1.31 3.57 231 TP73 4.32 3.33 0.82 0.41 232 MATK 4.31 5.59 1.43 3.75 233 FAM43B 4.30 5.90 1.22 0.40 234 PFKL 4.30 5.54 1.61 2.45 235 PAX1 4.29 5.65 3.62 7.48 236 SCT 4.29 5.42 1.33 0.68 237 HOXC10 4.28 5.17 5.37 10.33 238 PAPLN 4.26 6.54 2.05 2.32 239 GRTP1 4.26 6.41 1.05 1.07 240 NPR3 4.26 5.92 0.93 1.06 241 TBX5 4.26 4.34 3.10 6.09 242 BACE2 4.22 7.57 2.44 6.38 243 PRRX1 4.22 6.31 2.41 4.27 244 DLX2 4.22 5.65 1.71 2.64 245 MT1G 4.21 6.39 1.97 5.74 246 GADD45B 4.21 5.96 1.07 1.37 247 ICAM4 4.20 5.62 1.13 0.57 248 GJB2 4.20 5.41 1.83 4.53 249 PHLDA2 4.19 3.95 2.52 5.94 250 PCSK6 4.18 5.30 1.19 1.87 251 FBLN5 4.17 7.83 1.55 2.75 252 THBD 4.16 6.61 1.35 2.91 253 PFKFB3 4.16 5.83 1.59 0.87 254 NKD2 4.16 4.38 2.73 6.11 255 MYO5B 4.14 7.40 3.30 7.61 256 MAD2L2 4.14 6.19 1.69 2.27 257 GPR50 4.12 6.02 1.03 1.29 258 RGL3 4.12 5.83 1.67 2.51 259 GRIN2C 4.12 4.10 2.09 3.50 260 CACNG2 4.11 5.84 1.57 4.34 261 PIK3CD 4.10 5.87 1.51 3.01 262 ZNF92 4.10 3.63 2.15 2.66 263 BCL2L11 4.10 3.20 1.33 1.29 264 MRGPRX3 4.08 8.67 1.09 1.53 265 NR5A1 4.08 3.31 2.11 3.69 266 GLI3 4.06 5.52 3.02 7.17 267 WNT7A 4.05 4.43 2.51 5.13 268 FAM20A 4.04 6.52 1.17 2.38 269 SLC16A6 4.04 6.52 1.17 2.38 270 WIPI1 4.04 6.52 1.17 2.38 271 NTSR1 4.03 5.10 1.89 4.55 272 ROBO3 4.01 7.66 1.46 5.18 273 CDC42EP5 4.01 6.61 2.36 4.96 274 MT1M 4.01 5.43 2.69 6.93 275 HMHA1 4.01 5.16 2.80 5.96 276 SNAPC2 4.01 3.32 1.59 0.87 277 PDGFRA 4.00 4.27 1.07 1.31 278 SLC22A18AS 3.98 3.26 2.89 6.41 279 HOXA1 3.97 5.21 2.57 5.60 280 HOXB13 3.97 5.13 4.07 8.80 281 MUC6 3.96 6.09 2.84 5.90 282 HS3ST3B1 3.96 4.61 1.93 3.25 283 MGC12916 3.96 4.61 1.93 3.25 284 HTR2C 3.95 7.93 1.58 2.74 285 DUSP8 3.94 6.54 3.76 4.88 286 ADRA1A 3.94 6.19 1.02 1.36 287 PTPRT 3.93 4.97 2.17 3.99 288 PPP2R2C 3.92 5.93 2.43 5.46 289 NEUROG1 3.92 5.35 0.85 1.30 290 FOSL1 3.91 5.41 2.50 5.35 291 KCNK4 3.91 3.91 2.40 3.58 292 BAD 3.90 3.34 2.40 3.03 293 GFI1 3.89 5.38 2.28 4.26 294 SVEP1 3.88 8.02 0.60 0.40
36

# Gene Kelly rel AUC EZH2 (ranking score)
Kelly rel AUC H3K27me3
LAN-1 rel AUC EZH2
LAN-1 rel AUC H3K27me3
295 BAIAP3 3.88 7.16 1.56 2.90 296 DLX3 3.88 5.68 3.13 6.67 297 HBM 3.86 6.74 3.26 8.62 298 CACNA1E 3.86 5.71 1.82 4.82 299 MMEL1 3.84 6.59 2.77 6.20 300 CRIM1 3.83 4.87 1.29 2.58
37

Supplemental Table 3. (B) Custom neuroblastoma PRC2 signature consisting of the top 300 H3K27me3 ChIP-seq target genes in Kelly cells.
# Gene Kelly rel AUC H3K27me3 (ranking score)
Kelly rel AUC EZH2
LAN-1 rel AUC H3K27me3
LAN-1 rel AUC EZH2
1 NFATC1 23.21 32.51 11.65 8.52 2 SIGIRR 18.72 13.33 2.04 1.50 3 PAX2 13.13 18.04 11.36 9.27 4 ATHL1 12.57 9.17 1.63 1.56 5 PDGFA 12.54 17.82 9.41 6.60 6 SOX8 12.54 16.45 11.05 5.57 7 FLT4 12.36 9.28 7.02 2.97 8 SORCS3 11.54 12.35 6.60 3.49 9 FOXL2 10.62 12.53 6.50 4.23
10 HOXC12 10.61 12.26 7.43 4.52 11 TNFRSF18 10.59 8.31 7.59 2.88 12 LHX5 10.54 12.77 7.65 5.23 13 GATA4 10.44 12.04 5.17 3.35 14 LBX1 10.41 17.76 8.45 5.29 15 EN2 10.34 12.41 9.53 6.53 16 ZIC1 10.24 12.60 0.39 0.88 17 HES4 10.22 11.41 0.49 1.18 18 CXCL16 10.12 6.44 7.32 3.15 19 LMX1B 10.09 12.23 9.23 6.93 20 RELN 9.95 5.90 3.82 1.72 21 GBX2 9.71 10.23 1.74 1.19 22 TCF21 9.71 5.10 4.65 1.84 23 ZMYND15 9.62 6.18 7.36 3.15 24 C1ORF94 9.61 6.11 5.73 2.77 25 PPL 9.56 7.71 5.44 2.13 26 EVX1 9.50 10.74 7.78 3.28 27 SLC24A4 9.46 6.64 5.48 2.18 28 FIBCD1 9.20 6.78 11.43 5.36 29 SOX21 9.13 9.15 5.47 2.51 30 SLC32A1 9.07 7.47 5.10 2.24 31 OLIG2 9.01 10.30 8.13 4.33 32 ZFYVE28 9.01 3.56 5.62 2.95 33 OLIG1 8.98 5.21 4.63 1.96 34 LHX1 8.95 7.46 7.60 5.24 35 MUC5B 8.93 6.04 9.44 3.85 36 KLK6 8.93 3.80 4.82 2.37 37 NKX1-1 8.88 17.14 3.80 2.30 38 TBX15 8.77 10.94 6.40 3.14 39 ALDH1A2 8.75 4.77 1.97 1.29 40 SOX14 8.74 8.04 5.51 2.79 41 KLF2 8.67 7.66 5.26 2.82 42 CBFA2T3 8.67 6.95 10.05 4.14 43 MRGPRX3 8.67 4.08 1.53 1.09 44 FOXB1 8.62 8.04 6.34 2.70 45 PRDM12 8.51 15.81 6.50 5.55 46 VENTX 8.51 8.56 11.58 5.50 47 ICAM5 8.51 5.80 0.54 1.33 48 GPR123 8.41 7.18 5.83 3.10 49 OTX2 8.40 9.36 5.81 2.81 50 EMX1 8.39 9.97 8.53 5.55 51 HOXA11 8.34 7.81 9.05 4.68 52 EFNA2 8.34 6.51 1.50 1.27 53 IRX4 8.30 7.61 10.81 6.13 54 SALL3 8.20 8.15 4.52 1.79 55 ITGB4 8.19 4.94 5.52 2.05 56 UTF1 8.17 7.39 6.89 2.56 57 SCN4B 8.17 4.78 5.22 1.95 58 CSMD2 8.14 5.11 5.74 2.74 59 ITGB2 8.13 5.47 8.17 3.50 60 PRDM13 8.12 7.89 3.95 2.00 61 FGFRL1 8.12 6.15 2.00 1.69 62 ALX4 8.11 8.59 7.03 3.48 63 AJAP1 8.11 6.22 8.24 3.91 64 EBF2 8.07 7.34 8.26 4.17 65 LOC284379 8.07 2.84 5.71 1.53 66 THPO 8.06 6.57 2.76 2.02 67 LHX2 8.05 9.36 5.21 3.08 68 SVEP1 8.02 3.88 0.40 0.60 69 EGR3 8.00 9.29 3.47 2.30 70 SHH 7.95 7.02 7.17 4.44 71 HTR2C 7.93 3.95 2.74 1.58 72 NKX2-8 7.92 7.59 7.71 3.05 73 PRDM16 7.89 8.72 15.23 8.90
38

# Gene Kelly rel AUC H3K27me3 (ranking score)
Kelly rel AUC EZH2
LAN-1 rel AUC H3K27me3
LAN-1 rel AUC EZH2
74 IRX2 7.85 10.20 6.33 3.54 75 FOXF2 7.84 12.04 6.86 4.29 76 ZIC4 7.84 7.82 0.58 0.89 77 TFAP2C 7.83 9.41 5.29 2.67 78 HOXB6 7.83 6.94 9.53 4.51 79 HOXB5 7.83 6.94 9.53 4.51 80 FBLN5 7.83 4.17 2.75 1.55 81 NKX2-5 7.82 8.84 5.01 3.05 82 CHRD 7.82 6.37 2.94 2.22 83 IRX1 7.80 11.30 7.59 3.52 84 DGKQ 7.79 5.77 0.74 1.26 85 OVOL1 7.78 8.56 6.07 2.62 86 GATA6 7.77 9.63 8.26 4.69 87 PPAP2C 7.77 4.98 4.34 1.91 88 RIPK4 7.77 4.51 5.85 2.22 89 ZIC2 7.69 11.22 9.76 6.31 90 ATAD3C 7.68 5.37 0.98 1.28 91 ROBO3 7.66 4.01 5.18 1.46 92 PRDM14 7.58 6.72 1.96 1.70 93 BACE2 7.57 4.22 6.38 2.44 94 MN1 7.56 9.51 12.22 6.66 95 TBX1 7.56 7.40 9.21 5.43 96 HOXC13 7.55 5.67 5.08 1.93 97 FOXF1 7.53 12.13 8.73 5.56 98 GATA5 7.51 8.28 9.10 4.87 99 LHX6 7.47 6.90 4.31 2.69
100 PRKCZ 7.47 5.89 7.65 3.29 101 KRT85 7.46 3.50 3.01 1.36 102 GCGR 7.45 7.69 3.03 1.23 103 ESPN 7.44 6.37 6.65 2.99 104 HOXB8 7.42 10.05 12.41 8.66 105 BNC1 7.42 8.38 3.49 2.35 106 HOXB7 7.41 8.92 12.16 7.55 107 MYO5B 7.40 4.14 7.61 3.30 108 ATP2A3 7.38 5.66 5.91 2.13 109 HOXA6 7.37 8.04 6.71 3.08 110 HOXA5 7.37 8.04 6.71 3.08 111 HOXA7 7.37 8.04 6.71 3.08 112 GPC4 7.36 5.77 6.04 2.91 113 INHBB 7.35 6.99 8.34 5.49 114 DMRTA2 7.32 7.70 3.30 1.51 115 HTRA1 7.30 5.67 4.04 2.40 116 KIRREL 7.30 3.03 2.98 1.41 117 SLC30A3 7.27 5.84 0.63 1.25 118 SIX1 7.25 5.40 4.73 2.66 119 COMP 7.23 6.40 5.72 3.43 120 ZIC5 7.21 8.54 7.16 3.91 121 NRK 7.20 5.04 1.75 1.04 122 FOXL1 7.18 5.10 5.11 1.88 123 COL12A1 7.17 5.81 1.07 0.81 124 SLC1A1 7.16 4.47 4.99 2.12 125 RAX 7.16 4.38 0.67 0.70 126 BAIAP3 7.16 3.88 2.90 1.56 127 GAD1 7.14 6.18 5.26 2.02 128 HOXB4 7.13 6.61 5.82 2.95 129 SLITRK2 7.13 4.48 7.34 2.35 130 PAX7 7.11 8.40 8.93 5.88 131 GAD2 7.11 6.23 6.86 2.79 132 PVALB 7.10 3.03 5.90 2.48 133 NKX2-3 7.07 8.14 9.02 5.10 134 CACNA1H 7.06 6.89 2.00 1.75 135 ONECUT1 7.06 6.77 4.11 1.84 136 KRTAP10-12 7.05 4.58 4.25 2.06 137 C21ORF90 7.05 4.58 4.25 2.06 138 KRTAP10-11 7.05 4.58 4.25 2.06 139 PDPN 7.05 3.12 4.31 1.60 140 SLC6A20 7.05 2.87 2.27 1.47 141 HOXB9 7.04 7.13 8.97 4.66 142 FAM110C 7.04 4.81 3.44 1.90 143 POU4F3 7.03 5.84 4.85 2.42 144 NKX2-2 7.01 9.70 9.46 5.16 145 DMRT3 7.01 6.77 8.10 3.36 146 NFE2L3 7.01 3.56 1.06 1.24 147 CD1D 6.99 2.90 5.29 2.24 148 IL27 6.99 2.18 1.86 1.41 149 FOXA1 6.96 6.56 2.21 1.37
39
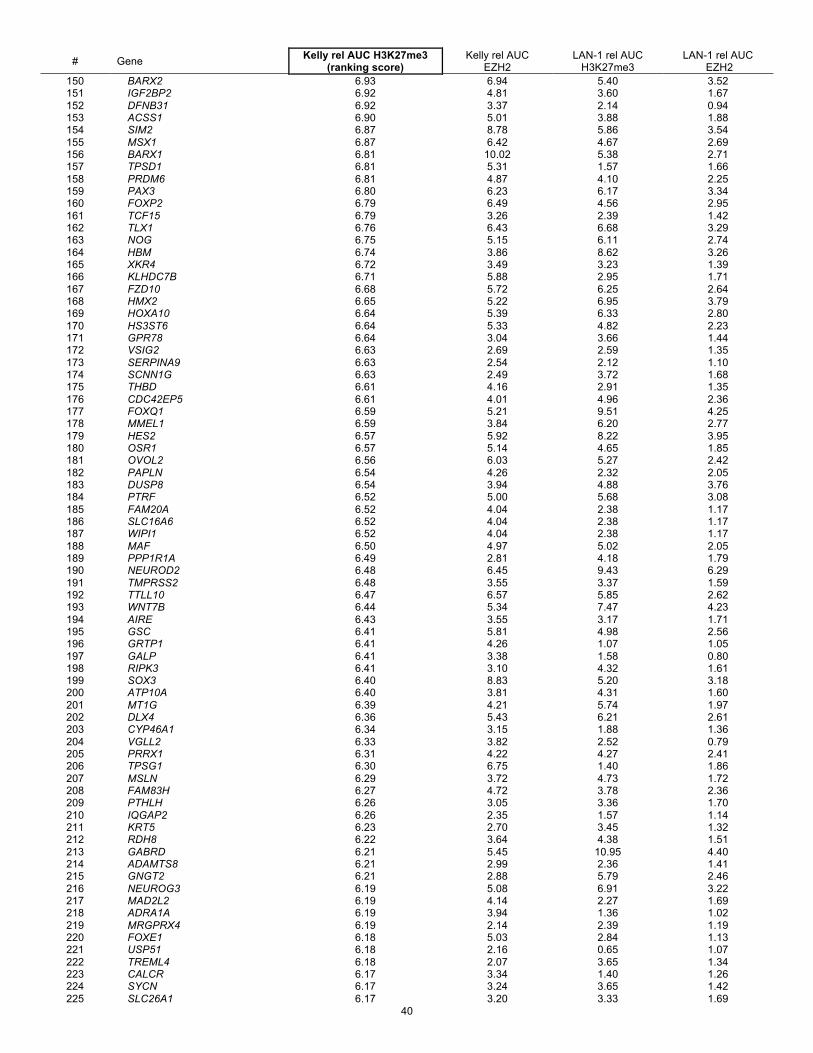
# Gene Kelly rel AUC H3K27me3 (ranking score)
Kelly rel AUC EZH2
LAN-1 rel AUC H3K27me3
LAN-1 rel AUC EZH2
150 BARX2 6.93 6.94 5.40 3.52 151 IGF2BP2 6.92 4.81 3.60 1.67 152 DFNB31 6.92 3.37 2.14 0.94 153 ACSS1 6.90 5.01 3.88 1.88 154 SIM2 6.87 8.78 5.86 3.54 155 MSX1 6.87 6.42 4.67 2.69 156 BARX1 6.81 10.02 5.38 2.71 157 TPSD1 6.81 5.31 1.57 1.66 158 PRDM6 6.81 4.87 4.10 2.25 159 PAX3 6.80 6.23 6.17 3.34 160 FOXP2 6.79 6.49 4.56 2.95 161 TCF15 6.79 3.26 2.39 1.42 162 TLX1 6.76 6.43 6.68 3.29 163 NOG 6.75 5.15 6.11 2.74 164 HBM 6.74 3.86 8.62 3.26 165 XKR4 6.72 3.49 3.23 1.39 166 KLHDC7B 6.71 5.88 2.95 1.71 167 FZD10 6.68 5.72 6.25 2.64 168 HMX2 6.65 5.22 6.95 3.79 169 HOXA10 6.64 5.39 6.33 2.80 170 HS3ST6 6.64 5.33 4.82 2.23 171 GPR78 6.64 3.04 3.66 1.44 172 VSIG2 6.63 2.69 2.59 1.35 173 SERPINA9 6.63 2.54 2.12 1.10 174 SCNN1G 6.63 2.49 3.72 1.68 175 THBD 6.61 4.16 2.91 1.35 176 CDC42EP5 6.61 4.01 4.96 2.36 177 FOXQ1 6.59 5.21 9.51 4.25 178 MMEL1 6.59 3.84 6.20 2.77 179 HES2 6.57 5.92 8.22 3.95 180 OSR1 6.57 5.14 4.65 1.85 181 OVOL2 6.56 6.03 5.27 2.42 182 PAPLN 6.54 4.26 2.32 2.05 183 DUSP8 6.54 3.94 4.88 3.76 184 PTRF 6.52 5.00 5.68 3.08 185 FAM20A 6.52 4.04 2.38 1.17 186 SLC16A6 6.52 4.04 2.38 1.17 187 WIPI1 6.52 4.04 2.38 1.17 188 MAF 6.50 4.97 5.02 2.05 189 PPP1R1A 6.49 2.81 4.18 1.79 190 NEUROD2 6.48 6.45 9.43 6.29 191 TMPRSS2 6.48 3.55 3.37 1.59 192 TTLL10 6.47 6.57 5.85 2.62 193 WNT7B 6.44 5.34 7.47 4.23 194 AIRE 6.43 3.55 3.17 1.71 195 GSC 6.41 5.81 4.98 2.56 196 GRTP1 6.41 4.26 1.07 1.05 197 GALP 6.41 3.38 1.58 0.80 198 RIPK3 6.41 3.10 4.32 1.61 199 SOX3 6.40 8.83 5.20 3.18 200 ATP10A 6.40 3.81 4.31 1.60 201 MT1G 6.39 4.21 5.74 1.97 202 DLX4 6.36 5.43 6.21 2.61 203 CYP46A1 6.34 3.15 1.88 1.36 204 VGLL2 6.33 3.82 2.52 0.79 205 PRRX1 6.31 4.22 4.27 2.41 206 TPSG1 6.30 6.75 1.40 1.86 207 MSLN 6.29 3.72 4.73 1.72 208 FAM83H 6.27 4.72 3.78 2.36 209 PTHLH 6.26 3.05 3.36 1.70 210 IQGAP2 6.26 2.35 1.57 1.14 211 KRT5 6.23 2.70 3.45 1.32 212 RDH8 6.22 3.64 4.38 1.51 213 GABRD 6.21 5.45 10.95 4.40 214 ADAMTS8 6.21 2.99 2.36 1.41 215 GNGT2 6.21 2.88 5.79 2.46 216 NEUROG3 6.19 5.08 6.91 3.22 217 MAD2L2 6.19 4.14 2.27 1.69 218 ADRA1A 6.19 3.94 1.36 1.02 219 MRGPRX4 6.19 2.14 2.39 1.19 220 FOXE1 6.18 5.03 2.84 1.13 221 USP51 6.18 2.16 0.65 1.07 222 TREML4 6.18 2.07 3.65 1.34 223 CALCR 6.17 3.34 1.40 1.26 224 SYCN 6.17 3.24 3.65 1.42 225 SLC26A1 6.17 3.20 3.33 1.69
40

# Gene Kelly rel AUC H3K27me3 (ranking score)
Kelly rel AUC EZH2
LAN-1 rel AUC H3K27me3
LAN-1 rel AUC EZH2
226 NKX3-1 6.16 3.10 1.01 1.02 227 TKTL1 6.15 2.87 0.73 0.89 228 RASSF7 6.14 5.55 4.68 2.50 229 NR2E1 6.13 6.13 5.08 2.45 230 MUC2 6.12 4.58 6.64 2.27 231 KLK10 6.11 3.60 4.32 2.03 232 VDR 6.11 2.20 2.91 0.93 233 DRD4 6.10 6.02 0.59 1.38 234 PAX8 6.10 3.72 3.18 1.67 235 MUC6 6.09 3.96 5.90 2.84 236 DNMT3L 6.09 2.83 3.11 1.37 237 HCK 6.08 3.02 2.75 1.07 238 GRIN3B 6.07 4.78 3.06 1.61 239 IL22RA1 6.07 2.28 5.40 2.15 240 NRGN 6.06 2.96 1.91 1.41 241 FOXC2 6.05 6.81 5.54 2.35 242 KCNT1 6.05 3.46 10.73 4.40 243 LOC442028 6.04 2.60 2.38 0.71 244 PIGR 6.04 1.89 4.93 2.24 245 OTP 6.02 6.02 5.32 2.48 246 GPR50 6.02 4.12 1.29 1.03 247 NPTX1 6.01 5.89 10.93 6.66 248 SLC5A5 6.01 3.41 2.28 1.18 249 ATP12A 6.00 3.00 4.69 1.84 250 NHSL1 6.00 2.73 0.37 0.62 251 ATP8A2 5.99 4.45 8.23 3.18 252 CACNG6 5.99 3.51 4.15 2.53 253 CYP2A6 5.99 2.37 3.32 1.17 254 TMCO4 5.98 3.40 3.77 1.55 255 LONRF3 5.97 4.63 3.04 1.59 256 PRSS22 5.97 3.21 4.53 2.05 257 GADD45B 5.96 4.21 1.37 1.07 258 COL5A3 5.96 3.34 4.81 1.64 259 ACRC 5.96 2.52 0.65 0.78 260 GJB1 5.96 2.52 0.65 0.78 261 ITGB1BP2 5.96 2.52 0.65 0.78 262 TAF1 5.96 2.52 0.65 0.78 263 OGT 5.96 2.52 0.65 0.78 264 NONO 5.96 2.52 0.65 0.78 265 MMP25 5.95 5.18 4.96 2.74 266 FFAR2 5.95 2.78 3.73 1.54 267 PPP2R2C 5.93 3.92 5.46 2.43 268 RREB1 5.92 6.63 4.45 2.33 269 NPR3 5.92 4.26 1.06 0.93 270 UST 5.92 3.76 1.41 0.81 271 ACOXL 5.92 3.76 2.77 0.93 272 FAM43B 5.90 4.30 0.40 1.22 273 SFRP2 5.90 3.67 2.08 1.48 274 NTN1 5.89 5.78 5.38 2.09 275 PIK3CD 5.87 4.10 3.01 1.51 276 CNR2 5.87 2.51 2.82 1.72 277 LMX1A 5.86 6.17 4.89 2.23 278 GRP 5.86 2.30 1.71 1.67 279 CACNG2 5.84 4.11 4.34 1.57 280 TFAP2A 5.83 5.75 6.21 3.45 281 PFKFB3 5.83 4.16 0.87 1.59 282 RGL3 5.83 4.12 2.51 1.67 283 MLXIPL 5.83 3.15 4.13 1.48 284 SIM1 5.82 5.01 3.10 1.34 285 HEY2 5.81 4.48 3.64 1.68 286 LHX4 5.80 6.22 3.66 2.08 287 FAM3B 5.79 2.98 6.64 2.49 288 DSP 5.78 5.53 5.91 3.27 289 TMEM30B 5.78 2.95 1.56 1.22 290 FXYD7 5.78 2.91 2.45 1.18 291 TCP10L 5.77 3.71 2.67 1.50 292 IL1RL2 5.76 3.12 2.57 1.04 293 NOTCH2 5.74 3.51 2.46 1.69 294 KLK11 5.74 2.36 5.36 2.24 295 CST9 5.74 2.16 2.68 1.15 296 BARHL1 5.73 5.38 8.60 5.29 297 ATP8B1 5.73 3.09 1.58 0.91 298 NOTCH1 5.72 7.30 11.09 5.71 299 CACNA1E 5.71 3.86 4.82 1.82 300 NR5A2 5.71 3.14 3.98 1.94
41

Supplemental Table 3. (C) Custom neuroblastoma PRC2 signature consisting of the top 300 EZH2 ChIP-seq target genes in LAN-1 cells.
# Gene LAN-1 rel AUC EZH2 (ranking score)
LAN-1 rel AUC H3K27me3
Kelly rel AUC EZH2
Kelly rel AUC H3K27me3
1 CDX2 11.43 19.24 6.12 5.20 2 PAX2 9.27 11.36 18.04 13.13 3 PRDM16 8.90 15.23 8.72 7.89 4 HOXB8 8.66 12.41 10.05 7.42 5 NFATC1 8.52 11.65 32.51 23.21 6 TMEM132E 7.84 13.22 0.94 0.27 7 HOXB7 7.55 12.16 8.92 7.41 8 EBF3 7.49 11.34 3.11 4.15 9 LMX1B 6.93 9.23 12.23 10.09
10 HOXC9 6.85 10.57 0.95 0.63 11 SERPINA2 6.66 16.44 1.36 4.41 12 MN1 6.66 12.22 9.51 7.56 13 NPTX1 6.66 10.93 5.89 6.01 14 PDGFA 6.60 9.41 17.82 12.54 15 EN2 6.53 9.53 12.41 10.34 16 SP8 6.33 11.39 4.90 5.50 17 ZIC2 6.31 9.76 11.22 7.69 18 NEUROD2 6.29 9.43 6.45 6.48 19 IRX4 6.13 10.81 7.61 8.30 20 PAX7 5.88 8.93 8.40 7.11 21 NOTCH1 5.71 11.09 7.30 5.72 22 SOX8 5.57 11.05 16.45 12.54 23 FOXF1 5.56 8.73 12.13 7.53 24 EMX1 5.55 8.53 9.97 8.39 25 PRDM12 5.55 6.50 15.81 8.51 26 KLK12 5.50 12.51 2.39 5.49 27 VENTX 5.50 11.58 8.56 8.51 28 INHBB 5.49 8.34 6.99 7.35 29 TBX1 5.43 9.21 7.40 7.56 30 ZNF469 5.42 12.27 1.07 0.75 31 HOXC10 5.37 10.33 4.28 5.17 32 FIBCD1 5.36 11.43 6.78 9.20 33 BARHL1 5.29 8.60 5.38 5.73 34 LBX1 5.29 8.45 17.76 10.41 35 LHX1 5.24 7.60 7.46 8.95 36 LHX5 5.23 7.65 12.77 10.54 37 NKX2-2 5.16 9.46 9.70 7.01 38 NKX2-3 5.10 9.02 8.14 7.07 39 CDH4 4.99 8.46 1.37 1.04 40 GATA5 4.87 9.10 8.28 7.51 41 PDGFB 4.84 7.90 3.69 3.76 42 GATA6 4.69 8.26 9.63 7.77 43 HOXA11 4.68 9.05 7.81 8.34 44 HOXB9 4.66 8.97 7.13 7.04 45 HOXC12 4.52 7.43 12.26 10.61 46 HOXB6 4.51 9.53 6.94 7.83 47 HOXB5 4.51 9.53 6.94 7.83 48 CBX4 4.50 5.24 3.71 2.98 49 SHH 4.44 7.17 7.02 7.95 50 CLCNKB 4.41 9.42 0.70 0.23 51 GABRD 4.40 10.95 5.45 6.21 52 KCNT1 4.40 10.73 3.46 6.05 53 OLIG2 4.33 8.13 10.30 9.01 54 GRIK3 4.31 6.58 0.86 0.34 55 FOXF2 4.29 6.86 12.04 7.84 56 TTYH1 4.27 8.53 2.97 5.03 57 KIAA0125 4.26 10.03 1.67 0.97 58 HIC1 4.26 5.13 3.00 3.96 59 FOXQ1 4.25 9.51 5.21 6.59 60 NUDT14 4.23 10.15 1.52 1.97 61 WNT7B 4.23 7.47 5.34 6.44 62 FOXL2 4.23 6.50 12.53 10.62 63 CDH15 4.22 10.54 2.88 4.81 64 EBF2 4.17 8.26 7.34 8.07 65 PKNOX2 4.16 9.10 1.40 0.92 66 PAX9 4.15 6.77 5.67 5.27 67 CBFA2T3 4.14 10.05 6.95 8.67 68 FOXD3 4.14 7.56 4.75 5.43 69 MADCAM1 4.13 6.45 3.64 4.11 70 WNT1 4.12 8.96 4.54 5.06 71 SOHLH1 4.08 9.91 3.47 5.48 72 HOXB13 4.07 8.80 3.97 5.13 73 SLC9A3 4.05 8.47 3.60 4.52
42
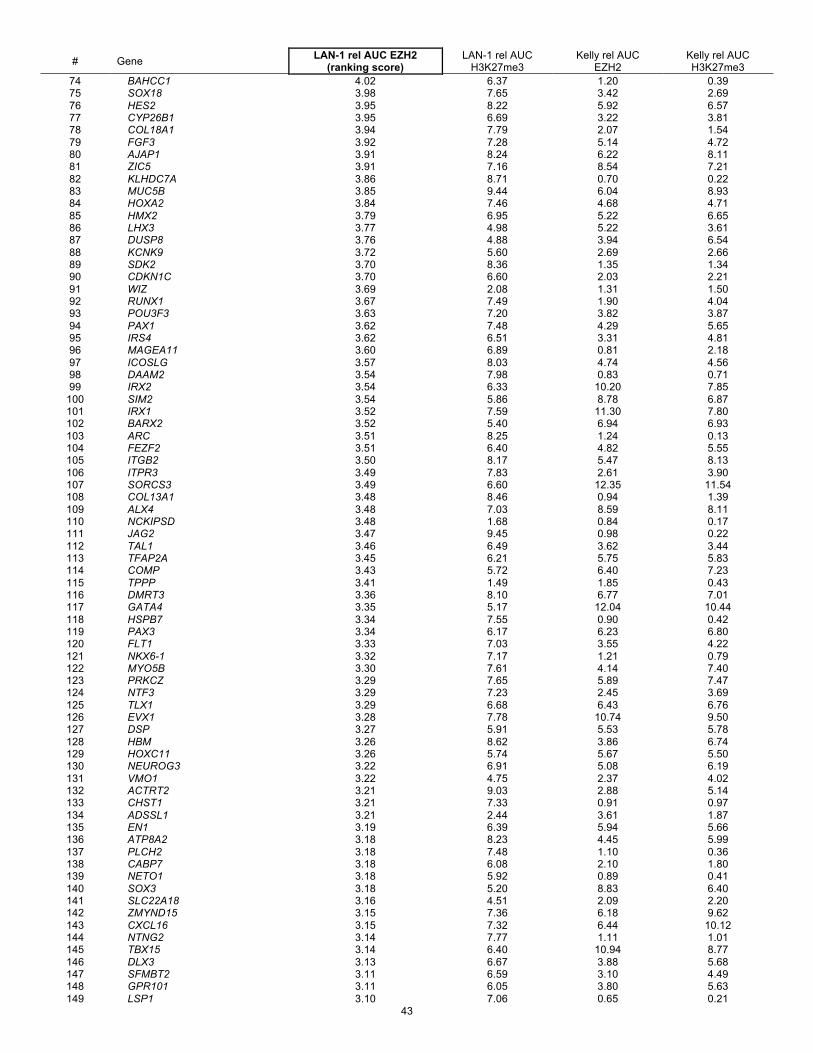
# Gene LAN-1 rel AUC EZH2 (ranking score)
LAN-1 rel AUC H3K27me3
Kelly rel AUC EZH2
Kelly rel AUC H3K27me3
74 BAHCC1 4.02 6.37 1.20 0.39 75 SOX18 3.98 7.65 3.42 2.69 76 HES2 3.95 8.22 5.92 6.57 77 CYP26B1 3.95 6.69 3.22 3.81 78 COL18A1 3.94 7.79 2.07 1.54 79 FGF3 3.92 7.28 5.14 4.72 80 AJAP1 3.91 8.24 6.22 8.11 81 ZIC5 3.91 7.16 8.54 7.21 82 KLHDC7A 3.86 8.71 0.70 0.22 83 MUC5B 3.85 9.44 6.04 8.93 84 HOXA2 3.84 7.46 4.68 4.71 85 HMX2 3.79 6.95 5.22 6.65 86 LHX3 3.77 4.98 5.22 3.61 87 DUSP8 3.76 4.88 3.94 6.54 88 KCNK9 3.72 5.60 2.69 2.66 89 SDK2 3.70 8.36 1.35 1.34 90 CDKN1C 3.70 6.60 2.03 2.21 91 WIZ 3.69 2.08 1.31 1.50 92 RUNX1 3.67 7.49 1.90 4.04 93 POU3F3 3.63 7.20 3.82 3.87 94 PAX1 3.62 7.48 4.29 5.65 95 IRS4 3.62 6.51 3.31 4.81 96 MAGEA11 3.60 6.89 0.81 2.18 97 ICOSLG 3.57 8.03 4.74 4.56 98 DAAM2 3.54 7.98 0.83 0.71 99 IRX2 3.54 6.33 10.20 7.85
100 SIM2 3.54 5.86 8.78 6.87 101 IRX1 3.52 7.59 11.30 7.80 102 BARX2 3.52 5.40 6.94 6.93 103 ARC 3.51 8.25 1.24 0.13 104 FEZF2 3.51 6.40 4.82 5.55 105 ITGB2 3.50 8.17 5.47 8.13 106 ITPR3 3.49 7.83 2.61 3.90 107 SORCS3 3.49 6.60 12.35 11.54 108 COL13A1 3.48 8.46 0.94 1.39 109 ALX4 3.48 7.03 8.59 8.11 110 NCKIPSD 3.48 1.68 0.84 0.17 111 JAG2 3.47 9.45 0.98 0.22 112 TAL1 3.46 6.49 3.62 3.44 113 TFAP2A 3.45 6.21 5.75 5.83 114 COMP 3.43 5.72 6.40 7.23 115 TPPP 3.41 1.49 1.85 0.43 116 DMRT3 3.36 8.10 6.77 7.01 117 GATA4 3.35 5.17 12.04 10.44 118 HSPB7 3.34 7.55 0.90 0.42 119 PAX3 3.34 6.17 6.23 6.80 120 FLT1 3.33 7.03 3.55 4.22 121 NKX6-1 3.32 7.17 1.21 0.79 122 MYO5B 3.30 7.61 4.14 7.40 123 PRKCZ 3.29 7.65 5.89 7.47 124 NTF3 3.29 7.23 2.45 3.69 125 TLX1 3.29 6.68 6.43 6.76 126 EVX1 3.28 7.78 10.74 9.50 127 DSP 3.27 5.91 5.53 5.78 128 HBM 3.26 8.62 3.86 6.74 129 HOXC11 3.26 5.74 5.67 5.50 130 NEUROG3 3.22 6.91 5.08 6.19 131 VMO1 3.22 4.75 2.37 4.02 132 ACTRT2 3.21 9.03 2.88 5.14 133 CHST1 3.21 7.33 0.91 0.97 134 ADSSL1 3.21 2.44 3.61 1.87 135 EN1 3.19 6.39 5.94 5.66 136 ATP8A2 3.18 8.23 4.45 5.99 137 PLCH2 3.18 7.48 1.10 0.36 138 CABP7 3.18 6.08 2.10 1.80 139 NETO1 3.18 5.92 0.89 0.41 140 SOX3 3.18 5.20 8.83 6.40 141 SLC22A18 3.16 4.51 2.09 2.20 142 ZMYND15 3.15 7.36 6.18 9.62 143 CXCL16 3.15 7.32 6.44 10.12 144 NTNG2 3.14 7.77 1.11 1.01 145 TBX15 3.14 6.40 10.94 8.77 146 DLX3 3.13 6.67 3.88 5.68 147 SFMBT2 3.11 6.59 3.10 4.49 148 GPR101 3.11 6.05 3.80 5.63 149 LSP1 3.10 7.06 0.65 0.21
43

# Gene LAN-1 rel AUC EZH2 (ranking score)
LAN-1 rel AUC H3K27me3
Kelly rel AUC EZH2
Kelly rel AUC H3K27me3
150 TBX5 3.10 6.09 4.26 4.34 151 GPR123 3.10 5.83 7.18 8.41 152 NEU2 3.09 6.82 1.62 3.26 153 HOXA6 3.08 6.71 8.04 7.37 154 HOXA5 3.08 6.71 8.04 7.37 155 HOXA7 3.08 6.71 8.04 7.37 156 GALNT9 3.08 6.61 3.46 4.51 157 PTRF 3.08 5.68 5.00 6.52 158 LHX2 3.08 5.21 9.36 8.05 159 KRT35 3.07 7.05 0.73 0.34 160 METRNL 3.07 3.89 2.09 2.00 161 NKX2-8 3.05 7.71 7.59 7.92 162 EMX2OS 3.05 5.72 5.41 5.62 163 COL20A1 3.05 5.48 1.85 2.35 164 NKX2-5 3.05 5.01 8.84 7.82 165 BCL11B 3.03 5.57 1.42 1.16 166 GLI3 3.02 7.17 4.06 5.52 167 HOXC8 3.01 6.43 0.95 0.26 168 FSCN2 3.00 6.90 2.77 3.40 169 TNNI2 2.99 7.27 2.36 1.00 170 ESPN 2.99 6.65 6.37 7.44 171 CYP24A1 2.99 6.11 1.88 3.55 172 FLT4 2.97 7.02 9.28 12.36 173 KCNK16 2.96 7.11 0.73 0.78 174 APOC3 2.96 1.32 0.96 0.28 175 HOXB4 2.95 5.82 6.61 7.13 176 ZFYVE28 2.95 5.62 3.56 9.01 177 LOC284930 2.95 4.89 0.72 1.15 178 FOXP2 2.95 4.56 6.49 6.79 179 CPNE9 2.95 2.12 1.30 1.15 180 CEACAM21 2.94 9.33 1.97 4.36 181 EGFL7 2.92 8.03 1.54 1.27 182 CD300C 2.91 6.96 0.75 0.43 183 GPC4 2.91 6.04 5.77 7.36 184 KIR2DS4 2.91 4.54 2.15 5.14 185 PACS2 2.91 2.02 1.30 0.54 186 BTBD6 2.91 2.02 1.30 0.54 187 KNDC1 2.90 8.44 3.05 5.69 188 VGF 2.90 2.66 1.05 1.14 189 SMAD7 2.90 0.95 1.07 0.35 190 SLC22A18AS 2.89 6.41 3.98 3.26 191 WNT10A 2.89 6.38 1.07 0.70 192 OTOS 2.89 5.40 2.41 4.28 193 TNFRSF18 2.88 7.59 8.31 10.59 194 OLIG3 2.88 7.35 5.62 5.29 195 BMP6 2.88 5.72 4.46 5.44 196 GDF10 2.86 6.87 0.79 0.79 197 LIF 2.85 7.74 0.72 0.41 198 AGPAT2 2.85 6.53 1.13 0.50 199 COL15A1 2.85 5.76 2.44 4.27 200 ABTB1 2.85 1.98 0.75 0.29 201 MUC6 2.84 5.90 3.96 6.09 202 ST14 2.83 1.00 2.46 2.72 203 HOXB3 2.82 6.31 4.42 5.69 204 HOXB2 2.82 6.31 4.42 5.69 205 KLF2 2.82 5.26 7.66 8.67 206 FLNA 2.82 1.97 1.35 1.06 207 FMNL1 2.81 6.76 1.41 1.73 208 SLC8A3 2.81 6.54 1.01 0.60 209 CDH22 2.81 6.11 1.12 1.10 210 OTX2 2.81 5.81 9.36 8.40 211 SIGLEC9 2.80 8.14 2.31 5.12 212 EPHA2 2.80 6.86 0.79 0.52 213 HOXA10 2.80 6.33 5.39 6.64 214 GPRC5C 2.80 6.11 1.17 0.57 215 HMHA1 2.80 5.96 4.01 5.16 216 PMF1 2.80 2.26 2.07 0.69 217 GAD2 2.79 6.86 6.23 7.11 218 RASSF5 2.79 6.59 1.98 3.13 219 SOX14 2.79 5.51 8.04 8.74 220 KCNAB2 2.79 1.19 0.72 0.21 221 EPHA8 2.78 6.90 1.21 0.70 222 ETV4 2.78 6.68 1.63 2.51 223 WNT3 2.78 5.56 1.25 1.27 224 C1ORF159 2.78 4.50 3.32 3.10 225 CYP26A1 2.77 6.30 4.68 5.70
44

# Gene LAN-1 rel AUC EZH2 (ranking score)
LAN-1 rel AUC H3K27me3
Kelly rel AUC EZH2
Kelly rel AUC H3K27me3
226 MMEL1 2.77 6.20 3.84 6.59 227 BAI1 2.77 6.02 0.95 0.19 228 C1ORF94 2.77 5.73 6.11 9.61 229 FGF9 2.77 5.51 0.84 0.90 230 KCND3 2.76 5.82 1.56 2.43 231 SLC24A3 2.76 5.65 2.61 4.32 232 CARD10 2.75 6.60 2.39 2.76 233 NOG 2.74 6.11 5.15 6.75 234 CSMD2 2.74 5.74 5.11 8.14 235 MMP25 2.74 4.96 5.18 5.95 236 NKD2 2.73 6.11 4.16 4.38 237 DSCAML1 2.71 6.18 1.50 1.98 238 BARX1 2.71 5.38 10.02 6.81 239 GPR26 2.71 5.19 0.80 0.66 240 FOXB1 2.70 6.34 8.04 8.62 241 ZBTB7A 2.70 2.30 1.43 1.72 242 MT1M 2.69 6.93 4.01 5.43 243 MSX1 2.69 4.67 6.42 6.87 244 LHX6 2.69 4.31 6.90 7.47 245 CLEC11A 2.69 3.76 1.25 0.13 246 LMO1 2.68 5.82 0.89 0.21 247 PITPNM3 2.68 5.61 0.99 1.85 248 FLI1 2.67 6.99 2.62 5.01 249 DMRT1 2.67 6.43 3.60 4.89 250 GALR2 2.67 5.49 3.28 3.12 251 TFAP2C 2.67 5.29 9.41 7.83 252 SLC30A2 2.67 5.27 2.89 4.33 253 HTR5A 2.66 6.35 2.50 5.16 254 SLC17A7 2.66 5.71 1.85 3.17 255 SIX1 2.66 4.73 5.40 7.25 256 NOTUM 2.66 3.60 3.52 2.86 257 CHST7 2.66 2.67 0.87 1.61 258 KCNG2 2.66 2.30 2.35 4.27 259 DGKG 2.65 5.88 1.93 3.38 260 GLIS3 2.65 5.03 3.37 3.31 261 NFIX 2.65 4.57 5.20 5.28 262 SP6 2.64 7.86 1.99 3.90 263 FZD10 2.64 6.25 5.72 6.68 264 WFDC1 2.63 7.14 3.00 5.52 265 ELN 2.63 5.82 1.24 0.37 266 HAMP 2.63 5.32 1.17 2.36 267 PTPRE 2.63 5.25 1.29 0.88 268 NR2F1 2.63 4.95 0.59 0.53 269 CORO2B 2.62 6.28 1.14 1.15 270 OVOL1 2.62 6.07 8.56 7.78 271 TTLL10 2.62 5.85 6.57 6.47 272 CACNA1A 2.62 5.81 2.94 4.23 273 PLXDC2 2.62 4.54 0.87 0.71 274 SOX13 2.61 6.43 3.72 4.80 275 DLX4 2.61 6.21 5.43 6.36 276 C3ORF22 2.61 2.67 0.84 0.64 277 MYH7 2.60 6.84 1.27 1.93 278 UMODL1 2.60 6.78 1.67 2.44 279 C21ORF128 2.60 6.78 1.67 2.44 280 CTSD 2.60 4.26 1.10 0.37 281 MAPK15 2.59 4.58 2.12 5.02 282 COL5A1 2.58 7.59 0.91 0.82 283 UNC93B1 2.58 5.95 1.59 1.65 284 CACNA1S 2.58 5.62 0.94 0.69 285 ARHGEF16 2.58 5.12 1.66 2.58 286 SLFN5 2.58 5.11 2.35 4.77 287 MAG 2.57 7.04 2.12 4.04 288 HOXA1 2.57 5.60 3.97 5.21 289 ETNK2 2.57 3.71 1.55 2.58 290 UTF1 2.56 6.89 7.39 8.17 291 GSC 2.56 4.98 5.81 6.41 292 HSPA12A 2.56 4.21 1.67 1.36 293 CALML6 2.56 3.44 1.51 2.85 294 SLC6A18 2.55 7.39 1.72 2.18 295 HOXD11 2.55 6.12 1.35 1.78 296 KRTAP5-9 2.55 3.65 0.94 2.50 297 ACHE 2.55 3.26 4.35 4.17 298 RILP 2.55 1.23 1.18 0.33 299 PFKP 2.54 4.24 1.24 1.55 300 HIPK4 2.54 2.56 1.11 2.34
45

Supplemental Table 3. (D) Custom neuroblastoma PRC2 signature consisting of the top 300 H3K27me3 ChIP-seq target genes in LAN-1 cells.
# Gene LAN-1 rel AUC H3K27me3 (ranking score)
LAN-1 rel AUC EZH2
Kelly rel AUC H3K27me3
Kelly rel AUC EZH2
1 CDX2 19.24 11.43 5.20 6.12 2 SERPINA2 16.44 6.66 4.41 1.36 3 PRDM16 15.23 8.90 7.89 8.72 4 TMEM132E 13.22 7.84 0.27 0.94 5 KLK12 12.51 5.50 5.49 2.39 6 HOXB8 12.41 8.66 7.42 10.05 7 ZNF469 12.27 5.42 0.75 1.07 8 MN1 12.22 6.66 7.56 9.51 9 HOXB7 12.16 7.55 7.41 8.92
10 NFATC1 11.65 8.52 23.21 32.51 11 VENTX 11.58 5.50 8.51 8.56 12 FIBCD1 11.43 5.36 9.20 6.78 13 SP8 11.39 6.33 5.50 4.90 14 PAX2 11.36 9.27 13.13 18.04 15 EBF3 11.34 7.49 4.15 3.11 16 NOTCH1 11.09 5.71 5.72 7.30 17 SOX8 11.05 5.57 12.54 16.45 18 GABRD 10.95 4.40 6.21 5.45 19 NPTX1 10.93 6.66 6.01 5.89 20 IRX4 10.81 6.13 8.30 7.61 21 KCNT1 10.73 4.40 6.05 3.46 22 HOXC9 10.57 6.85 0.63 0.95 23 CDH15 10.54 4.22 4.81 2.88 24 HOXC10 10.33 5.37 5.17 4.28 25 NUDT14 10.15 4.23 1.97 1.52 26 CBFA2T3 10.05 4.14 8.67 6.95 27 KIAA0125 10.03 4.26 0.97 1.67 28 SOHLH1 9.91 4.08 5.48 3.47 29 ZIC2 9.76 6.31 7.69 11.22 30 EN2 9.53 6.53 10.34 12.41 31 HOXB6 9.53 4.51 7.83 6.94 32 HOXB5 9.53 4.51 7.83 6.94 33 FOXQ1 9.51 4.25 6.59 5.21 34 NKX2-2 9.46 5.16 7.01 9.70 35 JAG2 9.45 3.47 0.22 0.98 36 MUC5B 9.44 3.85 8.93 6.04 37 NEUROD2 9.43 6.29 6.48 6.45 38 CLCNKB 9.42 4.41 0.23 0.70 39 PDGFA 9.41 6.60 12.54 17.82 40 CEACAM21 9.33 2.94 4.36 1.97 41 LMX1B 9.23 6.93 10.09 12.23 42 TBX1 9.21 5.43 7.56 7.40 43 GATA5 9.10 4.87 7.51 8.28 44 PKNOX2 9.10 4.16 0.92 1.40 45 HOXA11 9.05 4.68 8.34 7.81 46 ACTRT2 9.03 3.21 5.14 2.88 47 NKX2-3 9.02 5.10 7.07 8.14 48 HOXB9 8.97 4.66 7.04 7.13 49 WNT1 8.96 4.12 5.06 4.54 50 PAX7 8.93 5.88 7.11 8.40 51 HOXB13 8.80 4.07 5.13 3.97 52 FOXF1 8.73 5.56 7.53 12.13 53 KLHDC7A 8.71 3.86 0.22 0.70 54 HBM 8.62 3.26 6.74 3.86 55 BARHL1 8.60 5.29 5.73 5.38 56 EMX1 8.53 5.55 8.39 9.97 57 TTYH1 8.53 4.27 5.03 2.97 58 SLC9A3 8.47 4.05 4.52 3.60 59 CDH4 8.46 4.99 1.04 1.37 60 COL13A1 8.46 3.48 1.39 0.94 61 LBX1 8.45 5.29 10.41 17.76 62 KNDC1 8.44 2.90 5.69 3.05 63 SDK2 8.36 3.70 1.34 1.35 64 INHBB 8.34 5.49 7.35 6.99 65 GATA6 8.26 4.69 7.77 9.63 66 EBF2 8.26 4.17 8.07 7.34 67 ARC 8.25 3.51 0.13 1.24 68 AJAP1 8.24 3.91 8.11 6.22 69 ATP8A2 8.23 3.18 5.99 4.45 70 HES2 8.22 3.95 6.57 5.92 71 ITGB2 8.17 3.50 8.13 5.47 72 SIGLEC9 8.14 2.80 5.12 2.31 73 OLIG2 8.13 4.33 9.01 10.30
46

# Gene LAN-1 rel AUC H3K27me3 (ranking score)
LAN-1 rel AUC EZH2
Kelly rel AUC H3K27me3
Kelly rel AUC EZH2
74 DMRT3 8.10 3.36 7.01 6.77 75 ICOSLG 8.03 3.57 4.56 4.74 76 EGFL7 8.03 2.92 1.27 1.54 77 DAAM2 7.98 3.54 0.71 0.83 78 PDGFB 7.90 4.84 3.76 3.69 79 SP6 7.86 2.64 3.90 1.99 80 ITPR3 7.83 3.49 3.90 2.61 81 COL18A1 7.79 3.94 1.54 2.07 82 EVX1 7.78 3.28 9.50 10.74 83 NTNG2 7.77 3.14 1.01 1.11 84 LCN6 7.76 2.42 0.85 0.91 85 LIF 7.74 2.85 0.41 0.72 86 NKX2-8 7.71 3.05 7.92 7.59 87 LHX5 7.65 5.23 10.54 12.77 88 PRKCZ 7.65 3.29 7.47 5.89 89 SOX18 7.65 3.98 2.69 3.42 90 SLC38A3 7.64 2.47 0.65 0.87 91 MYO5B 7.61 3.30 7.40 4.14 92 LHX1 7.60 5.24 8.95 7.46 93 IRX1 7.59 3.52 7.80 11.30 94 TNFRSF18 7.59 2.88 10.59 8.31 95 COL5A1 7.59 2.58 0.82 0.91 96 FOXD3 7.56 4.14 5.43 4.75 97 HSPB7 7.55 3.34 0.42 0.90 98 RUNX1 7.49 3.67 4.04 1.90 99 PAX1 7.48 3.62 5.65 4.29
100 PLCH2 7.48 3.18 0.36 1.10 101 WNT7B 7.47 4.23 6.44 5.34 102 HOXA2 7.46 3.84 4.71 4.68 103 HOXC12 7.43 4.52 10.61 12.26 104 SLC6A18 7.39 2.55 2.18 1.72 105 ZMYND15 7.36 3.15 9.62 6.18 106 OLIG3 7.35 2.88 5.29 5.62 107 SLITRK2 7.34 2.35 7.13 4.48 108 C20ORF166 7.33 2.41 2.12 1.37 109 CHST1 7.33 3.21 0.97 0.91 110 CXCL16 7.32 3.15 10.12 6.44 111 FGF3 7.28 3.92 4.72 5.14 112 TNNI2 7.27 2.99 1.00 2.36 113 NTF3 7.23 3.29 3.69 2.45 114 POU3F3 7.20 3.63 3.87 3.82 115 SHH 7.17 4.44 7.95 7.02 116 GLI3 7.17 3.02 5.52 4.06 117 NKX6-1 7.17 3.32 0.79 1.21 118 ZIC5 7.16 3.91 7.21 8.54 119 WFDC1 7.14 2.63 5.52 3.00 120 KCNK16 7.11 2.96 0.78 0.73 121 KCNQ1OT1 7.07 2.47 0.38 0.56 122 LSP1 7.06 3.10 0.21 0.65 123 KRT35 7.05 3.07 0.34 0.73 124 MAG 7.04 2.57 4.04 2.12 125 ALX4 7.03 3.48 8.11 8.59 126 FLT1 7.03 3.33 4.22 3.55 127 FLT4 7.02 2.97 12.36 9.28 128 FLI1 6.99 2.67 5.01 2.62 129 CD300C 6.96 2.91 0.43 0.75 130 HMX2 6.95 3.79 6.65 5.22 131 MT1M 6.93 2.69 5.43 4.01 132 NEUROG3 6.91 3.22 6.19 5.08 133 FSCN2 6.90 3.00 3.40 2.77 134 EPHA8 6.90 2.78 0.70 1.21 135 UTF1 6.89 2.56 8.17 7.39 136 MAGEA11 6.89 3.60 2.18 0.81 137 HAS1 6.87 2.15 4.46 2.36 138 GDF10 6.87 2.86 0.79 0.79 139 FOXF2 6.86 4.29 7.84 12.04 140 GAD2 6.86 2.79 7.11 6.23 141 EPHA2 6.86 2.80 0.52 0.79 142 MYH7 6.84 2.60 1.93 1.27 143 NEU2 6.82 3.09 3.26 1.62 144 CYP11B2 6.78 2.34 5.59 2.82 145 UMODL1 6.78 2.60 2.44 1.67 146 C21ORF128 6.78 2.60 2.44 1.67 147 PAX9 6.77 4.15 5.27 5.67 148 FMNL1 6.76 2.81 1.73 1.41 149 CLEC10A 6.75 2.02 3.49 1.61
47
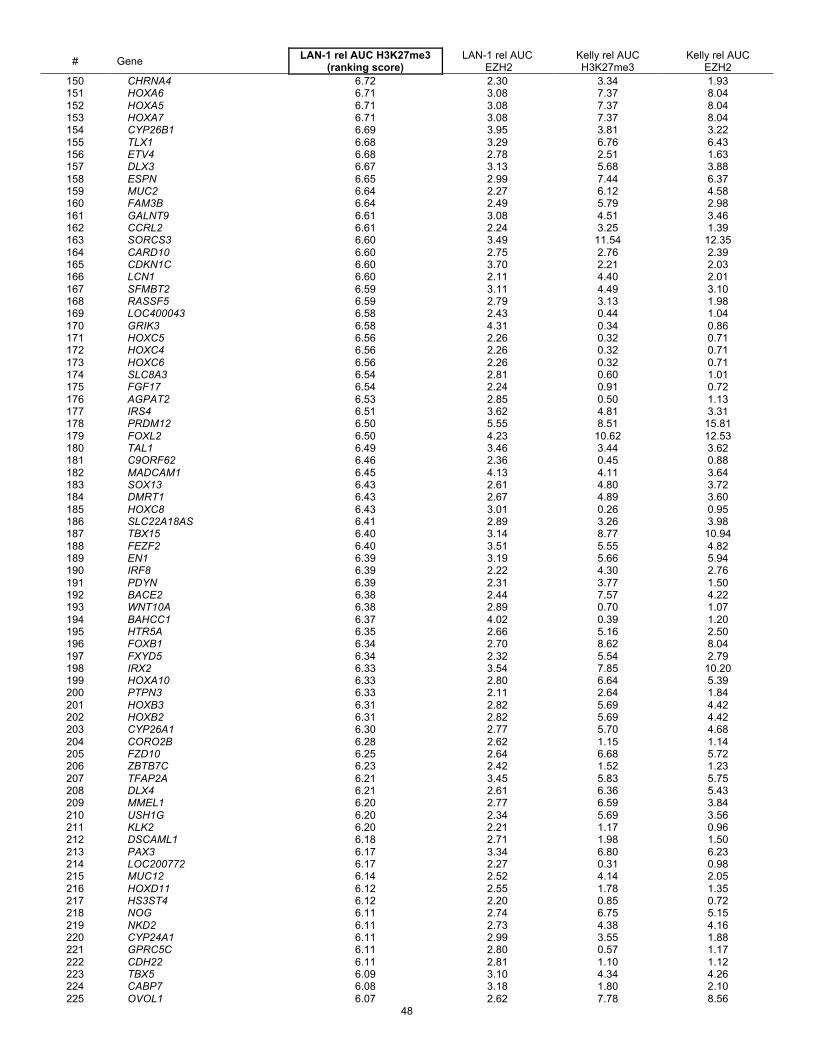
# Gene LAN-1 rel AUC H3K27me3 (ranking score)
LAN-1 rel AUC EZH2
Kelly rel AUC H3K27me3
Kelly rel AUC EZH2
150 CHRNA4 6.72 2.30 3.34 1.93 151 HOXA6 6.71 3.08 7.37 8.04 152 HOXA5 6.71 3.08 7.37 8.04 153 HOXA7 6.71 3.08 7.37 8.04 154 CYP26B1 6.69 3.95 3.81 3.22 155 TLX1 6.68 3.29 6.76 6.43 156 ETV4 6.68 2.78 2.51 1.63 157 DLX3 6.67 3.13 5.68 3.88 158 ESPN 6.65 2.99 7.44 6.37 159 MUC2 6.64 2.27 6.12 4.58 160 FAM3B 6.64 2.49 5.79 2.98 161 GALNT9 6.61 3.08 4.51 3.46 162 CCRL2 6.61 2.24 3.25 1.39 163 SORCS3 6.60 3.49 11.54 12.35 164 CARD10 6.60 2.75 2.76 2.39 165 CDKN1C 6.60 3.70 2.21 2.03 166 LCN1 6.60 2.11 4.40 2.01 167 SFMBT2 6.59 3.11 4.49 3.10 168 RASSF5 6.59 2.79 3.13 1.98 169 LOC400043 6.58 2.43 0.44 1.04 170 GRIK3 6.58 4.31 0.34 0.86 171 HOXC5 6.56 2.26 0.32 0.71 172 HOXC4 6.56 2.26 0.32 0.71 173 HOXC6 6.56 2.26 0.32 0.71 174 SLC8A3 6.54 2.81 0.60 1.01 175 FGF17 6.54 2.24 0.91 0.72 176 AGPAT2 6.53 2.85 0.50 1.13 177 IRS4 6.51 3.62 4.81 3.31 178 PRDM12 6.50 5.55 8.51 15.81 179 FOXL2 6.50 4.23 10.62 12.53 180 TAL1 6.49 3.46 3.44 3.62 181 C9ORF62 6.46 2.36 0.45 0.88 182 MADCAM1 6.45 4.13 4.11 3.64 183 SOX13 6.43 2.61 4.80 3.72 184 DMRT1 6.43 2.67 4.89 3.60 185 HOXC8 6.43 3.01 0.26 0.95 186 SLC22A18AS 6.41 2.89 3.26 3.98 187 TBX15 6.40 3.14 8.77 10.94 188 FEZF2 6.40 3.51 5.55 4.82 189 EN1 6.39 3.19 5.66 5.94 190 IRF8 6.39 2.22 4.30 2.76 191 PDYN 6.39 2.31 3.77 1.50 192 BACE2 6.38 2.44 7.57 4.22 193 WNT10A 6.38 2.89 0.70 1.07 194 BAHCC1 6.37 4.02 0.39 1.20 195 HTR5A 6.35 2.66 5.16 2.50 196 FOXB1 6.34 2.70 8.62 8.04 197 FXYD5 6.34 2.32 5.54 2.79 198 IRX2 6.33 3.54 7.85 10.20 199 HOXA10 6.33 2.80 6.64 5.39 200 PTPN3 6.33 2.11 2.64 1.84 201 HOXB3 6.31 2.82 5.69 4.42 202 HOXB2 6.31 2.82 5.69 4.42 203 CYP26A1 6.30 2.77 5.70 4.68 204 CORO2B 6.28 2.62 1.15 1.14 205 FZD10 6.25 2.64 6.68 5.72 206 ZBTB7C 6.23 2.42 1.52 1.23 207 TFAP2A 6.21 3.45 5.83 5.75 208 DLX4 6.21 2.61 6.36 5.43 209 MMEL1 6.20 2.77 6.59 3.84 210 USH1G 6.20 2.34 5.69 3.56 211 KLK2 6.20 2.21 1.17 0.96 212 DSCAML1 6.18 2.71 1.98 1.50 213 PAX3 6.17 3.34 6.80 6.23 214 LOC200772 6.17 2.27 0.31 0.98 215 MUC12 6.14 2.52 4.14 2.05 216 HOXD11 6.12 2.55 1.78 1.35 217 HS3ST4 6.12 2.20 0.85 0.72 218 NOG 6.11 2.74 6.75 5.15 219 NKD2 6.11 2.73 4.38 4.16 220 CYP24A1 6.11 2.99 3.55 1.88 221 GPRC5C 6.11 2.80 0.57 1.17 222 CDH22 6.11 2.81 1.10 1.12 223 TBX5 6.09 3.10 4.34 4.26 224 CABP7 6.08 3.18 1.80 2.10 225 OVOL1 6.07 2.62 7.78 8.56
48

# Gene LAN-1 rel AUC H3K27me3 (ranking score)
LAN-1 rel AUC EZH2
Kelly rel AUC H3K27me3
Kelly rel AUC EZH2
226 GPR101 6.05 3.11 5.63 3.80 227 GPC4 6.04 2.91 7.36 5.77 228 TFF1 6.04 2.04 2.34 1.07 229 BAI1 6.02 2.77 0.19 0.95 230 HMHA1 5.96 2.80 5.16 4.01 231 UNC93B1 5.95 2.58 1.65 1.59 232 PHLDA2 5.94 2.52 3.95 4.19 233 KLK13 5.93 2.22 4.58 1.73 234 ALOX15 5.92 2.49 4.49 2.82 235 NETO1 5.92 3.18 0.41 0.89 236 ATP2A3 5.91 2.13 7.38 5.66 237 DSP 5.91 3.27 5.78 5.53 238 MUC6 5.90 2.84 6.09 3.96 239 PVALB 5.90 2.48 7.10 3.03 240 DGKG 5.88 2.65 3.38 1.93 241 SIM2 5.86 3.54 6.87 8.78 242 TTLL10 5.85 2.62 6.47 6.57 243 RIPK4 5.85 2.22 7.77 4.51 244 CD22 5.84 2.25 3.73 1.32 245 FLJ12825 5.84 2.06 0.25 0.72 246 GPR123 5.83 3.10 8.41 7.18 247 HOXB4 5.82 2.95 7.13 6.61 248 KCND3 5.82 2.76 2.43 1.56 249 ELN 5.82 2.63 0.37 1.24 250 GPR20 5.82 2.14 0.38 0.94 251 LMO1 5.82 2.68 0.21 0.89 252 OTX2 5.81 2.81 8.40 9.36 253 CACNA1A 5.81 2.62 4.23 2.94 254 GNGT2 5.79 2.46 6.21 2.88 255 CCK 5.78 2.17 3.85 2.80 256 SLC13A5 5.77 2.14 3.32 1.53 257 TINAGL1 5.77 2.35 0.37 1.12 258 COL15A1 5.76 2.85 4.27 2.44 259 HOXC11 5.74 3.26 5.50 5.67 260 CSMD2 5.74 2.74 8.14 5.11 261 MT1G 5.74 1.97 6.39 4.21 262 FGF4 5.74 2.42 2.80 2.60 263 TMPRSS6 5.74 1.90 0.61 0.79 264 C1ORF94 5.73 2.77 9.61 6.11 265 COMP 5.72 3.43 7.23 6.40 266 EMX2OS 5.72 3.05 5.62 5.41 267 BMP6 5.72 2.88 5.44 4.46 268 ZIC3 5.72 2.21 0.69 0.94 269 SLC22A3 5.71 2.35 4.41 3.49 270 LOC284379 5.71 1.53 8.07 2.84 271 SLC17A7 5.71 2.66 3.17 1.85 272 SIRPA 5.71 2.36 0.42 0.89 273 CLDN9 5.69 2.33 3.95 1.90 274 PTRF 5.68 3.08 6.52 5.00 275 WNT2 5.67 2.48 5.52 3.24 276 SLC24A3 5.65 2.76 4.32 2.61 277 KCNJ5 5.63 2.30 0.42 0.74 278 ZFYVE28 5.62 2.95 9.01 3.56 279 CACNA1S 5.62 2.58 0.69 0.94 280 KRT13 5.62 1.92 0.34 0.76 281 ALPI 5.61 2.07 2.78 1.31 282 PITPNM3 5.61 2.68 1.85 0.99 283 HOXA1 5.60 2.57 5.21 3.97 284 VSX1 5.60 2.45 3.81 2.71 285 KCNK9 5.60 3.72 2.66 2.69 286 FGF6 5.57 1.75 4.21 1.76 287 BCL11B 5.57 3.03 1.16 1.42 288 CACNA2D3 5.57 2.50 0.46 0.73 289 SKAP1 5.56 1.62 4.00 1.77 290 WNT3 5.56 2.78 1.27 1.25 291 CYP11B1 5.55 1.96 3.05 1.57 292 CACNA2D2 5.55 2.45 0.68 1.10 293 TMEM115 5.55 2.45 0.68 1.10 294 FOXC2 5.54 2.35 6.05 6.81 295 SMOC2 5.53 2.27 3.88 2.31 296 ITGB4 5.52 2.05 8.19 4.94 297 SOX14 5.51 2.79 8.74 8.04 298 BTBD11 5.51 2.41 4.06 2.31 299 PPP1R1B 5.51 2.36 3.32 2.09 300 FGF9 5.51 2.77 0.90 0.84
49

Supplemental Table 4. Top 60 significant GSEA hits for EZH2 and H3K27me3 ChIP-seq target genes in Kelly and LAN-1 cells using the MSigDB v5.1 c5 collection of 25 Gene Ontology (GO) gene sets related to biological processes. For each gene set hit the table shows if the gene set is related to any of the 15 Neural Development signatures available in the MSigDB c5 collection (1= yes, 0=no), the size of the gene set, the GSEA normalized enrichment score (NES), P and false discovery rate (FDR). The significance cut-offs were 0.05 for P and 0.25 for FDR. The top 60 gene set hits are ranked in decreasing order based on the NES. (A) Top 60 GSEA hits for EZH2 ChIP-seq target genes in Kelly cells. Neural Development related gene sets are significantly over-represented in the collection of GSEA hits (odds-ratios = 51.03, P < 0.001, according to the two-tailed Fisher exact test). Rank Gene Set Neural
Development Size NES P FDR
1 NEURON_DIFFERENTIATION 1 70 1.82 0.0000 0.1167 2 GENERATION_OF_NEURONS 1 76 1.76 0.0000 0.1721 3 NEURON_DEVELOPMENT 1 57 1.75 0.0000 0.1206 4 AXONOGENESIS 1 40 1.75 0.0013 0.0918 5 AXON_GUIDANCE 1 20 1.75 0.0014 0.0754 6 NEUROGENESIS 1 85 1.70 0.0000 0.1267 7 POSITIVE_REGULATION_OF_CELL_DIFFERENTIATION 0 20 1.68 0.0042 0.1369 8 NEURITE_DEVELOPMENT 1 49 1.67 0.0013 0.1495 9 CELLULAR_MORPHOGENESIS_DURING_DIFFERENTIATION 0 46 1.66 0.0000 0.1403
10 HEART_DEVELOPMENT 0 32 1.66 0.0068 0.1326 11 REGULATION_OF_BODY_FLUID_LEVELS 0 38 1.62 0.0066 0.2159 12 NERVOUS_SYSTEM_DEVELOPMENT 0 348 1.58 0.0000 0.3089 13 REGULATION_OF_ANATOMICAL_STRUCTURE_MORPHOGENESIS 0 24 1.57 0.0182 0.3008 15 CELL_CELL_SIGNALING 0 292 1.51 0.0010 0.4733 16 REGULATION_OF_CELL_DIFFERENTIATION 0 48 1.51 0.0183 0.4455 17 ANATOMICAL_STRUCTURE_MORPHOGENESIS 0 302 1.51 0.0000 0.4273 18 EXTRACELLULAR_STRUCTURE_ORGANIZATION_AND_BIOGENESIS 0 30 1.50 0.0240 0.4442 20 B_CELL_ACTIVATION 0 16 1.47 0.0476 0.5145 21 BLOOD_COAGULATION 0 28 1.47 0.0418 0.5062 22 ANATOMICAL_STRUCTURE_DEVELOPMENT 0 829 1.47 0.0000 0.4952 23 BRAIN_DEVELOPMENT 1 45 1.46 0.0393 0.4949 24 SYSTEM_DEVELOPMENT 0 706 1.45 0.0000 0.5227 25 CENTRAL_NERVOUS_SYSTEM_DEVELOPMENT 0 107 1.45 0.0151 0.5296 26 TISSUE_DEVELOPMENT 0 93 1.44 0.0233 0.5109 27 PROTEIN_OLIGOMERIZATION 0 32 1.44 0.0501 0.5167 28 REGULATION_OF_ACTION_POTENTIAL 0 16 1.43 0.0603 0.5252 29 TUBE_DEVELOPMENT 0 15 1.43 0.0755 0.5241 30 COAGULATION 0 29 1.43 0.0510 0.5125 31 HUMORAL_IMMUNE_RESPONSE 0 19 1.43 0.0801 0.4969 32 SULFUR_COMPOUND_BIOSYNTHETIC_PROCESS 0 18 1.43 0.0508 0.4868 33 REGULATION_OF_HEART_CONTRACTION 0 21 1.42 0.0655 0.4787 34 CELL_CELL_ADHESION 0 64 1.42 0.0369 0.4749 35 ADENYLATE_CYCLASE_ACTIVATION 0 15 1.42 0.0854 0.4786 36 MULTICELLULAR_ORGANISMAL_DEVELOPMENT 0 857 1.42 0.0000 0.4744 37 PROTEOGLYCAN_METABOLIC_PROCESS 0 19 1.41 0.0922 0.4960 38 SKELETAL_DEVELOPMENT 0 83 1.40 0.0244 0.5066 39 EMBRYONIC_DEVELOPMENT 0 46 1.40 0.0459 0.5057 40 SYNAPTIC_TRANSMISSION 0 144 1.39 0.0209 0.5058 41 G_PROTEIN_SIGNALING_ADENYLATE_CYCLASE_ACTIVATING_PATHWAY 0 17 1.39 0.0938 0.4999 42 POTASSIUM_ION_TRANSPORT 0 49 1.39 0.0462 0.5050 43 TRANSMISSION_OF_NERVE_IMPULSE 0 158 1.38 0.0132 0.5073 44 ORGAN_DEVELOPMENT 0 445 1.38 0.0000 0.4994 45 RESPONSE_TO_EXTERNAL_STIMULUS 0 202 1.38 0.0075 0.5024 46 REGULATION_OF_RAS_PROTEIN_SIGNAL_TRANSDUCTION 0 17 1.38 0.0844 0.4986 47 RECEPTOR_MEDIATED_ENDOCYTOSIS 0 30 1.38 0.0727 0.4887 48 POSITIVE_REGULATION_OF_RESPONSE_TO_STIMULUS 0 28 1.38 0.0856 0.4850 49 ANION_TRANSPORT 0 22 1.37 0.0924 0.4845 50 SYNAPSE_ORGANIZATION_AND_BIOGENESIS 0 22 1.37 0.0952 0.4949 51 ACTIN_POLYMERIZATION_AND_OR_DEPOLYMERIZATION 0 22 1.35 0.1029 0.5372 53 CELL_MIGRATION 0 78 1.35 0.0585 0.5391 54 PROTEIN_POLYMERIZATION 0 18 1.34 0.1196 0.5672 55 NEUROLOGICAL_SYSTEM_PROCESS 1 293 1.33 0.0125 0.5795 56 MESODERM_DEVELOPMENT 0 15 1.33 0.1245 0.5707 57 EMBRYONIC_MORPHOGENESIS 0 15 1.33 0.1393 0.5658 58 METAL_ION_TRANSPORT 0 98 1.33 0.0596 0.5590 59 CATION_TRANSPORT 0 121 1.33 0.0454 0.5527 60 HEMOSTASIS 0 32 1.33 0.1148 0.5495 61 MEISSNER_NPC_HCP_WITH_H3K4ME3_AND_H3K27ME3 1 139 2.21 0.0000 0.0242 62 YAO_TEMPORAL_RESPONSE_TO_PROGESTERONE_CLUSTER_4 0 15 2.20 0.0000 0.0286 63 MEISSNER_NPC_HCP_WITH_H3_UNMETHYLATED 1 505 2.19 0.0000 0.0301
50
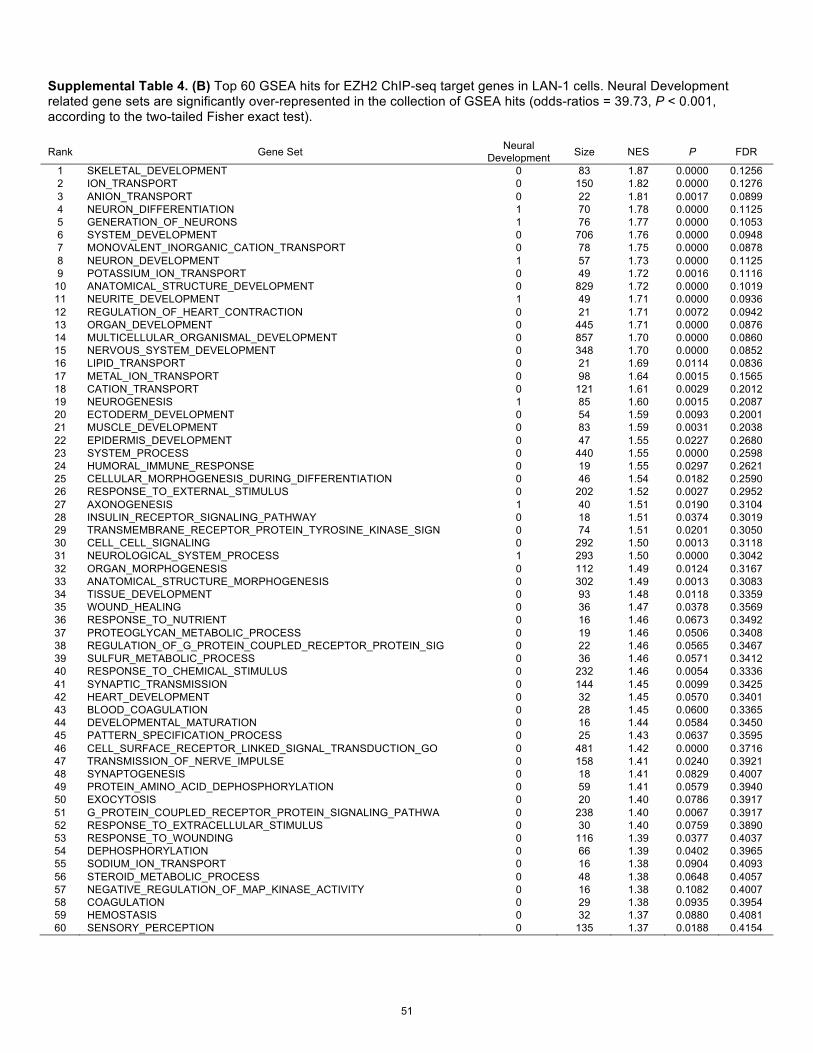
Supplemental Table 4. (B) Top 60 GSEA hits for EZH2 ChIP-seq target genes in LAN-1 cells. Neural Development related gene sets are significantly over-represented in the collection of GSEA hits (odds-ratios = 39.73, P < 0.001, according to the two-tailed Fisher exact test). Rank Gene Set Neural
Development Size NES P FDR
1 SKELETAL_DEVELOPMENT 0 83 1.87 0.0000 0.1256 2 ION_TRANSPORT 0 150 1.82 0.0000 0.1276 3 ANION_TRANSPORT 0 22 1.81 0.0017 0.0899 4 NEURON_DIFFERENTIATION 1 70 1.78 0.0000 0.1125 5 GENERATION_OF_NEURONS 1 76 1.77 0.0000 0.1053 6 SYSTEM_DEVELOPMENT 0 706 1.76 0.0000 0.0948 7 MONOVALENT_INORGANIC_CATION_TRANSPORT 0 78 1.75 0.0000 0.0878 8 NEURON_DEVELOPMENT 1 57 1.73 0.0000 0.1125 9 POTASSIUM_ION_TRANSPORT 0 49 1.72 0.0016 0.1116
10 ANATOMICAL_STRUCTURE_DEVELOPMENT 0 829 1.72 0.0000 0.1019 11 NEURITE_DEVELOPMENT 1 49 1.71 0.0000 0.0936 12 REGULATION_OF_HEART_CONTRACTION 0 21 1.71 0.0072 0.0942 13 ORGAN_DEVELOPMENT 0 445 1.71 0.0000 0.0876 14 MULTICELLULAR_ORGANISMAL_DEVELOPMENT 0 857 1.70 0.0000 0.0860 15 NERVOUS_SYSTEM_DEVELOPMENT 0 348 1.70 0.0000 0.0852 16 LIPID_TRANSPORT 0 21 1.69 0.0114 0.0836 17 METAL_ION_TRANSPORT 0 98 1.64 0.0015 0.1565 18 CATION_TRANSPORT 0 121 1.61 0.0029 0.2012 19 NEUROGENESIS 1 85 1.60 0.0015 0.2087 20 ECTODERM_DEVELOPMENT 0 54 1.59 0.0093 0.2001 21 MUSCLE_DEVELOPMENT 0 83 1.59 0.0031 0.2038 22 EPIDERMIS_DEVELOPMENT 0 47 1.55 0.0227 0.2680 23 SYSTEM_PROCESS 0 440 1.55 0.0000 0.2598 24 HUMORAL_IMMUNE_RESPONSE 0 19 1.55 0.0297 0.2621 25 CELLULAR_MORPHOGENESIS_DURING_DIFFERENTIATION 0 46 1.54 0.0182 0.2590 26 RESPONSE_TO_EXTERNAL_STIMULUS 0 202 1.52 0.0027 0.2952 27 AXONOGENESIS 1 40 1.51 0.0190 0.3104 28 INSULIN_RECEPTOR_SIGNALING_PATHWAY 0 18 1.51 0.0374 0.3019 29 TRANSMEMBRANE_RECEPTOR_PROTEIN_TYROSINE_KINASE_SIGN 0 74 1.51 0.0201 0.3050 30 CELL_CELL_SIGNALING 0 292 1.50 0.0013 0.3118 31 NEUROLOGICAL_SYSTEM_PROCESS 1 293 1.50 0.0000 0.3042 32 ORGAN_MORPHOGENESIS 0 112 1.49 0.0124 0.3167 33 ANATOMICAL_STRUCTURE_MORPHOGENESIS 0 302 1.49 0.0013 0.3083 34 TISSUE_DEVELOPMENT 0 93 1.48 0.0118 0.3359 35 WOUND_HEALING 0 36 1.47 0.0378 0.3569 36 RESPONSE_TO_NUTRIENT 0 16 1.46 0.0673 0.3492 37 PROTEOGLYCAN_METABOLIC_PROCESS 0 19 1.46 0.0506 0.3408 38 REGULATION_OF_G_PROTEIN_COUPLED_RECEPTOR_PROTEIN_SIG 0 22 1.46 0.0565 0.3467 39 SULFUR_METABOLIC_PROCESS 0 36 1.46 0.0571 0.3412 40 RESPONSE_TO_CHEMICAL_STIMULUS 0 232 1.46 0.0054 0.3336 41 SYNAPTIC_TRANSMISSION 0 144 1.45 0.0099 0.3425 42 HEART_DEVELOPMENT 0 32 1.45 0.0570 0.3401 43 BLOOD_COAGULATION 0 28 1.45 0.0600 0.3365 44 DEVELOPMENTAL_MATURATION 0 16 1.44 0.0584 0.3450 45 PATTERN_SPECIFICATION_PROCESS 0 25 1.43 0.0637 0.3595 46 CELL_SURFACE_RECEPTOR_LINKED_SIGNAL_TRANSDUCTION_GO 0 481 1.42 0.0000 0.3716 47 TRANSMISSION_OF_NERVE_IMPULSE 0 158 1.41 0.0240 0.3921 48 SYNAPTOGENESIS 0 18 1.41 0.0829 0.4007 49 PROTEIN_AMINO_ACID_DEPHOSPHORYLATION 0 59 1.41 0.0579 0.3940 50 EXOCYTOSIS 0 20 1.40 0.0786 0.3917 51 G_PROTEIN_COUPLED_RECEPTOR_PROTEIN_SIGNALING_PATHWA 0 238 1.40 0.0067 0.3917 52 RESPONSE_TO_EXTRACELLULAR_STIMULUS 0 30 1.40 0.0759 0.3890 53 RESPONSE_TO_WOUNDING 0 116 1.39 0.0377 0.4037 54 DEPHOSPHORYLATION 0 66 1.39 0.0402 0.3965 55 SODIUM_ION_TRANSPORT 0 16 1.38 0.0904 0.4093 56 STEROID_METABOLIC_PROCESS 0 48 1.38 0.0648 0.4057 57 NEGATIVE_REGULATION_OF_MAP_KINASE_ACTIVITY 0 16 1.38 0.1082 0.4007 58 COAGULATION 0 29 1.38 0.0935 0.3954 59 HEMOSTASIS 0 32 1.37 0.0880 0.4081 60 SENSORY_PERCEPTION 0 135 1.37 0.0188 0.4154
51

Supplemental Table 5. The shRNA sequences and the CRISPR-Cas9 sgRNA sequences targeting MYCN and EZH2 that were used in this study.
# Designation Clone ID Clone Name Target Sequence 1 shNT CCTAAGGTTAAGTCGCCCTCGC 2 shLUC CTTCGAAATGTCCGTTCGGTT 3 shMYCN1 TRCN0000020694 NM_005378.3-2000s1c1 GCCAGTATTAGACTGGAAGTT 4 shMYCN3 TRCN0000020696 NM_005378.3-230s1c1 CGGACGAAGATGACTTCTACT 5 shMYCN5 TRCN0000020698 NM_005378.3-919s1c1 CTGAGCGATTCAGATGATGAA 6 shEZH2-4 TRCN0000040073 NM_004456.3-2582s1c1 CGGAAATCTTAAACCAAGAAT 7 shEZH2-5 TRCN0000040076 NM_004456.3-324s1c1 TATTGCCTTCTCACCAGCTGC 8 sgNT TAGCGAACGTGTCCGGCGT 9 sgEZH2-1 TTATCAGAAGGAAATTTCCG 10 sgEZH2-2 TTATGATGGGAAAGTACACG 11 sgEZH2-3 AGAAGGGACCAGTTTGTTGG 12 sgEZH2-4 CTGCTGCTCTCACCGCTGAG
52


![Targeting the Difficult-to-Drug CD71 and MYCN with ... · tumor models [13–17]. With respect to the MAPK/ERK pathway and CD71, iron levels indeed influence the activity of neuroblastoma,](https://img.dokumen.tips/doc/110x75/6066cb26220882738c0ea7ac/targeting-the-difficult-to-drug-cd71-and-mycn-with-tumor-models-13a17-with.jpg)