Embed Size (px)
Citation preview
My Summer with Soybeans
Justin Song
Torrey Pines High School
World Food Prize Borlaug-Ruan International Intern
June 25 – August 26, 2011
EMBRAPA
Londrina, Brazil
3
Table of Contents
Acknowledgements . . . . . . . . . . . . . . . . . . . . . . . . . . . . . . . . . . . . . . . . . . . . . . . . 3
Introduction . . . . . . . . . . . . . . . . . . . . . . . . . . . . . . . . . . . . . . . . . . . . . . . . . . . . . . 3
EMBRAPA Soja and its Mission . . . . . . . . . . . . . . . . . . . . . . . . . . . . . . . . . . . . . . 4
My Program . . . . . . . . . . . . . . . . . . . . . . . . . . . . . . . . . . . . . . . . . . . . . . . . . . . . . 4
My Research
Background on Asian Soybean Rust . . . . . . . . . . . . . . . . . . . . . . . . . . . . . 4
The Experiment . . . . . . . . . . . . . . . . . . . . . . . . . . . . . . . . . . . . . . . . . . . . 5
Section 1 . . . . . . . . . . . . . . . . . . . . . . . . . . . . . . . . . . . . . . . . . . . . . . . . . . . . . . . . 5
Section 1 Data, Results, and Conclusions . . . . . . . . . . . . . . . . . . . . . . . . . . . . . . . 7
Section 2 . . . . . . . . . . . . . . . . . . . . . . . . . . . . . . . . . . . . . . . . . . . . . . . . . . . . . . . . 14
Section 2 Data . . . . . . . . . . . . . . . . . . . . . . . . . . . . . . . . . . . . . . . . . . . . . . . . . . . . 16
Section 2 Analysis and Conclusions . . . . . . . . . . . . . . . . . . . . . . . . . . . . . . . . . . . 20
Food Security . . . . . . . . . . . . . . . . . . . . . . . . . . . . . . . . . . . . . . . . . . . . . . . . . . . . 22
Brazil . . . . . . . . . . . . . . . . . . . . . . . . . . . . . . . . . . . . . . . . . . . . . . . . . . . . . . . . . . 23
Personal Reflection . . . . . . . . . . . . . . . . . . . . . . . . . . . . . . . . . . . . . . . . . . . . . . . . 23
Works Cited . . . . . . . . . . . . . . . . . . . . . . . . . . . . . . . . . . . . . . . . . . . . . . . . . . . . . 24
Pictures . . . . . . . . . . . . . . . . . . . . . . . . . . . . . . . . . . . . . . . . . . . . . . . . . . . . . . . . . 25
4
Acknowledgements
My sincere gratitude and appreciation to the following people who helped change my life
and the way I think about world hunger.
Dr. Norman Borlaug, Mr. John Ruan, and Ambassador Kenneth Quinn made the World
Food Prize experience possible for me. I know I will use the inspiration and knowledge I
received from my journeys in the past two years to help change the world.
Mrs. Lisa Fleming deserves limitless praise for her fantastic logistical expertise and her
role as a source of comfort and guiding light for all of us interns.
Dr. Jose Renato, Mrs. Renato and their sons, Luckas and Renan, became my surrogate
family. Their generosity, care, and willingness to embrace me in their culture was comforting
and heartwarming.
Dr. Norman Neumaier and Dr. Ricardo Abdellnoor, my supervisors at EMBRAPA,
believed in my willingness to do everything possible to learn and work diligently with other
members of the research team.
Dr. Danielle Gregorio and Ms. Tatiana Fraga, my mentors at EMBRAPA, answered my
endless questions that never seemed too trivial.
Mr. Brinn Belyea, my teacher sponsor at Torrey Pines High School, guided my interest in
science, supported my efforts to attend GYI and apply for the BR internship and provided
substantive feedback on my Mozambique research project.
My family gave me their unconditional love and support.
Introduction
My journey to Brazil began in Mozambique. During the summer of 2010 I chose the
south-eastern African country for my research subject and analyzed “Solutions for the World’s
Smallholders.”
While participating in the 2010 Global Youth Institute and World Food Prize symposium,
I was amazed at the knowledge flowing around me and the dedication that both students and
professionals showed towards eradicating hunger. Ever since my Mozambique research, I had
many burning questions that needed to be answered, such as “What can I do to help in addition
to donating money?” I wrote about what the Mozambican government should do to improve its
infrastructure, but what could I personally do? My questions were answered in Iowa as I learned
about David Beckmann’s leadership of Bread for the World and how I could become active in
both my community and nationwide.
“Action against hunger walks on two legs. There’s the leg of direct assistance, really
helping people, and then there’s the leg of advocacy, changing laws and structures. And you’ve
got to walk on both legs,” said 2010 laureate David Beckmann, quoting his organization’s
founder, Arthur Simon. I was not able to attend the “laureate’s forum” section of the World
Food Prize symposium, in which Mr. Beckmann said the quote above, but reading through the
transcript later on made me realize the cooperative efforts of the anti-hunger movement. There
are so many people in many different areas of work who are coming together to help fight world
hunger. Even the name of the Borlaug-Ruan internship demonstrates that fact, linking an
agronomist with a trucking company executive.
As I learned more about the Borlaug-Ruan internship, I became more prepared to
understand world hunger that, in turn, gave me the skills to become personally involved.
Everything about the internship’s mission and objectives motivated me to be prepared for the
greatest journey of my life.
5
EMBRAPA Soja and its Mission
The Brazilian Agricultural Research Corporation (EMBRAPA) is comprised of 45
research units located across Brazil. The soybean unit, EMBRAPA Soja, focuses research
efforts on soybeans, sunflower, and wheat; other research units work with agricultural items such
as coffee and farm animals. Its mission is to “facilitate, through research, development and
innovation, solutions to the sustainability of production chains of soybeans and sunflowers, for
the benefit of Brazilian society” (embrapa.br) Brazil is the second largest producer of soybeans
in the world; since its agricultural sector is very important to the national economy (5% of GDP
vs. USA’s 1%) soybean is a valuable crop.
My internship supervisor was Dr. Neumaier. He was the liaison with the World Food
Prize. Dr. Abdellnoor, one of the three scientists leading my lab (Plant Biotechnology), directed
my research and advised me on my project. Many graduate students and employees worked in
the lab. I worked closely with Danielle, an EMBRAPA employee, and Tatiana, a graduate
student.
My Program
During the past several years, a devastating soybean disease has been ravaging crops
across the world, most recently appearing in the United States. As the second-largest producer
of soybeans in the world, Brazil was greatly impacted by the disease and researchers have been
trying to find ways to combat this disease. Besides using pesticides, farmers are also able to use
plants that are genetically resistant to the disease, Asian Soybean Rust (ASR), to reduce crop
losses. I worked in the plant biotechnology lab, where many graduate students, post doctorates,
technicians, and researchers have been isolating soybean lines with disease resistant genes. My
research had two parts. First, I was involved with finding the best method of extracting DNA for
experiment samples. Many methods of DNA extraction from plants exist, but most of these were
created for different species such as Arabidopsis. Later on, my work focused on a process called
Marker Assisted Selection. Markers (in this case, Simple Sequence Repeats were used) of
known chromosomal regions were used to test whether or not a particular sample possessed the
ASR-resistance gene.
One goal of the program was to increase the resistance of already-resistant plants by
stacking gene loci. The other was to cross breed resistant plants from other climates and
environments with cultivars that are native to Brazil.
My Research
Background of Asian Soybean Rust (ASR) and Review of Literature
Brazil is the second largest soybean producer in the world, second only to the US.
Soybeans are an important part of its agricultural industry and to combating world hunger as a
whole. In addition to being an excellent source of protein for humans, soybean also works well
as animal feed, an energy source, and as material for soybean oil. Although Asian Soybean Rust
(ASR) has been identified in the distant past, it has recently started to affect more and more
soybean crop yields. Up to 80 percent of yields have been destroyed by ASR.
Asian Soy Rust disease is caused by Phakopsora Pachyrizi and spreads through
urediniospores. In Brazil, ASR was first seen in 2001 and has spread throughout South America
since then. Currently, the only effective method to fight ASR is the spraying of fungicide, which
raise production costs and contaminates the environment. Scientists have identified 5 resistance
genes, Rpp 1,2,3,4 and 5.

6
(Identification and Analyses of Candidate Genes for Rpp4-Mediated Resistance to Asian
Soybean Rust in Soybean)
However, each resistance gene may not resist all strains of ASR. Therefore, since monogenic
rust resistance may not be a stable solution, scientists have been trying to stack loci (pyramiding)
by crossing resistant lines with a different Rpp gene each to make a more resistant plant. To test
whether a parent is resistant, the plant is infected with a field isolate of P. Pachyrhizi and lesion
type evaluated: plants with resistant genes have reddish-brown lesions (RB), while susceptible
plants have tan lesions (TAN).
Once scientists mapped populations (the organism group used to make a particular
genetic map) and screened them with SSR markers using Bulk Segregant analysis (BSA) to ID
linked markers, they found several markers for Marker Assisted Selection. DNA markers can
help ease the process of stacking different resistance loci into a single cultivar for a more
sustainable resistance. SSRs, which are microsatellites used for mapping host resistance to
soybean diseases. Researchers use SSR microsatellites because they have high polymorphism,
co-dominance, reproducibility, good distribution throughout the soybean genome.
(Molecular mapping of two loci that confer resistance to Asian rust in soybean)
Since SSR markers are PCR based, they are easily assayed on gel electrophoresis
systems. Soybean has over 1000 SSR markers across 20 linkage groups. Scientists use these
markers to ID genome location of SBR resistant genes to help integrate these genes into modern
breeding lines through marker assisted selection.
(Map Location of the Rpp1 Locus That Confers Resistance to Soybean Rust in Soybean)
The Experiment
The overall goal of the Asian Soybean Rust research at EMBRAPA is to increase the resistance
of soybean plants to the disease. The researchers I worked with are trying to facilitate the
breeding of plants and stacking of resistance genes by using Marker Assisted Selection.
Section 1
S1 Purpose
The purpose of this experiment was to test which method of DNA extraction from soybeans
worked the best. Methods had to be low cost and fit the parameters of a high quality DNA
sample. Danielle and I worked on this section of the experiment.
S1 Materials and Procedure
Several DNA extraction protocols were tested in this experiment.
TEST 1: von Post et al. 2003
Materials Supplier
NaOH Not specified
Tris-HCL Not specified
EDTA Not specified
A solution of 1M Tris-HCl (pH 8) was made. A buffer of 150µL Neutralizing solution was made
from 30mM Tris-HCl (pH 8) and 1mM EDTA. An extraction buffer of 0.15M NaOH was
created. Seed fragments were transferred to 1.5mL microtubes and ground with a pestle. 40µL
of extraction buffer were added and the solution was mixed thoroughly. The solution was heated
in a microwave oven at 10% power at 1400W for 30 seconds. 150µL of neutralizing solution
was added to each tube. The solution was incubated at 4°C for 1 hour. Samples were diluted by
1:10 for the PCR reaction.
7
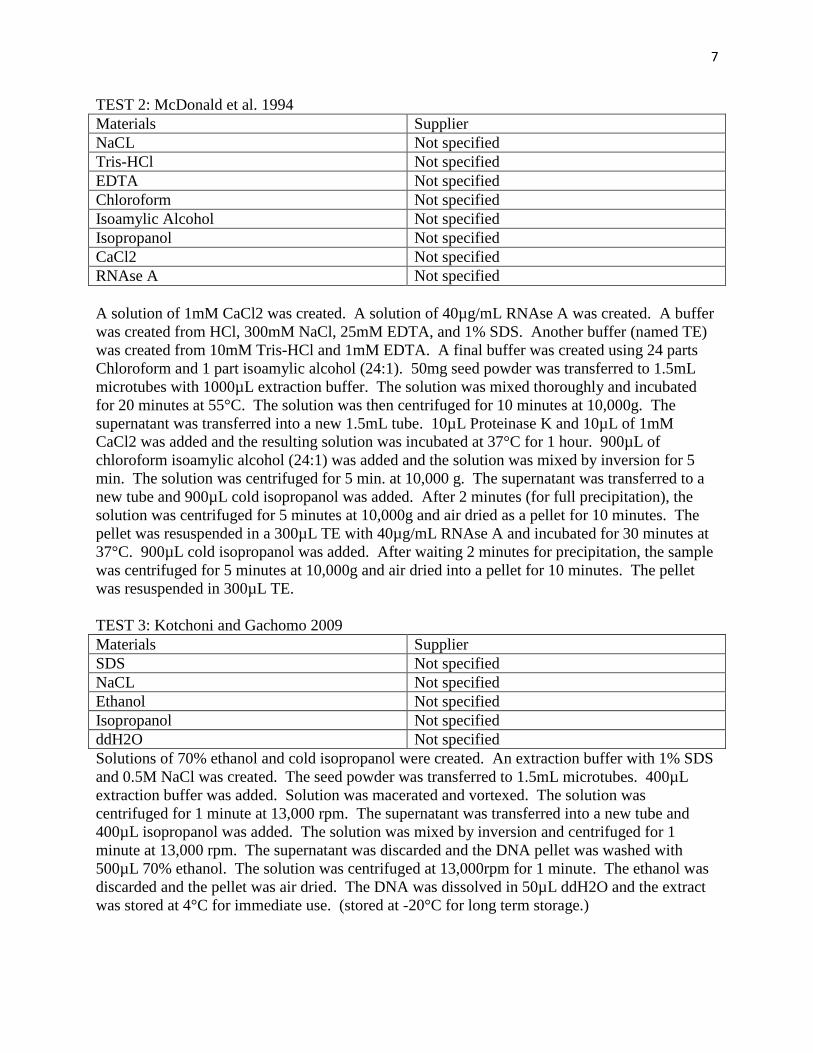
TEST 2: McDonald et al. 1994
Materials Supplier
NaCL Not specified
Tris-HCl Not specified
EDTA Not specified
Chloroform Not specified
Isoamylic Alcohol Not specified
Isopropanol Not specified
CaCl2 Not specified
RNAse A Not specified
A solution of 1mM CaCl2 was created. A solution of 40µg/mL RNAse A was created. A buffer
was created from HCl, 300mM NaCl, 25mM EDTA, and 1% SDS. Another buffer (named TE)
was created from 10mM Tris-HCl and 1mM EDTA. A final buffer was created using 24 parts
Chloroform and 1 part isoamylic alcohol (24:1). 50mg seed powder was transferred to 1.5mL
microtubes with 1000µL extraction buffer. The solution was mixed thoroughly and incubated
for 20 minutes at 55°C. The solution was then centrifuged for 10 minutes at 10,000g. The
supernatant was transferred into a new 1.5mL tube. 10µL Proteinase K and 10µL of 1mM
CaCl2 was added and the resulting solution was incubated at 37°C for 1 hour. 900µL of
chloroform isoamylic alcohol (24:1) was added and the solution was mixed by inversion for 5
min. The solution was centrifuged for 5 min. at 10,000 g. The supernatant was transferred to a
new tube and 900µL cold isopropanol was added. After 2 minutes (for full precipitation), the
solution was centrifuged for 5 minutes at 10,000g and air dried as a pellet for 10 minutes. The
pellet was resuspended in a 300µL TE with 40µg/mL RNAse A and incubated for 30 minutes at
37°C. 900µL cold isopropanol was added. After waiting 2 minutes for precipitation, the sample
was centrifuged for 5 minutes at 10,000g and air dried into a pellet for 10 minutes. The pellet
was resuspended in 300µL TE.
TEST 3: Kotchoni and Gachomo 2009
Materials Supplier
SDS Not specified
NaCL Not specified
Ethanol Not specified
Isopropanol Not specified
ddH2O Not specified
Solutions of 70% ethanol and cold isopropanol were created. An extraction buffer with 1% SDS
and 0.5M NaCl was created. The seed powder was transferred to 1.5mL microtubes. 400µL
extraction buffer was added. Solution was macerated and vortexed. The solution was
centrifuged for 1 minute at 13,000 rpm. The supernatant was transferred into a new tube and
400µL isopropanol was added. The solution was mixed by inversion and centrifuged for 1
minute at 13,000 rpm. The supernatant was discarded and the DNA pellet was washed with
500µL 70% ethanol. The solution was centrifuged at 13,000rpm for 1 minute. The ethanol was
discarded and the pellet was air dried. The DNA was dissolved in 50µL ddH2O and the extract
was stored at 4°C for immediate use. (stored at -20°C for long term storage.)
8
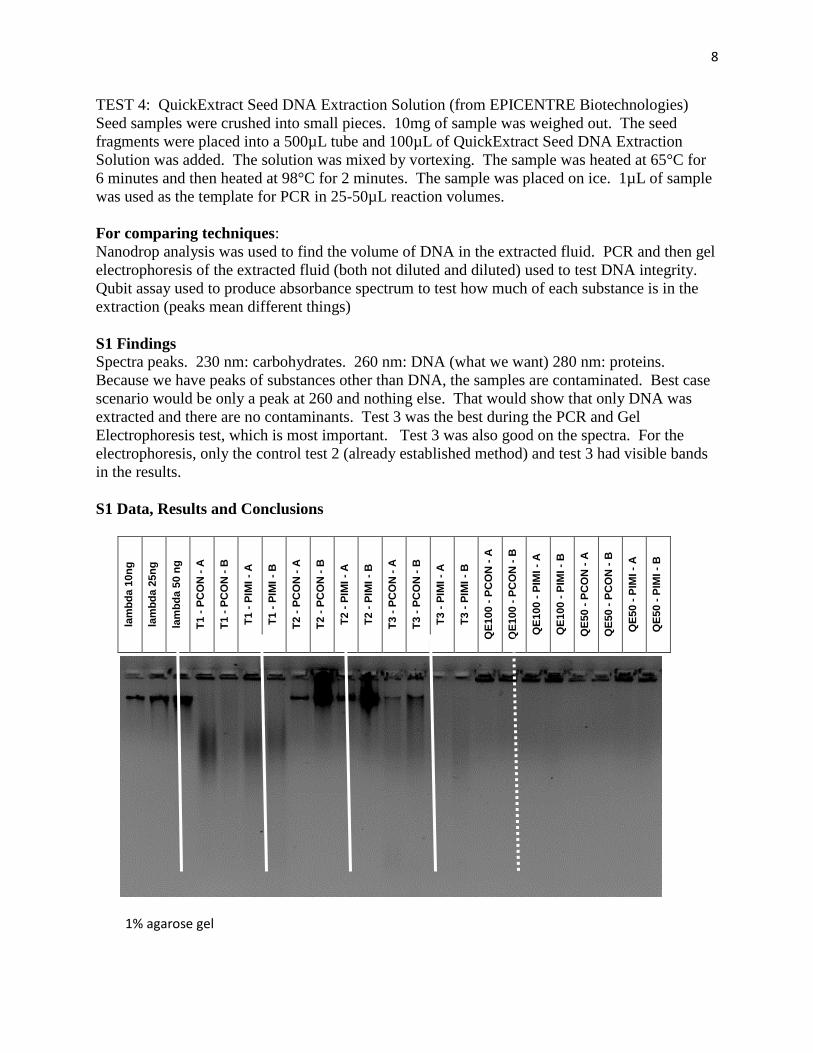
TEST 4: QuickExtract Seed DNA Extraction Solution (from EPICENTRE Biotechnologies)
Seed samples were crushed into small pieces. 10mg of sample was weighed out. The seed
fragments were placed into a 500µL tube and 100µL of QuickExtract Seed DNA Extraction
Solution was added. The solution was mixed by vortexing. The sample was heated at 65°C for
6 minutes and then heated at 98°C for 2 minutes. The sample was placed on ice. 1µL of sample
was used as the template for PCR in 25-50µL reaction volumes.
For comparing techniques:
Nanodrop analysis was used to find the volume of DNA in the extracted fluid. PCR and then gel
electrophoresis of the extracted fluid (both not diluted and diluted) used to test DNA integrity.
Qubit assay used to produce absorbance spectrum to test how much of each substance is in the
extraction (peaks mean different things)
S1 Findings
Spectra peaks. 230 nm: carbohydrates. 260 nm: DNA (what we want) 280 nm: proteins.
Because we have peaks of substances other than DNA, the samples are contaminated. Best case
scenario would be only a peak at 260 and nothing else. That would show that only DNA was
extracted and there are no contaminants. Test 3 was the best during the PCR and Gel
Electrophoresis test, which is most important. Test 3 was also good on the spectra. For the
electrophoresis, only the control test 2 (already established method) and test 3 had visible bands
in the results.
S1 Data, Results and Conclusions
lam
bd
a 1
0n
g
lam
bd
a 2
5n
g
lam
bd
a 5
0 n
g
T1
- P
CO
N -
A
T1
- P
CO
N -
B
T1
- P
IMI
- A
T1
- P
IMI
- B
T2
- P
CO
N -
A
T2
- P
CO
N -
B
T2
- P
IMI
- A
T2
- P
IMI
- B
T3
- P
CO
N -
A
T3
- P
CO
N -
B
T3
- P
IMI
- A
T3
- P
IMI
- B
QE
100 -
PC
ON
- A
QE
100 -
PC
ON
- B
QE
100 -
PIM
I -
A
QE
100 -
PIM
I -
B
QE
50 -
PC
ON
- A
QE
50 -
PC
ON
- B
QE
50 -
PIM
I -
A
QE
50 -
PIM
I -
B
1% agarose gel

9
0
10
20
30
40
50
60
70
22
0
22
5
23
0
23
5
24
0
24
5
25
0
25
5
26
0
26
5
27
0
27
5
28
0
28
5
29
0
29
5
30
0
30
5
31
0
31
5
32
0
t1-pcon-a
t1-pcon-b
t1-pimi-a
t1-pimi-b
0
0.5
1
1.5
2
2.5
3
3.5
22
0
22
5
23
0
23
5
24
0
24
5
25
0
25
5
26
0
26
5
27
0
27
5
28
0
28
5
29
0
29
5
30
0
30
5
31
0
31
5
32
0
t2-pcon-a
t2-pcon-b
t2-pimi-a
t2-pimi-b
0
5
10
15
20
25
30
22
0
22
5
23
0
23
5
24
0
24
5
25
0
25
5
26
0
26
5
27
0
27
5
28
0
28
5
29
0
29
5
30
0
30
5
31
0
31
5
32
0
t3-pcon-a
t3-pcon-b
t3-pimi-a
t3-pimi-b
0
10
20
30
40
50
60
70
22
0
22
6
23
2
23
8
24
4
25
0
25
6
26
2
26
8
27
4
28
0
28
6
29
2
29
8
30
4
31
0
31
6
QE-100-PCON-A
QE-100-PCON-B
QE-100-PIMI-A
QE-100-PIMI-B
QE-50-PCON-A
QE-50-PCON-B
QE-50-PIMI-B

10
IMI
1kb
plu
s
T1
- P
CO
N -
A
T1
- P
CO
N -
B
T1
- P
IMI
- A
T1
- P
IMI
- B
T2
- P
CO
N -
A
T2
- P
CO
N -
B
T2
- P
IMI
- A
T2
- P
IMI
- B
T3
- P
CO
N -
A
T3
- P
CO
N -
B
T3
- P
IMI
- A
T3
- P
IMI
- B
QE
100 -
PC
ON
- A
QE
100 -
PC
ON
- B
QE
100 -
PIM
I -
A
QE
100 -
PIM
I -
B
QE
50 -
PC
ON
- A
QE
50 -
PC
ON
- B
QE
50 -
PIM
I -
A
QE
50 -
PIM
I -
B
1kb
plu
s
Lectina
100 p
b
T1
- P
CO
N -
A
T1
- P
CO
N -
B
T1
- P
IMI
- A
T1
- P
IMI
- B
T2
- P
CO
N -
A
T2
- P
CO
N -
B
T2
- P
IMI
- A
T2
- P
IMI
- B
T3
- P
CO
N -
A
T3
- P
CO
N -
B
T3
- P
IMI
- A
T3
- P
IMI
- B
QE
100 -
PC
ON
- A
QE
100 -
PC
ON
- B
QE
100 -
PIM
I -
A
QE
100 -
PIM
I -
B
QE
50 -
PC
ON
- A
QE
50 -
PC
ON
- B
QE
50 -
PIM
I -
A
QE
50 -
PIM
I -
B
100 p
b
11
100 p
b
F6P
CO
N
F6P
IMI
T1P
CO
NA
T1P
IMIA
T2P
CO
NA
T2P
IMIA
T3P
CO
NA
T3P
IMIA
QE
100P
CO
NA
QE
100P
IMIA
QE
50P
CO
NA
QE
50P
IMIA
100 p
b
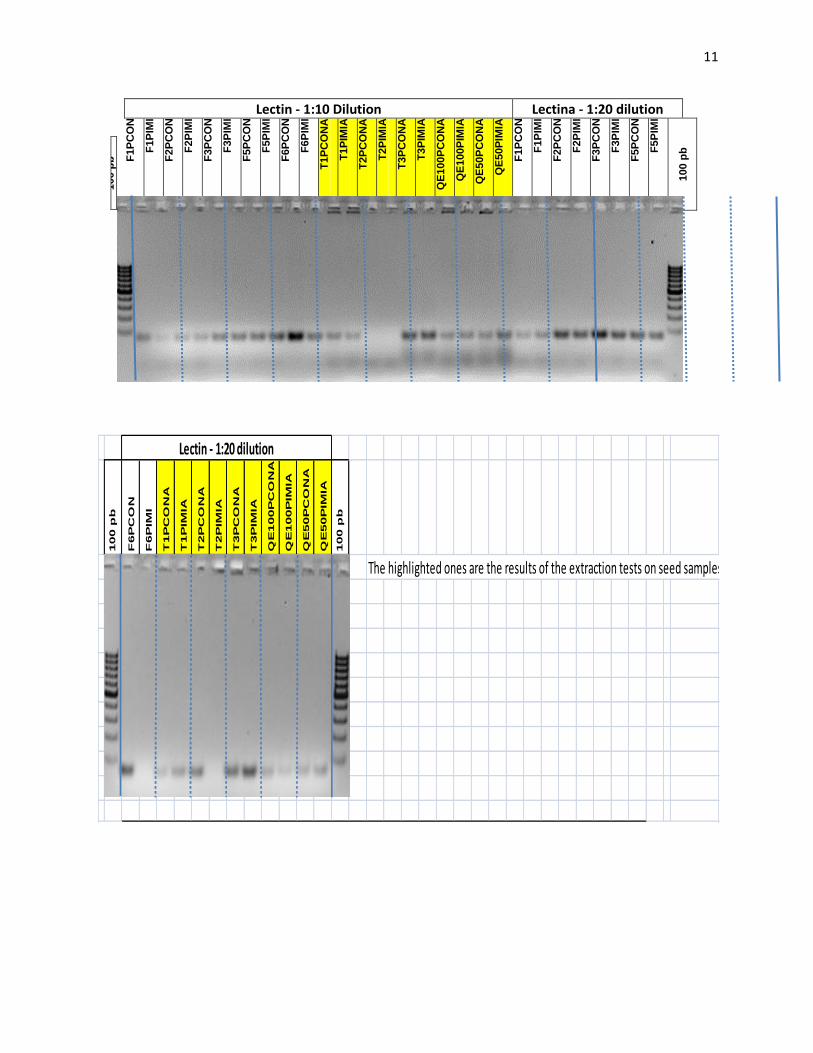
The highlighted ones are the results of the extraction tests on seed samples.
Lectin - 1:20 dilution
Lectin - 1:10 Dilution Lectina - 1:20 dilution
100 p
b
F1
PC
ON
F1
PIM
I
F2
PC
ON
F2
PIM
I
F3
PC
ON
F3
PIM
I
F5
PC
ON
F5
PIM
I
F6
PC
ON
F6
PIM
I
T1
PC
ON
A
T1
PIM
IA
T2
PC
ON
A
T2
PIM
IA
T3
PC
ON
A
T3
PIM
IA
QE
100P
CO
NA
QE
100P
IMIA
QE
50P
CO
NA
QE
50P
IMIA
F1
PC
ON
F1
PIM
I
F2
PC
ON
F2
PIM
I
F3
PC
ON
F3
PIM
I
F5
PC
ON
F5
PIM
I
100 p
b

12
IMI - 1:20 dilution
1kb
plu
s
T1
PC
ON
A
T1
PIM
IA
T2
PC
ON
A
T2
PIM
IA
T3
PC
ON
A
T3
PIM
IA
QE
100P
CO
NA
QE
100P
IMIA
QE
50P
CO
NA
QE
50P
IMIA
1kb
plu
s
1kb
plu
s
F1P
CO
N
F1P
IMI
F2P
CO
N
F2P
IMI
F3P
CO
N
F3P
IMI
F5P
CO
N
F5P
IMI
F6P
CO
N
F6P
IMI
T1P
CO
NA
T1P
IMIA
T2P
CO
NA
T2P
IMIA
T3P
CO
NA
T3P
IMIA
QE
100P
CO
NA
QE
100P
IMIA
QE
50P
CO
NA
QE
50P
IMIA
F1P
CO
N
F1P
IMI
F2P
CO
N
F2P
IMI
F3P
CO
N
F3P
IMI
F5P
CO
N
F5P
IMI
F6P
CO
N
F6P
IMI
1kb
plu
s
IMI - 1:10 Dilution IMI - 1:20 dilution
13
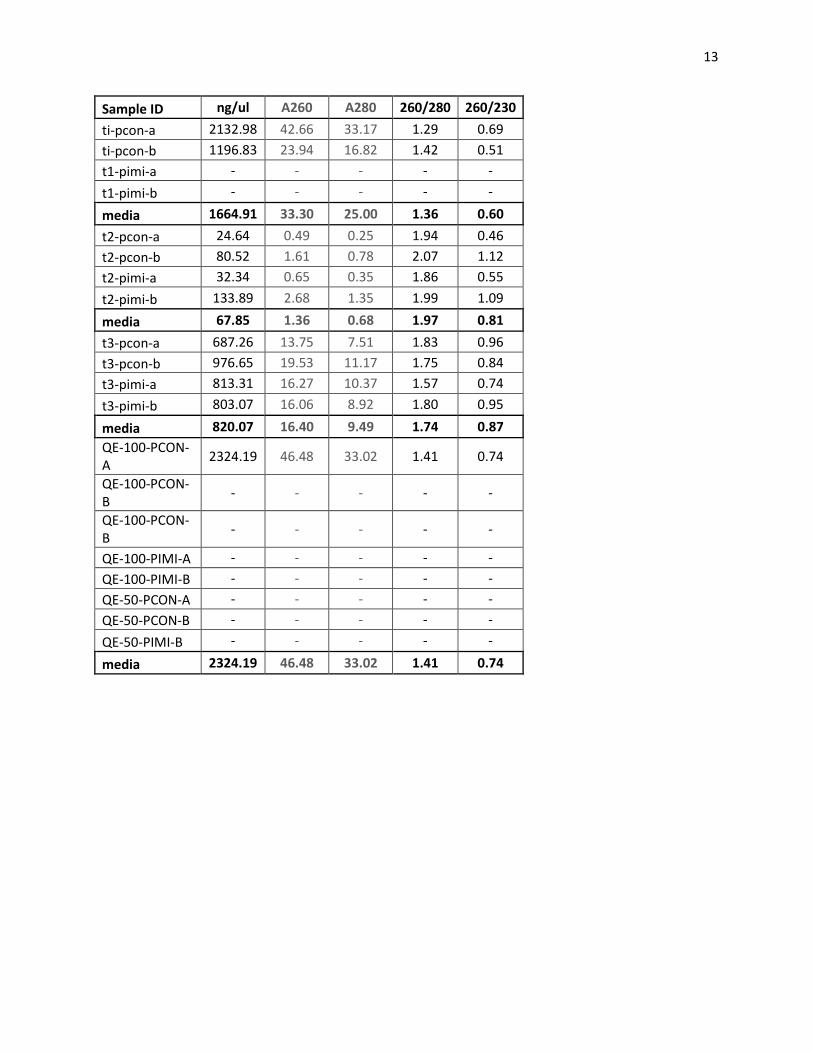
Sample ID ng/ul A260 A280 260/280 260/230
ti-pcon-a 2132.98 42.66 33.17 1.29 0.69
ti-pcon-b 1196.83 23.94 16.82 1.42 0.51
t1-pimi-a - - - - -
t1-pimi-b - - - - -
media 1664.91 33.30 25.00 1.36 0.60
t2-pcon-a 24.64 0.49 0.25 1.94 0.46
t2-pcon-b 80.52 1.61 0.78 2.07 1.12
t2-pimi-a 32.34 0.65 0.35 1.86 0.55
t2-pimi-b 133.89 2.68 1.35 1.99 1.09
media 67.85 1.36 0.68 1.97 0.81
t3-pcon-a 687.26 13.75 7.51 1.83 0.96
t3-pcon-b 976.65 19.53 11.17 1.75 0.84
t3-pimi-a 813.31 16.27 10.37 1.57 0.74
t3-pimi-b 803.07 16.06 8.92 1.80 0.95
media 820.07 16.40 9.49 1.74 0.87
QE-100-PCON-A
2324.19 46.48 33.02 1.41 0.74
QE-100-PCON-B
- - - - -
QE-100-PCON-B
- - - - -
QE-100-PIMI-A - - - - -
QE-100-PIMI-B - - - - -
QE-50-PCON-A - - - - -
QE-50-PCON-B - - - - -
QE-50-PIMI-B - - - - -
media 2324.19 46.48 33.02 1.41 0.74
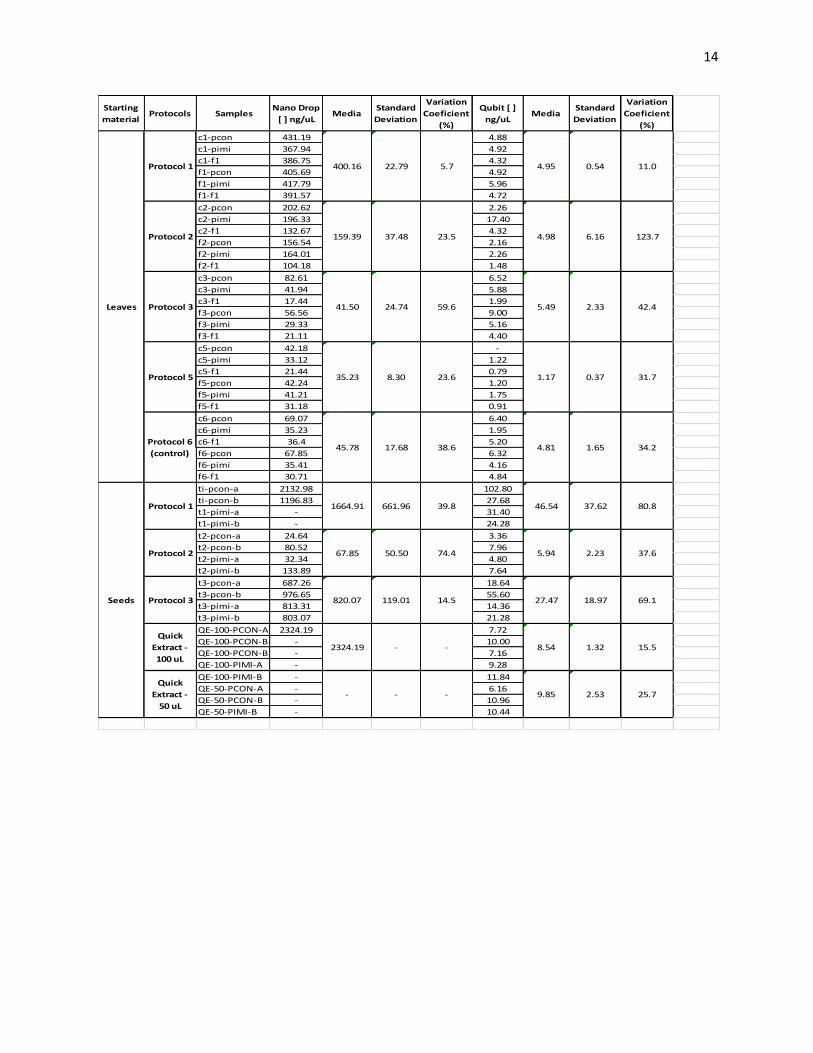
14
Starting
materialProtocols Samples
Nano Drop
[ ] ng/uLMedia
Standard
Deviation
Variation
Coeficient
(%)
Qubit [ ]
ng/uLMedia
Standard
Deviation
Variation
Coeficient
(%)
c1-pcon 431.19 4.88
c1-pimi 367.94 4.92
c1-f1 386.75 4.32
f1-pcon 405.69 4.92
f1-pimi 417.79 5.96
f1-f1 391.57 4.72
c2-pcon 202.62 2.26
c2-pimi 196.33 17.40
c2-f1 132.67 4.32
f2-pcon 156.54 2.16
f2-pimi 164.01 2.26
f2-f1 104.18 1.48
c3-pcon 82.61 6.52
c3-pimi 41.94 5.88
c3-f1 17.44 1.99
f3-pcon 56.56 9.00
f3-pimi 29.33 5.16
f3-f1 21.11 4.40
c5-pcon 42.18 -
c5-pimi 33.12 1.22
c5-f1 21.44 0.79
f5-pcon 42.24 1.20
f5-pimi 41.21 1.75
f5-f1 31.18 0.91
c6-pcon 69.07 6.40
c6-pimi 35.23 1.95
c6-f1 36.4 5.20
f6-pcon 67.85 6.32
f6-pimi 35.41 4.16
f6-f1 30.71 4.84
ti-pcon-a 2132.98 102.80
ti-pcon-b 1196.83 27.68
t1-pimi-a - 31.40
t1-pimi-b - 24.28
t2-pcon-a 24.64 3.36
t2-pcon-b 80.52 7.96
t2-pimi-a 32.34 4.80
t2-pimi-b 133.89 7.64
t3-pcon-a 687.26 18.64
t3-pcon-b 976.65 55.60
t3-pimi-a 813.31 14.36
t3-pimi-b 803.07 21.28
QE-100-PCON-A 2324.19 7.72
QE-100-PCON-B - 10.00
QE-100-PCON-B - 7.16
QE-100-PIMI-A - 9.28
QE-100-PIMI-B - 11.84
QE-50-PCON-A - 6.16
QE-50-PCON-B - 10.96
QE-50-PIMI-B - 10.44
Leaves
Protocol 1 400.16 22.79 5.7
Protocol 3 41.50 24.74 59.6
0.54 11.0
Protocol 2 159.39 37.48 23.5 4.98 6.16 123.7
4.95
1.65
5.49 2.33 42.4
Protocol 5 35.23 8.30 23.6 1.17 0.37 31.7
37.6
34.2
Seeds
Protocol 1 1664.91 661.96 39.8 46.54 37.62 80.8
Protocol 2
Protocol 6
(control)45.78 17.68 38.6 4.81
67.85 50.50 74.4 5.94 2.23
69.1
Quick
Extract -
100 uL
2324.19 - - 8.54 1.32 15.5
Protocol 3 820.07 119.01 14.5 27.47 18.97
25.7
Quick
Extract -
50 uL
- - - 9.85 2.53
15
Section 2
S2 Purpose The purpose of this section was to identify Simple Sequence Repeats (SSR) for use in Marker
Assisted Selection of genes that confer resistance to Asian Soybean Rust (ASR). Tatiana and I
worked on this section of the experiment.
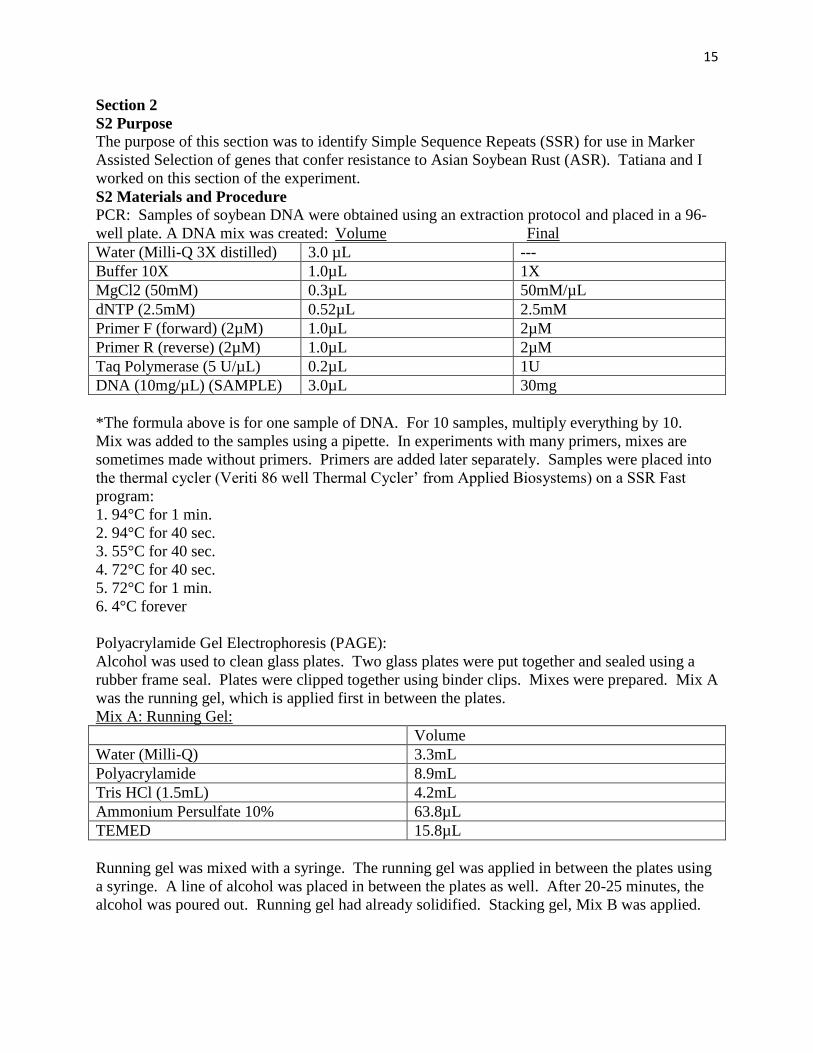
S2 Materials and Procedure
PCR: Samples of soybean DNA were obtained using an extraction protocol and placed in a 96-
well plate. A DNA mix was created: Volume Final
Water (Milli-Q 3X distilled) 3.0 µL ---
Buffer 10X 1.0µL 1X
MgCl2 (50mM) 0.3µL 50mM/µL
dNTP (2.5mM) 0.52µL 2.5mM
Primer F (forward) (2µM) 1.0µL 2µM
Primer R (reverse) (2µM) 1.0µL 2µM
Taq Polymerase (5 U/µL) 0.2µL 1U
DNA (10mg/µL) (SAMPLE) 3.0µL 30mg
*The formula above is for one sample of DNA. For 10 samples, multiply everything by 10.
Mix was added to the samples using a pipette. In experiments with many primers, mixes are
sometimes made without primers. Primers are added later separately. Samples were placed into
the thermal cycler (Veriti 86 well Thermal Cycler’ from Applied Biosystems) on a SSR Fast
program:
1. 94°C for 1 min.
2. 94°C for 40 sec.
3. 55°C for 40 sec.
4. 72°C for 40 sec.
5. 72°C for 1 min.
6. 4°C forever
Polyacrylamide Gel Electrophoresis (PAGE):
Alcohol was used to clean glass plates. Two glass plates were put together and sealed using a
rubber frame seal. Plates were clipped together using binder clips. Mixes were prepared. Mix A
was the running gel, which is applied first in between the plates.
Mix A: Running Gel:
Volume
Water (Milli-Q) 3.3mL
Polyacrylamide 8.9mL
Tris HCl (1.5mL) 4.2mL
Ammonium Persulfate 10% 63.8µL
TEMED 15.8µL
Running gel was mixed with a syringe. The running gel was applied in between the plates using
a syringe. A line of alcohol was placed in between the plates as well. After 20-25 minutes, the
alcohol was poured out. Running gel had already solidified. Stacking gel, Mix B was applied.
16
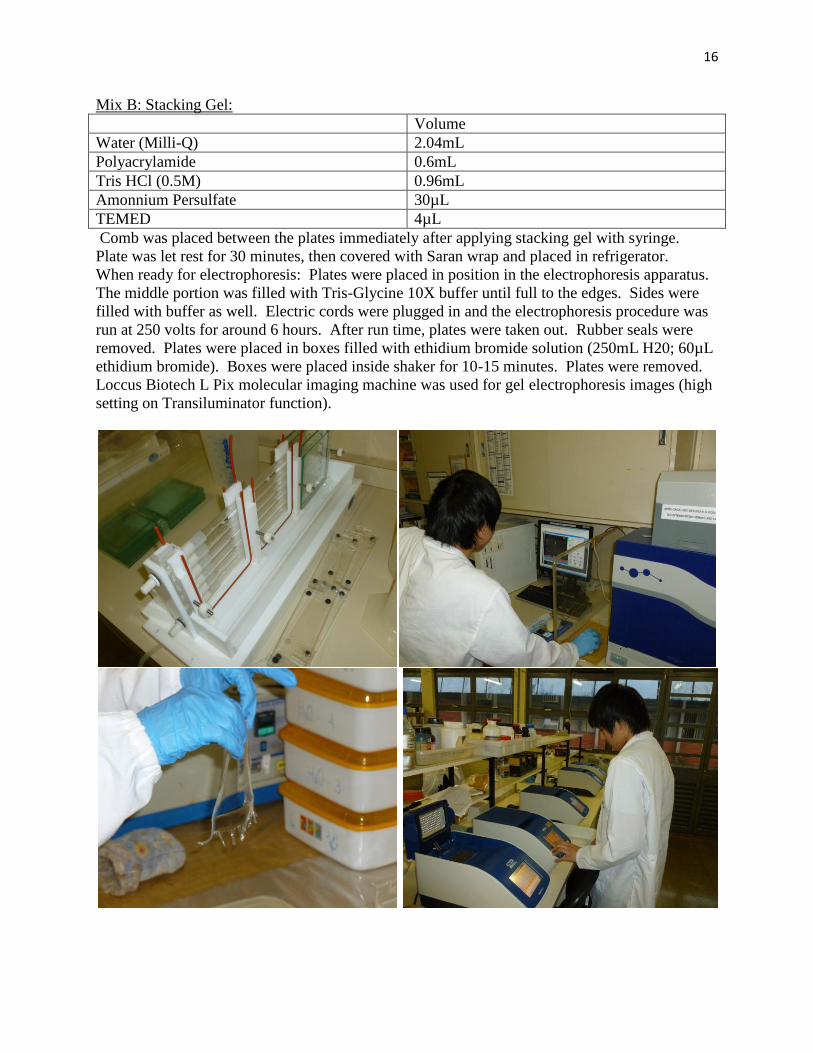
Mix B: Stacking Gel:
Volume
Water (Milli-Q) 2.04mL
Polyacrylamide 0.6mL
Tris HCl (0.5M) 0.96mL
Amonnium Persulfate 30µL
TEMED 4µL
Comb was placed between the plates immediately after applying stacking gel with syringe.
Plate was let rest for 30 minutes, then covered with Saran wrap and placed in refrigerator.
When ready for electrophoresis: Plates were placed in position in the electrophoresis apparatus.
The middle portion was filled with Tris-Glycine 10X buffer until full to the edges. Sides were
filled with buffer as well. Electric cords were plugged in and the electrophoresis procedure was
run at 250 volts for around 6 hours. After run time, plates were taken out. Rubber seals were
removed. Plates were placed in boxes filled with ethidium bromide solution (250mL H20; 60µL
ethidium bromide). Boxes were placed inside shaker for 10-15 minutes. Plates were removed.
Loccus Biotech L Pix molecular imaging machine was used for gel electrophoresis images (high
setting on Transiluminator function).
17
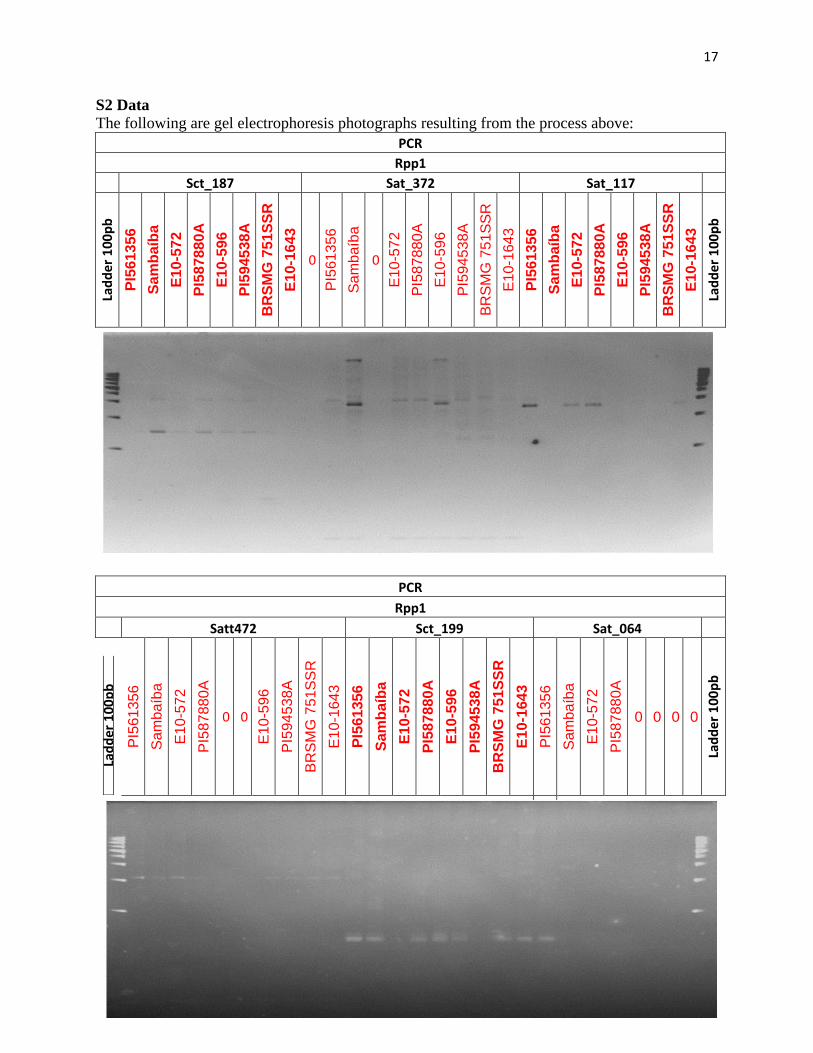
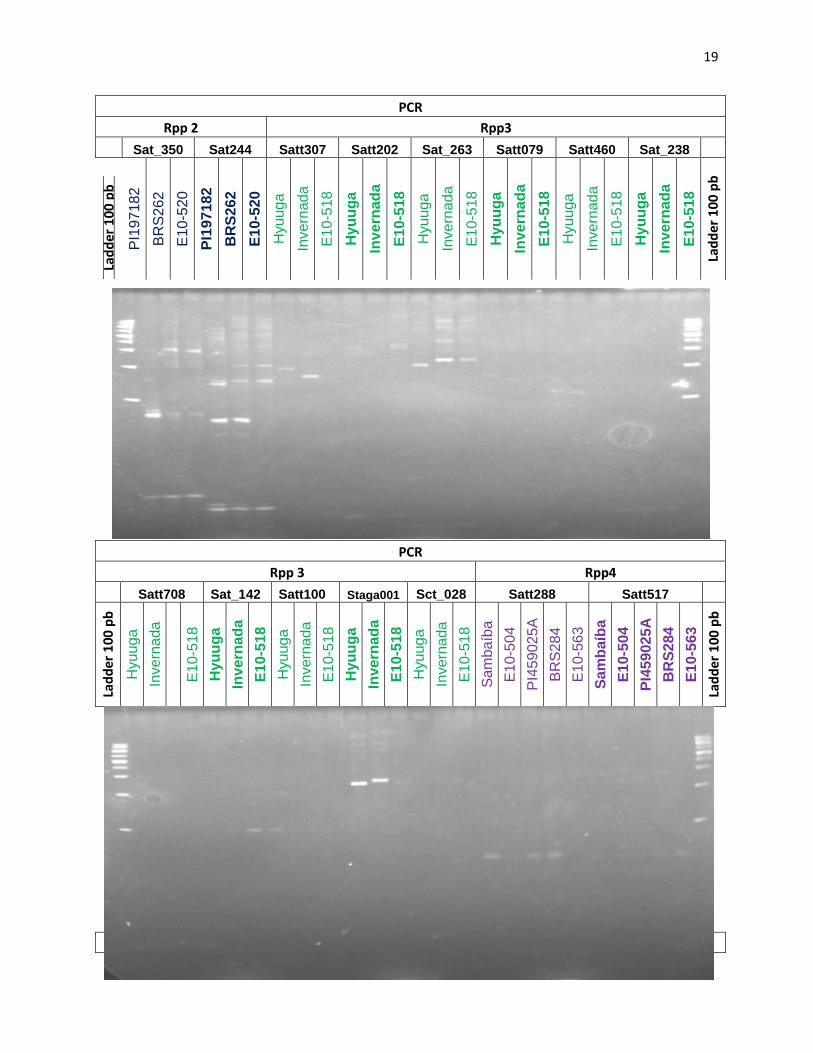
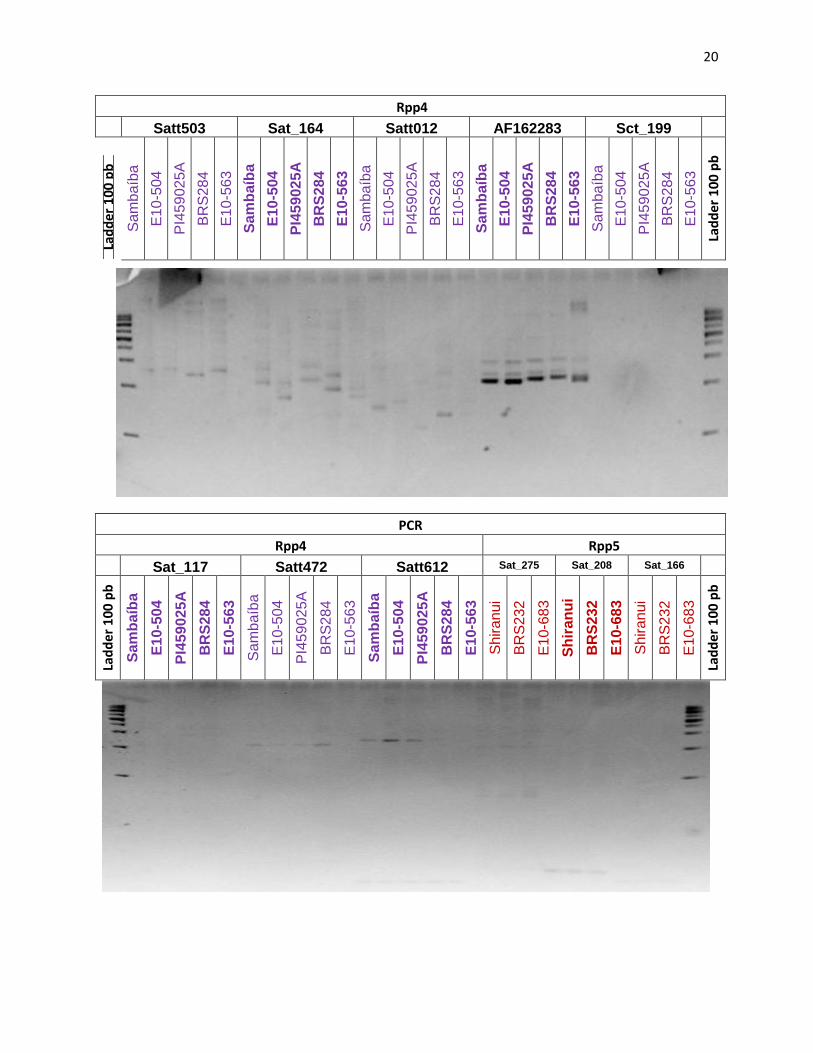
S2 Data
The following are gel electrophoresis photographs resulting from the process above:
PCR
Rpp1
Sct_187 Sat_372 Sat_117
Lad
der
10
0p
b
PI5
61
35
6
Sa
mb
aíb
a
E1
0-5
72
PI5
87
88
0A
E1
0-5
96
PI5
94
53
8A
BR
SM
G 7
51
SS
R
E1
0-1
643
0
PI5
61
35
6
Sa
mb
aíb
a
0
E1
0-5
72
PI5
87
88
0A
E1
0-5
96
PI5
94
53
8A
BR
SM
G 7
51
SS
R
E1
0-1
643
PI5
61
35
6
Sa
mb
aíb
a
E1
0-5
72
PI5
87
88
0A
E1
0-5
96
PI5
94
53
8A
BR
SM
G 7
51
SS
R
E1
0-1
643
Lad
der
10
0p
b
PCR
Rpp1
Satt472 Sct_199 Sat_064
Lad
der
100
pb
PI5
61
35
6
Sa
mb
aíb
a
E1
0-5
72
PI5
87
88
0A
0 0
E1
0-5
96
PI5
94
53
8A
BR
SM
G 7
51
SS
R
E1
0-1
643
PI5
61
35
6
Sa
mb
aíb
a
E1
0-5
72
PI5
87
88
0A
E1
0-5
96
PI5
94
53
8A
BR
SM
G 7
51
SS
R
E1
0-1
643
PI5
61
35
6
Sa
mb
aíb
a
E1
0-5
72
PI5
87
88
0A
0 0 0 0 La
dd
er 1
00p
b

18
PCR
Rpp1 Rpp2
Sat_064 Sat_93 Sct_001 Sat_361 Satt215 Sat350 Sat380
Lad
der
10
0p
b
E1
0-5
96
PI5
94
53
8A
BR
SM
G 7
51
SS
R
E1
0-1
643
PI1
97
18
2
0
BR
S2
62
E1
0-5
20
PI1
97
18
2
BR
S2
62
E1
0-5
20
PI1
97
18
2
BR
S2
62
E1
0-5
20
0 0
PI1
97
18
2
BR
S2
62
0
E1
0-5
20
PI1
97
18
2
BR
S2
62
E1
0-5
20
PI1
97
18
2
BR
S2
62
E1
0-5
20
Lad
der
10
0p
b
PCR
Rpp2
Satt183 Sat622 Sat_165 Satt620 Satt621 Sct_193 Sat_151 Sat_412
Lad
de
r 1
00
pb
PI1
97
18
2
BR
S2
62
E1
0-5
20
PI1
97
18
2
BR
S2
62
0
E1
0-5
20
PI1
97
18
2
BR
S2
62
E1
0-5
20
PI1
97
18
2
BR
S2
62
E1
0-5
20
PI1
97
18
2
BR
S2
62
E1
0-5
20
PI1
97
18
2
0
BR
S2
62
E1
0-5
20
PI1
97
18
2
BR
S2
62
E10-5
20
PI1
97
18
2
BR
S2
62
E1
0-5
20
Lad
de
r 1
00
pb
19
PCR
Rpp 2 Rpp3
Sat_350 Sat244 Satt307 Satt202 Sat_263 Satt079 Satt460 Sat_238
Lad
der
10
0 p
b
PI1
97
18
2
BR
S2
62
E1
0-5
20
PI1
97
18
2
BR
S2
62
E1
0-5
20
Hyu
ug
a
Invern
ad
a
E1
0-5
18
Hy
uu
ga
Inve
rnad
a
E1
0-5
18
Hyu
ug
a
Invern
ada
E1
0-5
18
Hy
uu
ga
Inve
rnad
a
E1
0-5
18
Hyu
ug
a
Invern
ad
a
E1
0-5
18
Hy
uu
ga
Inve
rnad
a
E1
0-5
18
Lad
der
10
0 p
b
PCR
Rpp 3 Rpp4
Satt708 Sat_142 Satt100 Staga001 Sct_028 Satt288 Satt517
Lad
de
r 1
00
pb
Hyu
ug
a
Invern
ad
a
E1
0-5
18
Hy
uu
ga
Inve
rnad
a
E1
0-5
18
Hyu
ug
a
Invern
ad
a
E1
0-5
18
Hy
uu
ga
Inve
rnad
a
E1
0-5
18
Hyu
ug
a
Invern
ad
a
E1
0-5
18
Sa
mb
aíb
a
E1
0-5
04
PI4
59
02
5A
BR
S2
84
E1
0-5
63
Sam
ba
íba
E1
0-5
04
PI4
59
02
5A
BR
S2
84
E1
0-5
63
Lad
de
r 1
00
pb
PCR
20
Rpp4
Satt503 Sat_164 Satt012 AF162283 Sct_199
Lad
der
10
0 p
b
Sa
mb
aíb
a
E1
0-5
04
PI4
59
02
5A
BR
S2
84
E1
0-5
63
Sa
mb
aíb
a
E1
0-5
04
PI4
59
02
5A
BR
S2
84
E1
0-5
63
Sa
mb
aíb
a
E1
0-5
04
PI4
59
02
5A
BR
S2
84
E1
0-5
63
Sa
mb
aíb
a
E1
0-5
04
PI4
59
02
5A
BR
S2
84
E1
0-5
63
Sa
mb
aíb
a
E1
0-5
04
PI4
59
02
5A
BR
S2
84
E1
0-5
63
Lad
der
10
0 p
b
PCR
Rpp4 Rpp5
Sat_117 Satt472 Satt612 Sat_275 Sat_208 Sat_166
Lad
de
r 1
00
pb
Sa
mb
aíb
a
E1
0-5
04
PI4
59
02
5A
BR
S2
84
E1
0-5
63
Sa
mb
aíb
a
E1
0-5
04
PI4
59
02
5A
BR
S2
84
E1
0-5
63
Sa
mb
aíb
a
E1
0-5
04
PI4
59
02
5A
BR
S2
84
E1
0-5
63
Sh
ira
nu
i
BR
S2
32
E10-6
83
Sh
ira
nu
i
BR
S2
32
E1
0-6
83
Sh
ira
nu
i
BR
S2
32
E1
0-6
83
Lad
de
r 1
00
pb
21
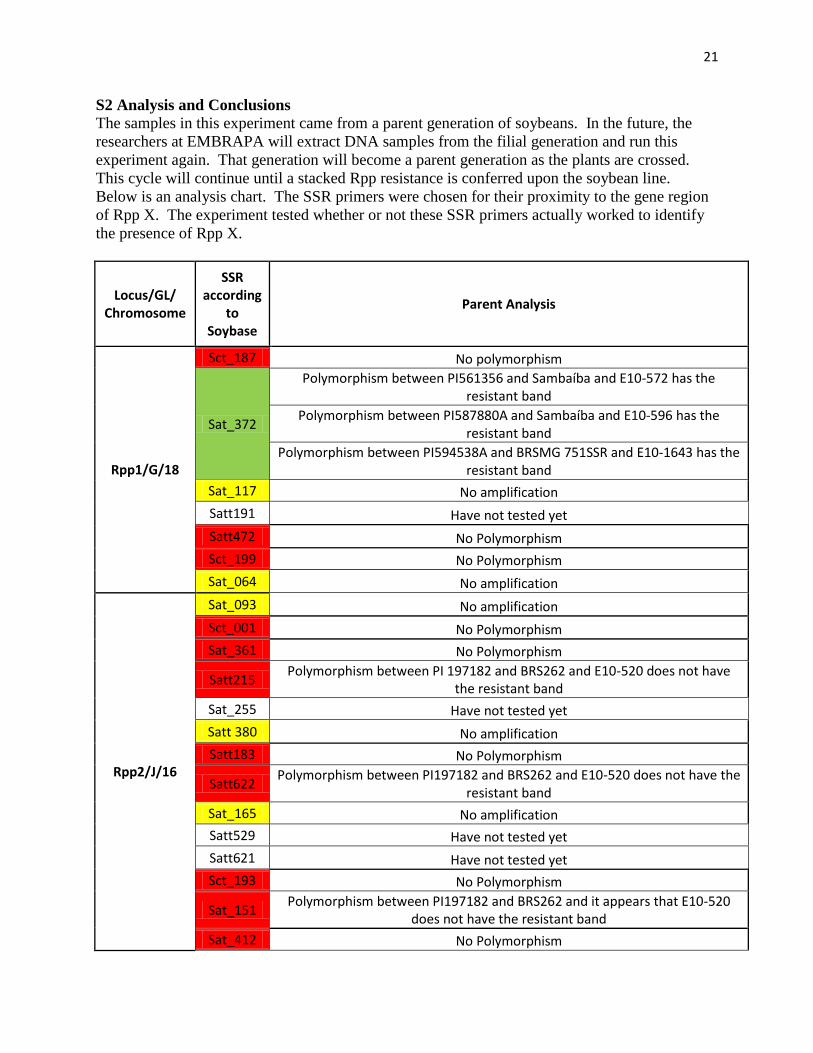
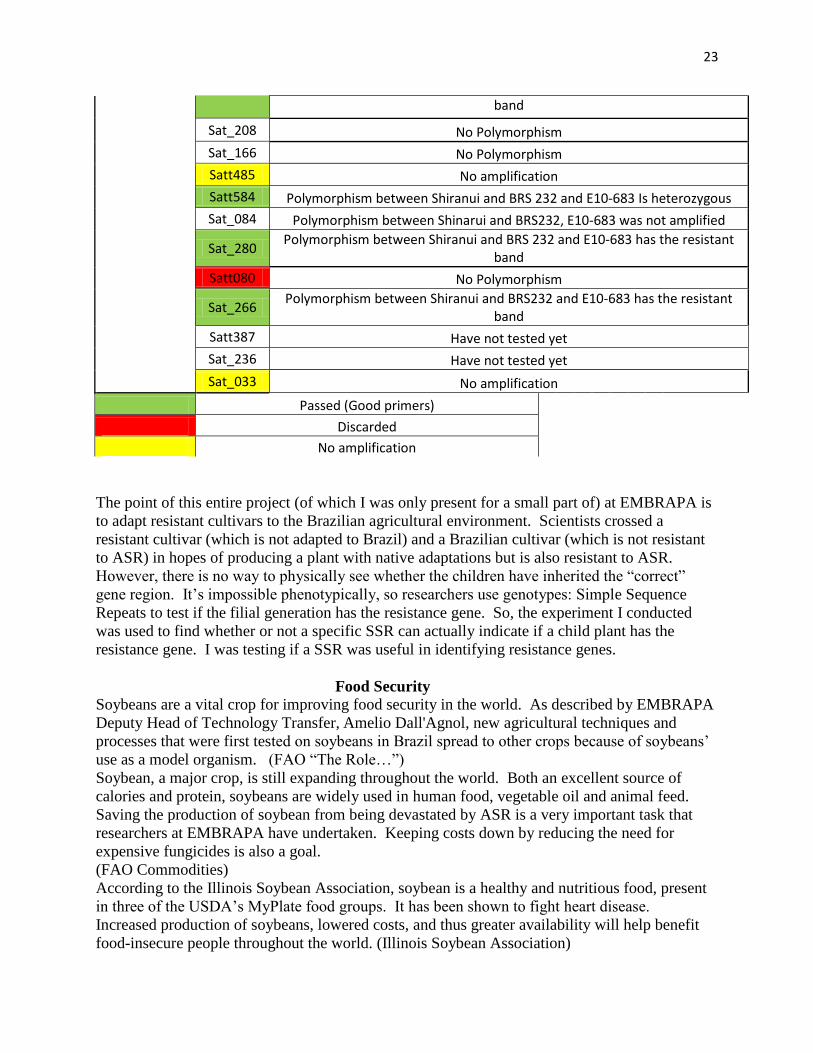
S2 Analysis and Conclusions
The samples in this experiment came from a parent generation of soybeans. In the future, the
researchers at EMBRAPA will extract DNA samples from the filial generation and run this
experiment again. That generation will become a parent generation as the plants are crossed.
This cycle will continue until a stacked Rpp resistance is conferred upon the soybean line.
Below is an analysis chart. The SSR primers were chosen for their proximity to the gene region
of Rpp X. The experiment tested whether or not these SSR primers actually worked to identify
the presence of Rpp X.
Locus/GL/ Chromosome
SSR according
to Soybase
Parent Analysis
Rpp1/G/18
Sct_187 No polymorphism
Sat_372
Polymorphism between PI561356 and Sambaíba and E10-572 has the resistant band
Polymorphism between PI587880A and Sambaíba and E10-596 has the resistant band
Polymorphism between PI594538A and BRSMG 751SSR and E10-1643 has the resistant band
Sat_117 No amplification
Satt191 Have not tested yet
Satt472 No Polymorphism
Sct_199 No Polymorphism
Sat_064 No amplification
Rpp2/J/16
Sat_093 No amplification
Sct_001 No Polymorphism
Sat_361 No Polymorphism
Satt215 Polymorphism between PI 197182 and BRS262 and E10-520 does not have
the resistant band
Sat_255 Have not tested yet
Satt 380 No amplification
Satt183 No Polymorphism
Satt622 Polymorphism between PI197182 and BRS262 and E10-520 does not have the
resistant band
Sat_165 No amplification
Satt529 Have not tested yet
Satt621 Have not tested yet
Sct_193 No Polymorphism
Sat_151 Polymorphism between PI197182 and BRS262 and it appears that E10-520
does not have the resistant band
Sat_412 No Polymorphism
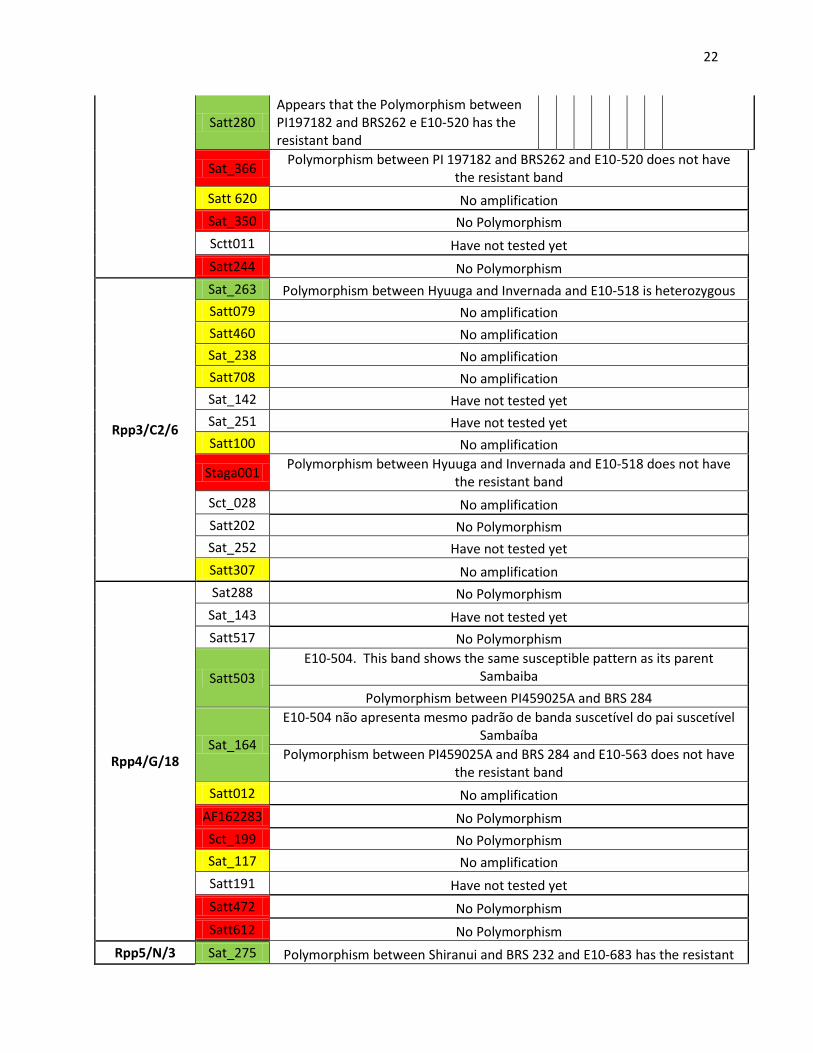
22
Satt280 Appears that the Polymorphism between PI197182 and BRS262 e E10-520 has the resistant band
Sat_366 Polymorphism between PI 197182 and BRS262 and E10-520 does not have
the resistant band
Satt 620 No amplification
Sat_350 No Polymorphism
Sctt011 Have not tested yet
Satt244 No Polymorphism
Rpp3/C2/6
Sat_263 Polymorphism between Hyuuga and Invernada and E10-518 is heterozygous
Satt079 No amplification
Satt460 No amplification
Sat_238 No amplification
Satt708 No amplification
Sat_142 Have not tested yet
Sat_251 Have not tested yet
Satt100 No amplification
Staga001 Polymorphism between Hyuuga and Invernada and E10-518 does not have
the resistant band
Sct_028 No amplification
Satt202 No Polymorphism
Sat_252 Have not tested yet
Satt307 No amplification
Rpp4/G/18
Sat288 No Polymorphism
Sat_143 Have not tested yet
Satt517 No Polymorphism
Satt503
E10-504. This band shows the same susceptible pattern as its parent Sambaiba
Polymorphism between PI459025A and BRS 284
Sat_164
E10-504 não apresenta mesmo padrão de banda suscetível do pai suscetível Sambaíba
Polymorphism between PI459025A and BRS 284 and E10-563 does not have the resistant band
Satt012 No amplification
AF162283 No Polymorphism
Sct_199 No Polymorphism
Sat_117 No amplification
Satt191 Have not tested yet
Satt472 No Polymorphism
Satt612 No Polymorphism
Rpp5/N/3 Sat_275 Polymorphism between Shiranui and BRS 232 and E10-683 has the resistant
23
band
Sat_208 No Polymorphism
Sat_166 No Polymorphism
Satt485 No amplification
Satt584 Polymorphism between Shiranui and BRS 232 and E10-683 Is heterozygous
Sat_084 Polymorphism between Shinarui and BRS232, E10-683 was not amplified
Sat_280 Polymorphism between Shiranui and BRS 232 and E10-683 has the resistant
band
Satt080 No Polymorphism
Sat_266 Polymorphism between Shiranui and BRS232 and E10-683 has the resistant
band
Satt387 Have not tested yet
Sat_236 Have not tested yet
Sat_033 No amplification
Passed (Good primers) Discarded No amplification
The point of this entire project (of which I was only present for a small part of) at EMBRAPA is
to adapt resistant cultivars to the Brazilian agricultural environment. Scientists crossed a
resistant cultivar (which is not adapted to Brazil) and a Brazilian cultivar (which is not resistant
to ASR) in hopes of producing a plant with native adaptations but is also resistant to ASR.
However, there is no way to physically see whether the children have inherited the “correct”
gene region. It’s impossible phenotypically, so researchers use genotypes: Simple Sequence
Repeats to test if the filial generation has the resistance gene. So, the experiment I conducted
was used to find whether or not a specific SSR can actually indicate if a child plant has the
resistance gene. I was testing if a SSR was useful in identifying resistance genes.
Food Security
Soybeans are a vital crop for improving food security in the world. As described by EMBRAPA
Deputy Head of Technology Transfer, Amelio Dall'Agnol, new agricultural techniques and
processes that were first tested on soybeans in Brazil spread to other crops because of soybeans’
use as a model organism. (FAO “The Role…”)
Soybean, a major crop, is still expanding throughout the world. Both an excellent source of
calories and protein, soybeans are widely used in human food, vegetable oil and animal feed.
Saving the production of soybean from being devastated by ASR is a very important task that
researchers at EMBRAPA have undertaken. Keeping costs down by reducing the need for
expensive fungicides is also a goal.
(FAO Commodities)
According to the Illinois Soybean Association, soybean is a healthy and nutritious food, present
in three of the USDA’s MyPlate food groups. It has been shown to fight heart disease.
Increased production of soybeans, lowered costs, and thus greater availability will help benefit
food-insecure people throughout the world. (Illinois Soybean Association)

24
Brazil My surface immersion in Brazilian food (meat!) and culture was amazing. But after a while,
what I really liked the most about Brazil is the warmth of its people, the sense of development,
and the diversity. Everyone I talked to in Brazil was very courteous and opened up to
conversation quickly. I also loved how Brazil as a country is rapidly growing and developing
into a South American power. I felt that spirit of advancement especially keenly through my
involvement with science at EMBRAPA. Finally, Brazil also made me feel welcome as it is an
amazing melting pot of cultures (gauchos, European, Asian, indigenous, Caribbean) and
ethnicities just like the U.S.
Personal Reflection
I’ve always been interest in science. Growing up, I leafed through encyclopedias and
other reference books to learn more about our natural world. In high school, I took many science
courses, competed in events such as science fair and USA Biology Olympiad, and interned in
university research labs. Until my World Food Prize experience that culminated with my BR
internship, however, science was extremely individualistic. The Borlaug-Ruan internship
changed my perception of science and proved to me that science is not just a researcher sitting
alone at his workbench; it’s also people cooperating while arranged around a room, a lab,
multiple labs, and the world.
I observed this collaboration immediately in my first couple of days working at
EMBRAPA. I saw graduate students, technicians, and researchers all helping each other with an
assortment of tasks. Many people took the time to help their lab-mates who weren’t even
working on the same project or research area. A graduate student named Noelle had worked in
Japan for 8 months. She taught other students and me some extraction techniques she had
learned there. Another student named Valeria gave me tips and helped me save time on PCR
reactions. I later passed on these skills to lab-newcomers. While these two examples occurred
within a lab, I also witnessed cooperation between laboratories and EMBRAPA units as well as
internationally between EMBRAPA and the Japanese company JIRCAS.
In Brazil, I finally understood that science is really about cooperation between people to
learn more about nature. This internship spurred my passion for science by revealing its aspect
of collaboration.
25
Works Cited
FAO Commodities and Trade Division, Basic Foodstuffs Service. "The Role of Soybean in
Fighting World Hunger." FAO.org. UN / FAO. Web. 30 Oct. 2011.
<http://www.fao.org/es/esc/common/ecg/125/en/The_role_of_soybeans.pdf>.
FAO. "The Role of Soybean in Fighting World Hunger." FAO: FAO Home. FAO. Web. 31 Oct.
2011. <http://www.fao.org/es/esc/en/15/120/124/highlight_125.html>.
Hyten, D. L. "Map Location of the Rpp1 Locus That Confers Resistance to Soybean Rust in
Soybean." Crop Science 47 (2007): 837-40. USDA. Web. 30 Oct. 2011.
<http://ddr.nal.usda.gov/bitstream/10113/1024/1/IND43902997.pdf>.
Illinois Soybean Association. "Illinois Soybean Association - Soyfoods - 1-309-663-7692."
Illinois Soybean Association - Illinois Soybean Association - 1-309-663-7692. Web. 31 Oct.
2011. <http://www.ilsoy.org/index.cfm?pageID=20>.
Meyer, Jenelle D.F. "Identification and Analyses of Candidate Genes for Rpp4-Mediated
Resistance to Asian Soybean Rust in Soybean." Plant Physiology. Plant Physiology, 2009. Web.
31 Oct. 2011. <http://www.plantphysiol.org/content/150/1/295.full>.
Silva, Danielle C. G., Naoki Yamanaka, Rodrigo L. Brogin, Carlos A. A. Arias, Alexandre L.
Nepomuceno, Antônio O. Mauro, Selma S. Pereira, Livia M. Nogueira, André L. L. Passianotto,
and Ricardo V. Abdelnoor. "Molecular Mapping of Two Loci That Confer Resistance to Asian
Rust in Soybean." Theoretical and Applied Genetics 117.1 (2008): 57-63. Print.
26
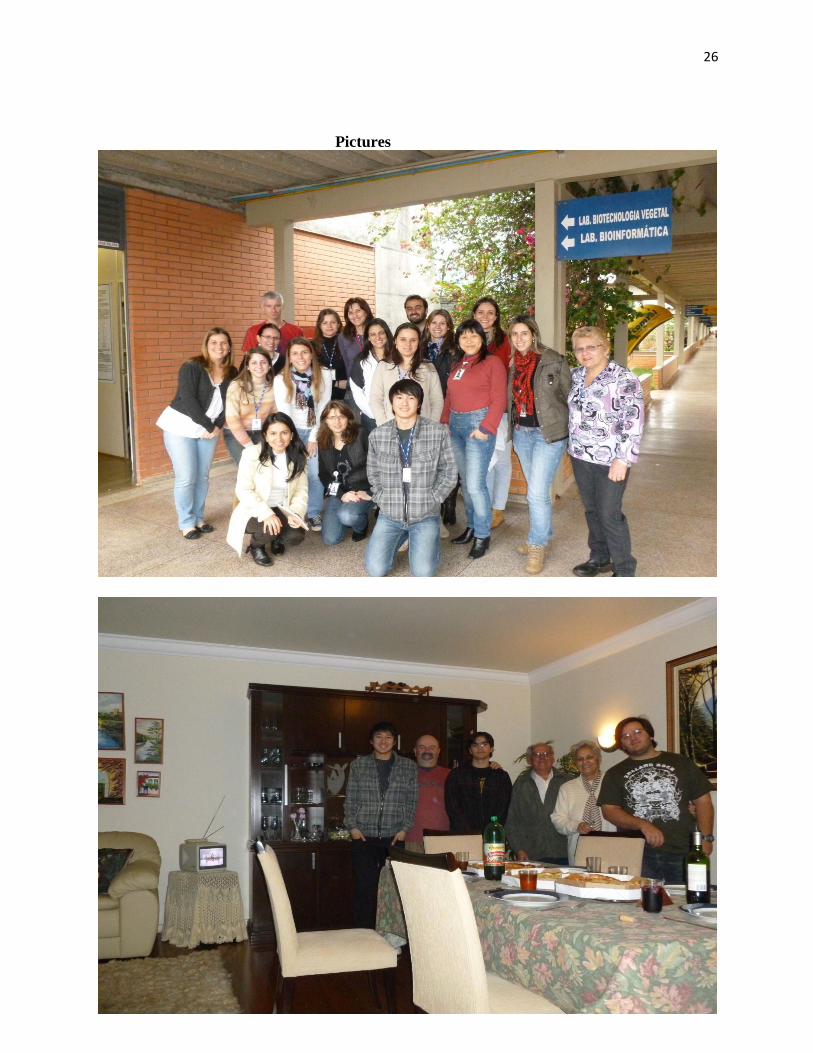
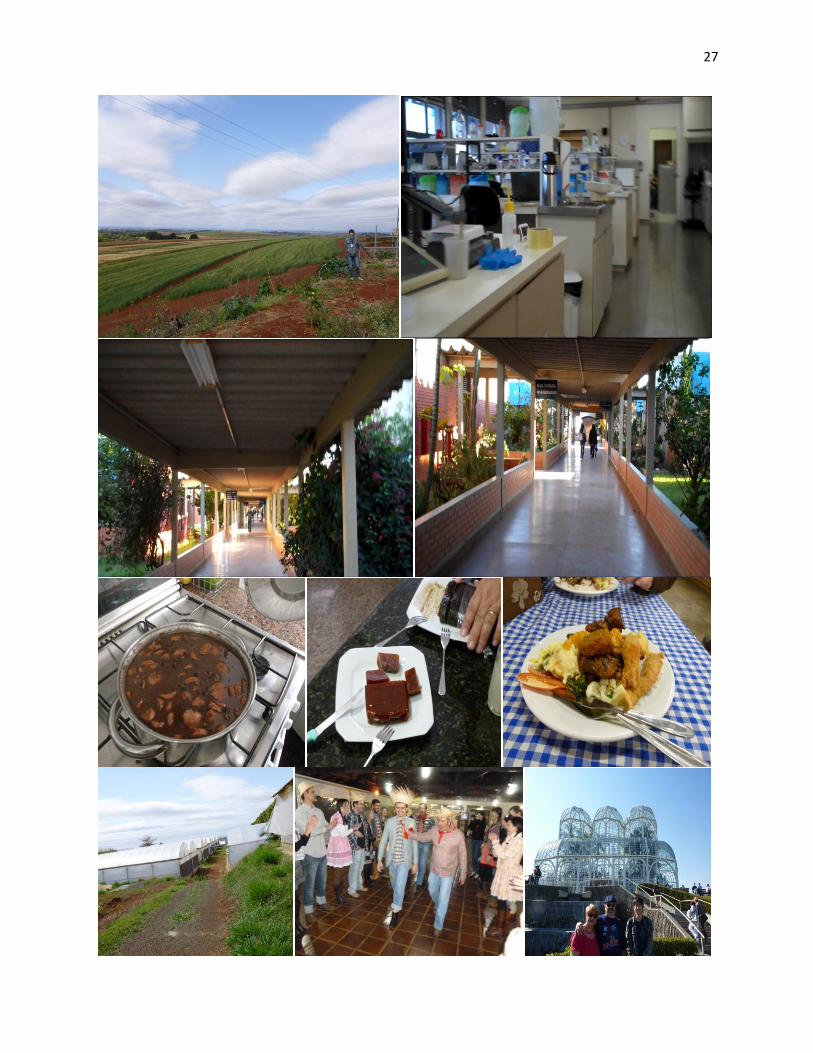
Pictures
27