Embed Size (px)
Citation preview
Mwangala, S; Musonda, KG; Monze, M; Musukwa, KK; Fylkesnes, K(2016) Accuracy in HIV Rapid Testing among Laboratory and Non-laboratory Personnel in Zambia: Observations from the National HIVProficiency Testing System. PLoS One, 11 (1). e0146700. ISSN 1932-6203 DOI: https://doi.org/10.1371/journal.pone.0146700
Downloaded from: http://researchonline.lshtm.ac.uk/2534142/
DOI: 10.1371/journal.pone.0146700
Usage Guidelines
Please refer to usage guidelines at http://researchonline.lshtm.ac.uk/policies.html or alterna-tively contact [email protected].
Available under license: http://creativecommons.org/licenses/by/2.5/
RESEARCH ARTICLE
Accuracy in HIV Rapid Testing amongLaboratory and Non-laboratory Personnel inZambia: Observations from the National HIVProficiency Testing SystemSheila Mwangala1,2*, Kunda G. Musonda1,3, Mwaka Monze1, Katoba K. Musukwa1,Knut Fylkesnes2
1 Virology Laboratory, Department of Pathology and Microbiology, University Teaching Hospital, Lusaka,Zambia, 2 Centre for International Health, Department of Global Public Health and Primary Care, Universityof Bergen, Bergen, Norway, 3 Pathogen Molecular Biology Department, London school of Hygiene andTropical Medicine, University of London, London, United Kingdom
Abstract
Background
Despite rapid task-shifting and scale-up of HIV testing services in high HIV prevalence
countries, studies evaluating accuracy remain limited. This study aimed to assess overall
accuracy level and factors associated with accuracy in HIV rapid testing in Zambia.
Methods
Accuracy was investigated among rural and urban HIV testing sites participating in two
annual national HIV proficiency testing (PT) exercises conducted in 2009 (n = 282 sites)
and 2010 (n = 488 sites). Testers included lay counselors, nurses, laboratory personnel and
others. PT panels of five dry tube specimens (DTS) were issued to testing sites by the
national reference laboratory (NRL). Site accuracy level was assessed by comparison of
reported results to the expected results. Non-parametric rank tests and multiple linear
regression models were used to assess variation in accuracy between PT cycles and
between tester groups, and to examine factors associated with accuracy respectively.
Results
Overall accuracy level was 93.1% (95% CI: 91.2–94.9) in 2009 and 96.9% (95% CI: 96.1–
97.8) in 2010. Differences in accuracy were seen between the tester groups in 2009 with
laboratory personnel being more accurate than non-laboratory personnel, while in 2010 no
differences were seen. In both PT exercises, lay counselors and nurses had more difficul-
ties interpreting results, with more occurrences of false-negative, false-positive and indeter-
minate results. Having received the standard HIV rapid testing training and adherence to
the national HIV testing algorithm were positively associated with accuracy.
PLOS ONE | DOI:10.1371/journal.pone.0146700 January 8, 2016 1 / 15
a11111
OPEN ACCESS
Citation: Mwangala S, Musonda KG, Monze M,Musukwa KK, Fylkesnes K (2016) Accuracy in HIVRapid Testing among Laboratory and Non-laboratoryPersonnel in Zambia: Observations from the NationalHIV Proficiency Testing System. PLoS ONE 11(1):e0146700. doi:10.1371/journal.pone.0146700
Editor: Eliseo A Eugenin, Rutgers University,UNITED STATES
Received: April 23, 2015
Accepted: December 21, 2015
Published: January 8, 2016
Copyright: © 2016 Mwangala et al. This is an openaccess article distributed under the terms of theCreative Commons Attribution License, which permitsunrestricted use, distribution, and reproduction in anymedium, provided the original author and source arecredited.
Data Availability Statement: The data is part of theZambia National Quality Assurance Program on HIVtesting and therefore is owned by the Ministry ofHealth. Data can be accessed by written requestaddressed to the Permanent Secretary, Ministry ofHealth, Ndeke House, P.O. Box 30205, Lusaka,Zambia; email: [email protected]. The letter should befor the attention of Dr Mwaka Monze, PhD, Head ofVirology Laboratory, University Teaching Hospital,Lusaka, Zambia; email: [email protected].
Funding: The authors acknowledge the Centres forDisease Control and Prevention (CDC) for funding
Conclusion
The study showed an improvement in tester group and overall accuracy from the first PT
exercise to the next. Average number of incorrect test results per 1000 tests performed was
reduced from 69 to 31. Further improvement is needed, however, and the national HIV profi-
ciency testing system seems to be an important tool in this regard, which should be contin-
ued and needs to be urgently strengthened.
BackgroundHIV/AIDS is still one of the world’s most devastating pandemics, with sub-Sahara Africa themost affected region [1,2]. HIV testing remains a critical entry point for prevention, treatmentand care. Since the mid 1980’s when an accurate and reliable antibody test became available,HIV testing has been offered mainly through client-initiated voluntary counseling and testing(VCT) services [3,4]. Uptake has been very low despite high willingness to be tested [5,6] andstigma has been identified as one of the strongest barriers to VCT [7]. As antiretroviral treat-ment (ART) became available in low-income settings, Provider Initiated Testing and Counsel-ing (PITC) or Routine opt-out Testing and Counseling (RTC) has been recommended to beimplemented in countries with generalized epidemics. Despite a steady increase in test ratesover the years [8,9], uptake is still unacceptably low and distributed in an inequitable way [10].
To meet the increasing need for HIV testing, testing methods have shifted from sophisti-cated techniques such as enzyme linked immunosorbent assays (ELISAs), which are usuallyperformed in a traditional laboratory by highly trained laboratory professionals, to rapid tests(RTs) [11,12]. RTs are simple to perform, are accurate, give results without the need for labora-tory equipment and have allowed provision of test results and post-test counseling in a singlevisit [13–16]. This has allowed non-laboratory personnel such as lay counselors and nurses toperform HIV tests [11–13], thus in keeping with the WHO recommendation of task-shifting ofHIV testing services [17,18]. Concerns have been raised, however, on the effects of this expan-sion on quality of testing and accuracy of test results [12,13]. Given the high volume of testing,even a small error rate can result in a high number of misdiagnosed cases. For example a 5%error rate in testing 2 million people could result in 100,000 erroneous diagnoses. This calls forcoherent quality assurance (QA) systems to regulate and monitor performance of HIV testing[11,12,19].
Countries such as Uganda, Zimbabwe, China and India have reported the establishment ofnational QA programs through national reference laboratories (NRLs). These programs assessquality of testing and ensure accuracy and reliability of test results [11,20–22]. QA monitors allaspects of the testing process (pre-analytic, analytic and post-analytic) and is implemented inmainly two ways: 1) Internal Quality Control (IQC) and 2) External Quality Assessment(EQA). IQC is used to evaluate and ensure that the test precision is optimal, while EQA pro-vides additional external checks to the testing process [23–25]. EQA is usually implementedthrough a combination of 3 approaches: 1) Re-testing 2) Site supervisory visits (SSV) 3) Profi-ciency testing (PT). Due to the huge volume of testing required, re-testing has proved to be nei-ther practical nor achievable where human and financial resources are limited [12]. SSVs,which involve an on-site review of all aspects of the quality system, require a large pool oftrained personnel to conduct costly visits. PT, a generally effective EQA approach [12,25], is atool where simulated specimens issued by the NRL are tested by participating HIV testing sitesand individual site performance is assessed by comparison to the NRL expected results and
Accuracy in HIV Rapid Testing in Zambia
PLOS ONE | DOI:10.1371/journal.pone.0146700 January 8, 2016 2 / 15
the Zambia National Quality Assurance Program(ZANQAP). The funders of this study had no role inthe study design, data collection and analysis,decision to publish or preparation of the manuscript.
Competing Interests: The authors have declaredthat no competing interests exist.
collective performance of all participants [26]. PT establishes the degree of accuracy of testresults, evaluates technical competence and identifies staff training needs [13,19,27].
Though HIV RTs are simple to perform, inadequate training and experience of test per-formers may present a limitation to achieving accurate diagnostic testing [11,14,19]. Test kitmanufacturer’s instructions often only illustrate examples of clear-cut results along withstrong-intensity test and control lines. Thus operators without in-depth training and experi-ence may have difficulties in interpreting weakly reactive results, or in understanding andresolving indeterminate (inconclusive or discrepant) [14,19] or invalid (un-interpretable)results. Some studies have suggested that difficulties of this nature may occur more amongnon-laboratory personnel if not properly trained [28,29]. Comprehensive hands-on trainingand on-going performance monitoring has been suggested to be essential for all test performers[12,14,30]. In addition to training, other factors such as adherence to testing procedures, policydevelopment, test kit availability, supervision, skilled human resource availability and workloadneed to be addressed to ensure quality of testing and the successful expansion of the service[11].
Adult HIV prevalence in Zambia has been estimated at 13.5% [2]. An overall decline in HIVincidence has been observed since the mid-1990s but with marked geographical differences[31,32,33] and has been positively associated with education attainment [34,35]. HIV testingservices have been available in Zambia since the late 1980s and with a country-wide scale up ofVCT from 1998. In recent years, VCT services have expanded from about 650 sites in 2006 toabout 1689 sites in 2010 [36]. With this expansion, a sharp rise in reporting ever tested for HIVhas been observed [37,38]. The Ministry of Health (MOH) and its collaborating partners pro-vide HIV rapid testing training to prospective testers of various professional backgrounds [39].Through the University Teaching Hospital Virology Laboratory (UTHVL), the NRL, the MOHestablished the Zambia National Quality Assurance Program (ZANQAP) in 2009, with the aimof monitoring the performance of HIV testing across the country. PT and SSVs are the twomain EQA approaches being practiced [40]. Despite the rapid scale up of HIV testing servicesin high HIV prevalence countries, documentations in the literature assessing accuracy of testresults are few. The aim of this study was to assess the overall level of accuracy in HIV rapidtesting in Zambia and variation by different groups of testing personnel and to examine factorsthat are associated with accuracy.
Methods
Site selection and participationThe data stem from two annual national PT exercises that were conducted in 2009 and 2010 inselected rural and urban HIV testing sites across the nine provinces of Zambia. The first PTcycle (PT1) in 2009 targeted as many sites as could possibly be reached. Officials from the pro-vincial and district health offices assisted in the identification of HIV testing sites for participa-tion. In 2010 (PT2), MOH partners that technically and financially support various sites acrossthe country were involved in site selection. The sites were selected to represent all types andlevels of facilities in the country. The sites included those in public health facilities (referral hos-pitals, provincial hospitals, district hospitals, military hospitals, mine hospitals, health centresand health posts), mission hospitals and private hospitals/clinics (stand alone, company orproject). The number of targeted sites in PT1 was 550 and was increased to 680 in PT2.
Proficiency testingThe current HIV PT implemented involves the use of dried tube specimens (DTS), which hasbeen adopted to overcome the rigorous storage and transportation conditions required with
Accuracy in HIV Rapid Testing in Zambia
PLOS ONE | DOI:10.1371/journal.pone.0146700 January 8, 2016 3 / 15
the use of liquid serum and plasma specimens for such an exercise. DTS are safe, easy to gener-ate, are stable for at least one month within a broad temperature range during storage andtransport and hence do not require cold chain maintenance. In both PT rounds, commerciallysourced serum panels (ZeptoMetrix, Buffalo NY) of known HIV status were conditioned at theNRL into DTS using the protocol developed by Parekh et al [41], briefly as follows: 20ul ofserum pre-mixed with 0.1% (v/v) green dye were transferred into 2ml microcentrifuge tubes.The tubes were left open to dry overnight at room temperature in a laminar flow hood. Thenext day the tubes were recapped in readiness for packaging and distribution to sites. Oncedried, the DTS are rehydrated (reconstituted) with PT buffer [12,21,41].
For each PT, the PT panel consisted of five blinded DTS specimens (two negative and threepositive including one weakly positive). After re-testing of the DTS for quality control i.e. test-ing of 10% of the specimens by different testers for consistency, PT packages for each site wereprepared. Each PT package included the five DTS, one 1.5ml vial of PT buffer, a transferpipette, instructions for reconstitution and reporting of results and a self-administered ques-tionnaire to capture demographic and HIV rapid testing information of the sites [12,41].
Distribution of the PT packages to the sites and return of results to the NRL was done bythe district health offices in PT1 and by the national courier service and MOH partners in PT2.The sites were instructed to reconstitute the DTS upon receipt and to test them in the sameway they test routine client samples, following the national HIV rapid testing algorithm. TheZambia national HIV rapid testing algorithm is based on serial testing, which specifies the useof two rapid antibody assays, Determine1 HIV-1/2 (Abbott Laboratories, Abbott Park, IL) as ascreening test and if reactive, Uni-Gold™HIV (Trinity Biotech Plc, Wicklow, Ireland) as a con-firmatory test. At the time of the PT exercises, the testing algorithm included a third test, SDBioline HIV-1/2 (Standard diagnostics Inc., Kyonggi-do, Korea) as a tie-breaker [25]. One tes-ter tested the DTS per site. The sites were instructed to complete testing, report and send resultstogether with the filled in questionnaire to the NRL within 1 month of receipt of the PT panels.Performance reports were compiled and sent to the individual sites. Results for all the siteswere compiled to give the overall accuracy level for each PT cycle. Supervisory visits to sitesthat scored less than 100% were made by the NRL technical team in both PT1 and PT2. Thesites were assessed e.g. for availability of test kits and proper test performance and receivedtechnical assistance on testing.
Data analysisData was entered using EpiData 3.1 and MS excel 2007 and analyzed using IBM SPSS version20 for windows for overall and trends analysis.
Tester profession was categorized into four groups as: lay counselors, nurses, laboratory per-sonnel (scientists, technologists and assistants) and others (microscopists, EnvironmentalHealth Technologists, clinical officers and doctors). Responses to having received HIV rapidtesting training was categorized into four groups as seen in Table 1. HIV testing work experi-ence was dichotomized as ‘less’ or ‘more’ than one year. The number of staff performing HIVtesting at a site was categorized into three groups as 0–5, 6–10 and 11 or more. Responses to ifIQC is performed at the site was dichotomized as ‘yes’ and ‘no’. Adherence to the national HIVtesting algorithm during the PT cycles was dichotomized as ‘yes’ and ‘no’.
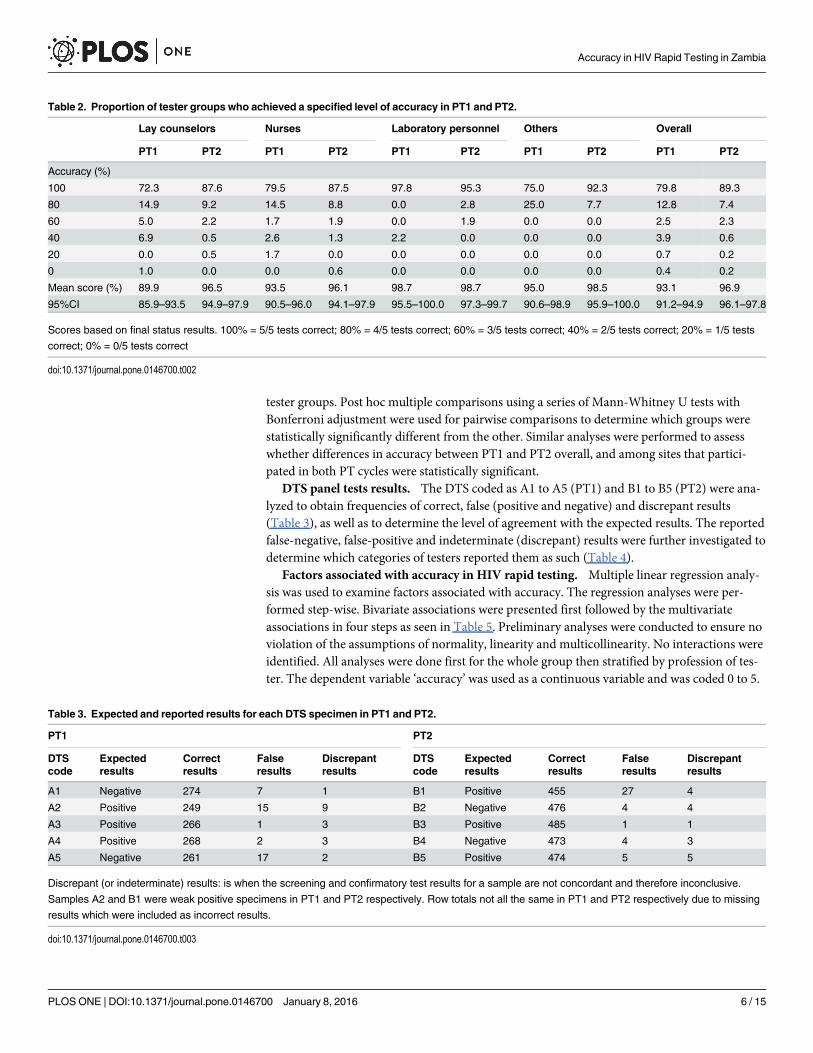
Assessing level of accuracy. Accuracy was expressed as a percent score for each tester/site,tester group and each PT [42] (Table 2). Accuracy ranged from 0% (no specimen correctlyidentified) to 100% (all five specimens correctly identified) for each PT. Mean scores were cal-culated and reported with 95% confidence intervals (CIs). The Kruskal-Wallis one-way analy-sis of variance (ANOVA) by ranks test was used to assess differences in accuracy between the
Accuracy in HIV Rapid Testing in Zambia
PLOS ONE | DOI:10.1371/journal.pone.0146700 January 8, 2016 4 / 15
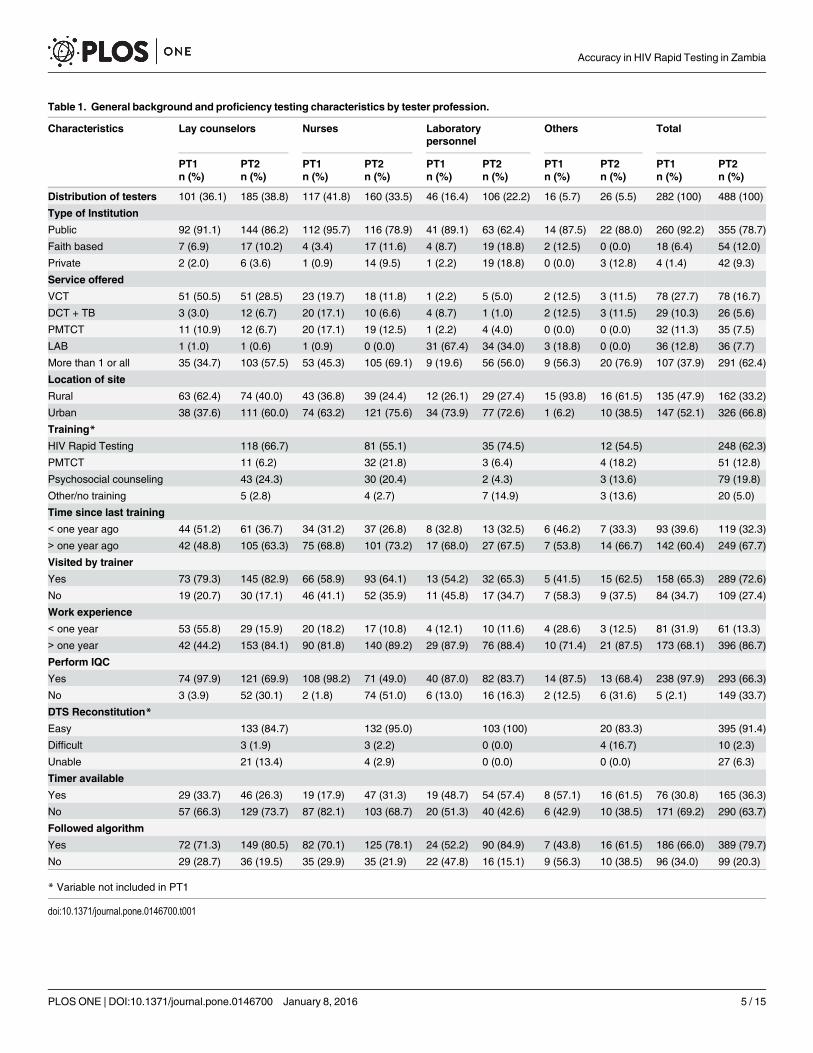
Table 1. General background and proficiency testing characteristics by tester profession.
Characteristics Lay counselors Nurses Laboratorypersonnel
Others Total
PT1 PT2 PT1 PT2 PT1 PT2 PT1 PT2 PT1 PT2n (%) n (%) n (%) n (%) n (%) n (%) n (%) n (%) n (%) n (%)
Distribution of testers 101 (36.1) 185 (38.8) 117 (41.8) 160 (33.5) 46 (16.4) 106 (22.2) 16 (5.7) 26 (5.5) 282 (100) 488 (100)
Type of Institution
Public 92 (91.1) 144 (86.2) 112 (95.7) 116 (78.9) 41 (89.1) 63 (62.4) 14 (87.5) 22 (88.0) 260 (92.2) 355 (78.7)
Faith based 7 (6.9) 17 (10.2) 4 (3.4) 17 (11.6) 4 (8.7) 19 (18.8) 2 (12.5) 0 (0.0) 18 (6.4) 54 (12.0)
Private 2 (2.0) 6 (3.6) 1 (0.9) 14 (9.5) 1 (2.2) 19 (18.8) 0 (0.0) 3 (12.8) 4 (1.4) 42 (9.3)
Service offered
VCT 51 (50.5) 51 (28.5) 23 (19.7) 18 (11.8) 1 (2.2) 5 (5.0) 2 (12.5) 3 (11.5) 78 (27.7) 78 (16.7)
DCT + TB 3 (3.0) 12 (6.7) 20 (17.1) 10 (6.6) 4 (8.7) 1 (1.0) 2 (12.5) 3 (11.5) 29 (10.3) 26 (5.6)
PMTCT 11 (10.9) 12 (6.7) 20 (17.1) 19 (12.5) 1 (2.2) 4 (4.0) 0 (0.0) 0 (0.0) 32 (11.3) 35 (7.5)
LAB 1 (1.0) 1 (0.6) 1 (0.9) 0 (0.0) 31 (67.4) 34 (34.0) 3 (18.8) 0 (0.0) 36 (12.8) 36 (7.7)
More than 1 or all 35 (34.7) 103 (57.5) 53 (45.3) 105 (69.1) 9 (19.6) 56 (56.0) 9 (56.3) 20 (76.9) 107 (37.9) 291 (62.4)
Location of site
Rural 63 (62.4) 74 (40.0) 43 (36.8) 39 (24.4) 12 (26.1) 29 (27.4) 15 (93.8) 16 (61.5) 135 (47.9) 162 (33.2)
Urban 38 (37.6) 111 (60.0) 74 (63.2) 121 (75.6) 34 (73.9) 77 (72.6) 1 (6.2) 10 (38.5) 147 (52.1) 326 (66.8)
Training*
HIV Rapid Testing 118 (66.7) 81 (55.1) 35 (74.5) 12 (54.5) 248 (62.3)
PMTCT 11 (6.2) 32 (21.8) 3 (6.4) 4 (18.2) 51 (12.8)
Psychosocial counseling 43 (24.3) 30 (20.4) 2 (4.3) 3 (13.6) 79 (19.8)
Other/no training 5 (2.8) 4 (2.7) 7 (14.9) 3 (13.6) 20 (5.0)
Time since last training
< one year ago 44 (51.2) 61 (36.7) 34 (31.2) 37 (26.8) 8 (32.8) 13 (32.5) 6 (46.2) 7 (33.3) 93 (39.6) 119 (32.3)
> one year ago 42 (48.8) 105 (63.3) 75 (68.8) 101 (73.2) 17 (68.0) 27 (67.5) 7 (53.8) 14 (66.7) 142 (60.4) 249 (67.7)
Visited by trainer
Yes 73 (79.3) 145 (82.9) 66 (58.9) 93 (64.1) 13 (54.2) 32 (65.3) 5 (41.5) 15 (62.5) 158 (65.3) 289 (72.6)
No 19 (20.7) 30 (17.1) 46 (41.1) 52 (35.9) 11 (45.8) 17 (34.7) 7 (58.3) 9 (37.5) 84 (34.7) 109 (27.4)
Work experience
< one year 53 (55.8) 29 (15.9) 20 (18.2) 17 (10.8) 4 (12.1) 10 (11.6) 4 (28.6) 3 (12.5) 81 (31.9) 61 (13.3)
> one year 42 (44.2) 153 (84.1) 90 (81.8) 140 (89.2) 29 (87.9) 76 (88.4) 10 (71.4) 21 (87.5) 173 (68.1) 396 (86.7)
Perform IQC
Yes 74 (97.9) 121 (69.9) 108 (98.2) 71 (49.0) 40 (87.0) 82 (83.7) 14 (87.5) 13 (68.4) 238 (97.9) 293 (66.3)
No 3 (3.9) 52 (30.1) 2 (1.8) 74 (51.0) 6 (13.0) 16 (16.3) 2 (12.5) 6 (31.6) 5 (2.1) 149 (33.7)
DTS Reconstitution*
Easy 133 (84.7) 132 (95.0) 103 (100) 20 (83.3) 395 (91.4)
Difficult 3 (1.9) 3 (2.2) 0 (0.0) 4 (16.7) 10 (2.3)
Unable 21 (13.4) 4 (2.9) 0 (0.0) 0 (0.0) 27 (6.3)
Timer available
Yes 29 (33.7) 46 (26.3) 19 (17.9) 47 (31.3) 19 (48.7) 54 (57.4) 8 (57.1) 16 (61.5) 76 (30.8) 165 (36.3)
No 57 (66.3) 129 (73.7) 87 (82.1) 103 (68.7) 20 (51.3) 40 (42.6) 6 (42.9) 10 (38.5) 171 (69.2) 290 (63.7)
Followed algorithm
Yes 72 (71.3) 149 (80.5) 82 (70.1) 125 (78.1) 24 (52.2) 90 (84.9) 7 (43.8) 16 (61.5) 186 (66.0) 389 (79.7)
No 29 (28.7) 36 (19.5) 35 (29.9) 35 (21.9) 22 (47.8) 16 (15.1) 9 (56.3) 10 (38.5) 96 (34.0) 99 (20.3)
* Variable not included in PT1
doi:10.1371/journal.pone.0146700.t001
Accuracy in HIV Rapid Testing in Zambia
PLOS ONE | DOI:10.1371/journal.pone.0146700 January 8, 2016 5 / 15
tester groups. Post hoc multiple comparisons using a series of Mann-Whitney U tests withBonferroni adjustment were used for pairwise comparisons to determine which groups werestatistically significantly different from the other. Similar analyses were performed to assesswhether differences in accuracy between PT1 and PT2 overall, and among sites that partici-pated in both PT cycles were statistically significant.
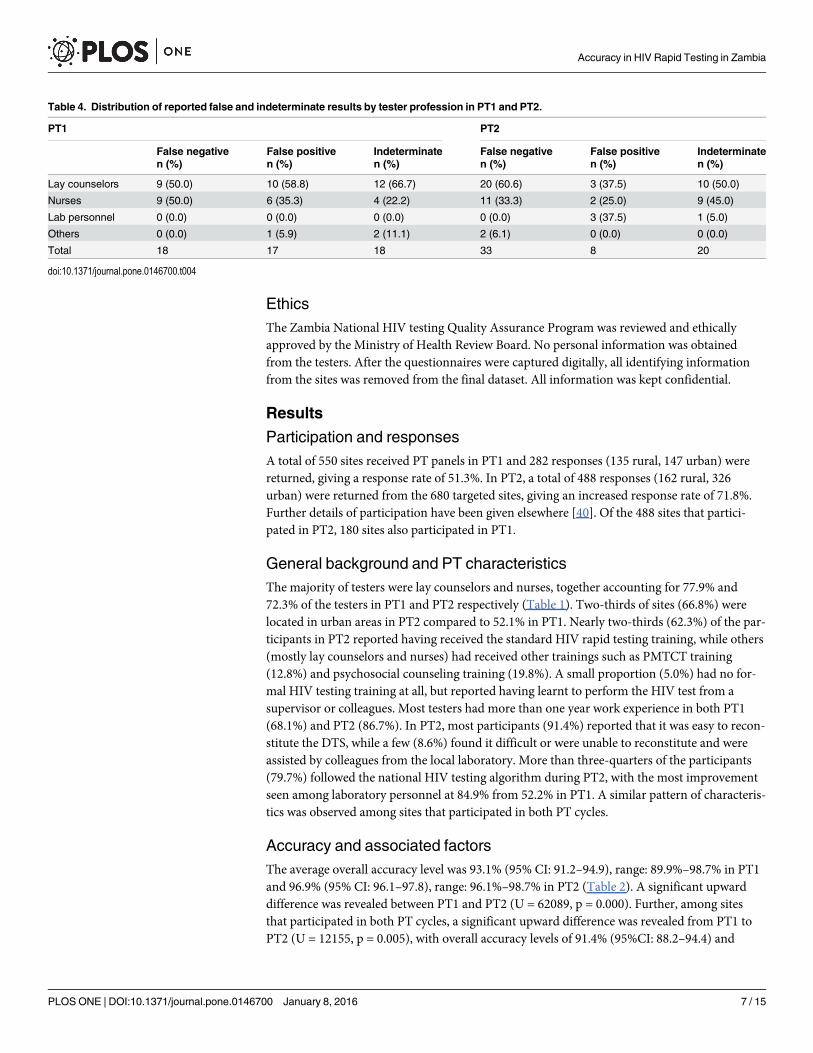
DTS panel tests results. The DTS coded as A1 to A5 (PT1) and B1 to B5 (PT2) were ana-lyzed to obtain frequencies of correct, false (positive and negative) and discrepant results(Table 3), as well as to determine the level of agreement with the expected results. The reportedfalse-negative, false-positive and indeterminate (discrepant) results were further investigated todetermine which categories of testers reported them as such (Table 4).
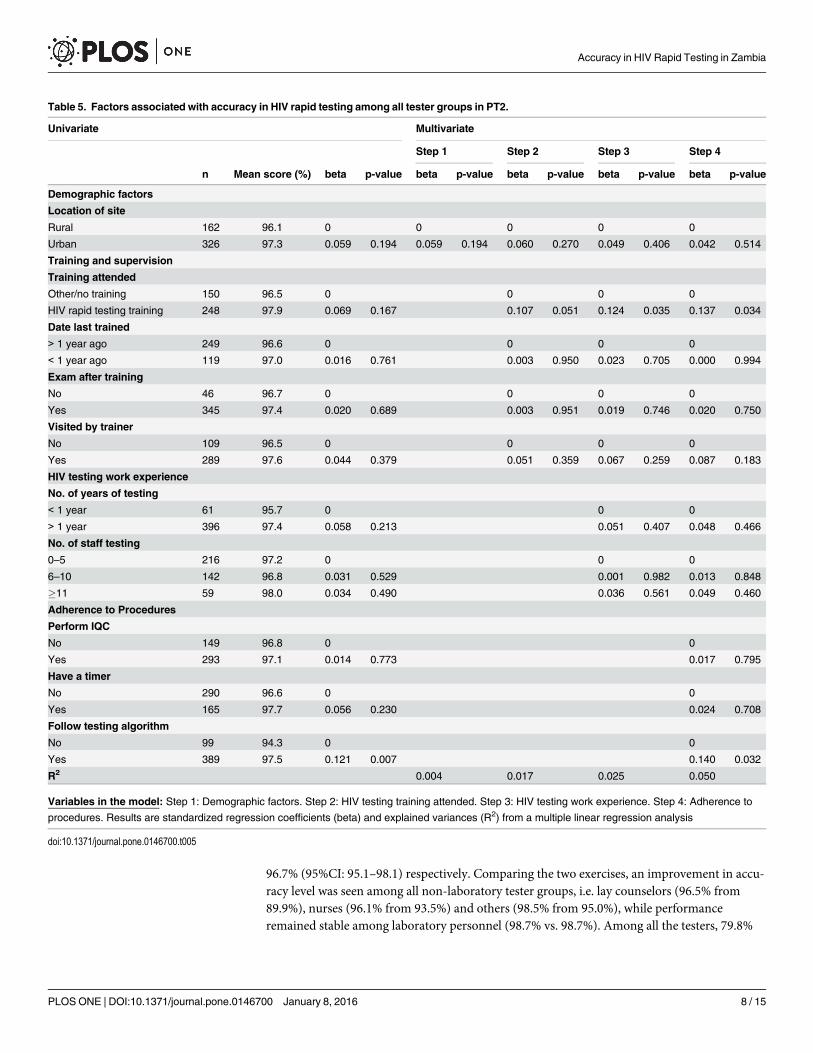
Factors associated with accuracy in HIV rapid testing. Multiple linear regression analy-sis was used to examine factors associated with accuracy. The regression analyses were per-formed step-wise. Bivariate associations were presented first followed by the multivariateassociations in four steps as seen in Table 5. Preliminary analyses were conducted to ensure noviolation of the assumptions of normality, linearity and multicollinearity. No interactions wereidentified. All analyses were done first for the whole group then stratified by profession of tes-ter. The dependent variable ‘accuracy’ was used as a continuous variable and was coded 0 to 5.
Table 2. Proportion of tester groups who achieved a specified level of accuracy in PT1 and PT2.
Lay counselors Nurses Laboratory personnel Others Overall
PT1 PT2 PT1 PT2 PT1 PT2 PT1 PT2 PT1 PT2
Accuracy (%)
100 72.3 87.6 79.5 87.5 97.8 95.3 75.0 92.3 79.8 89.3
80 14.9 9.2 14.5 8.8 0.0 2.8 25.0 7.7 12.8 7.4
60 5.0 2.2 1.7 1.9 0.0 1.9 0.0 0.0 2.5 2.3
40 6.9 0.5 2.6 1.3 2.2 0.0 0.0 0.0 3.9 0.6
20 0.0 0.5 1.7 0.0 0.0 0.0 0.0 0.0 0.7 0.2
0 1.0 0.0 0.0 0.6 0.0 0.0 0.0 0.0 0.4 0.2
Mean score (%) 89.9 96.5 93.5 96.1 98.7 98.7 95.0 98.5 93.1 96.9
95%CI 85.9–93.5 94.9–97.9 90.5–96.0 94.1–97.9 95.5–100.0 97.3–99.7 90.6–98.9 95.9–100.0 91.2–94.9 96.1–97.8
Scores based on final status results. 100% = 5/5 tests correct; 80% = 4/5 tests correct; 60% = 3/5 tests correct; 40% = 2/5 tests correct; 20% = 1/5 tests
correct; 0% = 0/5 tests correct
doi:10.1371/journal.pone.0146700.t002
Table 3. Expected and reported results for each DTS specimen in PT1 and PT2.
PT1 PT2
DTScode
Expectedresults
Correctresults
Falseresults
Discrepantresults
DTScode
Expectedresults
Correctresults
Falseresults
Discrepantresults
A1 Negative 274 7 1 B1 Positive 455 27 4
A2 Positive 249 15 9 B2 Negative 476 4 4
A3 Positive 266 1 3 B3 Positive 485 1 1
A4 Positive 268 2 3 B4 Negative 473 4 3
A5 Negative 261 17 2 B5 Positive 474 5 5
Discrepant (or indeterminate) results: is when the screening and confirmatory test results for a sample are not concordant and therefore inconclusive.
Samples A2 and B1 were weak positive specimens in PT1 and PT2 respectively. Row totals not all the same in PT1 and PT2 respectively due to missing
results which were included as incorrect results.
doi:10.1371/journal.pone.0146700.t003
Accuracy in HIV Rapid Testing in Zambia
PLOS ONE | DOI:10.1371/journal.pone.0146700 January 8, 2016 6 / 15
EthicsThe Zambia National HIV testing Quality Assurance Program was reviewed and ethicallyapproved by the Ministry of Health Review Board. No personal information was obtainedfrom the testers. After the questionnaires were captured digitally, all identifying informationfrom the sites was removed from the final dataset. All information was kept confidential.
Results
Participation and responsesA total of 550 sites received PT panels in PT1 and 282 responses (135 rural, 147 urban) werereturned, giving a response rate of 51.3%. In PT2, a total of 488 responses (162 rural, 326urban) were returned from the 680 targeted sites, giving an increased response rate of 71.8%.Further details of participation have been given elsewhere [40]. Of the 488 sites that partici-pated in PT2, 180 sites also participated in PT1.
General background and PT characteristicsThe majority of testers were lay counselors and nurses, together accounting for 77.9% and72.3% of the testers in PT1 and PT2 respectively (Table 1). Two-thirds of sites (66.8%) werelocated in urban areas in PT2 compared to 52.1% in PT1. Nearly two-thirds (62.3%) of the par-ticipants in PT2 reported having received the standard HIV rapid testing training, while others(mostly lay counselors and nurses) had received other trainings such as PMTCT training(12.8%) and psychosocial counseling training (19.8%). A small proportion (5.0%) had no for-mal HIV testing training at all, but reported having learnt to perform the HIV test from asupervisor or colleagues. Most testers had more than one year work experience in both PT1(68.1%) and PT2 (86.7%). In PT2, most participants (91.4%) reported that it was easy to recon-stitute the DTS, while a few (8.6%) found it difficult or were unable to reconstitute and wereassisted by colleagues from the local laboratory. More than three-quarters of the participants(79.7%) followed the national HIV testing algorithm during PT2, with the most improvementseen among laboratory personnel at 84.9% from 52.2% in PT1. A similar pattern of characteris-tics was observed among sites that participated in both PT cycles.
Accuracy and associated factorsThe average overall accuracy level was 93.1% (95% CI: 91.2–94.9), range: 89.9%–98.7% in PT1and 96.9% (95% CI: 96.1–97.8), range: 96.1%–98.7% in PT2 (Table 2). A significant upwarddifference was revealed between PT1 and PT2 (U = 62089, p = 0.000). Further, among sitesthat participated in both PT cycles, a significant upward difference was revealed from PT1 toPT2 (U = 12155, p = 0.005), with overall accuracy levels of 91.4% (95%CI: 88.2–94.4) and
Table 4. Distribution of reported false and indeterminate results by tester profession in PT1 and PT2.
PT1 PT2
False negative False positive Indeterminate False negative False positive Indeterminaten (%) n (%) n (%) n (%) n (%) n (%)
Lay counselors 9 (50.0) 10 (58.8) 12 (66.7) 20 (60.6) 3 (37.5) 10 (50.0)
Nurses 9 (50.0) 6 (35.3) 4 (22.2) 11 (33.3) 2 (25.0) 9 (45.0)
Lab personnel 0 (0.0) 0 (0.0) 0 (0.0) 0 (0.0) 3 (37.5) 1 (5.0)
Others 0 (0.0) 1 (5.9) 2 (11.1) 2 (6.1) 0 (0.0) 0 (0.0)
Total 18 17 18 33 8 20
doi:10.1371/journal.pone.0146700.t004
Accuracy in HIV Rapid Testing in Zambia
PLOS ONE | DOI:10.1371/journal.pone.0146700 January 8, 2016 7 / 15
96.7% (95%CI: 95.1–98.1) respectively. Comparing the two exercises, an improvement in accu-racy level was seen among all non-laboratory tester groups, i.e. lay counselors (96.5% from89.9%), nurses (96.1% from 93.5%) and others (98.5% from 95.0%), while performanceremained stable among laboratory personnel (98.7% vs. 98.7%). Among all the testers, 79.8%
Table 5. Factors associated with accuracy in HIV rapid testing among all tester groups in PT2.
Univariate Multivariate
Step 1 Step 2 Step 3 Step 4
n Mean score (%) beta p-value beta p-value beta p-value beta p-value beta p-value
Demographic factors
Location of site
Rural 162 96.1 0 0 0 0 0
Urban 326 97.3 0.059 0.194 0.059 0.194 0.060 0.270 0.049 0.406 0.042 0.514
Training and supervision
Training attended
Other/no training 150 96.5 0 0 0 0
HIV rapid testing training 248 97.9 0.069 0.167 0.107 0.051 0.124 0.035 0.137 0.034
Date last trained
> 1 year ago 249 96.6 0 0 0 0
< 1 year ago 119 97.0 0.016 0.761 0.003 0.950 0.023 0.705 0.000 0.994
Exam after training
No 46 96.7 0 0 0 0
Yes 345 97.4 0.020 0.689 0.003 0.951 0.019 0.746 0.020 0.750
Visited by trainer
No 109 96.5 0 0 0 0
Yes 289 97.6 0.044 0.379 0.051 0.359 0.067 0.259 0.087 0.183
HIV testing work experience
No. of years of testing
< 1 year 61 95.7 0 0 0
> 1 year 396 97.4 0.058 0.213 0.051 0.407 0.048 0.466
No. of staff testing
0–5 216 97.2 0 0 0
6–10 142 96.8 0.031 0.529 0.001 0.982 0.013 0.848
�11 59 98.0 0.034 0.490 0.036 0.561 0.049 0.460
Adherence to Procedures
Perform IQC
No 149 96.8 0 0
Yes 293 97.1 0.014 0.773 0.017 0.795
Have a timer
No 290 96.6 0 0
Yes 165 97.7 0.056 0.230 0.024 0.708
Follow testing algorithm
No 99 94.3 0 0
Yes 389 97.5 0.121 0.007 0.140 0.032
R2 0.004 0.017 0.025 0.050
Variables in the model: Step 1: Demographic factors. Step 2: HIV testing training attended. Step 3: HIV testing work experience. Step 4: Adherence to
procedures. Results are standardized regression coefficients (beta) and explained variances (R2) from a multiple linear regression analysis
doi:10.1371/journal.pone.0146700.t005
Accuracy in HIV Rapid Testing in Zambia
PLOS ONE | DOI:10.1371/journal.pone.0146700 January 8, 2016 8 / 15
and 89.3% attained 100% accuracy scores in PT1 and PT2 respectively, with laboratory person-nel obtaining the highest scores in both PT cycles.
A statistical difference in accuracy at p<0.05 level was revealed across the tester groups (χ2 =12.75, p = 0.005) in PT1. Pairwise comparisons revealed a statistical difference in accuracybetween lay counselors and laboratory personnel (U = 1739, p = 0.000); nurses and laboratorypersonnel (U = 2206, p = 0.004); and laboratory personnel and others (U = 286, p = 0.005). Therewas no statistical difference in accuracy between lay counselors and nurses (U = 5433, p = 0.170);lay counselors and others (U = 760, p = 0.626); or nurses and others (U = 908, p = 0.785). Therewas no statistical difference in accuracy across the tester groups (χ2 = 5.38, p = 0.146) in PT2.
Of the 1410 results in PT1 and 2440 results in PT2, 1318 (93.4%) in PT1 and 2362 (96.8%)in PT2 were in agreement with expected results. Of all the false-negative results, 15 and 27were reported for the weak positive specimens in PT1 and PT2 respectively (Table 3). False-negative results were reported mostly by lay counselors and nurses in both PT1 and PT2.False-positive and indeterminate results were reported by lay counselors and nurses in bothPT1 and PT2, by others only in PT1 and by laboratory personnel only in PT2 (Table 4).
Accuracy did not differ statistically by location of the test site (Table 5). The single mostimportant indicator of accuracy was “following the national HIV testing algorithm”, p = 0.032.Having received the standard HIV rapid testing training was also found to somewhat increaseaccuracy compared to other training options. None of the other indicators were significantlyassociated with accuracy. Stratification by tester group revealed a similar pattern of associationsacross all tester groups. The explained variance (R2) was generally low.
DiscussionThe majority of the testers were lay counselors and nurses in both PT rounds. The overall accu-racy level was 93.1% and 96.9% (p = 0.000) in 2009 and 2010 respectively. Further, among sitesthat participated in both PT cycles, accuracy level was 91.4% and 96.7% (p = 0.005) in PT1 andPT2 respectively. Differences in accuracy were seen between tester groups in 2009, with labora-tory personnel being more accurate than lay counselors, nurses and others (p = 0.005), while in2010, no statistically significant differences were seen. Supposing that the 2010 results representthe national accuracy level and that at least 3 million tests were performed [43], nearly 100,000individuals would have received an incorrect HIV test result. The seemingly small error ratetherefore has substantial implications for many individuals. Having received the standard HIVrapid testing training and adherence to the national HIV testing algorithm were positivelyassociated with testers’ accuracy.
Lay counselors and nurses together constituted the largest group of testers, indicating arapid implementation of task-shifting in HIV testing services [44] and hence a need to concen-trate efforts in these groups to ensure higher levels of accuracy. In the first round, laboratorypersonnel were substantially more accurate than the non-laboratory personnel. However, nosignificant variation in accuracy between the tester groups was seen in the second round due toa great improvement among all non-laboratory tester groups and particularly among lay coun-selors. We see this as an indication that there is a great potential for these groups to attainhigher accuracy levels and perform testing as well as laboratory personnel. One possible expla-nation as previously suggested is that lay counselors may be more receptive to learning newprocedures that are outside their routine occupations [11]. Although laboratory personnelshowed a stable performance in both PT cycles, there is a need for continuous training toimprove competencies [12,25]. Though a specimen reconstitution step that is not normallyrequired in routine testing was introduced, the fact that it was found to be easy by nearly all thetesters showed that they were comfortable with DTS as PT material for EQA [12].
Accuracy in HIV Rapid Testing in Zambia
PLOS ONE | DOI:10.1371/journal.pone.0146700 January 8, 2016 9 / 15
A significant improvement in performance was revealed from PT1 to PT2 overall, andamong sites that participated in both PT cycles. Coupled with the individual tester groupresults, these findings suggest that PT implementation has a positive impact on performance.Possible reasons for this improvement could have been the site supervisory visits (SSVs) by theNRL experts [45], as well as improved adherence to testing procedures, which could be directlylinked to increased training. These findings suggest the need for EQA programs in collabora-tion with their MOHs to prioritize investment in SSVs as well as training of testers, regardlessof setting or profession, for enhanced performance.
Our study revealed some difficulties in interpretation of results in both PT rounds, with theoccurrence of false-negative, false-positive and indeterminate interpretations. The problemstended to occur more among lay counselors and nurses than laboratory personnel and others.According to the national HIV testing algorithm, specimens that give discrepant resultsbetween the screening and confirmatory tests should be subjected to the tie-breaker test. Onthe other hand, specimens that test negative on the screening test are not tested further, thusfalse-negative interpretations are not defined in the testing algorithm. The occurrence of false-negative interpretations was of concern, and highlights the need to further investigate the abil-ity of testers to correctly interpret test results and the potential need for further training [19].We cannot exclude the possibility that the occurrence of false-positives could have arisen fromcross-contamination due to poor handling techniques during the processing of the DTS, i.e. atthe point of reconstitution since only one transfer pipette was provided per PT package, or atthe point of testing. These findings support previous publications suggesting that even thoughHIV rapid tests may be easy to perform, they may be fraught with difficulties in interpretationof results particularly if testers have limited training and experience [14,19]. Further, our find-ings confirm previous observations that non-laboratory personnel may have more difficultiesof this kind [28,29]. Based on our findings, a review of the current training and the develop-ment of a curriculum that is tailor-made to profession of testers may be helpful. The trainingduration could be increased to include more practical sessions. A previous home based VCTstudy in rural Zambia found that with more comprehensive training and hands-on practicalexperience, lay counselors were able to perform testing proficiently and achieved a 100% accu-racy score during a PT exercise [10].
We assumed that the level or type of training would affect testing accuracy [14,19]. Ourresults revealed accuracy to be associated only with exposure to HIV rapid testing training as afocused training, as compared to having received other trainings. The standard national HIVrapid testing training is a three-day training focused on principles of HIV rapid testing andpractical sessions for hands-on experience [12,39]. Other training programs have various com-ponents included in their training curricula, with some components such as counseling beingmore emphasized than testing [40]. Our findings suggest offering all testers the standard HIVrapid testing training, regardless of any other training they may have previously received. Inaddition, reports that were given by the testers during the PT exercises revealed a multiplicityof trainers (about 40 organizations) that had provided HIV rapid testing training of varied con-tent and duration ranging from 2 hours to 6 months. This shows the need for the establishmentof a central coordinating body e.g. the NRL or equivalent institution by the MOH to ensuretraining is standard for all testers [12].
In this investigation, having more than one year work experience was not associated withaccuracy, contrary to previous publications [12,19]. Similarly, the data did not support an asso-ciation between accuracy and having more numbers of skilled staff performing HIV testing.Inadequate numbers of skilled staff in a facility could translate into a higher workload for thefew available staff. This has been found to have a negative impact on quality of service, particu-larly in public institutions [46–48]. Many HIV testing facilities report high staff turnover and
Accuracy in HIV Rapid Testing in Zambia
PLOS ONE | DOI:10.1371/journal.pone.0146700 January 8, 2016 10 / 15

attrition, with rural public facilities having the lowest numbers of skilled staff as compared tourban facilities [46,49]. Further, many rural sites are located in remote areas which may pose achallenge to quality service provision with regards to easy access to test kits and reagents, train-ing as well as external supervision, communication and networking with other testing sites atregional or national level [24]. Strategies for staff retention and improved service provisionconditions need to be made a central issue in health policy [46].
Adherence to the national HIV testing algorithm was found to be positively associated withaccuracy. An algorithm involves the use of categories of tests in a particular sequence whichhave been selected and validated through an evaluation process [12,50]. Thus an alteration insequence could have a negative impact on test sensitivity and specificity. Non-adherence to thenational testing algorithm was defined as performing parallel testing, confirmatory testing onspecimens that are non-reactive on the screening test, reporting positive results based on onetest (screening test) or confirming a reactive specimen with the wrong test (tie-breaker).Though parallel testing and confirming non-reactive specimens did not have a negative impacton accuracy, such practices in a serial testing strategy may lead to wastage of test kits andincrease the cost of reagents [12]. However, reporting positive results based on one test andconfirming a reactive specimen with the wrong test were of concern. The reasons for such prac-tices could have been limited training and understanding, or non-availability of confirmatorytest kits.
A global concern on the use of tie-breakers in routine testing has been raised. Tie-breakershave been found to not always resolve the HIV status with accuracy [12]. Some studies havefound that due to antibody cross-reactivity, i.e. the production of antibodies by various foreignantigens and infectious agents that non-specifically cross-react with antigens in the test kits,the use of a tie-breaker has sometimes led to false-positive diagnosis. This has led to individualsbeing wrongly enrolled on ART programs, as well as devastating individual consequences.Some studies have suggested re-testing of individuals already on ART programs, as well assamples testing positive on the tie-breaker with confirmatory tests such as Western blot orPCR. A few studies have also indicated a need for ART and prevention programs to plan forquality assurance in HIV testing [51,52,53]. Other studies however have found high accuracyin HIV testing using an algorithm that includes a tie-breaker [54]. The outcome thus dependson the test kit that is selected to be used as a tie-breaker. In some countries, a blood specimen iscollected from the individual with discordant results and sent to a facility capable of perform-ing further testing to confirm the HIV status. But often, rather than using a tie-breaker, clientsare re-tested after 4 weeks to resolve the HIV status. This approach has been found to be morelikely to provide a correct diagnosis, though clients may not return for follow-up testing.Appropriate counseling may help ensure a return visit [12].
Selection bias might have been one of the possible biases in this study. The sample was not arandom sample of all the sites in the country. However, sites were selected to represent alltypes and levels of facilities in both rural and urban areas, i.e. public, private and mission.Therefore, though only a few sites (30%) of the total 1689 registered sites countrywide werereached by the program by PT2, the findings are likely to reasonably well portray the nationalsituation. However, the selection of rural sites could to some extent have been biased towardsease of access, thereby possibly leaving out those sites most challenged in provision of qualityservice and thus we are likely to have over-estimated rural accuracy. Further, non-participa-tion, which was due to hard-to-reach sites not receiving the PT materials or reporting results tothe NRL on time, might have been another possible source of bias. This type of non-responsemight have also led to over-estimation of accuracy. Non-response was substantially lower inPT2 than in PT1, with the involvement of the national courier and MOH partners in the distri-bution of the PT materials and the return of the results to the NRL for analysis. Therefore
Accuracy in HIV Rapid Testing in Zambia
PLOS ONE | DOI:10.1371/journal.pone.0146700 January 8, 2016 11 / 15
generalization of rural or remote area accuracy may be restricted to the selected sites and fromwhich reports were received. Self-reports of training, experience and adherence to proceduresare subject to recall and reporting biases which might to some extent have diluted the estimatedassociations. PT involves only a few specimens and the test results may not represent routinetest performance. This may partly be due to the greater care that is taken by testers in handlingPT specimens [50]. Further, the person assigned to test the specimens may be the most experi-enced at the site. Accordingly, the direction of these biases would be an over-estimation ofaccuracy, but the magnitude was not possible to estimate.
A particular limitation in this study was that each PT round differs from the previous withthe addition of new sites and mostly with different testers participating due to high staff attri-tion. A more optimal design would have been a cohort design to observe the same testers andsites and measure accuracy over a period of time, thus the impact of quality assurance systems.The use of retrospective data has its limitations in that the data was collected for routine pro-gram purposes and not particularly for this study and therefore we were restricted to the avail-able data. In addition, the areas of missing data for some of the variables could to some extenthave biased the associations. Another limitation is that due to limited resources, PT exercisesare currently conducted in a few sites of the total sites countrywide, and are conducted onlyonce a year thereby limiting coverage and closer monitoring of performance. Possible sugges-tions to reduce some of the limitations may include the use of a decentralized approach in com-bination with the MOH partners and other local organizations that could be trained to run thePT program and provide coverage to sites in specific geographical areas. Provincial referencelaboratories could be set up to oversee and compile data for overall analysis and coordinationby the NRL [12].
ConclusionsThe study showed that there was an improvement in tester groups and overall accuracy level inHIV rapid testing from the first to the second exercise. Further improvement is urgentlyneeded, however, and the national HIV PT system could be an important tool in this regardwhich will need to be strengthened and given higher priority in terms of investment. The find-ings showed that task-shifting in HIV testing services has taken effect in Zambia, with laycounselors and nurses constituting the majority of testers. The type of training testers receivedand adherence to testing procedures appeared critical in achieving higher levels of accuracy. Aregulatory framework for training is needed to ensure central coordination of training that isstandard.
AcknowledgmentsWe would like to acknowledge the Zambia National Quality Assurance Program (ZANQAP)Team at the Virology Laboratory: Goodness Ngwele, Caroline Chisenga, Barbara Mwenecha-nya and Chisenga Musonda. We also acknowledge the Centres for Disease Control and preven-tion (CDC), the Ministry of Health (MOH) and collaborating partners for the logistical andtechnical support to the ZANQAP, and the University Teaching Hospital (UTH) Managementtogether with the UTH HIV/AIDS Program (UTH-HAP) secretariat for providing logisticalsupport.
Author ContributionsConceived and designed the experiments: SM KGMMMKF. Performed the experiments: SMKGMMMKKM. Analyzed the data: SM KGM KF. Wrote the paper: SM KGMMMKKM KF.
Accuracy in HIV Rapid Testing in Zambia
PLOS ONE | DOI:10.1371/journal.pone.0146700 January 8, 2016 12 / 15
References1. Merson MH, O’Malley J, Serwadda D, Apisuk C. The history and challenge of HIV prevention. The lan-
cet. 2007; 372(9637):475–88.
2. UNAIDS. UNAIDS Report on the global AIDS epidemic. Geneva: UNAIDS; 2013.
3. UNAIDS. HIV Voluntary Counseling and Testing: A gateway to prevention and care. UNAIDS BestPractice collection, ed. Geneva: UNAIDS; 2002.
4. WHO, UNAIDS. Policy statement on HIV testing. Geneva: WHO; 2004.
5. Babalola S. Readiness for testing among young people in northern Nigeria: the roles of social norm andperceived stigma. AIDS Behav. 2007; 11(5):759–69. PMID: 17191141
6. Fylkesnes K, Haworth A, Rosensvard C, Kwapa PM. HIV counseling and testing: over-emphasizinghigh acceptance rate a threat in confidentiality and the right to know. AIDS. 1999; 13(17):2469–74.PMID: 10597789
7. Jurgensen M, Tuba M, Fylkesnes K, Blystad A. The burden of knowing: balancing benefits and barriersin HIV testing decisions. A qualitative study from Zambia. BMC Health Serv Res. 2012; 12:2. doi: 10.1186/1472-6963-12-2 PMID: 22222028
8. WHO, UNAIDS. Guidance on provider-initiated HIV testing and counseling in health facilities. Geneva:WHO; 2007.
9. Wanyenze RK, Nawavvu C, Namale AS, Mayanja B, Bunnell R, Abang B, et al. Acceptability of routineHIV counseling and testing and HIV seroprevalence in Ugandan hospitals. Bull World Health Organ.2008; 86(4):302–9. PMID: 18438519
10. Fylkesnes K, Sandoy IF, Jurgensen M, Chipimo PJ, Mwangala S, Michelo C. Strong effects of home-based voluntary HIV counseling and testing on acceptance and equity: a cluster randomized trial inZambia. Soc Sci Med. 2013; 86:9–16. doi: 10.1016/j.socscimed.2013.02.036 PMID: 23608089
11. Yao K, Wafula W, Bile EC, Cheignsong R, Howard S, Demby A, et al. Ensuring the quality of HIV rapidtesting in resource-poor countries using a systematic approach to training. Am J Clin Pathol. 2010; 134(4):568–72. doi: 10.1309/AJCPOPXR8MNTZ5PY PMID: 20855637
12. Parekh BS, Kalou MB, Alemnji G, Ou CY, Gershy-Damet GM, Nkengasong JN. Scaling up HIV rapidtesting in developing countries: comprehensive approach for implementing quality assurance. Am JClin Pathol. 2010; 134(4):573–84. doi: 10.1309/AJCPTDIMFR00IKYX PMID: 20855638
13. Schalla WO, Hearn TL, Taylor RN, Eavenson E, Valdiserri RO, Essien JD. CDC’s model performanceevaluation program: assessment of the quality of laboratory performance for HIV-1 antibody testing.Public Health Rep. 1990; 105(2):167–71. PMID: 2157234
14. Chiu YH, Ong J, Walker S, Kumalawati J, Gartinah T, McPhee DA, et al. Photographed rapid HIV testsresults pilot novel quality assessment and training schemes. PLoS One. 2011; 6(3):e18294. doi: 10.1371/journal.pone.0018294 PMID: 21483842
15. Koblavi-Dème S, Maurice C, Yavo S, Sibailly TS, N’guessan K, Kamelan-Tano Y, et al. Sensitivity andspecificity of HIV rapid serologic assays and testing algorithms in an antenatal clinic in Abidjan, IvoryCoast. J Clin Microbiol. 2001; 39:1808–12. PMID: 11325995
16. WHO. HIV assays: operational characteristics. Report 16. Rapid assays. Geneva: WHO; 2009. Avail-able: http://www.who.int/diagnostics_laboratory/publications/Report16_final.pdf. Accessed 10 Nov2012.
17. WHO. Treat, train, retain: the AIDS and health workforce plan: report on the consultation on AIDS andhuman resources for health. Geneva: WHO; 2006. Available: http://www.who.int/hiv/pub/meetingreports/TTRmeetingreport2.pdf. Accessed 9 Oct 2012.
18. WHO: Task shifting: rational redistribution of tasks among workforce teams: global recommendationsand guidelines. Geneva: WHO; 2008. Available: http://www.who.int/healthsystems/TTR-TaskShifting.pdf. Accessed 12 Oct 2012.
19. Learmonth KM, McPhee DA, Jardine DK, Walker SK, Aye TT, Dax EM. Assessing proficiency of inter-pretation of rapid human immunodeficiency virus assays in nonlaboratory settings: ensuring quality oftesting. J Clin Microbiol. 2008; 46(5):1692–7. doi: 10.1128/JCM.01761-07 PMID: 18353938
20. Zimbabwe Quality Assurance Program (ZINQAP). Harare: ZINQAP; 2012. Available: http://www.zinqap.org.zw. Accessed 15 Nov 2012.
21. Jiang Y, Qiu M, Zhang G, XingW, Xiao Y, Pan P, et al. Quality assurance in the HIV/AIDS laboratorynetwork of China. Int J Epidemiol. 2010; 39(suppl 2):ii72–8. doi: 10.1093/ije/dyq224 PMID: 21113040
22. Sushi KM, Gopal T, Jacob SM, Arumugam G, Durairaj A. External quality assessment scheme in anational reference laboratory for HIV testing in South India. WJA. 2012; 2:222–5.
23. Chang D, Learmonth K, Dax EM. HIV testing in 2006: issues and methods. Expert Rev Anti Infect Ther.2006; 4(4):565–82. PMID: 17009937
Accuracy in HIV Rapid Testing in Zambia
PLOS ONE | DOI:10.1371/journal.pone.0146700 January 8, 2016 13 / 15
24. Alemnji G, Nkengasong JN, Parekh BS. HIV testing in developing countries: What is required? Indian JMed Res. 2011; 134(6):779–86. doi: 10.4103/0971-5916.92625 PMID: 22310813
25. Ministry of Health, Republic of Zambia. National Quality Assurance strategy for HIV counseling andtesting. Lusaka: Ministry of Health; 2007.
26. Stull TM, Hearn TL, Hancock JS, Handsfield JH, Collins CL. Variation in Proficiency testing perfor-mance by testing site. JAMA. 1998; 297(6):463–7.
27. WHO. Guidelines for assuring the accuracy and reliability of HIV rapid testing: applying a quality systemapproach. Geneva: WHO; 2005.
28. Kanal K, Chou TL, Sovann L, Morikawa Y, Mukoyama Y, Kakimoto K. Evaluation of the proficiency oftrained non-laboratory health staffs and laboratory technicians using a rapid and simple HIV antibodytest. AIDS Res Ther. 2005; 2:5. PMID: 15907202
29. Martin R, Hearn TL, Ridderhof JC, Demby A. Implementation of a quality systems approach for labora-tory practice in resource-constrained countries. AIDS. 2005; 19(suppl 2):S59–65. PMID: 15930842
30. WHO,WHO/EHT, UNAIDS. HIV assays: operational characteristics (phase 1). Report 12. Simple/rapidtests, whole blood specimens. Geneva: WHO; 2002. Available: http://www.who.int/diagnostics_laboratory/publications/hiv_assays_rep_12.pdf. Accessed 10 Nov 2012.
31. Sandoy IF, Kvale G, Michelo C, Fylkesnes K. Antenatal clinic-based HIV prevalence in Zambia: declin-ing trends but sharp local contrasts in young women. Trop Med Int Health. 2006; 11(6):917–28. PMID:16772014
32. Kayeyi N, Fylkesnes K, Michelo C, Makasa M, Sandoy I. Decline in HIV prevalence among youngwomen in Zambia: National-level estimates of trends mask geographical and socio-demographic differ-ences. PLoS One. 2012; 7(4):e33652. doi: 10.1371/journal.pone.0033652 PMID: 22496759
33. Makasa M, Fylkesnes K, Michelo C, Kayeyi N, Chirwa B, Sandoy I. Declining syphilis trends in concur-rence with HIV declines among pregnant women in Zambia: observations over 14 years of national sur-veillance. Sex Transm Dis. 2012; 39(3):173–81. doi: 10.1097/OLQ.0b013e31823b23a4 PMID:22337102
34. Michelo C, Sandoy IF, Fylkesnes K. Marked HIV prevalence declines in higher educated young people:evidence from population based surveys (1995–2003) in Zambia. AIDS. 2006; 20:1031–8. PMID:16603856
35. Sandoy IF, Michelo C, Siziya S, Fylkesnes K. Associations between sexual behavior change amongyoung people and decline in HIV prevalence in Zambia. BMC Public Health. 2007; 7:60. PMID:17448256
36. WHO, UNAIDS, UNICEF. Global HIV/AIDS response, epidemic update and health sector progresstowards universal access. Geneva: WHO; 2011.
37. Central Statistical Office (CSO), Ministry of Health (MOH), Tropical Diseases Research Centre(TDRC), University of Zambia (UNZA), Macro International Inc. Zambia Demographic and Health Sur-vey 2007. Calverton, Maryland, USA: CSO and Macro International Inc.; 2009.
38. Central Statistical Office, Ministry Of Health, National HIV/AIDS/STI/TB council, University of Zambia,MEASURE Evaluation. Zambia Sexual Behavior Survey 2009. In. Lusaka: CSO, MOH, NAC, UNZA,MEASURE Evaluation; 2010.
39. Ministry of Health, National HIV/AIDS/STI/TB council. National HIV rapid test training curriculum.Lusaka: Ministry of Health; 2007.
40. Ministry of Health (MOH), Virology Laboratory. 1st proficiency testing trial preliminary draft report.Lusaka: Virology Laboratory; 2009.
41. Parekh B, Anyanwu J, Patel H, Downer M, Kalou M, Gichimu C, et al. Dried tube specimens: A simpleand cost-effective method for preparation of HIV proficiency testing panels and quality control materialsfor use in resource–limited settings. J Virol Methods. 2009; 163:295–300. doi: 10.1016/j.jviromet.2009.10.013 PMID: 19878697
42. UNAIDS. Guidelines for organizing national external quality assessment schemes for HIV serologicaltesting. UNAIDS; 1996.
43. Sikasote J, Chanda S, NichodemusW. Zambia: National Quantification of HIV test kits (2009–2015).Lusaka, Zambia: USAID| Deliver Project; 2008.
44. Sanjana P, Torpey K, Schwarzwalder A, Simumba C, Kasonde P, Nyirenda L, et al. Task-shifting HIVcounseling and testing services in Zambia: the role of lay counselors. Hum Resour Health. 2009; 7:44.doi: 10.1186/1478-4491-7-44 PMID: 19480710
45. Bukve T, Røraas T, Riksheim BO, Christensen NG, Sandberg S. Point-of-care urine albumin in generalpractice offices: effect of participation in an external quality assurance scheme. Clin Chem Lab Med.2015; 53(1):45–51. doi: 10.1515/cclm-2014-0483 PMID: 25153401
Accuracy in HIV Rapid Testing in Zambia
PLOS ONE | DOI:10.1371/journal.pone.0146700 January 8, 2016 14 / 15
46. World Health Organization. Scaling up HIV testing and counseling services: A toolkit for programmemanagers. Geneva: WHO; 2005.
47. Mbilinyi D, Daniel ML, Lie GT. Health worker motivation in the context of HIV care and treatment chal-lenges in Mbeya region, Tanzania: a qualitative study. BMC Health Serv Res. 2011; 11:266. doi: 10.1186/1472-6963-11-266 PMID: 21992700
48. Kruse GR, Chapula BT, Ikeda S, NkomaM, Quiterio N, Pankratz D, et al. Burnout and use of HIV test-ing services among health care workers in Lusaka district, Zambia: A cross-sectional study. HumResour Health. 2009; 7:55. doi: 10.1186/1478-4491-7-55
49. Ministry of Health. ACTION PLAN 2011. Lusaka, Zambia: Ministry of Health; 2011:6–16.
50. World Health Organization Regional Office for Africa, Centres for Disease Control and Prevention,Association of Public Health laboratories. Guidelines for appropriate evaluations of HIV testing technol-ogies in Africa. Atlanta: Centres for Disease Control and Prevention; 2003.
51. Ndase P, Celum C, Kidoguchi L, Ronald A, Fife KH, Bukusi E, et al. Frequency of false positive rapidHIV serologic tests in African men and women receiving PrEP for HIV prevention: Implications for pro-grammatic roll-out of biomedical interventions. PLoS One. 2015; 10(4): e0123005. doi: 10.1371/journal.pone.0123005 PMID: 25885664
52. Shanks L, Klarkowski D, O'Brien DP. False positive HIV diagnoses in resource limited settings: opera-tional lessons learned for HIV programmes. PLoS One. 2013; 8(3):e59906. doi: 10.1371/journal.pone.0059906 PMID: 23527284
53. Shanks L, Siddiqui M, Kliescikova J, Pearce N, Ariti C, Muluneh L, et al. Evaluation of HIV testing algo-rithms in Ethiopia: the role of the tie-breaker algorithm and weakly reacting test lines in contributing to ahigh rate of false positive HIV diagnoses. BMC Infect Dis. 2015; 15:39. doi: 10.1186/s12879-015-0769-3 PMID: 25645240
54. Molesworth AM, Ndhlovu R, Banda E, Saul J, Ngwira B, Glynn JR, et al. High accuracy of home-basedcommunity rapid HIV testing in rural Malawi. J Acquir Immune Defic Syndr. 2010; 55(5):625–30. doi:10.1097/QAI.0b013e3181f98628 PMID: 21934554
Accuracy in HIV Rapid Testing in Zambia
PLOS ONE | DOI:10.1371/journal.pone.0146700 January 8, 2016 15 / 15


