Embed Size (px)
Citation preview
Measurement & Verification Load Impact Study for NCPA SB5X Commercial and Industrial Custom Incentive Programs Study ID: NCP0001.05 FINAL REPORT Prepared for John Berlin, Project Manager Northern California Power Agency Roseville, California Prepared by Principal Investigators: Robert Mowris and Kathleen Carlson Robert Mowris & Associates Olympic Valley, California June 25, 2005 Funded with California Senate Bill 5X Funds


M&V Load Impact Study for NCPA SB5X C&I Custom Incentive Programs
Robert Mowris Associates i file: M&V Load Impact Study for NCPA SB5X C&I Custom Programs
TABLE OF CONTENTS Acknowledgements......................................................................................................................... ii
1. Executive Summary .....................................................................................................................1
2. M&V Approach and Results for C&I Custom ............................................................................2
2.1 Field Measurement Methodology........................................................................................3
2.2 Findings of Field Measurements..........................................................................................3
2.2.1 Findings for C&I Custom Projects ................................................................................ 3
2.2.2 Findings for Solar Photovoltaic Systems....................................................................... 7
3. Participant Survey Results ...........................................................................................................8
3.1 Participant Survey Methodology .........................................................................................8
3.2 Findings of the Participant Surveys .....................................................................................9
4. M&V Methodology .....................................................................................................................9
4.1 Sample Design and Statistical Analysis...............................................................................9
4.2 Database.............................................................................................................................13
4.3 Baseline..............................................................................................................................13
4.4 Program Evaluation Savings Estimates .............................................................................13
Appendix A: NCPA C&I Decision-Maker Survey........................................................................15
M&V Load Impact Study for NCPA SB5X C&I Custom Incentive Programs
Robert Mowris Associates ii file: M&V Load Impact Study for NCPA SB5X C&I Custom Programs
Acknowledgements This measurement and verification load impact study was funded by Senate Bill 5X and administered by Northern California Power Agency under the auspices of the California Energy Commission. Field research at customer sites and utility billing data analysis were made possible with the cooperation of Steve Hibbard, Turlock Irrigation District. Robert Mowris, P.E., and Kathleen Carlson, M.B.A., Esq., managed the study. Robert Mowris developed the EM&V plans, database, and survey instruments. Peter Pressley, Ph.D., developed the NCPA M&V tracking database and Rachel Noack, B.S., managed and revised the database. Robert Mowris and Anne Blankenship, B.S., performed the on-site audits, participant surveys, engineering and statistical analyses, and wrote the report with assistance from Ean Jones, B.S., and Rachel Noack. John Berlin was the project manager for Northern California Power Agency. Rick Ridge, Ph.D., Ridge Associates, provided review comments and suggestions regarding the statistical analysis and sample design.
M&V Load Impact Study for NCPA SB5X C&I Custom Incentive Programs
Robert Mowris Associates 1 file: M&V Load Impact Study for NCPA SB5X C&I Custom Programs
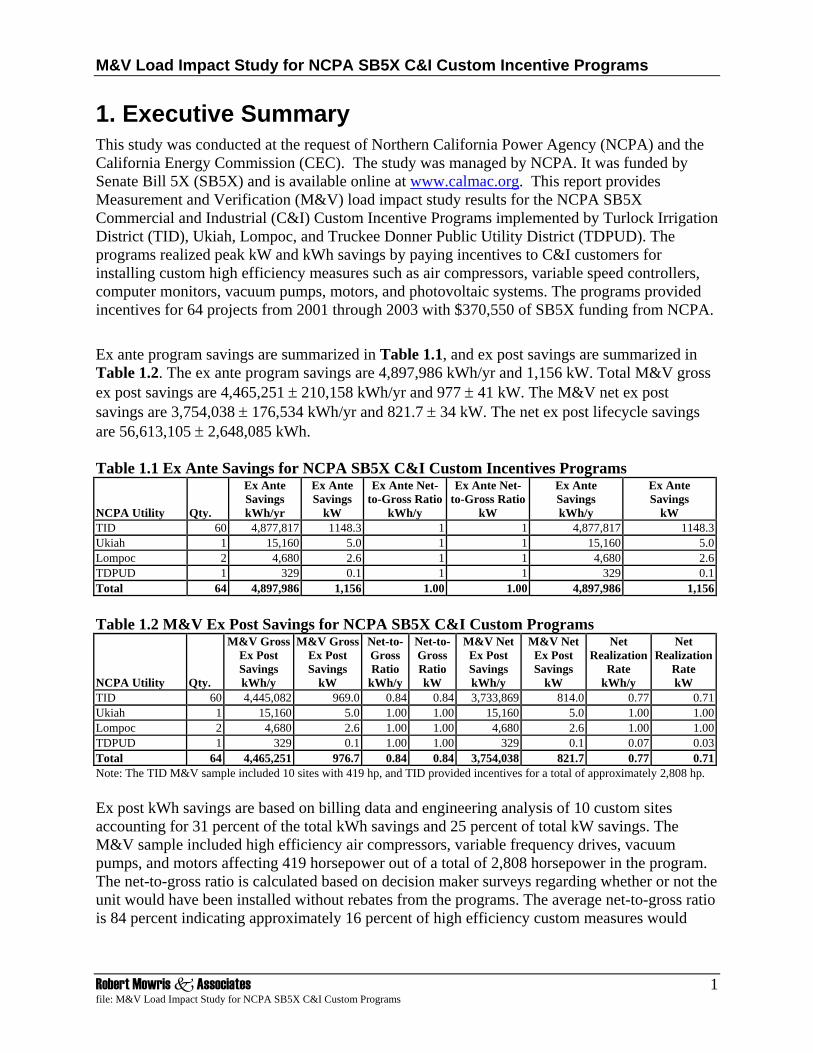
1. Executive Summary This study was conducted at the request of Northern California Power Agency (NCPA) and the California Energy Commission (CEC). The study was managed by NCPA. It was funded by Senate Bill 5X (SB5X) and is available online at www.calmac.org. This report provides Measurement and Verification (M&V) load impact study results for the NCPA SB5X Commercial and Industrial (C&I) Custom Incentive Programs implemented by Turlock Irrigation District (TID), Ukiah, Lompoc, and Truckee Donner Public Utility District (TDPUD). The programs realized peak kW and kWh savings by paying incentives to C&I customers for installing custom high efficiency measures such as air compressors, variable speed controllers, computer monitors, vacuum pumps, motors, and photovoltaic systems. The programs provided incentives for 64 projects from 2001 through 2003 with $370,550 of SB5X funding from NCPA.
Ex ante program savings are summarized in Table 1.1, and ex post savings are summarized in Table 1.2. The ex ante program savings are 4,897,986 kWh/yr and 1,156 kW. Total M&V gross ex post savings are 4,465,251 ± 210,158 kWh/yr and 977 ± 41 kW. The M&V net ex post savings are 3,754,038 ± 176,534 kWh/yr and 821.7 ± 34 kW. The net ex post lifecycle savings are 56,613,105 ± 2,648,085 kWh. Table 1.1 Ex Ante Savings for NCPA SB5X C&I Custom Incentives Programs
NCPA Utility Qty.
Ex Ante Savings kWh/yr
Ex Ante Savings
kW
Ex Ante Net-to-Gross Ratio
kWh/y
Ex Ante Net-to-Gross Ratio
kW
Ex Ante Savings kWh/y
Ex Ante Savings
kW TID 60 4,877,817 1148.3 1 1 4,877,817 1148.3Ukiah 1 15,160 5.0 1 1 15,160 5.0Lompoc 2 4,680 2.6 1 1 4,680 2.6TDPUD 1 329 0.1 1 1 329 0.1Total 64 4,897,986 1,156 1.00 1.00 4,897,986 1,156 Table 1.2 M&V Ex Post Savings for NCPA SB5X C&I Custom Programs
NCPA Utility Qty.
M&V Gross Ex Post Savings kWh/y
M&V GrossEx Post Savings
kW
Net-to-Gross Ratio
kWh/y
Net-to-Gross Ratio kW
M&V Net Ex Post Savings kWh/y
M&V Net Ex Post Savings
kW
Net Realization
Rate kWh/y
Net Realization
Rate kW
TID 60 4,445,082 969.0 0.84 0.84 3,733,869 814.0 0.77 0.71Ukiah 1 15,160 5.0 1.00 1.00 15,160 5.0 1.00 1.00Lompoc 2 4,680 2.6 1.00 1.00 4,680 2.6 1.00 1.00TDPUD 1 329 0.1 1.00 1.00 329 0.1 0.07 0.03Total 64 4,465,251 976.7 0.84 0.84 3,754,038 821.7 0.77 0.71Note: The TID M&V sample included 10 sites with 419 hp, and TID provided incentives for a total of approximately 2,808 hp. Ex post kWh savings are based on billing data and engineering analysis of 10 custom sites accounting for 31 percent of the total kWh savings and 25 percent of total kW savings. The M&V sample included high efficiency air compressors, variable frequency drives, vacuum pumps, and motors affecting 419 horsepower out of a total of 2,808 horsepower in the program. The net-to-gross ratio is calculated based on decision maker surveys regarding whether or not the unit would have been installed without rebates from the programs. The average net-to-gross ratio is 84 percent indicating approximately 16 percent of high efficiency custom measures would
M&V Load Impact Study for NCPA SB5X C&I Custom Incentive Programs
Robert Mowris Associates 2 file: M&V Load Impact Study for NCPA SB5X C&I Custom Programs
have been purchased anyway without the program.1 The realization rates are 0.77 for kWh savings and 0.71 for kW savings. The M&V savings and net realization rates are lower than anticipated due to lower baseline usage and lower net-to-gross ratios. The M&V study provides average gross savings per unit and net-to-gross ratios. The gross savings are based on in-situ true RMS power measurements. The peak kW for each unit was taken as the maximum kW that occurs during the 2 PM to 6 PM weekday time frame. Participant telephone surveys were used to evaluate program performance criteria and net-to-gross ratios. Section 2 presents the M&V approach and results, field measurement methodology, findings of the field measurements, and M&V savings. Section 3 presents participant survey results and the methodology used to develop net-to-gross ratios for kWh and kW savings. Section 4 presents the M&V sample design and statistical analysis methods, database, baseline, impact analysis, and program evaluation savings estimates. Appendix A provides the Decision-Maker Survey.
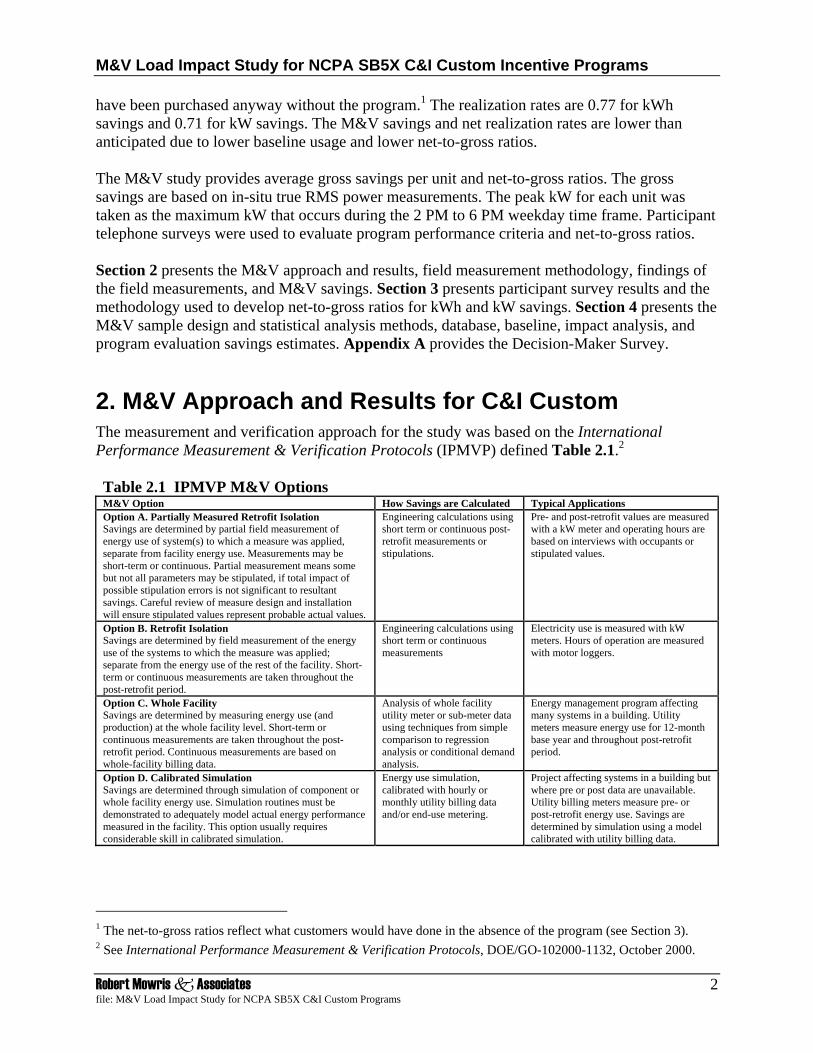
2. M&V Approach and Results for C&I Custom The measurement and verification approach for the study was based on the International Performance Measurement & Verification Protocols (IPMVP) defined Table 2.1.2 Table 2.1 IPMVP M&V Options M&V Option How Savings are Calculated Typical Applications Option A. Partially Measured Retrofit Isolation Savings are determined by partial field measurement of energy use of system(s) to which a measure was applied, separate from facility energy use. Measurements may be short-term or continuous. Partial measurement means some but not all parameters may be stipulated, if total impact of possible stipulation errors is not significant to resultant savings. Careful review of measure design and installation will ensure stipulated values represent probable actual values.
Engineering calculations using short term or continuous post-retrofit measurements or stipulations.
Pre- and post-retrofit values are measured with a kW meter and operating hours are based on interviews with occupants or stipulated values.
Option B. Retrofit Isolation Savings are determined by field measurement of the energy use of the systems to which the measure was applied; separate from the energy use of the rest of the facility. Short-term or continuous measurements are taken throughout the post-retrofit period.
Engineering calculations using short term or continuous measurements
Electricity use is measured with kW meters. Hours of operation are measured with motor loggers.
Option C. Whole Facility Savings are determined by measuring energy use (and production) at the whole facility level. Short-term or continuous measurements are taken throughout the post-retrofit period. Continuous measurements are based on whole-facility billing data.
Analysis of whole facility utility meter or sub-meter data using techniques from simple comparison to regression analysis or conditional demand analysis.
Energy management program affecting many systems in a building. Utility meters measure energy use for 12-month base year and throughout post-retrofit period.
Option D. Calibrated Simulation Savings are determined through simulation of component or whole facility energy use. Simulation routines must be demonstrated to adequately model actual energy performance measured in the facility. This option usually requires considerable skill in calibrated simulation.
Energy use simulation, calibrated with hourly or monthly utility billing data and/or end-use metering.
Project affecting systems in a building but where pre or post data are unavailable. Utility billing meters measure pre- or post-retrofit energy use. Savings are determined by simulation using a model calibrated with utility billing data.
1 The net-to-gross ratios reflect what customers would have done in the absence of the program (see Section 3). 2 See International Performance Measurement & Verification Protocols, DOE/GO-102000-1132, October 2000.

M&V Load Impact Study for NCPA SB5X C&I Custom Incentive Programs
Robert Mowris Associates 3 file: M&V Load Impact Study for NCPA SB5X C&I Custom Programs
Ex post energy and peak demand savings were determined using IPMVP Option B (i.e., retrofit isolation), and Option C (whole facility billing analysis). Three years of whole facility pre- and post-retrofit monthly utility billing data including kWh and kW were collected for 10 sites in TID. The billing data, sub-metered kW data, and engineering analyses were used to develop the kWh and kW baseline usage and savings for each site.
2.1 Field Measurement Methodology Field measurements were made to determine in-situ efficiency on a sample of 10 custom sites. Field measurements, measurement equipment, and measurement tolerances are provided in Table 2.2. Billing data for most sites was collected for a three year period from January 2001 through December 2003. These data were used to develop annual energy savings. Table 2.2 Field Measurements, Measurement Equipment, and Tolerances
Field Measurement Measurement Equipment Measurement Tolerances Total power in kilowatts (kW) of air compressors, motors, and controls
True RMS 4-channel power data loggers and 4-channel power analyzer
Data loggers, CTs, PTs: ± 1% Power analyzer: ± 1%
2.2 Findings of Field Measurements Field measurements were made to determine in-situ energy and peak demand savings for TID projects. Multiple data loggers were installed at 10 custom sites to measure peak demand and energy use for standard and high efficiency custom measures. The measurement sample included air compressors, variable speed drives, vacuum pumps, and controls. Insufficient data were available to fully evaluate savings for Solar Photovoltaic projects implemented by Ukiah, Lompoc, and TDPUD. The ex ante savings for PV projects were based on engineering analyses and they were accepted as reasonable ex post savings.
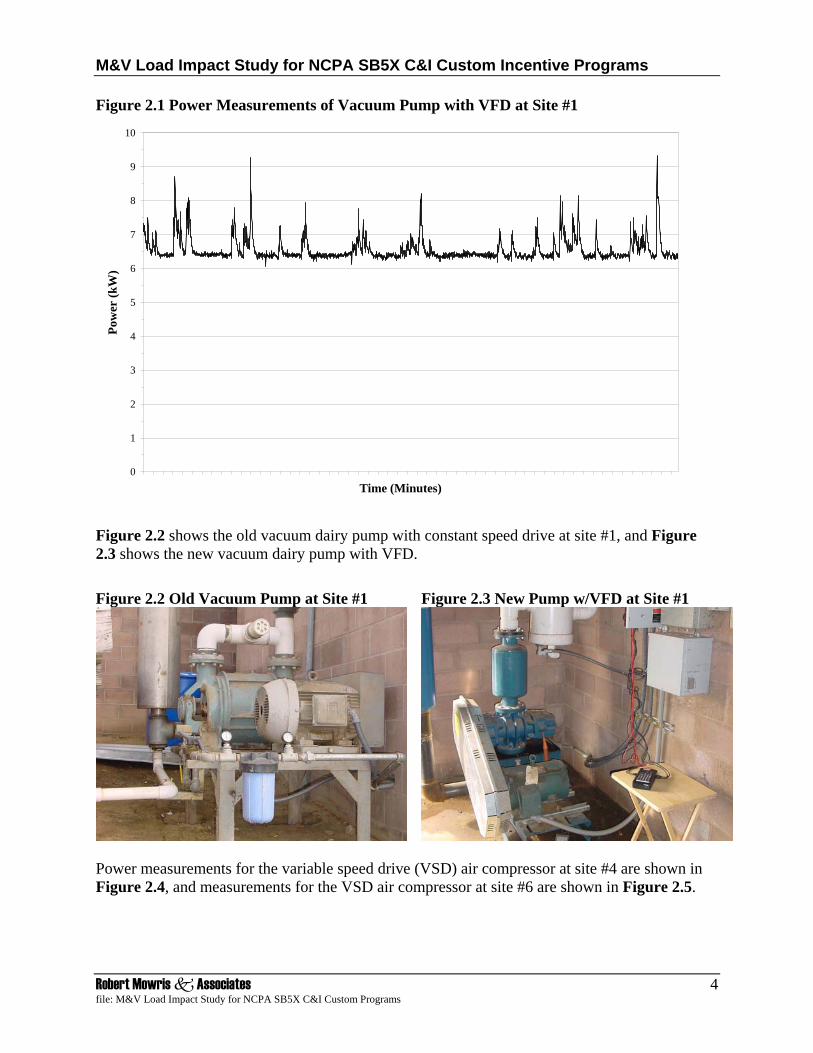
2.2.1 Findings for C&I Custom Projects The custom projects accounted for 99 percent of total ex ante savings for the SB5X C&I Custom Incentives Programs. Data loggers were installed at 10 of the custom sites to measure peak demand and energy use. Peak kW savings are based on kW measurements as shown in Figure 2.1 for the vacuum pump with variable frequency drive (VFD) at Site #1.
M&V Load Impact Study for NCPA SB5X C&I Custom Incentive Programs
Robert Mowris Associates 4 file: M&V Load Impact Study for NCPA SB5X C&I Custom Programs
Figure 2.1 Power Measurements of Vacuum Pump with VFD at Site #1
0
1
2
3
4
5
6
7
8
9
101
120
239
358
477
596
715
834
953
1072
1191
1310
1429
1548
1667
1786
1905
2024
2143
2262
2381
2500
2619
2738
2857
2976
3095
3214
Pow
er (k
W)
Time (Minutes)
Figure 2.2 shows the old vacuum dairy pump with constant speed drive at site #1, and Figure 2.3 shows the new vacuum dairy pump with VFD.
Figure 2.2 Old Vacuum Pump at Site #1 Figure 2.3 New Pump w/VFD at Site #1
Power measurements for the variable speed drive (VSD) air compressor at site #4 are shown in Figure 2.4, and measurements for the VSD air compressor at site #6 are shown in Figure 2.5.

M&V Load Impact Study for NCPA SB5X C&I Custom Incentive Programs
Robert Mowris Associates 5 file: M&V Load Impact Study for NCPA SB5X C&I Custom Programs
Figure 2.4 Power Measurements of VSD Air Compressor at Site #4
0
1
2
3
4
5
6
7
8
9
10
11
12
13
14
15
16
17
181
120
239
358
477
596
715
834
953
1072
1191
1310
1429
Pow
er (k
W)
Time (Minutes)
Figure 2.5 Power Measurements of VSD Air Compressor at Site #6
0
5
10
15
20
25
30
35
40
1
120
239
358
477
596
715
834
953
1072
1191
1310
Pow
er (k
W)
Time (Minutes)

M&V Load Impact Study for NCPA SB5X C&I Custom Incentive Programs
Robert Mowris Associates 6 file: M&V Load Impact Study for NCPA SB5X C&I Custom Programs
Figure 2.6 shows the VSD air compressor at Site #4, and Figure 2.7 shows VSD air compressor at Site #6. Figure 2.6 VSD Air Compressor at Site #4 Figure 2.7 VSD Air Compressor at Site #6
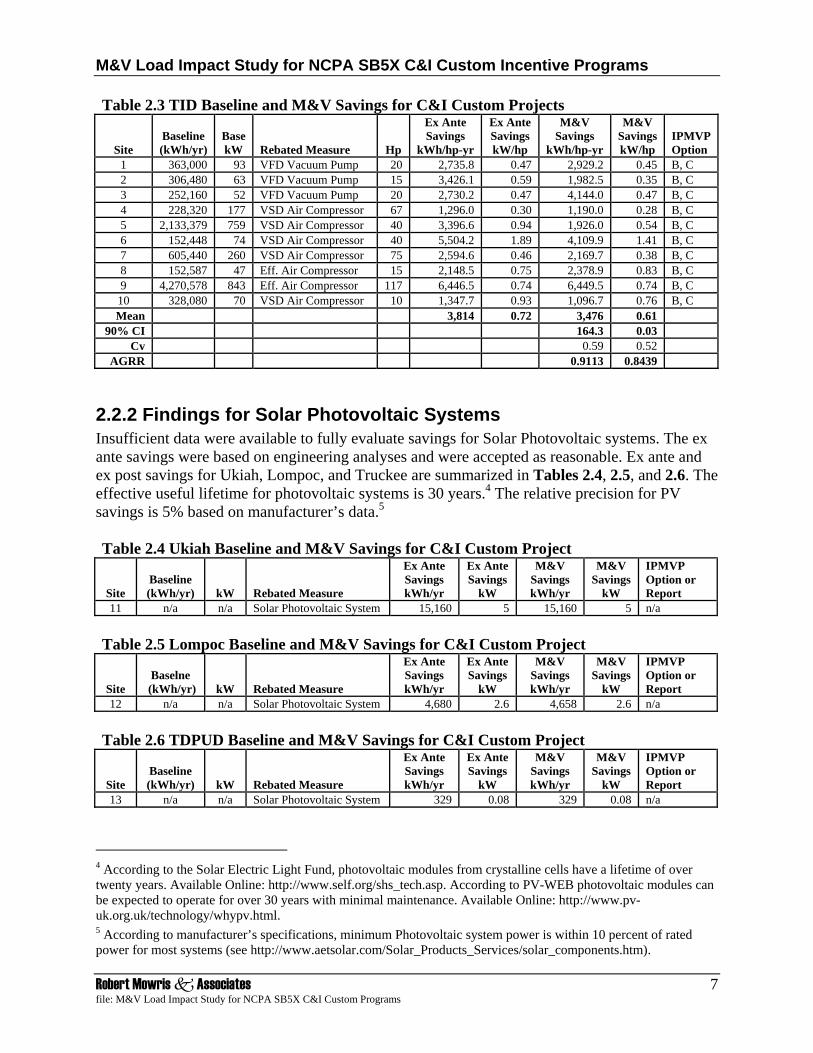
Three years of pre-retrofit and post-retrofit monthly utility billing data were collected for the 10 custom sites in TID from 2000 through 2002. Monthly utility billing data including both kWh and kW, sub-metered kW data, and engineering analyses were used to develop the kWh and kW baselines and savings for each site. Baseline kWh and kW values and ex ante and M&V ex post normalized savings per horsepower are summarized in Table 2.3. The ex ante mean savings for the ten sites are 3,814 kWh/hp-yr and 0.72 kW/hp. The gross M&V ex post mean savings for the ten sites are 3,476 ± 164.3 kWh/yr and 0.61 ± 0.03 kW/hp. The average gross realization rates (AGRR) are 0.9113 for kWh and 0.8439 for kW. The AGRR values are multiplied by the TID ex ante values of 4,877,817 kWh and 1,156 kW to calculate the gross M&V ex post savings of 4,445,082 ± 210,157 kWh/yr and 969 ± 40.5 kW. The net-to-gross ratio (NTGR) for TID is 0.84 (see Section 3.2). Multiplying the NTGR times the M&V gross savings yields the net M&V savings for TID of 3,733,869 ± 176,532 kWh/yr and 814 ± 34 kW. The M&V sample included high efficiency air compressors, variable frequency drives, vacuum pumps, and motors affecting 419 horsepower out of a total of 2,808 horsepower in the program. Custom measures included air compressors, variable speed drives, vacuum pumps, motors, and controls. The effective useful lifetime for these custom measures is 15 years.3
3 The net-to-gross ratio and effective useful lifetime (EUL) are taken from the Energy Efficiency Policy Manual, Chapter 4, page 22, prepared by the California Public Utilities Commission, 2001.
M&V Load Impact Study for NCPA SB5X C&I Custom Incentive Programs
Robert Mowris Associates 7 file: M&V Load Impact Study for NCPA SB5X C&I Custom Programs
Table 2.3 TID Baseline and M&V Savings for C&I Custom Projects
Site Baseline (kWh/yr)
Base kW Rebated Measure Hp
Ex Ante Savings
kWh/hp-yr
Ex Ante Savings kW/hp
M&V Savings
kWh/hp-yr
M&V Savings kW/hp
IPMVP Option
1 363,000 93 VFD Vacuum Pump 20 2,735.8 0.47 2,929.2 0.45 B, C 2 306,480 63 VFD Vacuum Pump 15 3,426.1 0.59 1,982.5 0.35 B, C 3 252,160 52 VFD Vacuum Pump 20 2,730.2 0.47 4,144.0 0.47 B, C 4 228,320 177 VSD Air Compressor 67 1,296.0 0.30 1,190.0 0.28 B, C 5 2,133,379 759 VSD Air Compressor 40 3,396.6 0.94 1,926.0 0.54 B, C 6 152,448 74 VSD Air Compressor 40 5,504.2 1.89 4,109.9 1.41 B, C 7 605,440 260 VSD Air Compressor 75 2,594.6 0.46 2,169.7 0.38 B, C 8 152,587 47 Eff. Air Compressor 15 2,148.5 0.75 2,378.9 0.83 B, C 9 4,270,578 843 Eff. Air Compressor 117 6,446.5 0.74 6,449.5 0.74 B, C 10 328,080 70 VSD Air Compressor 10 1,347.7 0.93 1,096.7 0.76 B, C Mean 3,814 0.72 3,476 0.61
90% CI 164.3 0.03 Cv 0.59 0.52
AGRR 0.9113 0.8439
2.2.2 Findings for Solar Photovoltaic Systems Insufficient data were available to fully evaluate savings for Solar Photovoltaic systems. The ex ante savings were based on engineering analyses and were accepted as reasonable. Ex ante and ex post savings for Ukiah, Lompoc, and Truckee are summarized in Tables 2.4, 2.5, and 2.6. The effective useful lifetime for photovoltaic systems is 30 years.4 The relative precision for PV savings is 5% based on manufacturer’s data.5 Table 2.4 Ukiah Baseline and M&V Savings for C&I Custom Project
Site Baseline (kWh/yr) kW Rebated Measure
Ex Ante Savings kWh/yr
Ex Ante Savings
kW
M&V Savings kWh/yr
M&V Savings
kW
IPMVP Option or Report
11 n/a n/a Solar Photovoltaic System 15,160 5 15,160 5 n/a Table 2.5 Lompoc Baseline and M&V Savings for C&I Custom Project
Site Baselne
(kWh/yr) kW Rebated Measure
Ex Ante Savings kWh/yr
Ex Ante Savings
kW
M&V Savings kWh/yr
M&V Savings
kW
IPMVP Option or Report
12 n/a n/a Solar Photovoltaic System 4,680 2.6 4,658 2.6 n/a Table 2.6 TDPUD Baseline and M&V Savings for C&I Custom Project
Site Baseline (kWh/yr) kW Rebated Measure
Ex Ante Savings kWh/yr
Ex Ante Savings
kW
M&V Savings kWh/yr
M&V Savings
kW
IPMVP Option or Report
13 n/a n/a Solar Photovoltaic System 329 0.08 329 0.08 n/a
4 According to the Solar Electric Light Fund, photovoltaic modules from crystalline cells have a lifetime of over twenty years. Available Online: http://www.self.org/shs_tech.asp. According to PV-WEB photovoltaic modules can be expected to operate for over 30 years with minimal maintenance. Available Online: http://www.pv-uk.org.uk/technology/whypv.html. 5 According to manufacturer’s specifications, minimum Photovoltaic system power is within 10 percent of rated power for most systems (see http://www.aetsolar.com/Solar_Products_Services/solar_components.htm).
M&V Load Impact Study for NCPA SB5X C&I Custom Incentive Programs
Robert Mowris Associates 8 file: M&V Load Impact Study for NCPA SB5X C&I Custom Programs
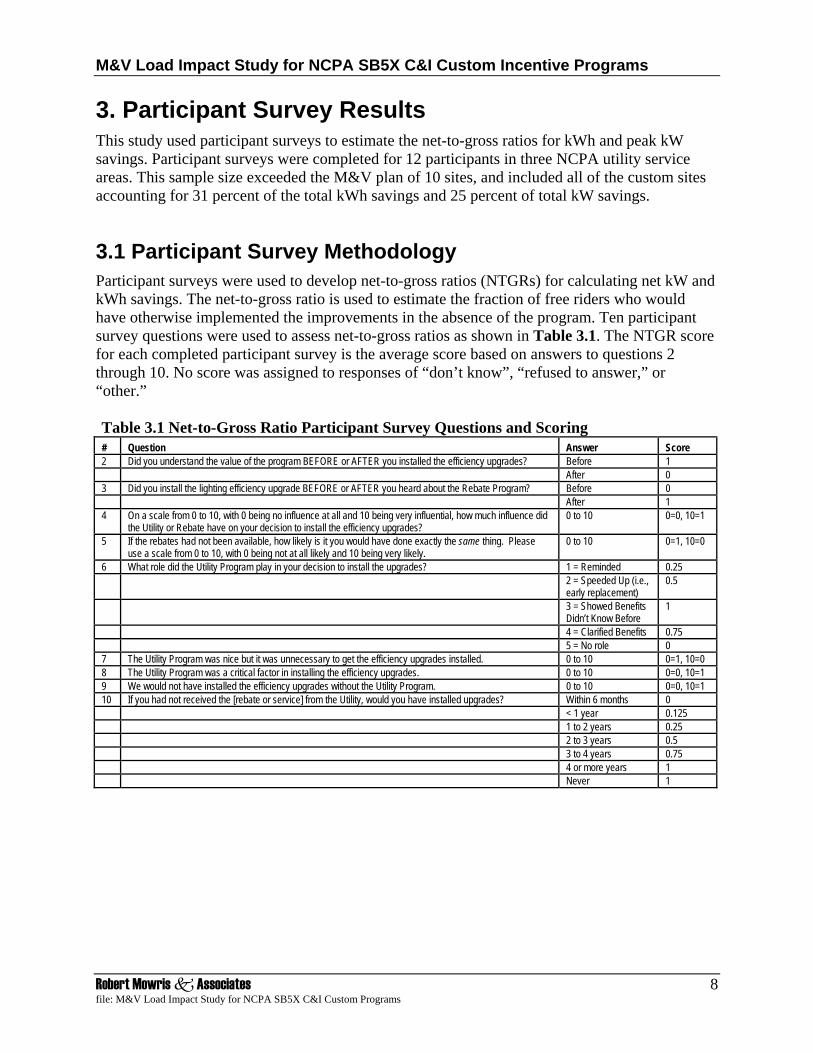
3. Participant Survey Results This study used participant surveys to estimate the net-to-gross ratios for kWh and peak kW savings. Participant surveys were completed for 12 participants in three NCPA utility service areas. This sample size exceeded the M&V plan of 10 sites, and included all of the custom sites accounting for 31 percent of the total kWh savings and 25 percent of total kW savings.
3.1 Participant Survey Methodology Participant surveys were used to develop net-to-gross ratios (NTGRs) for calculating net kW and kWh savings. The net-to-gross ratio is used to estimate the fraction of free riders who would have otherwise implemented the improvements in the absence of the program. Ten participant survey questions were used to assess net-to-gross ratios as shown in Table 3.1. The NTGR score for each completed participant survey is the average score based on answers to questions 2 through 10. No score was assigned to responses of “don’t know”, “refused to answer,” or “other.” Table 3.1 Net-to-Gross Ratio Participant Survey Questions and Scoring # Question Answer Score 2 Did you understand the value of the program BEFORE or AFTER you installed the efficiency upgrades? Before 1 After 0 3 Did you install the lighting efficiency upgrade BEFORE or AFTER you heard about the Rebate Program? Before 0 After 1 4 On a scale from 0 to 10, with 0 being no influence at all and 10 being very influential, how much influence did
the Utility or Rebate have on your decision to install the efficiency upgrades? 0 to 10 0=0, 10=1
5 If the rebates had not been available, how likely is it you would have done exactly the same thing. Please use a scale from 0 to 10, with 0 being not at all likely and 10 being very likely.
0 to 10 0=1, 10=0
6 What role did the Utility Program play in your decision to install the upgrades? 1 = Reminded 0.25 2 = Speeded Up (i.e.,
early replacement) 0.5
3 = Showed Benefits Didn’t Know Before
1
4 = Clarified Benefits 0.75 5 = No role 0 7 The Utility Program was nice but it was unnecessary to get the efficiency upgrades installed. 0 to 10 0=1, 10=0 8 The Utility Program was a critical factor in installing the efficiency upgrades. 0 to 10 0=0, 10=1 9 We would not have installed the efficiency upgrades without the Utility Program. 0 to 10 0=0, 10=1 10 If you had not received the [rebate or service] from the Utility, would you have installed upgrades? Within 6 months 0 < 1 year 0.125 1 to 2 years 0.25 2 to 3 years 0.5 3 to 4 years 0.75 4 or more years 1 Never 1

M&V Load Impact Study for NCPA SB5X C&I Custom Incentive Programs
Robert Mowris Associates 9 file: M&V Load Impact Study for NCPA SB5X C&I Custom Programs
3.2 Findings of the Participant Surveys Findings of the participant surveys for each program are presented in Table 3.2. The weighted average net-to-gross ratio is 0.841 based on average participant survey results multiplied times gross ex post savings for each program divided by total gross ex post savings for all programs.6 Table 3.2 Findings of Participant Surveys
NCPA Utility Rebates Completed
Surveys
Gross Ex PostProgram Savings
kWh/yr
Gross Ex Post Program Savings
kW Weighting
Factor
Actual Net-to-Gross
Ratio
Weighted Net-to-Gross
Ratio TID 60 10 4,445,082 969.0 0.992 0.840 0.833Ukiah 1 1 15,160 5.0 0.005 1.000 0.005Lompoc 2 1 4,680 2.6 0.003 1.000 0.003Truckee 1 329 0.1 0.000 1.000 0.000Total 64 12 4,465,251 977 1.000 0.841
4. M&V Methodology The M&V methodology for the metering and participant survey tasks are discussed above in Sections 2 and 3. The M&V methodology for sample design, database tracking, baseline, and program evaluation savings estimates are discussed below.
4.1 Sample Design and Statistical Analysis Statistical survey sampling methods were used to select a sample of customers or projects from each program population in order to evaluate load impacts.7 Selecting participants for the sample was guided by the statistical sampling plan as well as input from NCPA utilities. Statistical analysis methods were used to analyze the data and extrapolate mean savings estimates from the sample sites to the population of all program participants and to evaluate the statistical precision of the results. Savings were normalized on a per unit basis in the statistical analyses (e.g., kW/hp). Normalizing the savings allows clearer interpretation of the savings data. Considering each NCPA utility program within a program category as a stratum, the sample mean within a program was calculated using Equation 1.
Eq. 1 Mean Savings ∑=
==n
1kk
hh y
N1y
Where, hy = M&V mean kW or kWh savings for stratum “h.”
hN = Number of measures or sites in stratum “h.”
ky = M&V kW or kWh savings estimate for measure “k.”
6 Participant survey results for programs with lower savings are weighted lower in terms of the total weighted average NTGR for all sites. 7 Cochran, William G. Sampling Techniques. New York: John Wiley & Sons, 1977, Kish, Leslie. Survey Sampling. New York: John Wiley & Sons, 1965. Thompson, Steven K. Sampling. New York: John Wiley & Sons, 1992.
M&V Load Impact Study for NCPA SB5X C&I Custom Incentive Programs
Robert Mowris Associates 10 file: M&V Load Impact Study for NCPA SB5X C&I Custom Programs
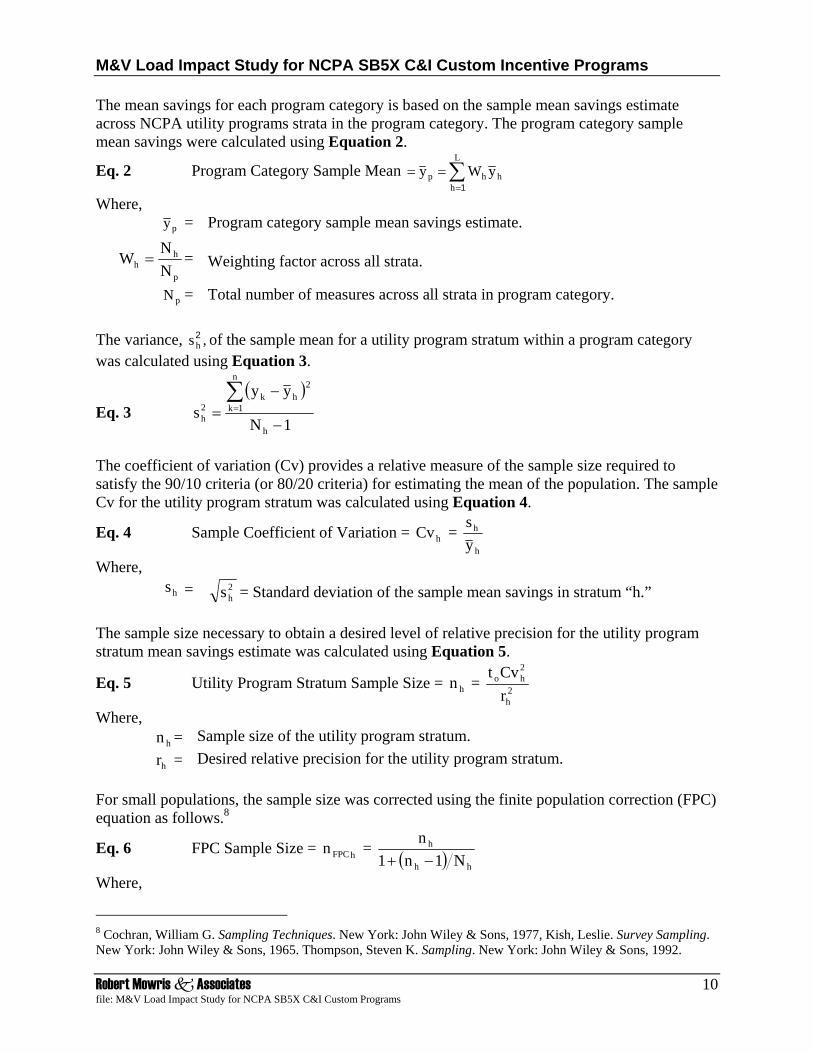
The mean savings for each program category is based on the sample mean savings estimate across NCPA utility programs strata in the program category. The program category sample mean savings were calculated using Equation 2.
Eq. 2 Program Category Sample Mean ∑=
==L
hhhp yWy
1
Where, py = Program category sample mean savings estimate.
p
hh N
NW = = Weighting factor across all strata.
pN = Total number of measures across all strata in program category. The variance, ,sh
2 of the sample mean for a utility program stratum within a program category was calculated using Equation 3.
Eq. 3 ( )
1N
yys
h
n
1k
2hk
2h −
−=∑=
The coefficient of variation (Cv) provides a relative measure of the sample size required to satisfy the 90/10 criteria (or 80/20 criteria) for estimating the mean of the population. The sample Cv for the utility program stratum was calculated using Equation 4.
Eq. 4 Sample Coefficient of Variation = hCv = h
h
ys
Where,
hs = 2hs = Standard deviation of the sample mean savings in stratum “h.”
The sample size necessary to obtain a desired level of relative precision for the utility program stratum mean savings estimate was calculated using Equation 5.
Eq. 5 Utility Program Stratum Sample Size = hn = 2h
2ho
rCvt
Where,
hn = Sample size of the utility program stratum.
hr = Desired relative precision for the utility program stratum. For small populations, the sample size was corrected using the finite population correction (FPC) equation as follows.8
Eq. 6 FPC Sample Size = hFPCn = ( ) hh
h
N1n1n−+
Where,
8 Cochran, William G. Sampling Techniques. New York: John Wiley & Sons, 1977, Kish, Leslie. Survey Sampling. New York: John Wiley & Sons, 1965. Thompson, Steven K. Sampling. New York: John Wiley & Sons, 1992.
M&V Load Impact Study for NCPA SB5X C&I Custom Incentive Programs
Robert Mowris Associates 11 file: M&V Load Impact Study for NCPA SB5X C&I Custom Programs
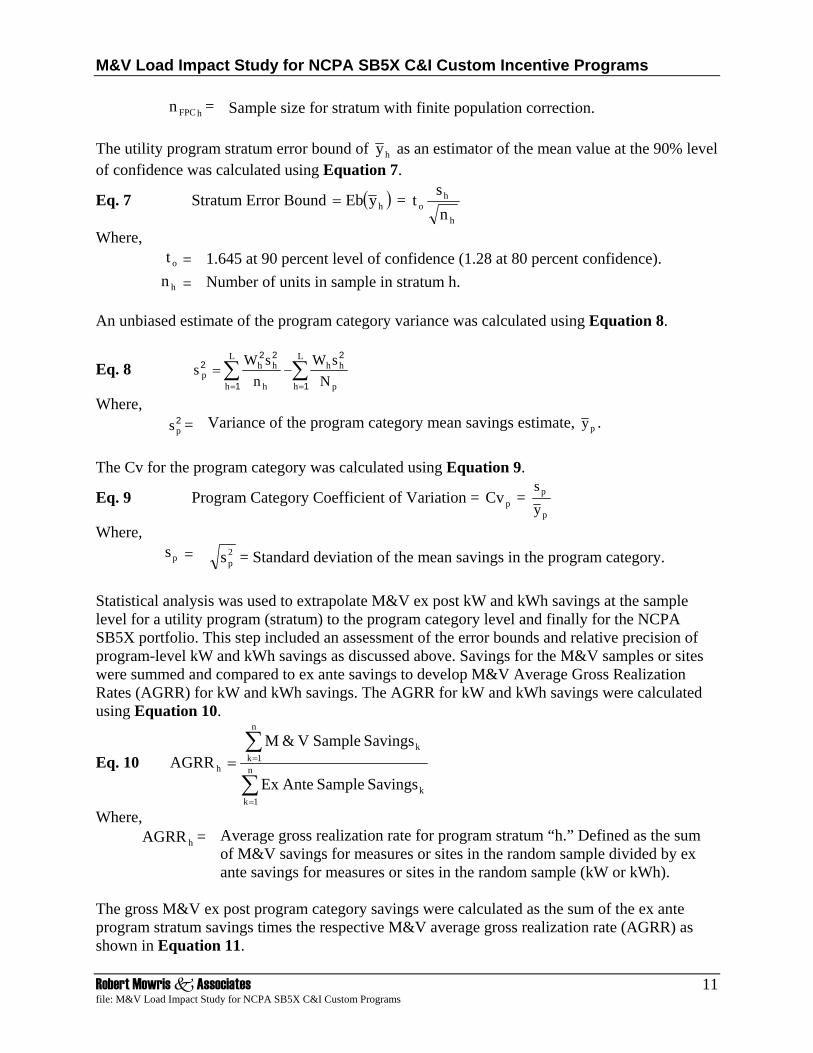
hFPCn = Sample size for stratum with finite population correction. The utility program stratum error bound of hy as an estimator of the mean value at the 90% level of confidence was calculated using Equation 7.
Eq. 7 Stratum Error Bound ( )hyEb= = h
ho n
st
Where, ot = 1.645 at 90 percent level of confidence (1.28 at 80 percent confidence).
hn = Number of units in sample in stratum h. An unbiased estimate of the program category variance was calculated using Equation 8.
Eq. 8 ∑∑==
−=L
h p
hhL
h h
hhp N
sWn
sWs
1
2
1
222
Where, 2ps = Variance of the program category mean savings estimate, py .
The Cv for the program category was calculated using Equation 9.
Eq. 9 Program Category Coefficient of Variation = pCv = p
p
ys
Where,
ps = 2ps = Standard deviation of the mean savings in the program category.
Statistical analysis was used to extrapolate M&V ex post kW and kWh savings at the sample level for a utility program (stratum) to the program category level and finally for the NCPA SB5X portfolio. This step included an assessment of the error bounds and relative precision of program-level kW and kWh savings as discussed above. Savings for the M&V samples or sites were summed and compared to ex ante savings to develop M&V Average Gross Realization Rates (AGRR) for kW and kWh savings. The AGRR for kW and kWh savings were calculated using Equation 10.
Eq. 10 ∑
∑
=
== n
1kk
n
1kk
h
SavingsSampleAnteEx
SavingsSampleV&MAGRR
Where, hAGRR = Average gross realization rate for program stratum “h.” Defined as the sum
of M&V savings for measures or sites in the random sample divided by ex ante savings for measures or sites in the random sample (kW or kWh).
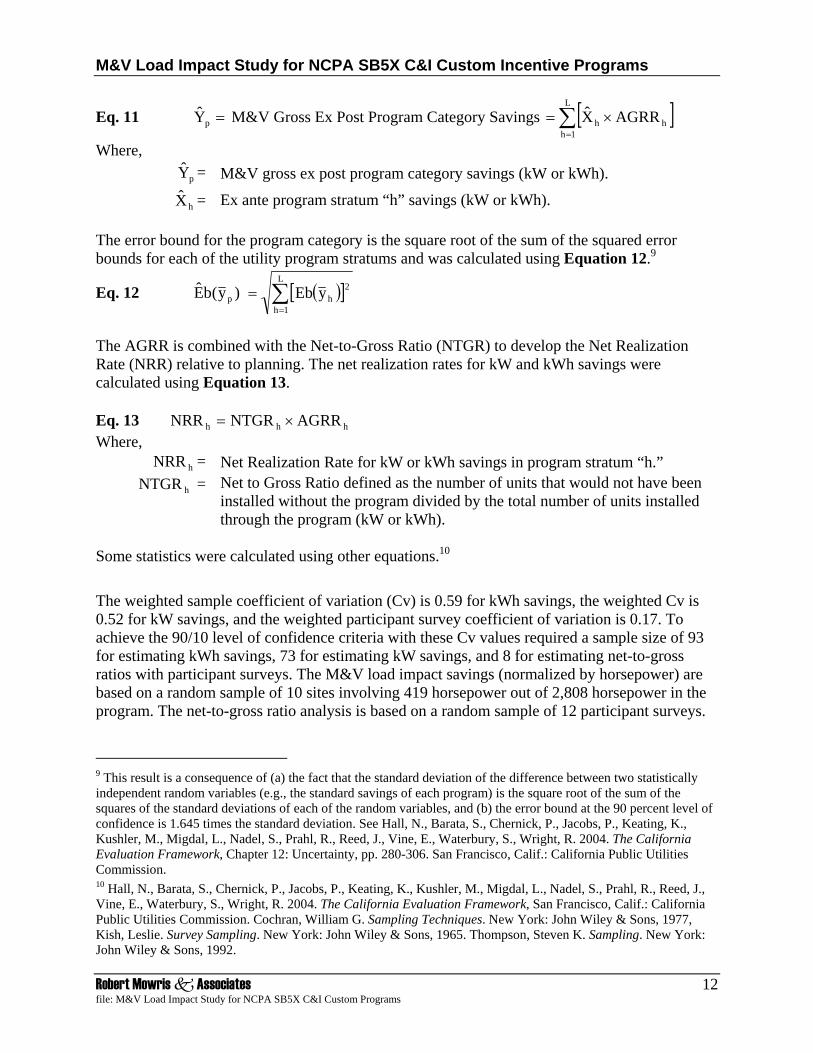
The gross M&V ex post program category savings were calculated as the sum of the ex ante program stratum savings times the respective M&V average gross realization rate (AGRR) as shown in Equation 11.
M&V Load Impact Study for NCPA SB5X C&I Custom Incentive Programs
Robert Mowris Associates 12 file: M&V Load Impact Study for NCPA SB5X C&I Custom Programs
Eq. 11 =pY M&V Gross Ex Post Program Category Savings [ ]∑=
×=L
1hhh AGRRX
Where,
pY = M&V gross ex post program category savings (kW or kWh).
hX = Ex ante program stratum “h” savings (kW or kWh). The error bound for the program category is the square root of the sum of the squared error bounds for each of the utility program stratums and was calculated using Equation 12.9
Eq. 12 )y(bE p ( )[ ]∑=
=L
1h
2hyEb
The AGRR is combined with the Net-to-Gross Ratio (NTGR) to develop the Net Realization Rate (NRR) relative to planning. The net realization rates for kW and kWh savings were calculated using Equation 13. Eq. 13 hhh AGRRNTGRNRR ×= Where,
hNRR = Net Realization Rate for kW or kWh savings in program stratum “h.” hNTGR = Net to Gross Ratio defined as the number of units that would not have been
installed without the program divided by the total number of units installed through the program (kW or kWh).
Some statistics were calculated using other equations.10
The weighted sample coefficient of variation (Cv) is 0.59 for kWh savings, the weighted Cv is 0.52 for kW savings, and the weighted participant survey coefficient of variation is 0.17. To achieve the 90/10 level of confidence criteria with these Cv values required a sample size of 93 for estimating kWh savings, 73 for estimating kW savings, and 8 for estimating net-to-gross ratios with participant surveys. The M&V load impact savings (normalized by horsepower) are based on a random sample of 10 sites involving 419 horsepower out of 2,808 horsepower in the program. The net-to-gross ratio analysis is based on a random sample of 12 participant surveys.
9 This result is a consequence of (a) the fact that the standard deviation of the difference between two statistically independent random variables (e.g., the standard savings of each program) is the square root of the sum of the squares of the standard deviations of each of the random variables, and (b) the error bound at the 90 percent level of confidence is 1.645 times the standard deviation. See Hall, N., Barata, S., Chernick, P., Jacobs, P., Keating, K., Kushler, M., Migdal, L., Nadel, S., Prahl, R., Reed, J., Vine, E., Waterbury, S., Wright, R. 2004. The California Evaluation Framework, Chapter 12: Uncertainty, pp. 280-306. San Francisco, Calif.: California Public Utilities Commission. 10 Hall, N., Barata, S., Chernick, P., Jacobs, P., Keating, K., Kushler, M., Migdal, L., Nadel, S., Prahl, R., Reed, J., Vine, E., Waterbury, S., Wright, R. 2004. The California Evaluation Framework, San Francisco, Calif.: California Public Utilities Commission. Cochran, William G. Sampling Techniques. New York: John Wiley & Sons, 1977, Kish, Leslie. Survey Sampling. New York: John Wiley & Sons, 1965. Thompson, Steven K. Sampling. New York: John Wiley & Sons, 1992.
M&V Load Impact Study for NCPA SB5X C&I Custom Incentive Programs
Robert Mowris Associates 13 file: M&V Load Impact Study for NCPA SB5X C&I Custom Programs
4.2 Database The C&I Custom Incentive Program data were tracked and archived in the NCPA Tracking Database. Data for all programs of this type are summarized within the database for M&V sampling and reporting purposes. The tracking system data is based on reports provided by the respective utilities. The database includes general customer information, quantity and type of measures installed, make and model number, horsepower, efficiency, and NCPA account number (if available). Tracking data was delivered electronically by utility program staff and entered into the database after the programs were completed.
4.3 Baseline The baseline kWh values are based on billing data analyses. The baseline kW values are based on monthly utility billing data and sub-metering data for a random sample of high efficiency custom measures (monthly kWh and kW), and the appropriate baseline prior to retrofit (see Section 2).
4.4 Program Evaluation Savings Estimates Gross M&V program evaluation savings (i.e., kWh/yr and kW) are based on the Average Gross Realization Rates (AGRR) from the M&V on-site audits. Gross ex post kWh and kW savings are based on billing data, engineering analyses, and field measurements of 10 custom sites accounting for 31 percent of the total kWh savings and 25 percent of total kW savings. The M&V sample included high efficiency air compressors, variable frequency drives, vacuum pumps, and motors affecting 419 horsepower out of a total of 2,808 horsepower in the program. Net program evaluation savings are based on the participant decision-maker survey results that were analyzed to develop net-to-gross ratios for kWh and kW savings. Methods used to develop net-to-gross ratios are described above in Section 3. The gross and net savings estimates obtained at the participant level are extrapolated to the population of program participants using the methods described above in Section 4.
Ex ante program savings are summarized in Table 4.1, and ex post savings are summarized in Table 4.2. The ex ante program savings are 4,897,986 kWh/yr and 1,156 kW. The M&V gross ex post program savings are 4,465,251 ± 210,158 kWh/yr and 977 ± 41 kW at the 90 percent confidence level. The M&V net ex post program savings are 3,754,038 ± 176,534 kWh/yr and 821.7 ± 34 kW. The M&V net ex post lifecycle savings are 56,613,105 ± 2,648,085 kWh as shown in Table 4.3. The net realization rates are 0.77 for kWh savings and 0.71 for kW savings. Ex post kWh savings are based on billing data and engineering analysis of 10 custom sites accounting for 31 percent of the total kWh savings and 25 percent of total kW savings. The M&V sample included high efficiency air compressors, variable frequency drives, vacuum pumps, and motors affecting 419 horsepower out of a total of 2,808 horsepower in the program. The net-to-gross ratios are calculated based on decision maker surveys regarding whether or not the unit would have been installed without rebates from the programs (see Section 3.2). M&V savings are lower than anticipated due to lower baseline usage and net-to-gross ratios.

M&V Load Impact Study for NCPA SB5X C&I Custom Incentive Programs
Robert Mowris Associates 14 file: M&V Load Impact Study for NCPA SB5X C&I Custom Programs
Table 4.1 Ex Ante Savings for NCPA SB5X C&I Custom Incentives Programs
NCPA Utility Qty.
Ex Ante Savings kWh/yr
Ex Ante Savings
kW
Ex Ante Net-to-Gross Ratio
kWh/y
Ex Ante Net-to-Gross Ratio
kW
Ex Ante Savings kWh/y
Ex Ante Savings
kW TID 60 4,877,817 1148.3 1 1 4,877,817 1148.3Ukiah 1 15,160 5.0 1 1 15,160 5.0Lompoc 2 4,680 2.6 1 1 4,680 2.6TDPUD 1 329 0.1 1 1 329 0.1Total 64 4,897,986 1,156 1.00 1.00 4,897,986 1,156 Table 4.2 M&V Ex Post Savings for NCPA SB5X C&I Custom Programs
NCPA Utility Qty.
M&V Gross Ex Post Savings kWh/y
M&V GrossEx Post Savings
kW
Net-to-Gross Ratio
kWh/y
Net-to-Gross Ratio kW
M&V Net Ex Post Savings kWh/y
M&V Net Ex Post Savings
kW
Net Realization
Rate kWh/y
Net Realization
Rate kW
TID 60 4,445,082 969.0 0.84 0.84 3,733,869 814.0 0.77 0.71Ukiah 1 15,160 5.0 1.00 1.00 15,160 5.0 1.00 1.00Lompoc 2 4,680 2.6 1.00 1.00 4,680 2.6 1.00 1.00TDPUD 1 329 0.1 1.00 1.00 329 0.1 0.07 0.03Total 64 4,465,251 976.7 0.84 0.84 3,754,038 821.7 0.77 0.71Note: The TID M&V sample included 10 sites with 419 hp, and TID provided incentives for a total of approximately 2,808 hp. Table 4.3 M&V Ex Post Lifecycle Savings for NCPA SB5X C&I Custom Programs
NCPA Utility Qty.
M&V Net Ex Post Annual
Savings kWh/yr Effective Useful
Lifetime
M&V Net Ex Post Lifecycle Savings kWh
90% CI kWh/yr
TID 60 3,733,869 15 56,008,035 2,647,978 Ukiah 1 15,160 30 454,800 22,740 Lompoc 2 4,680 30 140,400 7,020 Truckee 1 329 30 9,870 494 Total 64 3,754,038 56,613,105 2,648,085

M&V Load Impact Study for NCPA SB5X C&I Custom Incentive Programs
Robert Mowris Associates 15 file: M&V Load Impact Study for NCPA SB5X C&I Custom Programs
Appendix A: NCPA C&I Decision-Maker Survey
Interview Instructions for Decision-Maker Survey
1. Purpose
The purpose of the Decision-Maker Survey is to obtain sufficient information to estimate the Net-to-Gross Ratio (NTGR).
2. Selection of Respondent
The decision-maker must be the person who decided to install or implement rebated measures.
3. Two Types of Sites
This survey will be used for two types of sites:
1. On-Site M&V Only. Sites that receive an on-site inspection for the M&V evaluation.
2. Telephone Only. Sites that only receive a telephone survey.
4. How to Start a Survey
Complete the following steps to start one of these surveys:
1. Review file information for the site (if available).
2. Make sure you understand what was installed prior to initiating the call or visit.
3. Contact the person and explain the purpose of the Survey. Tell them that the data provided by them will be kept strictly confidential and will not be shared with anyone.

M&V Load Impact Study for NCPA SB5X C&I Custom Incentive Programs
Robert Mowris Associates 16 file: M&V Load Impact Study for NCPA SB5X C&I Custom Programs
C&I DECISION-MAKER SURVEY Customer Name:_____________________________ Date: ______________________________________
Business Name: _____________________________ Contact: ___________________________________
Phone Number:______________________________ City: ______________________________________
Start Call Time: _____________________________ End Call time:_______________________________
Surveyor Initials: ____________________________ Survey Completed: Y NA R WB BN Y = yes, NA = no answer, R = refused, WB = wrong business, BN = bad number
The purpose of the decision-maker survey is to obtain information necessary to calculate a net-to-gross ratio. You will need to interview the customer who was responsible for the decision to implement measures at the site. If this person is not available attempt to locate someone who is at least familiar with how that decision was made.
Introduction Say: “Hello. My name is [Anne] and I am conducting a survey regarding the your participating in the energy efficiency programs funded with SB5X funds. Would you mind spending 5 minutes to answer a few questions?”
Begin Survey 1. When and how did you first learn about the Utility Program? [Only ask this question once, for
the first recommendation for each site.]
____________________________________________________________________
1 Didn’t know there was a program (Go to Q.3)
2. Keeping that in mind, did you understand the value of the program BEFORE or AFTER you installed the efficiency upgrades? (Circle One)
1 Before 2 After (Go to Q.4) 98 Don’t Know 99 Refused to Answer
3. Did you install the efficiency upgrade(s) BEFORE or AFTER you heard about the Utility Rebate Program? (Circle One)
1 Before 2 After 98 Don’t Know 99 Refused to Answer
4. On a scale from 0 to 10, with 0 being no influence at all and 10 being very influential, how
much influence did the Utility or Rebate have on your decision to install the efficiency upgrades?
___ Response (0-10) 98 Don’t Know 99 Refused to Answer
5. If the rebates had not been available, how likely is it you would have done exactly the same thing. Please use a scale from 0 to 10, with 0 being not at all likely and 10 being very likely.
___ Response (0-10) 98 Don’t Know 99 Refused to Answer
Notes: ______________________________________________________________________
M&V Load Impact Study for NCPA SB5X C&I Custom Incentive Programs
Robert Mowris Associates 17 file: M&V Load Impact Study for NCPA SB5X C&I Custom Programs
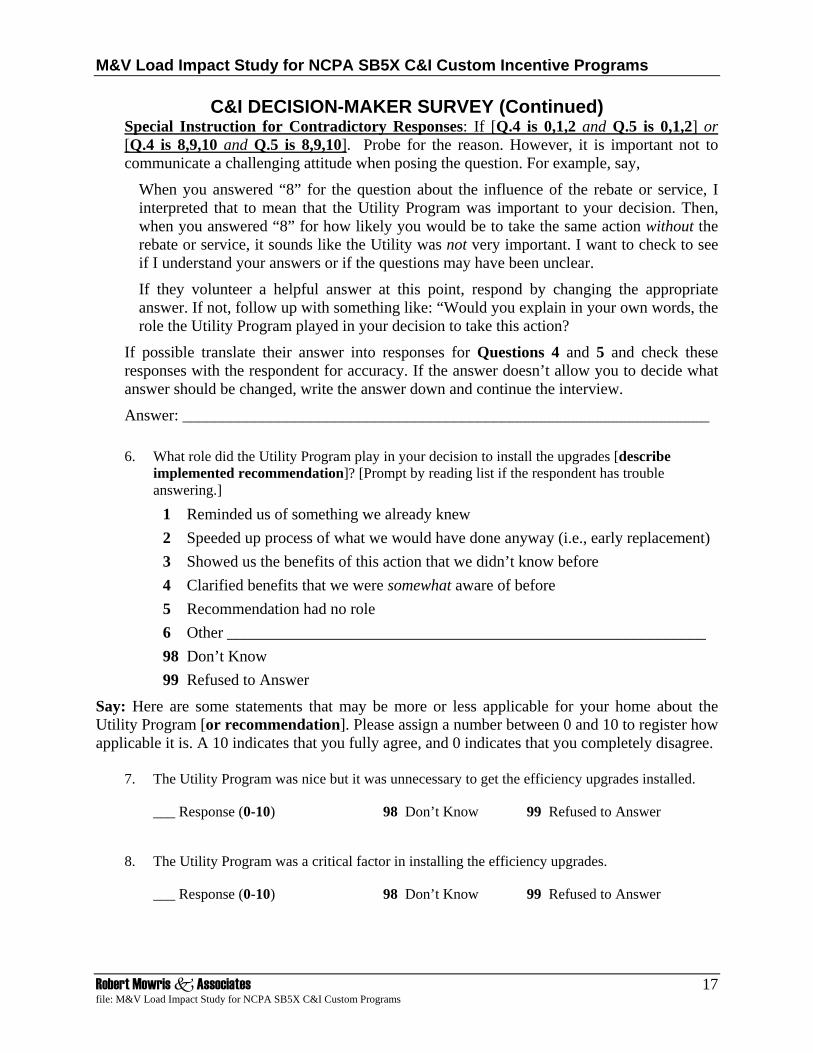
C&I DECISION-MAKER SURVEY (Continued) Special Instruction for Contradictory Responses: If [Q.4 is 0,1,2 and Q.5 is 0,1,2] or [Q.4 is 8,9,10 and Q.5 is 8,9,10]. Probe for the reason. However, it is important not to communicate a challenging attitude when posing the question. For example, say,
When you answered “8” for the question about the influence of the rebate or service, I interpreted that to mean that the Utility Program was important to your decision. Then, when you answered “8” for how likely you would be to take the same action without the rebate or service, it sounds like the Utility was not very important. I want to check to see if I understand your answers or if the questions may have been unclear.
If they volunteer a helpful answer at this point, respond by changing the appropriate answer. If not, follow up with something like: “Would you explain in your own words, the role the Utility Program played in your decision to take this action?
If possible translate their answer into responses for Questions 4 and 5 and check these responses with the respondent for accuracy. If the answer doesn’t allow you to decide what answer should be changed, write the answer down and continue the interview.
Answer: __________________________________________________________________ 6. What role did the Utility Program play in your decision to install the upgrades [describe
implemented recommendation]? [Prompt by reading list if the respondent has trouble answering.]
1 Reminded us of something we already knew 2 Speeded up process of what we would have done anyway (i.e., early replacement) 3 Showed us the benefits of this action that we didn’t know before 4 Clarified benefits that we were somewhat aware of before 5 Recommendation had no role 6 Other ____________________________________________________________ 98 Don’t Know 99 Refused to Answer
Say: Here are some statements that may be more or less applicable for your home about the Utility Program [or recommendation]. Please assign a number between 0 and 10 to register how applicable it is. A 10 indicates that you fully agree, and 0 indicates that you completely disagree.
7. The Utility Program was nice but it was unnecessary to get the efficiency upgrades installed.
___ Response (0-10) 98 Don’t Know 99 Refused to Answer
8. The Utility Program was a critical factor in installing the efficiency upgrades.
___ Response (0-10) 98 Don’t Know 99 Refused to Answer

M&V Load Impact Study for NCPA SB5X C&I Custom Incentive Programs
Robert Mowris Associates 18 file: M&V Load Impact Study for NCPA SB5X C&I Custom Programs
C&I DECISION-MAKER SURVEY (Continued) 9. We would not have installed the efficiency upgrades without the Utility Program.
___ Response (0-10) 98 Don’t Know 99 Refused to Answer
10. If you had not received the [rebate or service] from the Utility, would you have installed
upgrades [or other measures]...
1 ..within 6 months?
2 ..6 months to 1 year?
3 ..one to two years later?
4 ..two to three years later?
5 ..three to four years later?
6 ..four or more years later?
7 ..Never
98 ..Don’t Know - Try less precise response, if still “don’t know” use 98
8 ...less than one year?
9 ...one year or more?
99 ...Refused to Answer
Time relative to the installation date. For customers with more than one measure ask if their response is the same. If not, obtain a response for each measure. Write answers in margins and enter answers on a new line in the Excel spreadsheet.
Repeat Questions 2 through 10 for each installed measure or service.