Embed Size (px)
Citation preview

Financial Results Q3 FY 2016
December 2015
MUTHOOT FINANCE LIMITED

SAFE HARBOUR STATEMENT
This presentation may include statements, which may constitute forward-looking statements. All statements that address
expectations or projections about the future, including, but not limited to, statements about the strategy for growth, business
development, market position, expenditures, and financial results, are forward looking statements. Forward-looking statements
are based on certain assumptions and expectations of future events. The company cannot guarantee that these assumptions
and expectations are accurate or will be realised. The actual results, performance or achievements, could thus differ materially
from those projected in any such forward-looking statements.
The company assumes no responsibility to publicly amend, modify or revise any forward-looking statements, on the basis of
any subsequent developments, information or events, or otherwise. While every effort is made to ensure that this presentation
conforms with all applicable legal requirements, the company does not warrant that it is complete, comprehensive or accurate,
or commit to its being updated. No part of the information provided herein is to be construed as a solicitation to make any
financial investment and is provided for information only.
Any person/ party intending to provide finance / invest in the shares/businesses of the Company shall do so after seeking their
own professional advice and after carrying out their own due diligence procedure to ensure that they are making an informed
decision. In no event shall the company be liable for any damages whatsoever, whether direct, incidental, indirect,
consequential or special damages of any kind or including, without limitation, those resulting from loss of profit, loss of
contracts, goodwill, data, information, income, expected savings or business relationships arising out of or in connection with
the use of this presentation.
1

MUTHOOT FINANCE: DRIVING INCLUSIVE GROWTH
2
o India’s largest gold financing company (by loan portfolio)
o Trusted pan-India brand in the gold loans sector; revolutionised India’s gold banking
o Our intervention has empowered millions of people across the social pyramid
Gold Loans Money Transfer Services
White Label ATM
National Pension Scheme
CORE
SERVICE
OTHER
SERVICES
Collection Services
Wind Mill Power Generation
Multiple service offerings

MFIN - A GLIMPSE
3
27 States/Union territory presence
4,200+
Pan-India branches
23,000+
Team members
145 tonnes Gold jewellery kept as security
500,000+
Retail investor base across debenture and
subordinated debt portfolio
80,000+
Customers served every day
` 249,907 mn
Retail Loan Assets Under Management (As of December 31, 2015)

SHAREHOLDING PATTERN
4
NSE Ticker
MUTHOOTFIN
BSE Ticker
533398
Market Capitalisation (as on December 31, 2015)
` 71,509 million
Strong promoter interest in business with 75% stake
(%) Shareholding as on
December 31, 2015
74.82
23.88 1.30
Promoters & Relatives
FII, FC, MF & Others
Public

DIVIDEND PAYOUT
5
Delivering consistent returns to stakeholders (%)
FY 2016 FY 2015 FY 2014 FY 2013 FY 2012
Dividend (% )*
-
60 60 45 40
First Interim Dividend (%) 40 40 30 - -
Second Interim Dividend (%) - -
20 - -
Final Dividend (%) - 20 10 45 40
Dividend Payout Ratio (%) -
35.36 28.59 16.65 16.47
* On face value of ` 10 per equity share

GEOGRAPHICAL PRESENCE
6
A strong presence of 4259 branches across India
(%) Branches region wise State wise Branch Network
5
14
16
65 East West
North South
(As of December 31, 2015)
o Rural India accounts for about 65% of total
gold stock in the country
o Large portion of the rural population has
limited credit access
o Catering to under-served rural and semi-
urban markets through strong presence
Jammu & K ashmir 15
Himachal P r ad e sh
4 Pu n jab
169
Chandigarh 8
De l hi 223
R a ja s than 124
Guja r a t 168 Daman & Diu
01
Dad r a & Nagar H av eli 01
M a d h y a P r ad e sh 78
U t tar P r ad e sh 143
Bihar 16
U t ta r akhand 19 Har y ana
119
M aha r as h t r a 215
K arn a taka 429
Goa 15
T amil Nadu 919
P ondicherry 8
An d h r a P r ad e sh 356
T elangana 224
Chh a t tisgarh 14
Odisha 43
Jharkhand 19 W e s t
Bengal
133
K e r ala 792
Assam 4

SHAREHOLDER’S FUNDS
7
Dec-15 Sep-15 Jun-15 Mar-15 Dec-14 Growth Growth
(` in million) (` in million) (` in million) (` in million) (` in million) YoY (%) QoQ (%)
Share Capital 3,980 3,980 3,980 3,980 3,971 0 0
Reserves & Surplus 50,477 48,591 48,726 46,855 46,116 9 4
Total 54,457 52,571 52,706 50,835 50,087 9 4
Networth
Strong Capital Base

ASSETS
8
Dec-15 Sep-15 Jun-15 Mar-15 Dec-14 Growth Growth
(` in million) (` in million) (` in million) (` in million) (` in million) YoY (%) QoQ (%)
Gross retail loan assets
under management 249,907 248,734 244,089 234,085 220,882 13 0
Break-up of Gross Retail Loan Assets under management
Gold Loans under
management 249,409 248,250 243,605 233,499 220,117 13 0
Other loans 498 484 484 586 765 (35) 3
Gross retail loan assets under management
Core focus continues to be gold loan

LIABILITIES
Dec-15 Sep-15 Jun-15 Mar-15 Dec-14 Growth Growth
(` in million) (` in million) (` in million) (` in million) (` in million) YoY (%) QoQ (%)
Secured Non-Convertible
Debentures (Muthoot Gold Bonds) 45,980 50,629 56,095 59,839 64,375 (29) (9)
Secured Non-Convertible
Debentures- Listed 34,339 31,239 32,757 30,656 32,569 5 10
Borrowings from Banks/FIs 87,879 89,902 77,851 72,418 60,299 46 (2)
Subordinated Debt 22,889 23,355 23,932 24,309 24,815 (8) (2)
Subordinated Debt -Listed 2,878 2,518 2,518 2,229 2,229 29 14
Commercial Paper 2,405 8,820 6,855 0 4,005 (40) (73)
Other Loans 6,168 4,379 4,798 5,196 5,017 23 41
Total 202,538 210,842 204,806 194,647 193,309 5 (4)
Stable sources of funding
9
REVENUE & PROFIT
10
9M FY
2016 9M FY
2015
YoY
Growth
(%)
Q3 FY
2016 Q3 FY
2015
YoY
Growth
(%)
Q2 FY
2016 Q1 FY
2016
QoQ
Growth
(%) FY 2015
INCOME
Interest Income 33,782 31,831 6 11,248 10,541 7 11,254 11,280 0 42,703
Other Income 455 397 15 164 152 8 145 146 13 543
Total 34,237 32,228 6 11,412 10,693 7 11,399 11,426 0 43,246
EXPENDITURE
Interest Expense 16,938 15,731 8 5,616 5,292 6 5,652 5,670 (1) 21,064
Personnel Expenses 4,812 4,727 2 1,582 1,627 (3) 1,623 1,607 (3) 6,304
Administrative & Other
expenses 3,182 3,145 1 1,050 1,102 (5) 1,108 1,024 (5) 4,210
Provisions & Write Offs 325 155 110 74 35 111 145 106 (49) 371
Directors
Remuneration 146 144 1 49 48 2 49 48 0 192
Depreciation 417 620 (33) 142 212 (33) 139 136 2 826
Total 25,820 24,522 5 8,513 8,316 2 8,716 8,591 (2) 32,967
PROFIT
Profit Before Tax 8,417 7,706 9 2,898 2,376 22 2,684 2,835 8 10,279
Profit After Tax 5,443 5,053 8 1,866 1,544 21 1,745 1,832 7 6,705
Profit & Loss Statement (` in million)

Gold Loan Assets Under Management (` in million)
GOLD LOAN PORTFOLIO
11
Gaining scale over the years
6,431 7,569 14,201 21,790
33,001 73,417
157,281
244,173
260,004
216,179
220,117
233,499
243,605
248,250
249,409
0
50,000
100,000
150,000
200,000
250,000
300,000
Mar-05 Mar-06 Mar-07 Mar-08 Mar-09 Mar-10 Mar-11 Mar-12 Mar-13 Mar-14 Dec-14 Mar-15 Jun-15 Sep-15 Dec-15
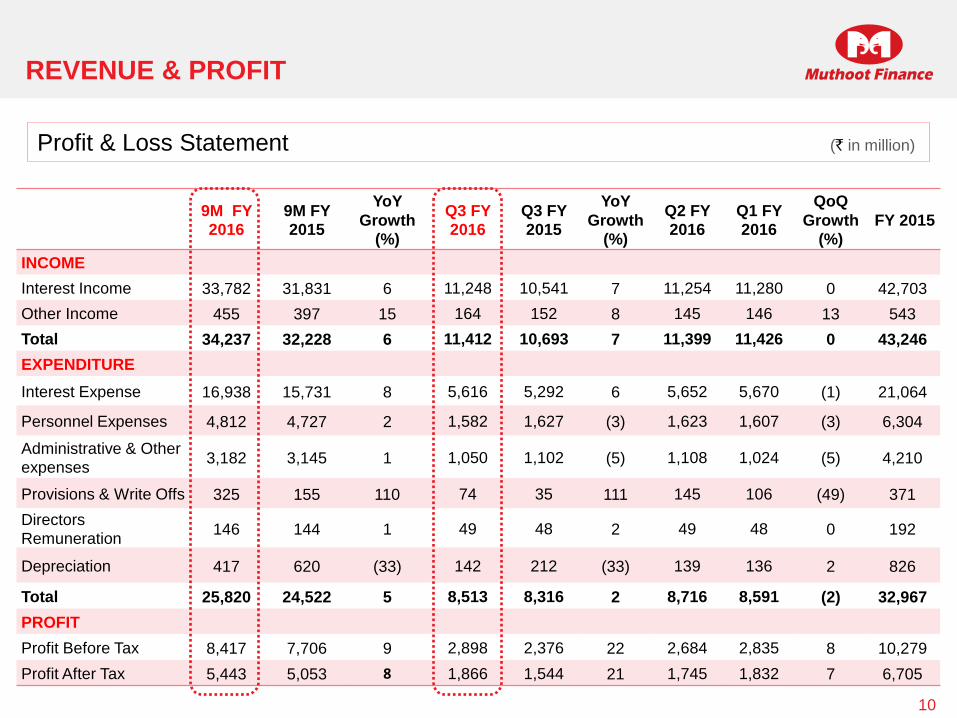
GOLD HOLDING
12
Carrying the trust of millions of our customers
Gold jewellery kept as security (In tonnes)
15 16 23
30
39
66
112
137 134
118 123
131 138 144 145
0
20
40
60
80
100
120
140
160
Mar-05 Mar-06 Mar-07 Mar-08 Mar-09 Mar-10 Mar-11 Mar-12 Mar-13 Mar-14 Dec-14 Mar-15 Jun-15 Sep-15 Dec-15

Diversified gold loan portfolio across India (%)
GEOGRAPHICAL SPREAD OF GOLD LOAN PORTFOLIO
13
Mar-07 Mar-08 Mar-09 Mar-10 Mar-11 Mar-12 Mar-13 Mar-14 Dec-14 Mar-15 Jun-15 Sep-15 Dec-15
East 0 1 1 2 3 4 5 6 6 6 6 6 6
West 3 4 5 8 8 10 11 13 15 15 15 16 16
North 13 13 14 15 15 17 19 22 22 22 22 22 22
South 84 82 80 75 74 69 65 59 57 57 57 56 56
0
20
40
60
80
100
Mar-07 Mar-08 Mar-09 Mar-10 Mar-11 Mar-12 Mar-13 Mar-14 Dec-14 Mar-15 Jun-15 Sep-15 Dec-15
14,201 21,790 33,001 73,417 157,281 244,173 260,004 216,179 220,117 233,499 243,605 248,250 249,409
Gold Loan Assets Under Management (` in million)

PRODUCTIVITY
14
Average Gold Loan Per Branch (` in million)
17.24 17.40
25.77 30.82
33.50
45.74
57.55
66.39
63.69
50.63 51.72
55.01
57.43
58.43
58.56
15
25
35
45
55
65
75
Mar-05 Mar-06 Mar-07 Mar-08 Mar-09 Mar-10 Mar-11 Mar-12 Mar-13 Mar-14 Dec-14 Mar-15 Jun-15 Sep-15 Dec-15
Widening presence with increasing gold loan business per branch

RETURN ON AVERAGE RETAIL LOAN ASSET
15
Yearly (%) Quarterly (%)
Attractive returns over the years
3.94
3.46
3.49
4.21
4.24
4.40
4.05
3.22
3.03
2.50
2.75
3.00
3.25
3.50
3.75
4.00
4.25
4.50
Mar-07Mar-08Mar-09Mar-10Mar-11Mar-12Mar-13Mar-14Mar-15
2.99
2.80 2.83
3.06 2.97
3.09
2.50
2.75
3.00
3.25
3.50
3.75
4.00
4.25
4.50
Q3 FY 2016 Q3 FY 2015 Q2 FY 2016 Q1 FY 2016 9M FY 2016 9M FY 2015

NON-PERFORMING ASSETS & BAD DEBTS
16
Dec-15 Sep-15 Jun-15 Mar-15 Dec-14
Gross Non-Performing Assets 6,319 6,341 5,195 5,117 4,103
Provision For Non-Performing
Assets 857 857 752 725 725
Net Non-Performing Assets 5,462 5,484 4,443 4,392 3,378
% of Gross NPA on Gross Retail
Loans 2.53 2.55 2.13 2.19 1.86
% of Net NPA on Gross Retail
Loans 2.19 2.20 1.82 1.88 1.53
Non-Performing Assets (` in million)
Bad Debts (` in million)
Q3 FY 2016 Q3 FY 2015 Q2 FY 2016 Q1 FY 2016 9M FY 2016 9M FY 2015 FY 2015
Bad Debts Written Off 19 20 22 30 71 123 192
Dec-15 Sep-15 Jun-15 Mar-15 Dec-14
Provision (` in million) 1,267 1,212 1,194 1,145 997
% of Provision to Standard Assets 0.52 0.50 0.50 0.50 0.46
Standard Asset Provision
Generally NPA will not result into bad debts as collateral can be auctioned
Maintaining a higher standard asset provision of 0.50% as against the regulatory requirement of 0.25%

LIABILITY MIX
17
Maintaining a diversified funding profile
(%)
(As of December 31, 2015)
17
23
Secured Non-Convertible Debentures (Muthoot Gold Bonds) – 45,980 mn (23%)
Secured Non-Convertible Debentures – Listed – 34,339 mn (17%)
Borrowings from Banks/Fis - 87,879 mn (44%)
Subordinated Debt – 22,889 mn (11%)
Subordinated Debt – Listed - 2,878 mn (1%)
Commercial Paper – 2,405 mn (1%)
Other Loans – 6,168 mn (3%)
44
11
1 3
`
`
` `
`
`
`
1

CREDIT RATINGS
18
Amt of rating Rating Indicates
(` in million)
COMMERCIAL PAPER
CRISIL 40,000 CRISIL A1+ Degree of safety with regard to timely payment of
interest & principal on the instrument is very strong
ICRA 2,000 ICRA A1+ Lowest credit risk & Stronger credit quality
BANK LOANS
ICRA* 88,270 ICRA A1+ Lowest credit risk & Stronger credit quality
Long-term Rating
Amt of rating Rating Indicates
(` in million)
SUBORDINATED DEBT
CRISIL 1,000 CRISIL AA-(Stable) High Degree of safety with regard to timely servicing of
financial obligations and carry very low credit risk
ICRA 1,000 ICRA AA-(Stable) High Degree of safety with regard to timely servicing of
financial obligations and carry very low credit risk
NON CONVERTIBLE DEBENTURE
CRISIL 5,000 CRISIL AA-(Stable) High Degree of safety with regard to timely servicing of
financial obligations and carry very low credit risk
ICRA 2,000 ICRA AA-(Stable) High Degree of safety with regard to timely servicing of
financial obligations and carry very low credit risk
BANK LOANS
ICRA* 79,860 ICRA AA-(Stable) High Degree of safety with regard to timely servicing of
financial obligations and carry very low credit risk
Short-term Rating
Highest Rating among gold loan companies
*Within the overall rating of `11,1340 millions

Interest Income (` in million)
BREAK-UP OF GROSS INCOME
19
Other Income (` in million)
11,248 10,541 11,254 11,280
33,782 31,831
0
10,000
20,000
30,000
40,000
50,000
60,000
Q3 FY 2016 Q3 FY 2015 Q2 FY 2016 Q1 FY 2016 9M FY 2016 9M FY 2015
2,236 3,579 6,062 10,775
22,983
45,280
53,641 49,077 42703
0
10,000
20,000
30,000
40,000
50,000
60,000
Mar-07 Mar-08 Mar-09 Mar-10 Mar-11 Mar-12 Mar-13 Mar-14 Mar-15
104 107 142 119 175
210 230
397
544
0
100
200
300
400
500
600
Mar-07 Mar-08 Mar-09 Mar-10 Mar-11 Mar-12 Mar-13 Mar-14 Mar-15
164 152 145 146
455
397
0
100
200
300
400
500
600
Q3 FY 2016 Q3 FY 2015 Q2 FY 2016 Q1 FY 2016 9M FY 2016 9M FY 2015
Yearly Quarterly
Yearly Quarterly
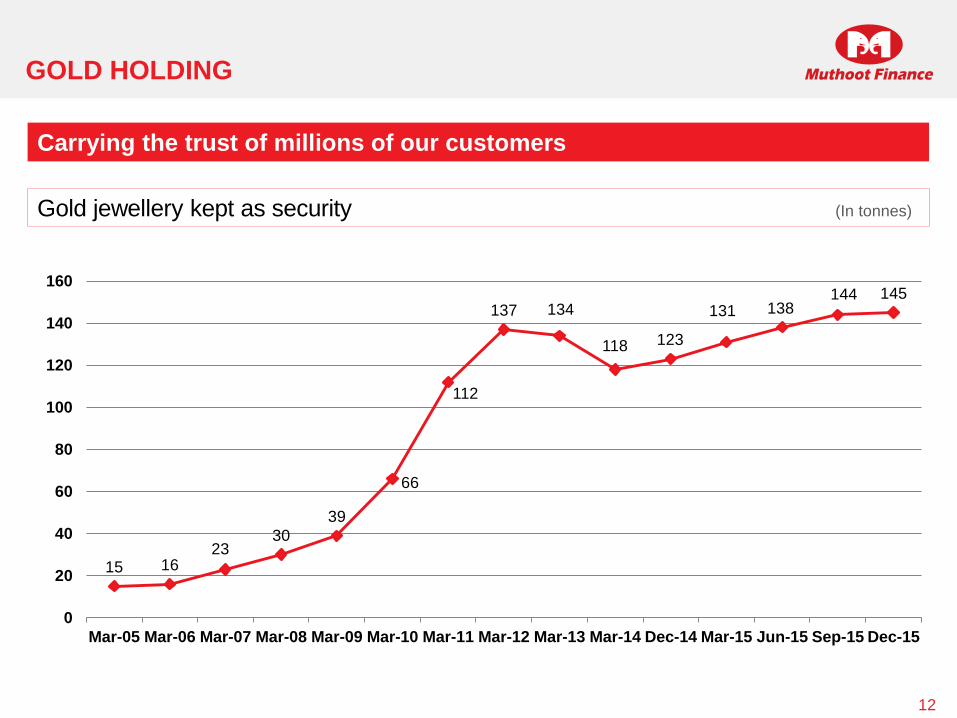
OPERATING EXPENSES TO AVERAGE RETAIL LOANS
20
5.38
4.59
5.45
4.72
4.28
4.02 4.08
4.46
5.01
3.50
4.00
4.50
5.00
5.50
6.00
Mar-07 Mar-08 Mar-09 Mar-10 Mar-11 Mar-12 Mar-13 Mar-14 Mar-15
4.42
5.09
4.75 4.66 4.62
4.99
3.50
4.00
4.50
5.00
5.50
6.00
Q3 FY 2016 Q3 FY 2015 Q2 FY 2016 Q1 FY 2016 9M FY 2016 9M FY 2015
Operational efficiency over the years
Yearly (%) Quarterly (%)

BREAK-UP OF OPERATING EXPENSES
Mar-15 Mar-14 Mar-13 Mar-12 Mar-11 Mar-10 Mar-09 Q3 FY
2016
Q3 FY
2015
Q2 FY
2016
Q1 FY
2016
9M FY
2016
9M FY
2015
Personnel Expenses 6,304 5,917 5,453 4,145 2,209 1,169 677 1,582 1,627 1,623 1,607 4,812 4,727
Rent 1,650 1,542 1,309 1,042 603 290 131 429 412 432 415 1,276 1,226
Advertisement 651 702 579 866 647 331 208 129 197 180 168 477 494
Postage, Telegram and
Telephone 371 364 243 184 115 72 27 87 85 111 84 282 277
Traveling and Conveyance 212 190 175 168 114 67 42 46 55 49 47 142 162
Printing and Stationery 160 185 168 155 111 69 44 32 39 36 38 106 112
Repairs and Maintenance 281 272 256 341 211 96 62 64 75 85 74 223 198
Legal and Professional
Charges 189 216 86 60 114 34 16 20 23 19 40 79 162
Business Promotion
Expense 140 279 332 267 119 45 25 39 54 41 22 102 85
Directors Remuneration 192 192 192 192 192 192 121 49 48 49 48 146 144
Depreciation and
Amortisation Expenses 841 475 454 329 180 149 99 146 217 143 140 429 632
Others 733 731 550 380 229 165 165 219 177 173 162 554 540
Provision For Standard &
NPA Assets 180 214 765 351 323 21 7 55 15 123 76 254 32
Total 11,904 11,279 10,562 8,480 5,165 2,701 1,625 2,897 3,024 3,064 2,921 8,882 8,791
Yearly (` in Millions) Quarterly (` in Million)
21

PROFITABILITY
22
Profitability at a glance (` in million)
Efforts getting rewarded
670 970
1,482
3,456
7,612
13,312
15,114
11,936
10,279
440 636
977 2,276
4,942
8,920
10,042
7,801
6,705
0
2,000
4,000
6,000
8,000
10,000
12,000
14,000
16,000
Mar-07 Mar-08 Mar-09 Mar-10 Mar-11 Mar-12 Mar-13 Mar-14 Mar-15
2,898 2,376
2,684 2,835
8,417
7,706
1,866
1,544 1,745 1,832
5,443 5,053
0
2,000
4,000
6,000
8,000
10,000
12,000
14,000
16,000
Q3 FY 2016 Q3 FY 2015 Q2 FY 2016 Q1 FY 2016 9M FY 2016 9M FY 2015
Yearly Quarterly PBT PAT PAT PBT

NET WORTH
23
Share Capital and Reserves & Surplus (` in million)
Steady capital position
1,598 2,234 3,712 5,845
13,344
29,257
37,356
42,646
50,087
50,835 52,706
52,571 54,457
0
10,000
20,000
30,000
40,000
50,000
60,000
Mar 07 Mar 08 Mar 09 Mar 10 Mar 11 Mar 12 Mar 13 Mar-14 Dec-14 Mar- 15 Jun-15 Sep-15 Dec-15

RETURN ON EQUITY
24
Return on Average Equity
Stable shareholder value creation
35.10 34.00
33.90
48.10
51.52
41.90
30.15
19.50 14.35
10
15
20
25
30
35
40
45
50
55
Mar 07Mar 08Mar 09Mar 10Mar 11Mar 12Mar 13Mar 14Mar 15
13.95 12.53 13.26 14.15 13.79 14.53
0
5
10
15
20
25
30
Q3 FY 2016Q3 FY 2015Q2 FY 2016Q1 FY 20169M FY 20169M FY 2015
Yearly (%) Quarterly (%)

CAPITAL RATIO
25
Dec-15 Sep-15 Jun-15 Mar-15 Dec-14
Capital Adequacy Ratio 23.37 22.97 24.15 24.78 26.26
Tier-I 19.94 19.25 19.76 19.96 20.74
Tier-II 3.43 3.72 4.38 4.82 5.52
Maintaining capital well above the statutory requirement
Capital Adequacy Ratio (%)

MARKET VALUE RATIO
26
Q3 FY 2016 Q2 FY 2016 Q1 FY 2016 FY 2015 Q3 FY 2015
Earnings per share (`)
- Basic 4.69 4.39 4.60 16.97 3.88
- Diluted 4.65 4.34 4.56 16.80 3.85
*Source: www.nseindia.com
**Based on trailing 12 months EPS
Equity market valuation ratios indicate potential for upside
Dec-15 Sep-15 Jun-15 Mar-15 Dec-14
Book Value per share (`) 136.70 131.95 132.29 127.59 126.00
Market price per share (`)* 179.65 164.20 202.05 207.05 192.35
Price to Earnings ratio** 10.07 9.64 11.93 12.20 10.88
Price to Book Value ratio 1.31 1.24 1.53 1.62 1.53

CAPITALISATION RATIOS
27
Dec-15 Sep-15 Jun-15 Dec-14 Mar-15
Outside Liabilities 226,938 238,084 229,251 213,848 216,857
Cash & Bank Balances 13,027 23,055 19,657 26,572 17,366
Tangible Networth 54,412 52,522 52,653 50,029 50,775
Capital Gearing 3.93 4.09 3.98 3.74 3.93
(` In million)
Headroom for further leveraging

TEAM STRENGTH
28
3,102
3,999 5,979
9,745
16,688
25,351
24,881
25,012
23,226
22,882
22,785
22,929
23,070
3,000
8,000
13,000
18,000
23,000
28,000
Mar-07 Mar-08 Mar-09 Mar-10 Mar-11 Mar-12 Mar-13 Mar-14 Dec-14 Mar-15 Jun-15 Sep-15 Dec-15
Groomed human capital over the years to meet growing business requirements
(No. of Employees)

OUR SUBSIDIARY
29

ASSET ASIA FINANCE PLC – AN OVERVIEW
30
Asia Asset Finance PLC, (AAF) Colombo, Sri Lanka became a foreign subsidiary of Muthoot Finance on
December 31, 2014 . As on March 31, 2015, total holding in AAF stood at 428 million equity shares
representing 51% of their total capital.
AAF is a Registered Financial Company based in Sri Lanka a fully licensed, deposit-taking institution
registered with the Central Bank of Sri Lanka and listed in the Colombo Stock Exchange
AAF is in lending business since 1970. At present the company is involved in Retail Finance, Hire Purchase
& Business Loans and has 15 branches across Sri Lanka.
The company formerly known as Finance and Land Sales has been in operation for over 45 years, evolving
to serve the growing needs of people of Sri Lanka.

PRODUCTS
31
o Fixed Deposits
o Leasing
o Business Loan
o Personal Loan
o Group Personal Loan
o Corporate Loans
o Mortgage Loans
o Factoring
o Short Term Loans
o Micro Finance
o Loan against Gold Jewellery

BRANCH NETWORK
32
AAF has operations in various parts of Sri Lanka providing the best services and
easy access to clients
FINANCIALS
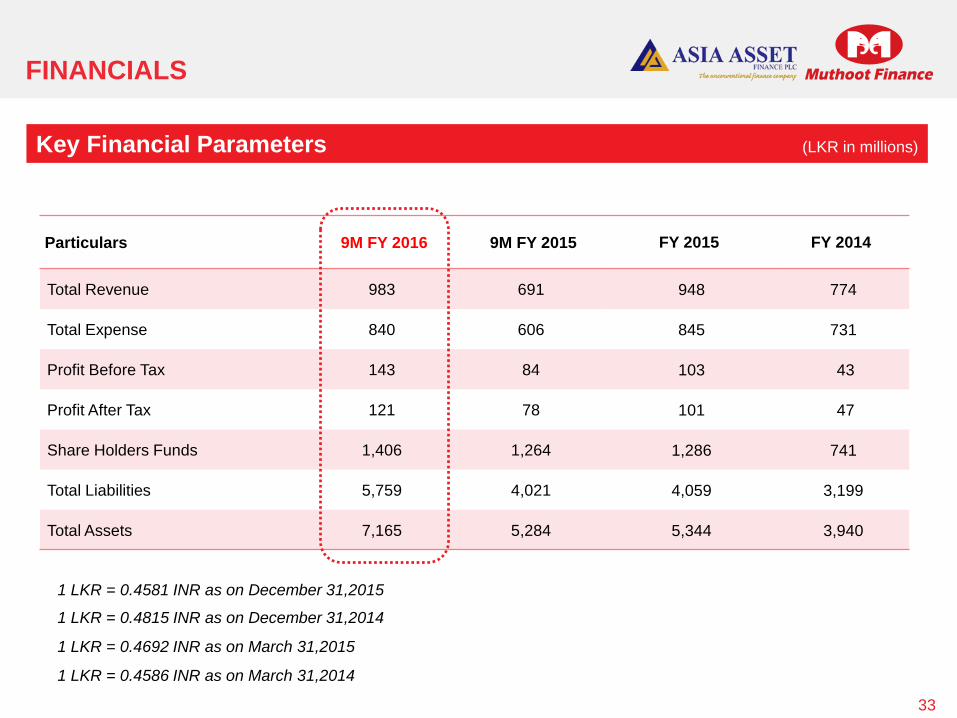
Particulars 9M FY 2016 9M FY 2015 FY 2015 FY 2014
Total Revenue 983 691 948 774
Total Expense 840 606 845 731
Profit Before Tax 143 84 103 43
Profit After Tax 121 78 101 47
Share Holders Funds 1,406 1,264 1,286 741
Total Liabilities 5,759 4,021 4,059 3,199
Total Assets 7,165 5,284 5,344 3,940
1 LKR = 0.4581 INR as on December 31,2015
33
Key Financial Parameters (LKR in millions)
1 LKR = 0.4692 INR as on March 31,2015
1 LKR = 0.4586 INR as on March 31,2014
1 LKR = 0.4815 INR as on December 31,2014

(Individual & Corporate Investors)
(Institutional Investors)
REGISTERED OFFICE
2nd Floor, Muthoot Chambers
Opposite Saritha Theatre Complex
Banerji Road, Kochi
Kerala – 682 018. India
Tel: (91484) 2394712
Fax: (91484) 2396506
www.muthootfinance.com
CIN: L65910KL1997PLC011300
RBI Reg No: N.16.00167