Embed Size (px)
Citation preview

Volume 06, NPHC2011
National Population and Housing Census 2011
(Village Development Committee/Municipality)
MUSTANG
Government of Nepal
National Planning Commission Secretariat
Central Bureau of Statistics
Kathmandu, Nepal
March, 2014


Preface
Central Bureau of Statistics (CBS) Nepal is pleased to bring out the series of results of the
National Population and Housing Census 2011 (NPHC 2011). The final result of this census
was disseminated in November 2012. Additional national level and disaggregated tables
are still under way to disseminate. In fact, the census has enormous potentiality of analyses
to be done on demographic, social, economic and spatial characteristics of the population.
This report contains statistical tables derived from the questions maintain in 'Form 2' which
is administered in sampling basis. Attempt has also been made herein to provide major
highlights of the result. I hope, this volume will be very useful and meet the demand of the
users related to the information on migration, fertility pattern of child bearing aged married
women and economic activities of the population aged 10 years and over. CBS always
welcomes comments and suggestions from users which would be valuable for the
improvement of our future publications.
On this occasion, I would like to thank Dr. Rudra Suwal, Chief of the Population Section of
the bureau for his valuable contribution in the census. I also would like to thank Director
Gyanendra Bajracharya and Statistical Officer Yadu Nath Acharya of the Section for their
contribution in the operation from preparatory works to the management of the field work,
data processing, data analysis, preparation and dissemination of the report. Hearty thanks
go to Computer Officer Dol Narayan Shrestha for his valuable contribution in preliminary
work of data processing, analysis and tabulation. I want to thank ex‐Director Damodar
Gnawali, Directors Indra Bahadur Karki and Mahesh Chand Pradhan, Statistical Officers Dina
Nath Lamsal, Sunil Kumar Shrestha and Statistical Assistant Bimal Bhattarai for handling
census administration and data processing. I also appreciate Statistical Officer Prakash
Pokharel and Cartographer Officer Damodar Dahal who sincerely fulfilled the responsibilities
mainly of logistics management and transportation of census materials to and from districts.
Director Shanker Lal Shrestha and a team of Computer Officers Lila Nath Pandey, Suresh
Prasad Kayastha, Shyam Prasad Neupane and Raju Pokhrel were devoted in data processing
and tabulation. Similarly, Directors of the GIS Section Pramod Raj Regmi and Shailendra
Ghimire, Statistical Officer Binod sharan Acharya and Computer Officer Puspa Poudel had
contributed in producing Enumeration Area (EA) maps. They all deserve special thanks.
I would like to thank Mr. Uttam Narayan Malla, the outgoing DG, for his overall guidance
and contribution in various census activities.
I would like to thank Mr. Suman Raj Aryal, DDG and Director Mr. Nebin Lal Shrestha who
contributed in various stages of the census operation particularly in data verification.
Also, I am thankful to Mr. Prabodh Sagar Dhakal, the then DDG, under‐secretaries of the
bureau, Ram Bahadur Ghimire, Krishna Rana and Jib Narayan Baral, and Section Officers

Narayan Bhandari, Kiran Raut, Shanker Khanal and Nayab Subba Rishi Kesh Timilsina who
did handle administrative, financial matters and census procurement. I would like to thank
all Census Officers, Area Supervisors, Supervisors, Enumerators, member of Census
Management Groups, staff of CBS and Branch Statistics Offices (BSOs) who were actively
engaged in the field work and other census activities. Also, I would like to thank all members
of District Census Coordination Committees led by respective Chief District Officer in all
districts for their contribution in successfully completing the challenging job of field
operation of the census.
Special thanks go to Siddhakali Offset Press who took responsibility of printing census
questionnaires and manuals. Also, HDNCG, PHDG & OBCI JV deserves special thanks for
undertaking the data procession operation.
I am grateful to all media including telecommunication centers (Nepal Telecom and NCELL)
and Civil bank who contributed in raising census awareness among the mass.
I would like to thank all school teachers, government staff of various ministries,
departments and offices and also university students who contributed in data collection and
supervision of the field work.
Also, I appreciate and would like to thank the members of the National Census 2011 Citizens
Observation Committee who did observe the fieldwork in all 75 districts.
I express my gratitude to UNFPA, UNWOMEN, JICA, UNDP, DANIDA, US Census Bureau and
other international experts who provided assistance in different stages of the census
operation.
Finally, I would like to thank all respondents who provided invaluable information during the
field operation and appreciate all those who had extended hands in this national endeavor
and helped to make the census a grand success.
March, 2014
Bikash Bista
Director General
Central Bureau of Statistics
Kathmandu, Nepal

Content Mustang
Table no. Title Page no.
1. Household Tables
Table 1.1: Households by ownership of house/housing unit In use ................................. 1
Table 1.2: Households by foundation of house/housing unit ........................................... 2
Table 1.3: Households by outer wall of house/housing unit ............................................. 3
Table 1.4: Households by roof of house/housing unit ...................................................... 4
Table 1.5: Households by source of drinking water .......................................................... 5
Table 1.6: Households by usual type of fuel used for cooking .......................................... 6
Table 1.7: Households by usual source of lighting ............................................................ 7
Table 1.8: Households by type of toilet ............................................................................. 8
Table 1.9: Households by types of household facilities .................................................... 9
Table 1.10: Absentee population and household ............................................................. 10
2. Individual Tables
Table 2.1: Households, population and average household size .................................... 11
Table 2.2: Population by 5 years age group and sex ....................................................... 12
Table 2.3: Population by caste/ethnicity and sex ............................................................ 15
Table 2.4: Population by mother tongue and sex ........................................................... 19
Table 2.5: Population by disability and sex ..................................................................... 22
Table 2.6: Population aged 5 years and above by literacy status and sex ...................... 24
Table 2.7: Population aged 5 years and above by educational attainment (level passed) and sex ............................................................................................................ 26
Table 2.8: Population aged 5 ‐ 25 years by school attendance and sex .......................... 29


Household Tables


MustangTable 1.1: Households by ownership of house/housing unit In use.
Owned Rented Institutional Others
Charang 132 121 7 1 3Chhonhup 202 191 4 7 0Chhoser 158 149 5 2 2Chhusang 168 116 30 3 19Ghami 169 154 12 1 2Jhong 85 65 19 1 0Jomsom 430 201 156 69 4Kagbeni 274 169 69 11 25Kobang 198 115 53 12 18Kunjo 174 135 10 8 21Lete 222 148 49 20 5Lomanthang 172 168 4 0 0Marpha 414 233 146 29 6Muktinath 198 140 26 0 32Surkhang 103 93 3 7 0Tukuche 206 80 113 11 2Total 3,305 2,278 706 182 139
Ownership of house/housing unitTotalV.D.C. / Municipality
1

MustangTable 1.2: Households by foundation of house/housing unit.
Mud bonded bricks/stone
Cement bonded
bricks/stone
RCC with pillar
Wooden pillar Others Not
Stated
Charang 132 130 0 0 0 0 2Chhonhup 202 201 0 0 0 0 1Chhoser 158 156 0 0 0 2 0Chhusang 168 164 2 0 1 0 1Ghami 169 167 0 0 0 0 2Jhong 85 83 0 0 0 0 2Jomsom 430 391 35 1 0 0 3Kagbeni 274 262 11 1 0 0 0Kobang 198 186 3 1 8 0 0Kunjo 174 154 7 0 5 5 3Lete 222 175 36 0 9 0 2Lomanthang 172 163 0 0 7 0 2Marpha 414 384 29 0 0 0 1Muktinath 198 177 20 0 1 0 0Surkhang 103 102 1 0 0 0 0Tukuche 206 202 2 0 0 0 2Total 3,305 3,097 146 3 31 7 21
VDC / Municipality Total
Type of foundation of house
2

MustangTable 1.3: Households by outer wall of house/housing unit.
Mud bonded bricks/stone
Cement bonded
bricks/stone
Wood/ planks Bamboo Unbaked
brick Others Not Stated
Charang 132 129 0 0 0 1 0 2Chhonhup 202 103 0 0 0 98 0 1Chhoser 158 39 0 0 0 118 1 0Chhusang 168 160 3 0 1 0 3 1Ghami 169 45 0 0 0 122 0 2Jhong 85 83 0 0 0 0 0 2Jomsom 430 377 49 0 0 0 1 3Kagbeni 274 253 18 1 0 0 1 1Kobang 198 181 8 9 0 0 0 0Kunjo 174 154 7 7 0 0 3 3Lete 222 142 62 8 8 0 0 2Lomanthang 172 3 0 0 0 167 0 2Marpha 414 288 118 4 0 1 1 2Muktinath 198 178 20 0 0 0 0 0Surkhang 103 44 1 0 0 58 0 0Tukuche 206 187 17 0 0 0 0 2Total 3,305 2,366 303 29 9 565 10 23
TotalVDC / Municipality
Type of outer wall
3
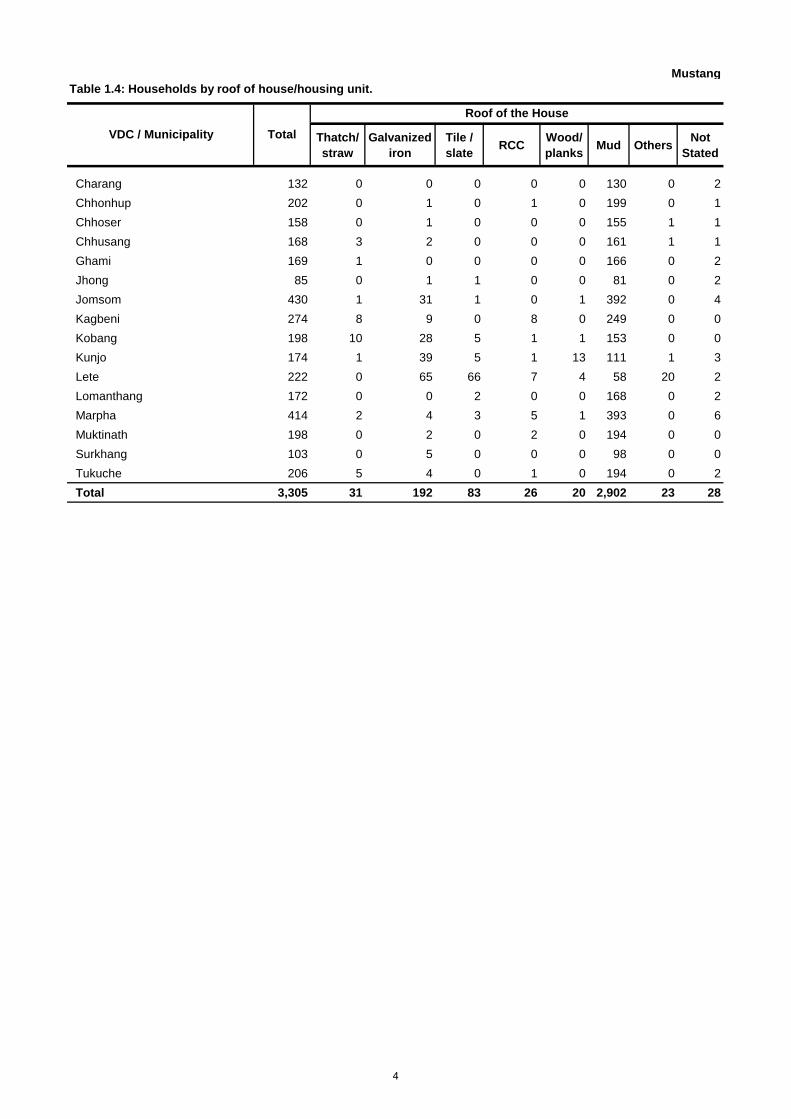
MustangTable 1.4: Households by roof of house/housing unit.
Thatch/ straw
Galvanized iron
Tile / slate RCC Wood/
planks Mud Others Not Stated
Charang 132 0 0 0 0 0 130 0 2Chhonhup 202 0 1 0 1 0 199 0 1Chhoser 158 0 1 0 0 0 155 1 1Chhusang 168 3 2 0 0 0 161 1 1Ghami 169 1 0 0 0 0 166 0 2Jhong 85 0 1 1 0 0 81 0 2Jomsom 430 1 31 1 0 1 392 0 4Kagbeni 274 8 9 0 8 0 249 0 0Kobang 198 10 28 5 1 1 153 0 0Kunjo 174 1 39 5 1 13 111 1 3Lete 222 0 65 66 7 4 58 20 2Lomanthang 172 0 0 2 0 0 168 0 2Marpha 414 2 4 3 5 1 393 0 6Muktinath 198 0 2 0 2 0 194 0 0Surkhang 103 0 5 0 0 0 98 0 0Tukuche 206 5 4 0 1 0 194 0 2Total 3,305 31 192 83 26 20 2,902 23 28
VDC / Municipality Total
Roof of the House
4

MustangTable 1.5: Households by main source of drinking water.
Tap/piped water
Tubewell / handpump
Covered well/kuwa
Uncovered well/kuwa
Spout water
River /stream Others Not Stated
Charang 132 130 0 0 0 0 1 0 1
Chhonhup 202 173 0 1 3 0 25 0 0
Chhoser 158 55 0 0 1 1 101 0 0
Chhusang 168 166 0 0 0 0 0 2 0
Ghami 169 112 0 0 0 26 29 0 2
Jhong 85 84 0 0 0 0 0 0 1
Jomsom 430 423 0 0 0 4 0 0 3
Kagbeni 274 268 0 0 0 3 3 0 0
Kobang 198 147 0 0 1 42 8 0 0
Kunjo 174 171 0 0 0 0 0 0 3
Lete 222 219 0 0 1 0 1 0 1
Lomanthang 172 170 0 0 0 0 0 0 2
Marpha 414 410 1 0 0 0 2 0 1
Muktinath 198 194 0 0 0 0 4 0 0
Surkhang 103 103 0 0 0 0 0 0 0
Tukuche 206 204 0 0 1 0 0 0 1
Total 3,305 3,029 1 1 7 76 174 2 15
VDC / Municipality Total householdMain source of drinking water
5

MustangTable 1.6: Households by usual type of fuel used for cooking
Wood / firewood Kerosene LP gas Santhi/ guitha
(cow dung) Bio gas Electricity Others Not Stated
Charang 132 0 4 3 124 0 0 0 1
Chhonhup 202 0 2 0 198 0 0 2 0
Chhoser 158 19 0 0 139 0 0 0 0
Chhusang 168 160 2 6 0 0 0 0 0
Ghami 169 35 0 0 131 0 0 1 2
Jhong 85 80 0 3 0 0 1 0 1
Jomsom 430 207 24 186 0 0 9 0 4
Kagbeni 274 117 8 149 0 0 0 0 0
Kobang 198 190 0 8 0 0 0 0 0
Kunjo 174 168 1 2 0 0 0 0 3
Lete 222 178 1 39 1 0 2 0 1
Lomanthang 172 0 0 8 162 0 0 0 2
Marpha 414 274 2 135 0 0 2 0 1
Muktinath 198 142 6 47 0 0 3 0 0
Surkhang 103 31 0 1 71 0 0 0 0
Tukuche 206 184 2 12 0 0 7 0 1
Total 3,305 1,785 52 599 826 0 24 3 16
Total householdVDC/ Municipality
Fuel usually used for cooking
6

MustangTable 1.7: Households by usual source of lighting.
Electricity Kerosene Bio gas Solar Others Not Stated
Charang 132 76 4 0 49 2 1Chhonhup 202 0 1 0 200 1 0Chhoser 158 1 2 0 151 4 0Chhusang 168 159 5 0 2 2 0Ghami 169 0 10 0 154 3 2Jhong 85 84 0 0 0 0 1Jomsom 430 424 2 0 0 0 4Kagbeni 274 254 6 0 14 0 0Kobang 198 180 14 0 0 4 0Kunjo 174 156 9 0 0 6 3Lete 222 215 6 0 0 0 1Lomanthang 172 0 0 0 170 0 2Marpha 414 408 4 0 1 0 1Muktinath 198 196 1 0 0 1 0Surkhang 103 1 1 0 101 0 0Tukuche 206 199 6 0 0 0 1Total 3,305 2,353 71 0 842 23 16
Total householdVDC/ Municipality
Fuel usually used for lighting
7
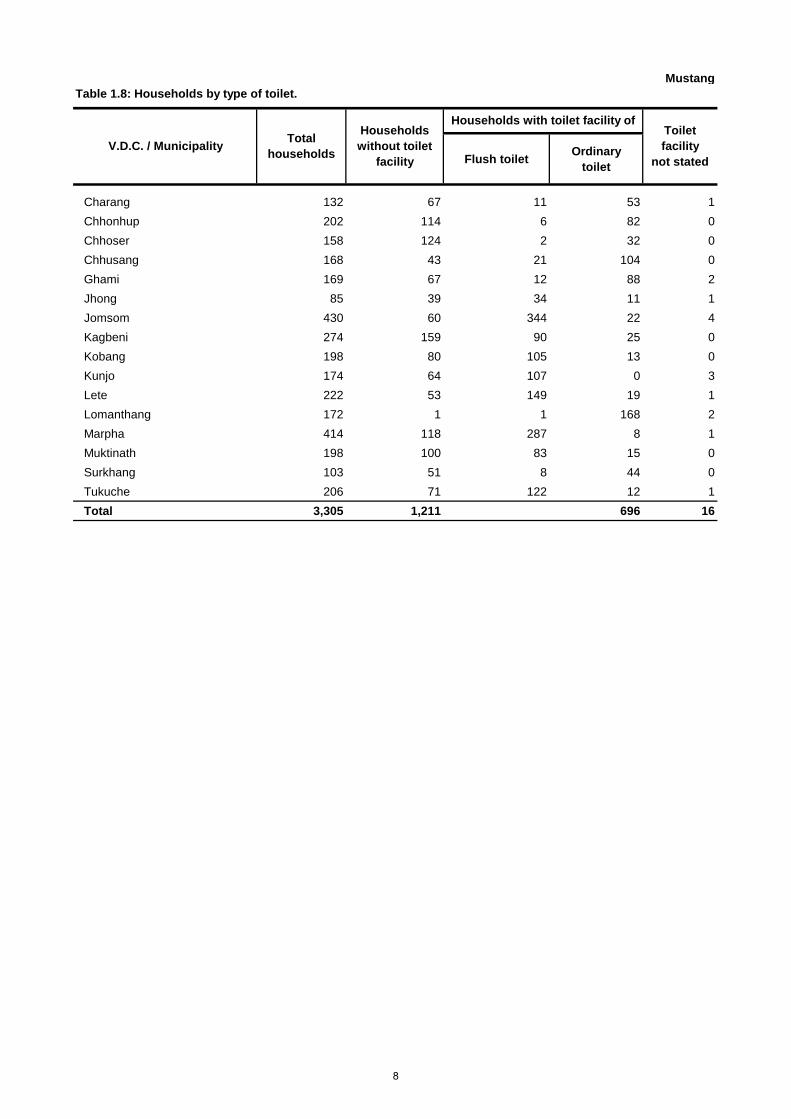
MustangTable 1.8: Households by type of toilet.
Flush toilet Ordinary toilet
Charang 132 67 11 53 1Chhonhup 202 114 6 82 0Chhoser 158 124 2 32 0Chhusang 168 43 21 104 0Ghami 169 67 12 88 2Jhong 85 39 34 11 1Jomsom 430 60 344 22 4Kagbeni 274 159 90 25 0Kobang 198 80 105 13 0Kunjo 174 64 107 0 3Lete 222 53 149 19 1Lomanthang 172 1 1 168 2Marpha 414 118 287 8 1Muktinath 198 100 83 15 0Surkhang 103 51 8 44 0Tukuche 206 71 122 12 1Total 3,305 1,211 696 16
Toilet facility
not statedV.D.C. / Municipality Total
households
Households without toilet
facility
Households with toilet facility of
8

MustangTable 1.9: Households by types of household facilities
Radio Television Cable Television Computer Internet Telephone Mobile
Phone Motor Motor- cycle Cycle Other
vehicleRefri-
gerator
Charang 132 16 116 59 10 4 0 0 5 0 1 0 0 93 0 0Chhonhup 202 34 168 77 6 4 0 0 20 144 2 1 0 27 0 0Chhoser 158 36 122 64 4 1 1 0 0 105 0 3 0 80 0 0Chhusang 168 21 147 115 21 20 2 0 6 113 2 3 1 5 2 0Ghami 169 35 132 76 10 0 1 0 10 0 1 1 0 111 0 2Jhong 85 6 79 32 6 22 4 0 0 78 0 8 0 14 4 0Jomsom 430 24 406 106 133 265 32 16 72 397 15 32 1 2 51 0Kagbeni 274 35 236 84 84 77 15 11 17 217 10 29 0 34 29 3Kobang 198 30 168 93 18 79 1 1 4 152 10 16 1 1 8 0Kunjo 174 35 135 77 63 40 1 0 1 115 0 3 0 0 0 4Lete 222 21 198 137 20 82 6 5 4 148 6 19 1 1 26 3Lomanthang 172 3 169 13 8 0 0 0 11 166 0 8 0 4 0 0Marpha 414 37 376 122 11 236 31 14 73 355 26 52 3 3 35 1Muktinath 198 18 179 81 41 93 3 1 12 159 10 33 0 3 26 1Surkhang 103 11 92 56 13 0 0 0 2 50 0 0 0 76 0 0Tukuche 206 36 169 45 3 110 4 0 3 154 6 16 2 1 21 1Total 3,305 398 2,892 1,237 451 1,033 101 48 240 2,353 89 224 9 455 202 15
Not statedArea Total
Without any
facility
At least one
facility
Household having facility of
9

MustangTable 1.10: Absentee population and household.
Total Male Female Sex Not Stated
Charang 132 52 93 53 40 0Chhonhup 202 77 115 83 32 0Chhoser 158 34 50 43 7 0Chhusang 168 70 114 73 41 0Ghami 169 69 128 87 41 0Jhong 85 44 104 61 43 0Jomsom 430 69 113 73 40 0Kagbeni 274 70 125 85 40 0Kobang 198 20 23 19 4 0Kunjo 174 52 55 54 1 0Lete 222 42 60 50 10 0Lomanthang 172 26 43 33 10 0Marpha 414 86 113 79 34 0Muktinath 198 71 151 103 48 0Surkhang 103 49 88 47 41 0Tukuche 206 40 50 43 7 0Total 3,305 871 1,425 986 439 0
Total household
Absent householdV.D.C. / Municipality
Absent population
10

Individual Tables


MustangTable 2.1: Households, population and average household size.
Total Male Female
TOTAL 3,354 13,452 7,093 6,359 4.01 111.54Charang 132 452 217 235 3.42 92.34Chhonhup 202 801 365 436 3.97 83.72Chhoser 158 529 227 302 3.35 75.17Chhusang 168 512 247 265 3.05 93.21Ghami 169 611 285 326 3.62 87.42Jhong 85 253 112 141 2.98 79.43Jomsom 430 1,370 702 668 3.19 105.09Kagbeni 274 937 461 476 3.42 96.85Kobang 198 727 378 349 3.67 108.31Kunjo 174 711 374 337 4.09 110.98Lete 222 839 441 398 3.78 110.80Lomanthang 172 569 276 293 3.31 94.20Marpha 414 1,551 839 712 3.75 117.84Muktinath 198 628 301 327 3.17 92.05Surkhang 103 360 180 180 3.50 100.00Tukuche 206 743 366 377 3.61 97.08Institutional 49 1,859 1,322 537 - -
V.D.C. / Municipality HouseholdPopulation Average
Household Size
Sex Ratio
11

MustangTable 2.2: Population by 5 years age group and sex.
00 - 04 05 - 09 10 - 14 15 - 19 20 - 24 25 - 29 30 - 34 35 - 39 40 - 44 45 - 49 50 - 54 55 - 59 60 - 64 65 - 69 70 - 74 75 +
TotalBoth Sex 13,452 864 1,004 1,148 1,101 1,112 1,456 1,086 1,024 942 770 750 604 519 432 353 287Male 7,093 417 518 579 537 564 849 608 558 535 422 411 307 260 221 176 131Female 6,359 447 486 569 564 548 607 478 466 407 348 339 297 259 211 177 156
CharangBoth Sex 452 32 31 4 17 26 54 38 41 25 48 41 33 23 17 15 7Male 217 16 15 0 7 12 32 16 19 10 20 17 20 11 13 6 3Female 235 16 16 4 10 14 22 22 22 15 28 24 13 12 4 9 4
ChhonhupBoth Sex 801 63 65 32 50 73 78 75 55 64 60 48 42 42 23 17 14Male 365 26 33 13 12 37 33 33 21 33 31 29 18 17 12 9 8Female 436 37 32 19 38 36 45 42 34 31 29 19 24 25 11 8 6
ChhoserBoth Sex 529 40 38 12 19 45 62 37 37 40 38 41 30 35 23 21 11Male 227 16 17 4 6 10 24 17 17 18 17 16 16 18 10 12 9Female 302 24 21 8 13 35 38 20 20 22 21 25 14 17 13 9 2
ChhusangBoth Sex 512 27 10 6 19 50 62 40 36 57 36 33 38 34 32 19 13Male 247 8 5 2 5 19 27 21 20 36 20 17 19 16 15 11 6Female 265 19 5 4 14 31 35 19 16 21 16 16 19 18 17 8 7
GhamiBoth Sex 611 52 41 15 23 46 61 42 56 51 53 54 42 25 24 18 8Male 285 24 19 5 6 26 24 23 27 24 23 32 18 14 11 7 2Female 326 28 22 10 17 20 37 19 29 27 30 22 24 11 13 11 6
JhongBoth Sex 253 16 6 6 11 24 33 15 22 20 15 20 11 15 12 13 14Male 112 6 3 1 2 8 18 6 10 14 7 9 6 7 3 6 6Female 141 10 3 5 9 16 15 9 12 6 8 11 5 8 9 7 8
JomsomBoth Sex 1,370 93 102 115 100 120 114 97 123 112 71 95 64 41 52 40 31Male 702 49 60 51 51 49 59 53 66 63 50 52 30 17 23 15 14Female 668 44 42 64 49 71 55 44 57 49 21 43 34 24 29 25 17
TotalAge groupsVDC/
Municipality and sex
12

Table 2.2: Population by 5 years age group and sex.
00 - 04 05 - 09 10 - 14 15 - 19 20 - 24 25 - 29 30 - 34 35 - 39 40 - 44 45 - 49 50 - 54 55 - 59 60 - 64 65 - 69 70 - 74 75 +Total
Age groupsVDC/ Municipality
and sex
KagbeniBoth Sex 937 77 39 21 62 77 87 79 89 81 66 56 60 42 41 34 26Male 461 39 22 9 25 39 40 36 43 47 41 35 25 23 18 12 7Female 476 38 17 12 37 38 47 43 46 34 25 21 35 19 23 22 19
KobangBoth Sex 727 58 57 71 65 47 60 63 61 62 29 41 18 23 24 21 27Male 378 23 26 44 27 21 39 33 31 33 24 17 10 11 14 12 13Female 349 35 31 27 38 26 21 30 30 29 5 24 8 12 10 9 14
KunjoBoth Sex 711 71 72 86 66 45 61 47 51 44 39 31 29 21 19 15 14Male 374 33 37 47 37 22 29 24 25 25 24 17 18 8 10 9 9Female 337 38 35 39 29 23 32 23 26 19 15 14 11 13 9 6 5
LeteBoth Sex 839 60 76 111 64 63 58 62 58 49 47 40 42 34 23 33 19Male 441 32 47 58 31 35 27 31 32 30 25 21 22 17 12 17 4Female 398 28 29 53 33 28 31 31 26 19 22 19 20 17 11 16 15
LomanthangBoth Sex 569 25 22 22 37 39 58 53 40 39 46 47 35 42 29 22 13Male 276 14 10 10 19 13 21 23 21 21 23 25 15 24 18 13 6Female 293 11 12 12 18 26 37 30 19 18 23 22 20 18 11 9 7
MarphaBoth Sex 1,551 108 117 123 154 154 151 119 102 100 96 95 54 63 43 35 37Male 839 64 57 51 75 82 83 64 59 59 50 62 34 33 24 22 20Female 712 44 60 72 79 72 68 55 43 41 46 33 20 30 19 13 17
MuktinathBoth Sex 628 38 23 22 31 57 66 66 59 52 38 39 36 24 41 19 17Male 301 14 9 11 12 29 31 32 31 27 20 18 17 12 20 10 8Female 327 24 14 11 19 28 35 34 28 25 18 21 19 12 21 9 9
SurkhangBoth Sex 360 31 30 1 10 35 32 27 38 34 25 27 22 20 12 7 9Male 180 18 15 1 5 13 12 17 23 14 11 14 8 14 8 4 3Female 180 13 15 0 5 22 20 10 15 20 14 13 14 6 4 3 6
13

Table 2.2: Population by 5 years age group and sex.
00 - 04 05 - 09 10 - 14 15 - 19 20 - 24 25 - 29 30 - 34 35 - 39 40 - 44 45 - 49 50 - 54 55 - 59 60 - 64 65 - 69 70 - 74 75 +Total
Age groupsVDC/ Municipality
and sex
TukucheBoth Sex 743 60 72 77 57 44 70 66 54 58 35 27 36 34 14 17 22Male 366 29 26 36 26 21 38 32 27 36 16 17 21 18 8 5 10Female 377 31 46 41 31 23 32 34 27 22 19 10 15 16 6 12 12
InstitutionalBoth Sex 1,859 13 203 424 316 167 349 160 102 54 28 15 12 1 3 7 5Male 1,322 6 117 236 191 128 312 147 86 45 20 13 10 0 2 6 3Female 537 7 86 188 125 39 37 13 16 9 8 2 2 1 1 1 2
14

MustangTable 2.3 : Population by caste/ethnicity and sex
Total Male Female
CharangAll Caste 452 217 235Chhetree 434 203 231Others 18 14 4
ChhonhupAll Caste 801 365 436Magar 25 18 7Thakuri 38 17 21Lhopa 714 316 398Others 24 14 10
ChhoserAll Caste 529 227 302Gurung 131 51 80Lhopa 391 171 220Others 7 5 2
ChhusangAll Caste 512 247 265Chhetree 16 12 4Brahman - Hill 15 9 6Magar 13 5 8Tamang 23 17 6Kami 26 13 13Gurung 38 16 22Thakali 367 166 201Others 14 9 5
GhamiAll Caste 611 285 326Rai 11 7 4Kulung 12 12 0Lhopa 567 254 313Others 21 12 9
JhongAll Caste 253 112 141Magar 16 9 7Gurung 213 91 122Others 24 12 12
JomsomAll Caste 1370 702 668Chhetree 56 37 19Brahman - Hill 94 73 21Magar 167 94 73Tamang 88 35 53Newar 29 17 12Kami 146 70 76Rai 12 5 7Gurung 244 113 131Damai/Dholi 44 20 24Thakuri 14 7 7Sarki 15 11 4Sherpa 24 19 5
VDC/Municipality and caste/ethnicity
15

Table 2.3 : Population by caste/ethnicity and sex
Total Male FemaleVDC/Municipality and
caste/ethnicity
Thakali 403 184 219Badi 21 7 14Others 13 10 3
KagbeniAll Caste 937 461 476Chhetree 24 14 10Brahman - Hill 28 23 5Magar 26 14 12Tamang 12 6 6Kami 22 12 10Gurung 683 322 361Thakuri 24 9 15Sherpa 23 14 9Thakali 63 31 32Others 32 16 16
KobangAll Caste 727 378 349Chhetree 36 18 18Brahman - Hill 16 13 3Magar 118 67 51Tamang 26 20 6Kami 74 38 36Gurung 17 11 6Damai/Dholi 72 36 36Thakali 312 144 168Others 25 14 11Dalit Others 31 17 14
KunjoAll Caste 711 374 337Chhetree 19 10 9Brahman - Hill 12 10 2Magar 85 56 29Kami 248 118 130Rai 12 9 3Damai/Dholi 115 51 64Thakali 187 100 87Chhantyal/Chhantel 28 16 12Others 5 4 1
LeteAll Caste 839 441 398Chhetree 47 27 20Brahman - Hill 41 36 5Magar 147 75 72Newar 17 9 8Kami 84 42 42Gurung 20 10 10Damai/Dholi 72 36 36Limbu 12 8 4Sarki 26 11 15Thakali 310 153 157Chhantyal/Chhantel 37 18 19Others 26 16 10
16

Table 2.3 : Population by caste/ethnicity and sex
Total Male FemaleVDC/Municipality and
caste/ethnicity
LomanthangAll Caste 569 276 293Lhopa 559 268 291Others 10 8 2
MarphaAll Caste 1551 839 712Chhetree 68 42 26Brahman - Hill 74 60 14Magar 122 64 58Tharu 22 14 8Tamang 51 24 27Newar 20 13 7Kami 223 121 102Rai 21 12 9Gurung 148 66 82Damai/Dholi 151 80 71Sarki 17 12 5Sherpa 14 13 1Thakali 544 272 272Others 76 46 30
MuktinathAll Caste 628 301 327Brahman - Hill 25 19 6Magar 33 14 19Tamang 13 8 5Kami 48 27 21Gurung 476 214 262Thakali 14 7 7Others 19 12 7
SurkhangAll Caste 360 180 180Gurung 332 162 170Chhantyal/Chhantel 11 8 3Others 17 10 7
TukucheAll Caste 743 366 377Chhetree 41 23 18Brahman - Hill 29 19 10Magar 158 83 75Tamang 11 7 4Kami 145 63 82Gurung 23 10 13Damai/Dholi 48 16 32Sherpa 23 13 10Thakali 228 114 114Others 37 18 19
InstitutionalAll Caste 1859 1322 537Chhetree 200 187 13Brahman - Hill 128 120 8Magar 202 170 32
17

Table 2.3 : Population by caste/ethnicity and sex
Total Male FemaleVDC/Municipality and
caste/ethnicity
Tharu 20 17 3Tamang 63 50 13Newar 40 34 6Kami 53 39 14Rai 20 14 6Gurung 554 307 247Damai/Dholi 30 17 13Thakuri 25 19 6Sarki 12 12 0Sherpa 12 5 7Bhote 51 20 31Thakali 105 60 45Lhopa 276 194 82Others 46 38 8Dalit Others 22 19 3
18
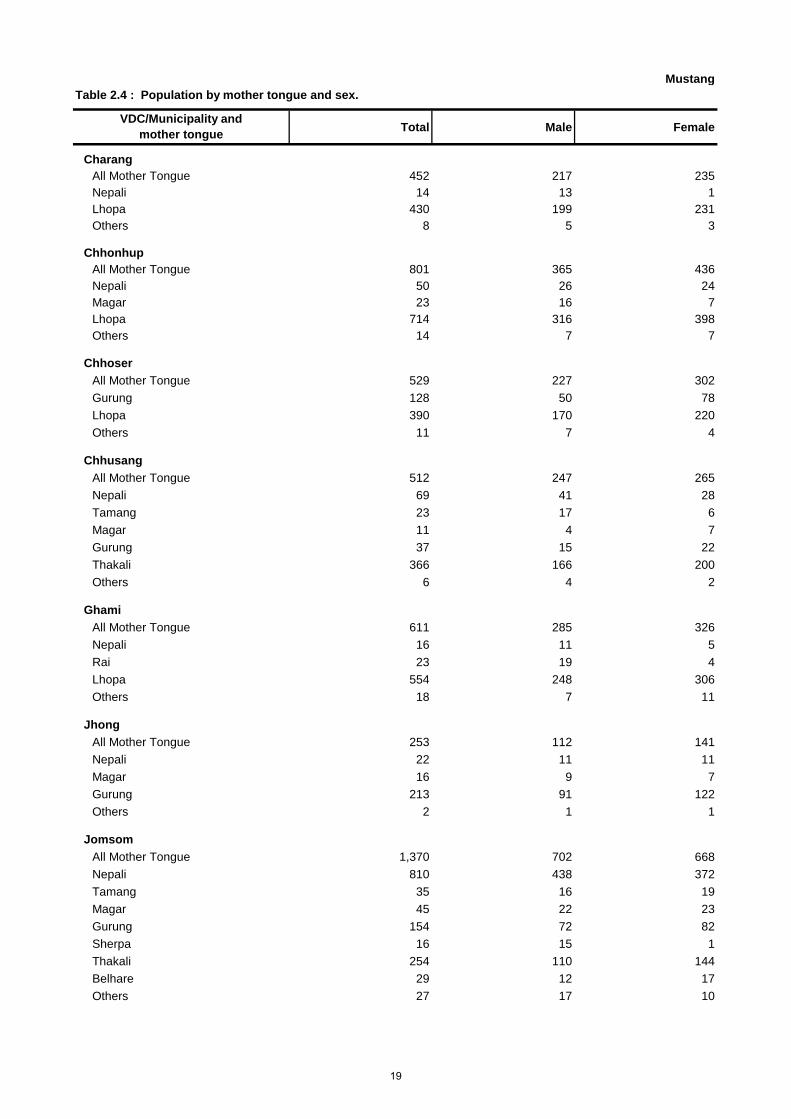
MustangTable 2.4 : Population by mother tongue and sex.
Total Male Female
CharangAll Mother Tongue 452 217 235Nepali 14 13 1Lhopa 430 199 231Others 8 5 3
ChhonhupAll Mother Tongue 801 365 436Nepali 50 26 24Magar 23 16 7Lhopa 714 316 398Others 14 7 7
ChhoserAll Mother Tongue 529 227 302Gurung 128 50 78Lhopa 390 170 220Others 11 7 4
ChhusangAll Mother Tongue 512 247 265Nepali 69 41 28Tamang 23 17 6Magar 11 4 7Gurung 37 15 22Thakali 366 166 200Others 6 4 2
GhamiAll Mother Tongue 611 285 326Nepali 16 11 5Rai 23 19 4Lhopa 554 248 306Others 18 7 11
JhongAll Mother Tongue 253 112 141Nepali 22 11 11Magar 16 9 7Gurung 213 91 122Others 2 1 1
JomsomAll Mother Tongue 1,370 702 668Nepali 810 438 372Tamang 35 16 19Magar 45 22 23Gurung 154 72 82Sherpa 16 15 1Thakali 254 110 144Belhare 29 12 17Others 27 17 10
VDC/Municipality and mother tongue
19

Table 2.4 : Population by mother tongue and sex.
Total Male FemaleVDC/Municipality and
mother tongue
KagbeniAll Mother Tongue 937 461 476Nepali 151 80 71Gurung 672 321 351Sherpa 27 17 10Thakali 60 30 30Others 27 13 14
KobangAll Mother Tongue 727 378 349Nepali 529 271 258Tamang 14 13 1Thakali 136 64 72Kham 18 10 8Others 30 20 10
KunjoAll Mother Tongue 711 374 337Nepali 697 364 333Others 14 10 4
LeteAll Mother Tongue 839 441 398Nepali 606 330 276Magar 36 19 17Thakali 166 72 94Others 31 20 11
LomanthangAll Mother Tongue 569 276 293Lhopa 557 268 289Others 12 8 4
MarphaAll Mother Tongue 1,551 839 712Nepali 981 543 438Maithili 17 8 9Tamang 13 7 6Magar 13 7 6Gurung 44 18 26Thakali 437 222 215Others 46 34 12
MuktinathAll Mother Tongue 628 301 327Nepali 113 65 48Tamang 11 6 5Magar 20 9 11Gurung 471 212 259Others 13 9 4
SurkhangAll Mother Tongue 360 180 180Nepali 20 12 8Gurung 329 160 169Others 11 8 3
20

Table 2.4 : Population by mother tongue and sex.
Total Male FemaleVDC/Municipality and
mother tongue
TukucheAll Mother Tongue 743 366 377Nepali 467 227 240Magar 78 38 40Gurung 12 4 8Sherpa 14 10 4Thakali 148 77 71Others 24 10 14
InstitutionalAll Mother Tongue 1,859 1,322 537Nepali 861 710 151Tamang 15 10 5Magar 53 43 10Gurung 531 286 245Thakali 54 35 19Tibetan 16 8 8Lhopa 275 193 82Others 54 37 17
21

MustangTable 2.5 : Population by disability and sex.
Physical Blindness/ low vision
Deaf / hard to hearing
Deaf – blind
Speech problem
Mental disable
Intellectual disable
Multiple disable
TotalBoth Sex 13,452 13,000 100 64 105 5 78 33 23 44Male 7,093 6,870 50 32 55 2 36 13 11 24Female 6,359 6,130 50 32 50 3 42 20 12 20
CharangBoth Sex 452 441 4 0 3 0 4 0 0 0Male 217 210 2 0 1 0 4 0 0 0Female 235 231 2 0 2 0 0 0 0 0
ChhonhupBoth Sex 801 784 4 4 4 0 0 1 2 2Male 365 356 3 1 2 0 0 1 1 1Female 436 428 1 3 2 0 0 0 1 1
ChhoserBoth Sex 529 491 8 17 2 0 2 7 0 2Male 227 208 4 9 1 0 1 3 0 1Female 302 283 4 8 1 0 1 4 0 1
ChhusangBoth Sex 512 482 1 4 14 0 1 6 1 3Male 247 233 0 1 6 0 0 4 0 3Female 265 249 1 3 8 0 1 2 1 0
GhamiBoth Sex 611 557 12 8 20 1 8 3 0 2Male 285 266 10 1 6 0 1 0 0 1Female 326 291 2 7 14 1 7 3 0 1
JhongBoth Sex 253 248 2 0 0 0 1 2 0 0Male 112 107 2 0 0 0 1 2 0 0Female 141 141 0 0 0 0 0 0 0 0
JomsomBoth Sex 1,370 1,345 11 2 2 2 5 0 0 3Male 702 695 3 1 1 0 1 0 0 1Female 668 650 8 1 1 2 4 0 0 2
KagbeniBoth Sex 937 918 3 1 3 1 4 1 2 4Male 461 457 0 1 0 1 2 0 0 0Female 476 461 3 0 3 0 2 1 2 4
KobangBoth Sex 727 679 7 5 16 0 16 3 0 1Male 378 357 1 2 12 0 4 1 0 1Female 349 322 6 3 4 0 12 2 0 0
KunjoBoth Sex 711 649 5 3 10 0 23 2 2 17Male 374 337 2 2 8 0 15 0 1 9Female 337 312 3 1 2 0 8 2 1 8
Population having disability ofTotal
population
Population without
disability
VDC/Muni-cipality and sex
22

Table 2.5 : Population by disability and sex.
Physical Blindness/ low vision
Deaf / hard to hearing
Deaf – blind
Speech problem
Mental disable
Intellectual disable
Multiple disable
Population having disability ofTotal
population
Population without
disability
VDC/Muni-cipality and sex
LeteBoth Sex 839 810 3 2 19 0 0 2 0 3Male 441 423 2 2 11 0 0 1 0 2Female 398 387 1 0 8 0 0 1 0 1
LomanthangBoth Sex 569 561 5 2 1 0 0 0 0 0Male 276 271 3 1 1 0 0 0 0 0Female 293 290 2 1 0 0 0 0 0 0
MarphaBoth Sex 1,551 1,522 6 5 5 0 3 3 6 1Male 839 822 3 4 3 0 1 1 4 1Female 712 700 3 1 2 0 2 2 2 0
MuktinathBoth Sex 628 615 4 3 2 0 3 0 1 0Male 301 293 3 2 0 0 2 0 1 0Female 327 322 1 1 2 0 1 0 0 0
SurkhangBoth Sex 360 339 12 5 2 1 1 0 0 0Male 180 169 5 3 2 1 0 0 0 0Female 180 170 7 2 0 0 1 0 0 0
TukucheBoth Sex 743 719 8 0 2 0 7 2 1 4Male 366 356 3 0 1 0 4 0 0 2Female 377 363 5 0 1 0 3 2 1 2
InstitutionalBoth Sex 1,859 1,840 5 3 0 0 0 1 8 2Male 1,322 1,310 4 2 0 0 0 0 4 2Female 537 530 1 1 0 0 0 1 4 0
23

MustangTable 2.6: Population aged 5 years and above by literacy status and sex
Can read & write
Can read only
Can't read & write
TotalBoth Sex 12,588 8,334 305 3,945 4 66.21Male 6,676 5,034 139 1,502 1 75.40Female 5,912 3,300 166 2,443 3 55.82
CharangBoth Sex 420 133 18 269 0 31.67Male 201 82 8 111 0 40.80Female 219 51 10 158 0 23.29
ChhonhupBoth Sex 738 328 15 395 0 44.44Male 339 192 8 139 0 56.64Female 399 136 7 256 0 34.09
ChhoserBoth Sex 489 220 3 266 0 44.99Male 211 122 0 89 0 57.82Female 278 98 3 177 0 35.25
ChhusangBoth Sex 485 256 17 212 0 52.78Male 239 146 5 88 0 61.09Female 246 110 12 124 0 44.72
GhamiBoth Sex 559 261 11 287 0 46.69Male 261 147 6 108 0 56.32Female 298 114 5 179 0 38.26
JhongBoth Sex 237 123 0 114 0 51.90Male 106 61 0 45 0 57.55Female 131 62 0 69 0 47.33
JomsomBoth Sex 1,277 967 34 276 0 75.72Male 653 558 16 79 0 85.45Female 624 409 18 197 0 65.54
KagbeniBoth Sex 860 480 20 359 1 55.81Male 422 281 9 132 0 66.59Female 438 199 11 227 1 45.43
KobangBoth Sex 669 475 57 135 2 71.00Male 355 275 27 52 1 77.46Female 314 200 30 83 1 63.69
KunjoBoth Sex 640 456 6 178 0 71.25Male 341 266 2 73 0 78.01Female 299 190 4 105 0 63.55
Population who arePopulation aged 5 years & above
Literacy not
stated
VDC/ Municipality
and sex
Literacy rate
24
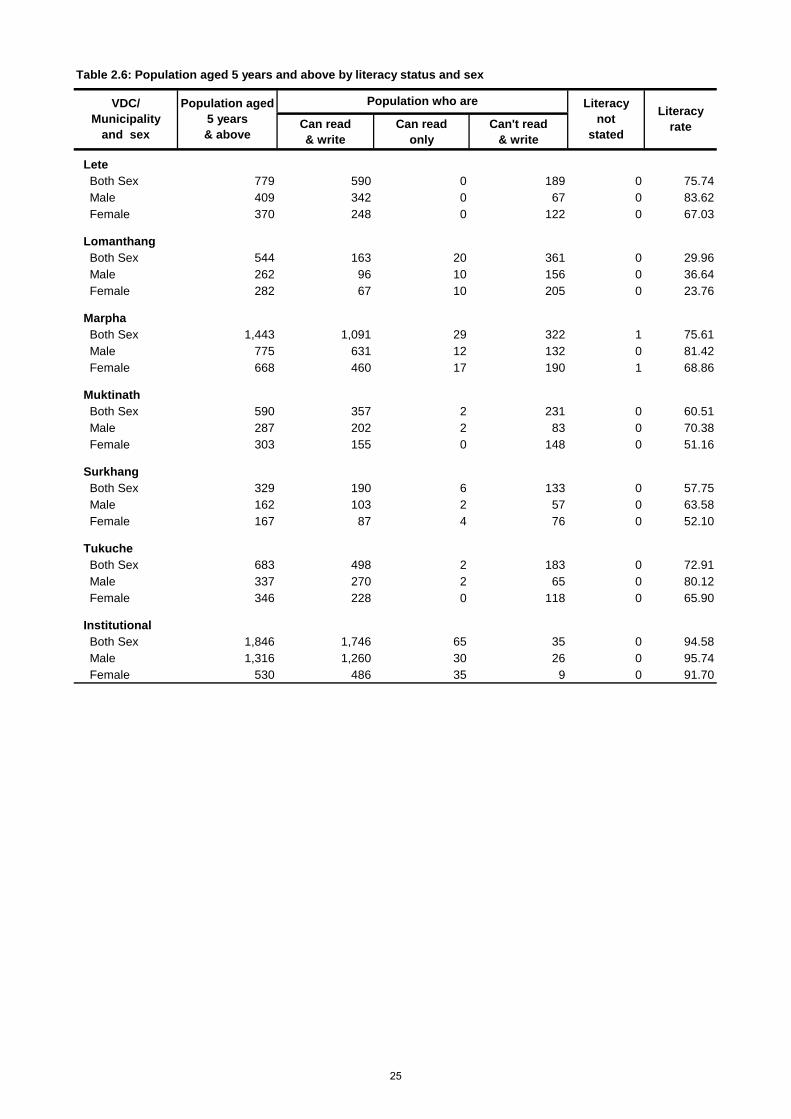
Table 2.6: Population aged 5 years and above by literacy status and sex
Can read & write
Can read only
Can't read & write
Population who arePopulation aged 5 years & above
Literacy not
stated
VDC/ Municipality
and sex
Literacy rate
LeteBoth Sex 779 590 0 189 0 75.74Male 409 342 0 67 0 83.62Female 370 248 0 122 0 67.03
LomanthangBoth Sex 544 163 20 361 0 29.96Male 262 96 10 156 0 36.64Female 282 67 10 205 0 23.76
MarphaBoth Sex 1,443 1,091 29 322 1 75.61Male 775 631 12 132 0 81.42Female 668 460 17 190 1 68.86
MuktinathBoth Sex 590 357 2 231 0 60.51Male 287 202 2 83 0 70.38Female 303 155 0 148 0 51.16
SurkhangBoth Sex 329 190 6 133 0 57.75Male 162 103 2 57 0 63.58Female 167 87 4 76 0 52.10
TukucheBoth Sex 683 498 2 183 0 72.91Male 337 270 2 65 0 80.12Female 346 228 0 118 0 65.90
InstitutionalBoth Sex 1,846 1,746 65 35 0 94.58Male 1,316 1,260 30 26 0 95.74Female 530 486 35 9 0 91.70
25

MustangTable 2.7: Population aged 5 years and above by educational attainment (level passed) and sex.
Beginner Primary (1-5)
Lower secondary
(6 -8)
Secondary (9 -10)
S.L.C. & equiv.
Inter- mediate & equiv.
Graduate & equiv.
Post Graduate equiv. & above Others
TotalBoth Sex 8,451 275 3,650 1,631 721 836 509 208 51 73 471 26Male 5,099 148 2,038 987 470 578 354 178 44 66 220 16Female 3,352 127 1,612 644 251 258 155 30 7 7 251 10
CharangBoth Sex 136 3 80 25 7 10 5 3 0 1 1 1Male 82 0 43 18 5 9 3 3 0 0 1 0Female 54 3 37 7 2 1 2 0 0 1 0 1
ChhonhupBoth Sex 331 4 180 45 13 27 5 0 0 0 57 0Male 194 2 97 28 11 22 3 0 0 0 31 0Female 137 2 83 17 2 5 2 0 0 0 26 0
ChhoserBoth Sex 240 19 125 41 17 11 5 5 0 4 13 0Male 131 9 57 20 10 11 5 5 0 4 10 0Female 109 10 68 21 7 0 0 0 0 0 3 0
ChhusangBoth Sex 258 0 141 39 23 23 11 0 0 6 13 2Male 148 0 74 27 17 11 7 0 0 5 6 1Female 110 0 67 12 6 12 4 0 0 1 7 1
GhamiBoth Sex 268 13 138 41 11 12 1 0 0 0 51 1Male 149 5 81 29 8 9 1 0 0 0 15 1Female 119 8 57 12 3 3 0 0 0 0 36 0
JhongBoth Sex 123 0 66 23 2 16 14 0 0 1 0 1Male 61 0 32 7 1 11 9 0 0 1 0 0Female 62 0 34 16 1 5 5 0 0 0 0 1
VDC/Municipality and sex Total
Population that have completed the educational level ofNon-formal education
Level not stated
26
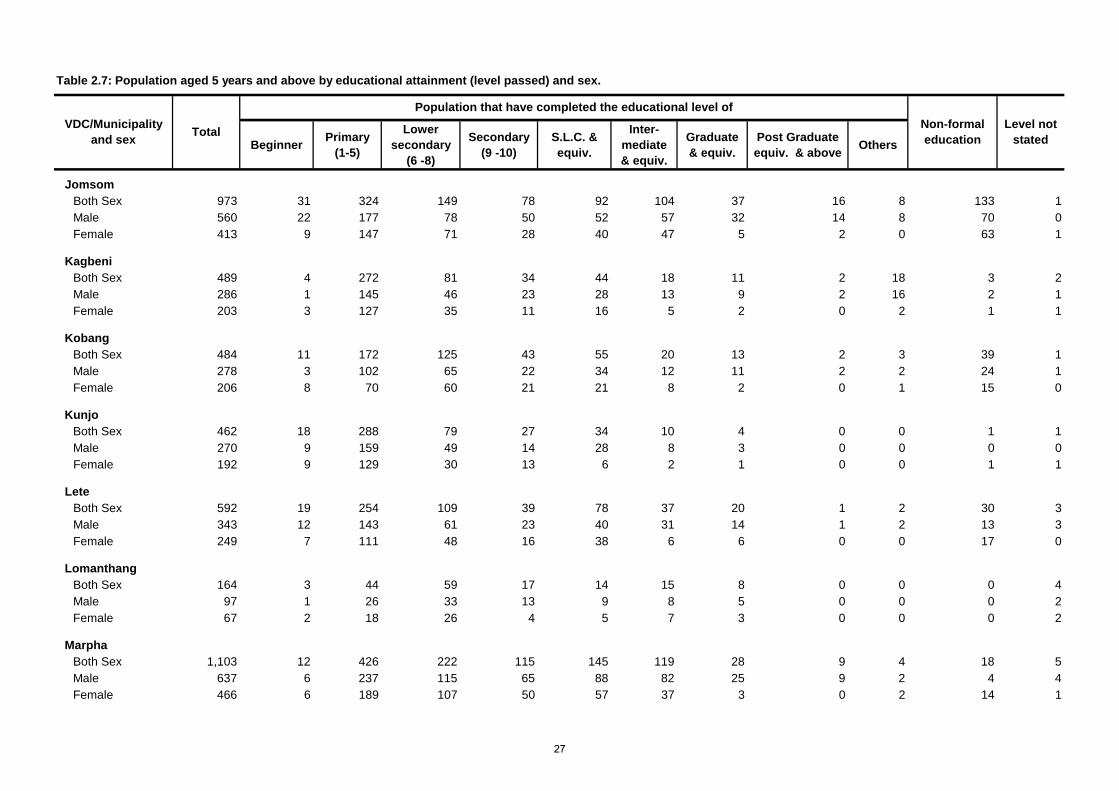
Table 2.7: Population aged 5 years and above by educational attainment (level passed) and sex.
Beginner Primary (1-5)
Lower secondary
(6 -8)
Secondary (9 -10)
S.L.C. & equiv.
Inter- mediate & equiv.
Graduate & equiv.
Post Graduate equiv. & above Others
VDC/Municipality and sex Total
Population that have completed the educational level ofNon-formal education
Level not stated
JomsomBoth Sex 973 31 324 149 78 92 104 37 16 8 133 1Male 560 22 177 78 50 52 57 32 14 8 70 0Female 413 9 147 71 28 40 47 5 2 0 63 1
KagbeniBoth Sex 489 4 272 81 34 44 18 11 2 18 3 2Male 286 1 145 46 23 28 13 9 2 16 2 1Female 203 3 127 35 11 16 5 2 0 2 1 1
KobangBoth Sex 484 11 172 125 43 55 20 13 2 3 39 1Male 278 3 102 65 22 34 12 11 2 2 24 1Female 206 8 70 60 21 21 8 2 0 1 15 0
KunjoBoth Sex 462 18 288 79 27 34 10 4 0 0 1 1Male 270 9 159 49 14 28 8 3 0 0 0 0Female 192 9 129 30 13 6 2 1 0 0 1 1
LeteBoth Sex 592 19 254 109 39 78 37 20 1 2 30 3Male 343 12 143 61 23 40 31 14 1 2 13 3Female 249 7 111 48 16 38 6 6 0 0 17 0
LomanthangBoth Sex 164 3 44 59 17 14 15 8 0 0 0 4Male 97 1 26 33 13 9 8 5 0 0 0 2Female 67 2 18 26 4 5 7 3 0 0 0 2
MarphaBoth Sex 1,103 12 426 222 115 145 119 28 9 4 18 5Male 637 6 237 115 65 88 82 25 9 2 4 4Female 466 6 189 107 50 57 37 3 0 2 14 1
27
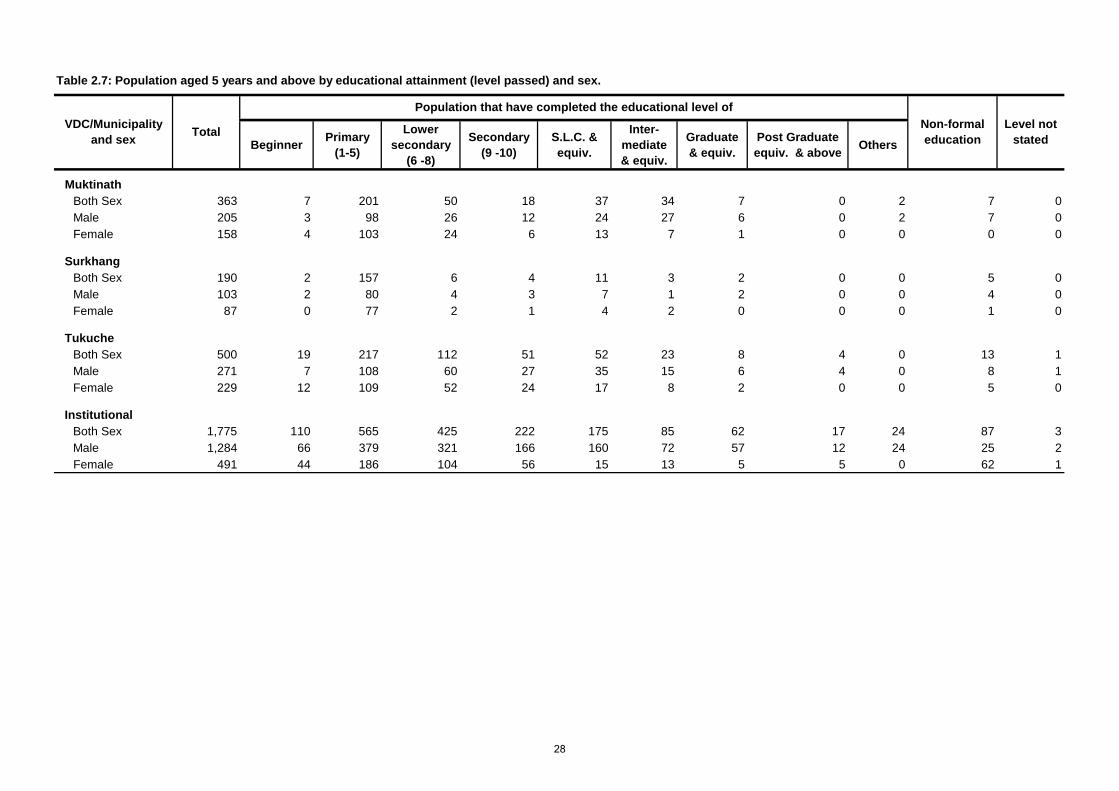
Table 2.7: Population aged 5 years and above by educational attainment (level passed) and sex.
Beginner Primary (1-5)
Lower secondary
(6 -8)
Secondary (9 -10)
S.L.C. & equiv.
Inter- mediate & equiv.
Graduate & equiv.
Post Graduate equiv. & above Others
VDC/Municipality and sex Total
Population that have completed the educational level ofNon-formal education
Level not stated
MuktinathBoth Sex 363 7 201 50 18 37 34 7 0 2 7 0Male 205 3 98 26 12 24 27 6 0 2 7 0Female 158 4 103 24 6 13 7 1 0 0 0 0
SurkhangBoth Sex 190 2 157 6 4 11 3 2 0 0 5 0Male 103 2 80 4 3 7 1 2 0 0 4 0Female 87 0 77 2 1 4 2 0 0 0 1 0
TukucheBoth Sex 500 19 217 112 51 52 23 8 4 0 13 1Male 271 7 108 60 27 35 15 6 4 0 8 1Female 229 12 109 52 24 17 8 2 0 0 5 0
InstitutionalBoth Sex 1,775 110 565 425 222 175 85 62 17 24 87 3Male 1,284 66 379 321 166 160 72 57 12 24 25 2Female 491 44 186 104 56 15 13 5 5 0 62 1
28

MustangTable 2.8: Population aged 5 - 25 years by school attendence and sex .
Male Female Male Female Male Female Male Female
Total 2,086 2,094 1,361 1,233 704 840 21 21Charang 41 45 8 18 33 26 0 1Chhonhup 97 133 42 46 54 87 1 0Chhoser 40 86 19 28 21 57 0 1Chhusang 35 52 8 5 27 45 0 2Ghami 58 76 24 38 33 36 1 2Jhong 13 31 4 10 8 19 1 2Jomsom 191 186 128 129 61 57 2 0Kagbeni 93 108 36 28 55 78 2 2Kobang 110 113 71 64 36 48 3 1Kunjo 143 131 101 80 40 48 2 3Lete 150 129 117 89 32 40 1 0Lomanthang 48 71 25 21 20 47 3 3Marpha 233 256 141 162 88 93 4 1Muktinath 44 67 18 26 25 40 1 1Surkhang 35 45 18 14 17 30 0 1Tukuche 96 132 64 90 32 42 0 0Institutional 659 433 537 385 122 47 0 1
VDC/Municipality Currently going to school Not currently going to school Attendence not stated
Population who arePopulation aged 5-25 years
29


![Narayan Shrestha [Step wise multi-criteria performance evaluation of rainfall-runoff models using WETSPRO]](https://img.dokumen.tips/doc/110x75/559f618b1a28ab7a528b47dc/narayan-shrestha-step-wise-multi-criteria-performance-evaluation-of-rainfall-runoff-models-using-wetspro.jpg)


![Narayan Shrestha [Radar based rainfall estimation for river catchment modelling]](https://img.dokumen.tips/doc/110x75/554a3921b4c90582328b49a3/narayan-shrestha-radar-based-rainfall-estimation-for-river-catchment-modelling.jpg)