Embed Size (px)
DESCRIPTION
Mustafa Cayci INFS 795 An Evaluation on Feature Selection for Text Clustering. Introduction. Text Clustering is the problem of automatically assigning predefined categories to free text documents Effective and Efficient Information Retrieval Organized Results - PowerPoint PPT Presentation
Citation preview

Mustafa CayciINFS 795
An Evaluation on Feature Selection for Text Clustering
)log(11
jk
G
jjk
G
k
k pxpNA
Entropy

Introduction
Text Clustering is the problem of automatically assigning predefined categories to free text documents
– Effective and Efficient Information Retrieval– Organized Results– Generating Taxonomy and Ontology
Text or document is represented as a bag of words.

Introduction
The major problem of this approach is the high dimensionality of the feature space.
The feature space is consists of the unique terms that occur in documents which can be in tens or hundreds of thousands of terms.
This is prohibitively high for many learning algorithms.

Introduction
High dimensionality of feature space is a challenge for clustering algorithms because of the inherent data sparseness.
Concept of proximity or clustering may not be meaningful in high dimensional feature space.
The solution is to reduce the feature space dimensionality.

Feature Selection
Feature selection methods include the removal of non-informative terms.
The focus of this presentation is the evaluation and comparison of feature selection methods in the reduction of a high dimensional feature space in text clustering problems.

Feature Selection
What are the strengths and weakness of existing feature selection methods applied to text clustering?
To what extend can feature selection improve the accuracy of a classifier?
How much of the document vocabulary can be reduced without losing useful information in category prediction?

Feature Selection Methods
Give brief introduction on several feature selection methods
– Information Gain (IG)– Χ2 Statistics (CHI)– Document Frequency– Term Strength (TS)– Entropy-based Ranking– Term Contribution

Information Gain (IG)
Information gain is frequently employed as a term-goodness criterion in the field of machine learning.
It measures the number of bits of information obtained for category prediction by knowing the presence or absence of a term in a document.

Information Gain (IG)
Let {ci}i = 1m denote the set of categories in the
target space The information gain of term t is defined to be: G(t) = - Σi = 1
m Pr(ci)logPr(ci) +
Pr(t) Σi = 1m Pr(ci|t) log Pr(ci|t) +
Pr(t-) Σi = 1m Pr(ci|t-) log Pr(ci|t-)

Information Gain (IG)
Given a training corpus, for each unique term, information gain is computed, and removed from the feature space those terms whose information gain was less than some predetermined threshold.
The computation includes the estimation of the conditional probabilities of a category given a term, and entropy computations.
The probability estimation has a time complexity of O(N) and space complexity of O(VN) where N is the number of training documents and V is the vocabulary size.

Χ2 Statistics (CHI)
The Χ2 statistic measures the lack of independence between t and c and can be compared to Χ2
distribution with one degree freedom. Using contingency table of a term t and a category c,
where A is the number of times t and c co-occur, B is the number of time the t occurs without c, C is the number of times c occurs without t, D is the number of times neither c nor t occurs and N is the total number of documents, the term-goodness measure is

Χ2 Statistics (CHI)
The Χ2 statistics has a natural value of zero if t and c are independent.
For each category of Χ2 statistic between each unique term in a training corpus and that category
Χ2avg (t) = Σ Pr(ci) Χ2 (t, ci)

Document Frequency (DF)
Document frequency is the number of documents in which a term occurs.
Document frequency is computed for each unique term in the training corpus and removed from the feature space those terms whose DF is less than some predetermined threshold.
Rare terms are either non-informative for category prediction, or not influential in global performance.
Observation: Low DF terms are assumed to be relatively informative and should not be removed aggressively.

Term Strength (TS)
Term strength is originally proposed and evaluated by Wilbur and Sirotkin for vocabulary reduction in text retrieval.
This methods estimates term importance based on how commonly a term is likely to appear in “closely-related” documents.
It uses a training set of documents to derive documents pairs whose similarity is above threshold.
Term strength is then computed based on the estimated conditional probability that a term occurs in the second half of a pair of related documents given that it occurs in the first half.

Entropy Based Ranking
Consider each feature Fi as a random variable while fi as its value. From entropy theory, entropy is:
E(F1,…,FM) = - Σf1 … ΣfM p(f1, …,fM) log(p(f1, …,fM) where p(f1, …,fM) is the probability or density at
the point f1, …,fM.
If the probability is uniformly distributed and we are most certain about the outcome, then entropy is maximum.

Entropy Based Ranking When the data has well-formed clusters, the uncertainty
is low so is the entropy. In the real-world data, there are few cases that the
clusters are well-formed. Two points belonging to the same cluster or 2 different
clusters will contribute to the total entropy less that if they were uniformly separated.
Similarity Si1,i2 between two instances Xi1 and Xi2 is high if the 2 instance are very close and Si1,i2 is low if the 2 are far away. Entropy Ei1,i2 will be low if Si1,i2 is either high or low, and Ei1,i2 will be low otherwise.

Entropy Based Ranking
where Si,i is the similarity value between document di and dj and dj * Si, j is defined as follows: Si, j = e – α x disti,j α = - ln(0.5) / dist
where disti,j is the distance between the document di and dj after the term t is removed
N
i
N
j jijijiji SxSSxStE1 1 ,,,, )1log()1()log()(

Term Contribution
Text clustering is highly dependent on the documents similarity.
Sim(di , dj ) = Σ f(t, di) x f(t, dj)
where f(t, di) represents the weight of term t in document d
tf * idf is also represents the weight of a term in document d where tf is term frequency and idf is the inverse document frequency

Term Contribution
The contribution of each term is the overall contribution to documents’ similarities and shown by the following equation:
TC(t) = Σ f(t, di) x f(t, dj)

Experiments
The supervised feature selection methods are evaluated
– IG– CHI
The unsupervised feature selection methods are evaluated
– DF– TS– TC

Experiments
K-Means algorithm is chosen to perform the actual clustering
Entropy and Precision measures are used to evaluate the clustering performance
10 sets of initial centroids are chosen randomly
Before performing clustering, tf * idf (with “ltc” scheme) is used to calculate the weight of each term.

Performance Measure
Entropy– Entropy measures the uniformity or purity of a
cluster. The Entropy for all clusters is defined by the weighted sum of the entropy for all clusters
where
)log(11
jk
G
jjk
G
k
k pxpNA
Entropy
|)}(|{|1jii
kjk cdlabeld
AP

Performance Measure
Precision– For each cluster, choose the class labels which
shares most documents in a cluster becomes the final class label
– The final precision is defined as the weighted sum of the precision for all clusters
|)})(|{max(|1)( jii cdlabeldA
AP
)(Pr'
1k
G
k
k AecisionNA
P
Data Sets
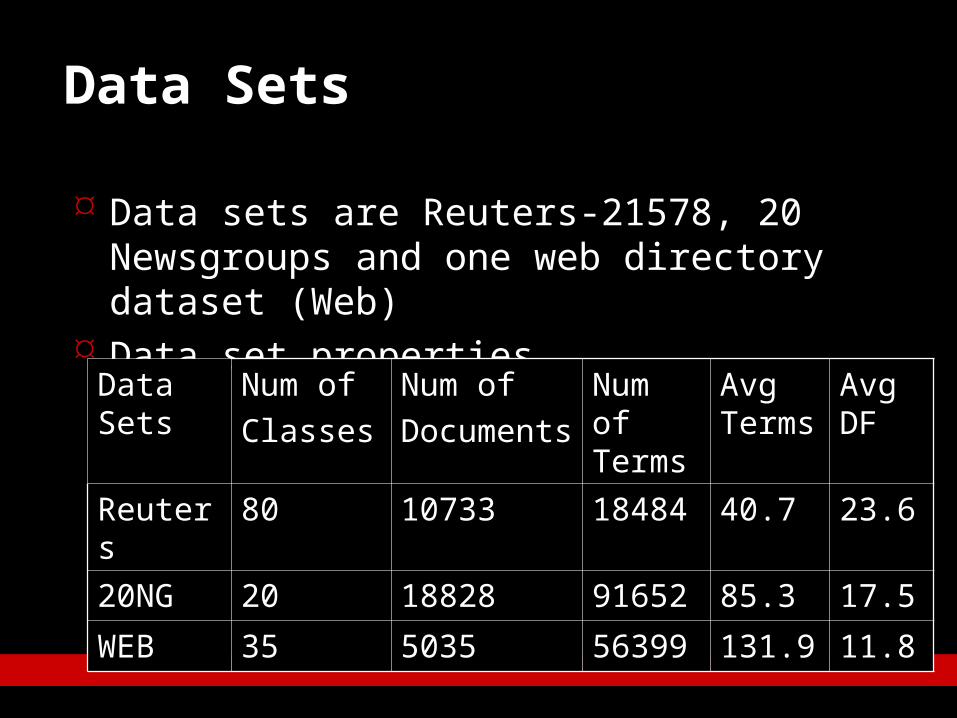
Data sets are Reuters-21578, 20 Newsgroups and one web directory dataset (Web)
Data set properties
Data Sets
Num ofClasses
Num ofDocuments
Num of Terms
Avg Terms
Avg DF
Reuters 80 10733 18484 40.7 23.620NG 20 18828 91652 85.3 17.5WEB 35 5035 56399 131.9 11.8

Results and Analysis Supervised Feature Selection
– IG and CHI feature selection methods are performed– In general feature selection makes little progress on
Reuters and 20NG– Achieves much improvement on Web directory dataset
Unsupervised Feature Selection– DF, TS, TC and En feature selection methods are
performed– While 90% of terms removed, entropy is reduced by 2%
and precision is increased by 1%– When more terms are removed, the performance of
unsupervised methods is dropped quickly, however, the performance of supervised methods is still improved