Embed Size (px)
Citation preview

Museum of Science Financial Statements June 30, 2018 and 2017

Museum of Science Financial Statements — June 30, 2018 and 2017
Table of Contents
Independent Auditors’ Report .......................................................................................................................... 1‐2
Financial Statements
Statements of Financial Position ........................................................................................................... 3
Statements of Activities ...................................................................................................................... 4‐5
Statements of Cash Flows ...................................................................................................................... 6
Notes to the Financial Statements ................................................................................................................... 7‐25
Supplemental Schedules of Functional Expenses ............................................................................................. 26
Independent Auditors’ Report
Board of Trustees
Museum of Science
Boston, Massachusetts
We have audited the accompanying financial statements of the Museum of Science (the “Museum”), which
comprise the statements of financial position as of June 30, 2018 and 2017, and the related statements of activities,
and cash flows for the years then ended, and the related notes to the financial statements.
Management’s Responsibility for the Financial Statements
Management is responsible for the preparation and fair presentation of these financial statements in accordance
with accounting principles generally accepted in the United States of America; this includes the design,
implementation, and maintenance of internal control relevant to the preparation and fair presentation of
financial statements that are free from material misstatement, whether due to fraud or error.
Auditors’ Responsibility
Our responsibility is to express an opinion on these financial statements based on our audits. We conducted our
audits in accordance with auditing standards generally accepted in the United States of America. Those
standards require that we plan and perform the audit to obtain reasonable assurance about whether the financial
statements are free from material misstatement.
An audit involves performing procedures to obtain audit evidence about the amounts and disclosures in the
financial statements. The procedures selected depend on the auditors’ judgment, including the assessment of the
risks of material misstatement of the financial statements, whether due to fraud or error. In making those risk
assessments, the auditor considers internal control relevant to the entity’s preparation and fair presentation of
the financial statements in order to design audit procedures that are appropriate in the circumstances, but not for
the purpose of expressing an opinion on the effectiveness of the entity’s internal control. Accordingly, we
express no such opinion. An audit also includes evaluating the appropriateness of accounting policies used and
the reasonableness of significant accounting estimates made by management, as well as evaluating the overall
presentation of the financial statements.
We believe that the audit evidence we have obtained is sufficient and appropriate to provide a basis for our
audit opinion.
Opinion
In our opinion, the financial statements referred to above present fairly, in all material respects, the financial
position of the Museum of Science as of June 30, 2018 and 2017, and the changes in its net assets and its cash
flows for the years then ended in accordance with accounting principles generally accepted in the United States
of America.
Other Matters
Supplemental Information
Our audits were conducted for the purpose of forming an opinion on the financial statements as a whole. The
supplemental schedules of functional expenses are presented for purposes of additional analysis and is not a
required part of the financial statements. Such information is the responsibility of management and was derived
from and relates directly to the underlying accounting and other records used to prepare the financial
statements. The information has been subjected to the auditing procedures applied in the audits of the financial
statements and certain additional procedures, including comparing and reconciling such information directly to
the underlying accounting and other records used to prepare the financial statements or to the financial
statements themselves, and other additional procedures in accordance with auditing standards generally
accepted in the United States of America. In our opinion, the information is fairly stated, in all material respects,
in relation to the financial statements as a whole.
October 18, 2018
Boston, Massachusetts

Museum of Science Statements of Financial Position — June 30, 2018 and 2017
3
(in thousands) 2018 2017
ASSETS 13
Current assets
Cash and cash equivalents 32,471$ 23,840$
Accounts receivable 1,315 1,671
Grants receivable 1,372 975
Pledges receivable, net 5,160 4,272
Prepaid expenses and other current assets 1,146 1,078
Total current assets 41,464 31,836
Noncurrent assets
Pledges receivable, net 2,387 5,822
Investments 160,961 150,179
Assets of split interest agreements 16,535 15,342
Other assets, net of amortization 1,035 1,025
Property, plant and equipment, net 68,330 72,154
Total assets 290,712$ 276,358$
LIABILITIES AND NET ASSETS
Current liabilities
Accounts payable and accrued liabilities 5,666$ 5,616$
Deferred revenue 4,752 5,160
Total current liabilities 10,418 10,776
Noncurrent liabilities
Annuity payable and deferred compensation 1,037 913
Liability under split interest agreements 1,523 1,416
Liability under management agreement 1,180 1,385
Asset retirement obligation 1,596 1,502
Capital leases 2,323 2,828
Total liabilities 18,077 18,820
Net assets
Unrestricted
Operating funds 418 376
Designated funds 1,241 3,525
Quasi‐endowment 10,465 11,184
Net investment in plant 62,771 65,651
Total unrestricted 74,895 80,736
Temporarily restricted
Gifts, grants, and endowment income 47,862 37,281
Temporary endowment principal 1,964 1,964
Unappropriated endowment gains 69,466 62,125
Total temporarily restricted 119,292 101,370
Permanently restricted
Endowment principal and other 78,448 75,432
Total permanently restricted 78,448 75,432
Total net assets 272,635 257,538
Total liabilities and net assets 290,712$ 276,358$
The accompanying notes are an integral part of these financial statements.
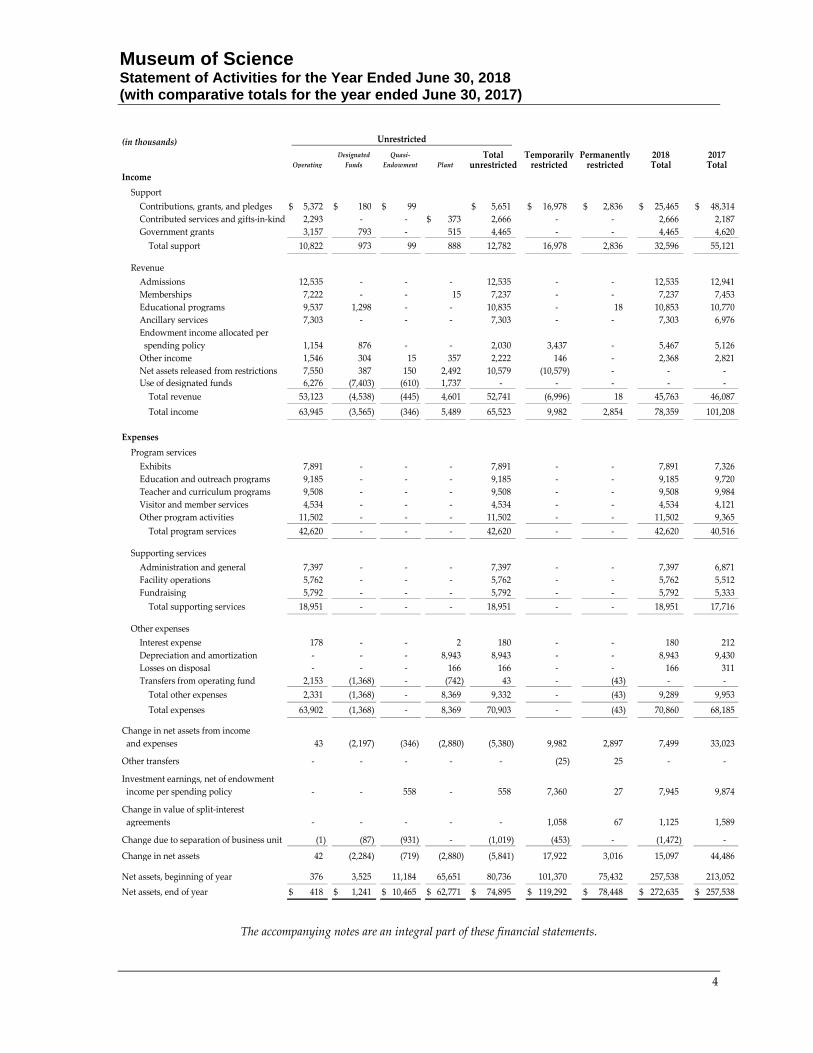
Museum of Science Statement of Activities for the Year Ended June 30, 2018 (with comparative totals for the year ended June 30, 2017)
4
3 4 5 6 7 10 11
(in thousands)
Designated Quasi‐ Total Temporarily Permanently 2018 2017Operating Funds Endowment Plant unrestricted restricted restricted Total Total
Income
Support
Contributions, grants, and pledges 5,372$ 180$ 99$ 5,651$ 16,978$ 2,836$ 25,465$ 48,314$
Contributed services and gifts‐in‐kind 2,293 ‐ ‐ 373$ 2,666 ‐ ‐ 2,666 2,187
Government grants 3,157 793 ‐ 515 4,465 ‐ ‐ 4,465 4,620
Total support 10,822 973 99 888 12,782 16,978 2,836 32,596 55,121
Revenue
Admissions 12,535 ‐ ‐ ‐ 12,535 ‐ ‐ 12,535 12,941
Memberships 7,222 ‐ ‐ 15 7,237 ‐ ‐ 7,237 7,453
Educational programs 9,537 1,298 ‐ ‐ 10,835 ‐ 18 10,853 10,770
Ancillary services 7,303 ‐ ‐ ‐ 7,303 ‐ ‐ 7,303 6,976
Endowment income allocated per
spending policy 1,154 876 ‐ ‐ 2,030 3,437 ‐ 5,467 5,126
Other income 1,546 304 15 357 2,222 146 ‐ 2,368 2,821
Net assets released from restrictions 7,550 387 150 2,492 10,579 (10,579) ‐ ‐ ‐
Use of designated funds 6,276 (7,403) (610) 1,737 ‐ ‐ ‐ ‐ ‐
Total revenue 53,123 (4,538) (445) 4,601 52,741 (6,996) 18 45,763 46,087
Total income 63,945 (3,565) (346) 5,489 65,523 9,982 2,854 78,359 101,208
Expenses
Program services
Exhibits 7,891 ‐ ‐ ‐ 7,891 ‐ ‐ 7,891 7,326
Education and outreach programs 9,185 ‐ ‐ ‐ 9,185 ‐ ‐ 9,185 9,720
Teacher and curriculum programs 9,508 ‐ ‐ ‐ 9,508 ‐ ‐ 9,508 9,984
Visitor and member services 4,534 ‐ ‐ ‐ 4,534 ‐ ‐ 4,534 4,121
Other program activities 11,502 ‐ ‐ ‐ 11,502 ‐ ‐ 11,502 9,365
Total program services 42,620 ‐ ‐ ‐ 42,620 ‐ ‐ 42,620 40,516
Supporting services
Administration and general 7,397 ‐ ‐ ‐ 7,397 ‐ ‐ 7,397 6,871
Facility operations 5,762 ‐ ‐ ‐ 5,762 ‐ ‐ 5,762 5,512
Fundraising 5,792 ‐ ‐ ‐ 5,792 ‐ ‐ 5,792 5,333
Total supporting services 18,951 ‐ ‐ ‐ 18,951 ‐ ‐ 18,951 17,716
Other expenses
Interest expense 178 ‐ ‐ 2 180 ‐ ‐ 180 212
Depreciation and amortization ‐ ‐ ‐ 8,943 8,943 ‐ ‐ 8,943 9,430
Losses on disposal ‐ ‐ ‐ 166 166 ‐ ‐ 166 311
Transfers from operating fund 2,153 (1,368) ‐ (742) 43 ‐ (43) ‐ ‐
Total other expenses 2,331 (1,368) ‐ 8,369 9,332 ‐ (43) 9,289 9,953
Total expenses 63,902 (1,368) ‐ 8,369 70,903 ‐ (43) 70,860 68,185
Change in net assets from income
and expenses 43 (2,197) (346) (2,880) (5,380) 9,982 2,897 7,499 33,023
Other transfers ‐ ‐ ‐ ‐ ‐ (25) 25 ‐ ‐
Investment earnings, net of endowment
income per spending policy ‐ ‐ 558 ‐ 558 7,360 27 7,945 9,874
Change in value of split‐interest
agreements ‐ ‐ ‐ ‐ ‐ 1,058 67 1,125 1,589
Change due to separation of business unit (1) (87) (931) ‐ (1,019) (453) ‐ (1,472) ‐
Change in net assets 42 (2,284) (719) (2,880) (5,841) 17,922 3,016 15,097 44,486
Net assets, beginning of year 376 3,525 11,184 65,651 80,736 101,370 75,432 257,538 213,052
Net assets, end of year 418$ 1,241$ 10,465$ 62,771$ 74,895$ 119,292$ 78,448$ 272,635$ 257,538$
Unrestricted
The accompanying notes are an integral part of these financial statements.
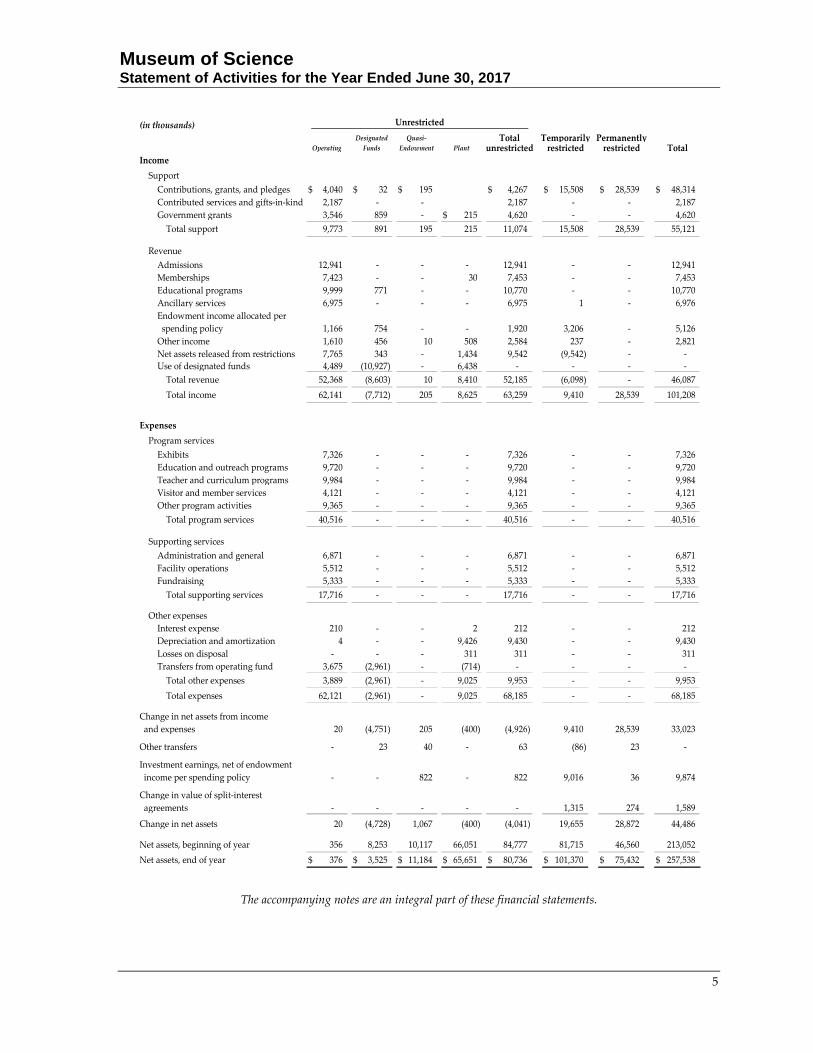
Museum of Science Statement of Activities for the Year Ended June 30, 2017
5
3 4 5 6 7 10 11
(in thousands)
Designated Quasi‐ Total Temporarily PermanentlyOperating Funds Endowment Plant unrestricted restricted restricted Total
Income
Support
Contributions, grants, and pledges 4,040$ 32$ 195$ 4,267$ 15,508$ 28,539$ 48,314$
Contributed services and gifts‐in‐kind 2,187 ‐ ‐ 2,187 ‐ ‐ 2,187
Government grants 3,546 859 ‐ 215$ 4,620 ‐ ‐ 4,620
Total support 9,773 891 195 215 11,074 15,508 28,539 55,121
Revenue
Admissions 12,941 ‐ ‐ ‐ 12,941 ‐ ‐ 12,941
Memberships 7,423 ‐ ‐ 30 7,453 ‐ ‐ 7,453
Educational programs 9,999 771 ‐ ‐ 10,770 ‐ ‐ 10,770
Ancillary services 6,975 ‐ ‐ ‐ 6,975 1 ‐ 6,976
Endowment income allocated per
spending policy 1,166 754 ‐ ‐ 1,920 3,206 ‐ 5,126
Other income 1,610 456 10 508 2,584 237 ‐ 2,821
Net assets released from restrictions 7,765 343 ‐ 1,434 9,542 (9,542) ‐ ‐
Use of designated funds 4,489 (10,927) ‐ 6,438 ‐ ‐ ‐ ‐
Total revenue 52,368 (8,603) 10 8,410 52,185 (6,098) ‐ 46,087
Total income 62,141 (7,712) 205 8,625 63,259 9,410 28,539 101,208
Expenses
Program services
Exhibits 7,326 ‐ ‐ ‐ 7,326 ‐ ‐ 7,326
Education and outreach programs 9,720 ‐ ‐ ‐ 9,720 ‐ ‐ 9,720
Teacher and curriculum programs 9,984 ‐ ‐ ‐ 9,984 ‐ ‐ 9,984
Visitor and member services 4,121 ‐ ‐ ‐ 4,121 ‐ ‐ 4,121
Other program activities 9,365 ‐ ‐ ‐ 9,365 ‐ ‐ 9,365
Total program services 40,516 ‐ ‐ ‐ 40,516 ‐ ‐ 40,516
Supporting services
Administration and general 6,871 ‐ ‐ ‐ 6,871 ‐ ‐ 6,871
Facility operations 5,512 ‐ ‐ ‐ 5,512 ‐ ‐ 5,512
Fundraising 5,333 ‐ ‐ ‐ 5,333 ‐ ‐ 5,333
Total supporting services 17,716 ‐ ‐ ‐ 17,716 ‐ ‐ 17,716
Other expenses
Interest expense 210 ‐ ‐ 2 212 ‐ ‐ 212
Depreciation and amortization 4 ‐ ‐ 9,426 9,430 ‐ ‐ 9,430
Losses on disposal ‐ ‐ ‐ 311 311 ‐ ‐ 311
Transfers from operating fund 3,675 (2,961) ‐ (714) ‐ ‐ ‐ ‐
Total other expenses 3,889 (2,961) ‐ 9,025 9,953 ‐ ‐ 9,953
Total expenses 62,121 (2,961) ‐ 9,025 68,185 ‐ ‐ 68,185
Change in net assets from income
and expenses 20 (4,751) 205 (400) (4,926) 9,410 28,539 33,023
Other transfers ‐ 23 40 ‐ 63 (86) 23 ‐
Investment earnings, net of endowment
income per spending policy ‐ ‐ 822 ‐ 822 9,016 36 9,874
Change in value of split‐interest
agreements ‐ ‐ ‐ ‐ ‐ 1,315 274 1,589
Change in net assets 20 (4,728) 1,067 (400) (4,041) 19,655 28,872 44,486
Net assets, beginning of year 356 8,253 10,117 66,051 84,777 81,715 46,560 213,052
Net assets, end of year 376$ 3,525$ 11,184$ 65,651$ 80,736$ 101,370$ 75,432$ 257,538$
Unrestricted
The accompanying notes are an integral part of these financial statements.
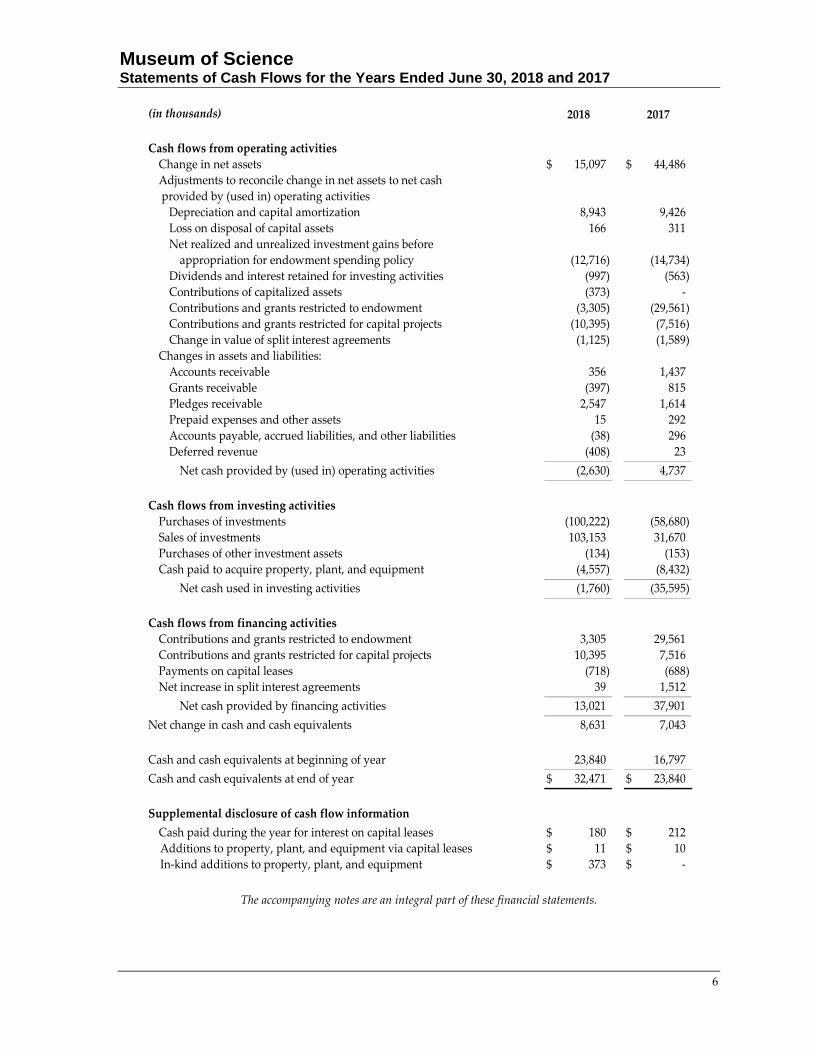
Museum of Science Statements of Cash Flows for the Years Ended June 30, 2018 and 2017
6
(in thousands) 2018 2017
Cash flows from operating activities
Change in net assets 15,097$ 44,486$
Adjustments to reconcile change in net assets to net cash
provided by (used in) operating activities
Depreciation and capital amortization 8,943 9,426
Loss on disposal of capital assets 166 311
Net realized and unrealized investment gains before
appropriation for endowment spending policy (12,716) (14,734)
Dividends and interest retained for investing activities (997) (563)
Contributions of capitalized assets (373) ‐
Contributions and grants restricted to endowment (3,305) (29,561)
Contributions and grants restricted for capital projects (10,395) (7,516)
Change in value of split interest agreements (1,125) (1,589)
Changes in assets and liabilities:
Accounts receivable 356 1,437
Grants receivable (397) 815
Pledges receivable 2,547 1,614
Prepaid expenses and other assets 15 292
Accounts payable, accrued liabilities, and other liabilities (38) 296
Deferred revenue (408) 23
Net cash provided by (used in) operating activities (2,630) 4,737
Cash flows from investing activities
Purchases of investments (100,222) (58,680)
Sales of investments 103,153 31,670
Purchases of other investment assets (134) (153)
Cash paid to acquire property, plant, and equipment (4,557) (8,432)
Net cash used in investing activities (1,760) (35,595)
Cash flows from financing activities
Contributions and grants restricted to endowment 3,305 29,561
Contributions and grants restricted for capital projects 10,395 7,516
Payments on capital leases (718) (688)
Net increase in split interest agreements 39 1,512
Net cash provided by financing activities 13,021 37,901
Net change in cash and cash equivalents 8,631 7,043
Cash and cash equivalents at beginning of year 23,840 16,797
Cash and cash equivalents at end of year 32,471$ 23,840$
Supplemental disclosure of cash flow information
Cash paid during the year for interest on capital leases 180$ 212$
Additions to property, plant, and equipment via capital leases 11$ 10$
In‐kind additions to property, plant, and equipment 373$ ‐$
The accompanying notes are an integral part of these financial statements.
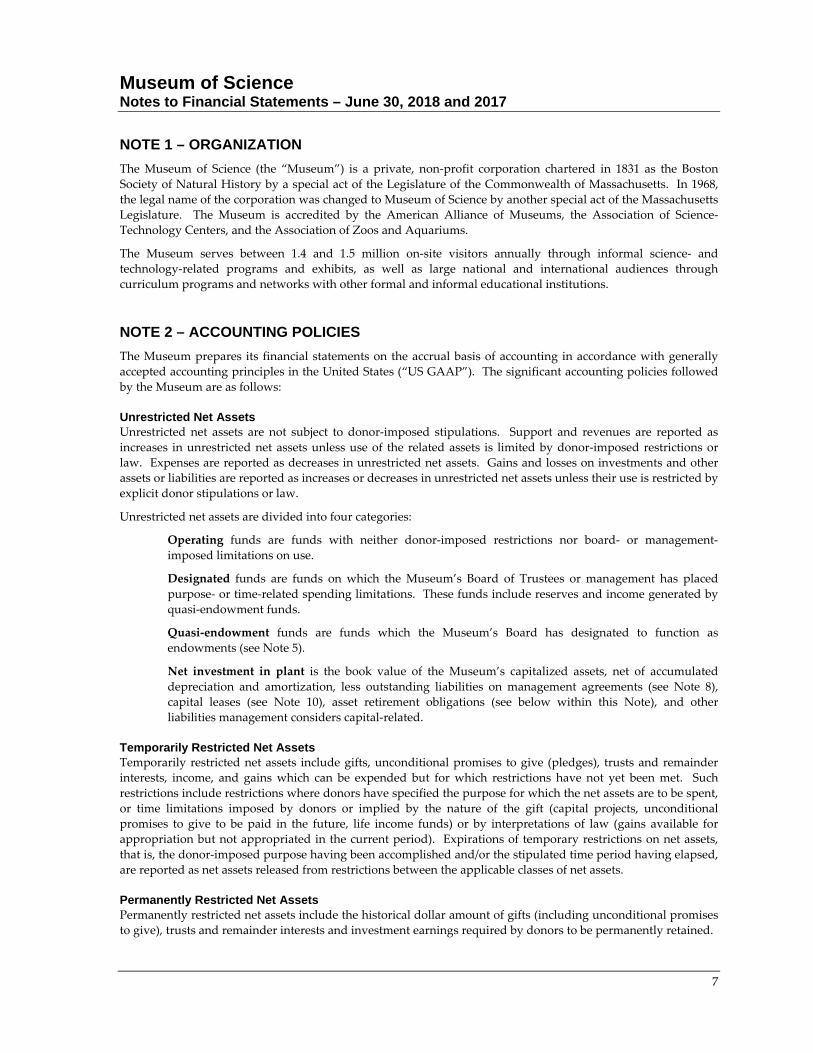
Museum of Science Notes to Financial Statements – June 30, 2018 and 2017
7
NOTE 1 – ORGANIZATION
The Museum of Science (the “Museum”) is a private, non‐profit corporation chartered in 1831 as the Boston
Society of Natural History by a special act of the Legislature of the Commonwealth of Massachusetts. In 1968,
the legal name of the corporation was changed to Museum of Science by another special act of the Massachusetts
Legislature. The Museum is accredited by the American Alliance of Museums, the Association of Science‐
Technology Centers, and the Association of Zoos and Aquariums.
The Museum serves between 1.4 and 1.5 million on‐site visitors annually through informal science‐ and
technology‐related programs and exhibits, as well as large national and international audiences through
curriculum programs and networks with other formal and informal educational institutions.
NOTE 2 – ACCOUNTING POLICIES
The Museum prepares its financial statements on the accrual basis of accounting in accordance with generally
accepted accounting principles in the United States (“US GAAP”). The significant accounting policies followed
by the Museum are as follows:
Unrestricted Net Assets Unrestricted net assets are not subject to donor‐imposed stipulations. Support and revenues are reported as
increases in unrestricted net assets unless use of the related assets is limited by donor‐imposed restrictions or
law. Expenses are reported as decreases in unrestricted net assets. Gains and losses on investments and other
assets or liabilities are reported as increases or decreases in unrestricted net assets unless their use is restricted by
explicit donor stipulations or law.
Unrestricted net assets are divided into four categories:
Operating funds are funds with neither donor‐imposed restrictions nor board‐ or management‐
imposed limitations on use.
Designated funds are funds on which the Museum’s Board of Trustees or management has placed
purpose‐ or time‐related spending limitations. These funds include reserves and income generated by
quasi‐endowment funds.
Quasi‐endowment funds are funds which the Museum’s Board has designated to function as
endowments (see Note 5).
Net investment in plant is the book value of the Museum’s capitalized assets, net of accumulated
depreciation and amortization, less outstanding liabilities on management agreements (see Note 8),
capital leases (see Note 10), asset retirement obligations (see below within this Note), and other
liabilities management considers capital‐related.
Temporarily Restricted Net Assets Temporarily restricted net assets include gifts, unconditional promises to give (pledges), trusts and remainder
interests, income, and gains which can be expended but for which restrictions have not yet been met. Such
restrictions include restrictions where donors have specified the purpose for which the net assets are to be spent,
or time limitations imposed by donors or implied by the nature of the gift (capital projects, unconditional
promises to give to be paid in the future, life income funds) or by interpretations of law (gains available for
appropriation but not appropriated in the current period). Expirations of temporary restrictions on net assets,
that is, the donor‐imposed purpose having been accomplished and/or the stipulated time period having elapsed,
are reported as net assets released from restrictions between the applicable classes of net assets.
Permanently Restricted Net Assets Permanently restricted net assets include the historical dollar amount of gifts (including unconditional promises
to give), trusts and remainder interests and investment earnings required by donors to be permanently retained.

Museum of Science Notes to Financial Statements – June 30, 2018 and 2017
8
Fair Value The Museum reports certain assets and liabilities at fair value on a recurring and non‐recurring basis depending
on the underlying accounting policy. Fair value is defined as the price that would be received or paid in the
most advantageous market on the measurement date. Recurring fair value measures include the Museum’s
investments and assets and liabilities of split interest agreements. Non‐recurring measures include pledges
receivable and asset retirement obligations. Fair value standards require an entity to maximize the use of
observable inputs (such as quoted market prices in active markets) and minimize the use of unobservable inputs
(such as appraisals or other valuation techniques) to determine fair value. In addition, the Museum measures
certain investments using the net asset value (“NAV”) per share (or its equivalent) as reported by its investment
managers under the so‐called “practical expedient” to reflect fair value. The practical expedient allows NAV per
share to represent fair value for reporting purposes when the criteria for using this method are met. Fair value
standards also require the Museum to classify its assets and liabilities into a three‐level hierarchy, based on the
priority of inputs used to value them, as discussed below, except for investments measured using the NAV
practical expedient, for which classification into the fair value hierarchy is not required.
Instruments measured and reported at fair value other than those using the NAV practical expedient are
classified and disclosed in one of the following categories:
Level 1 – Inputs to the valuation methodology are unadjusted quoted prices for identical assets or
liabilities in active markets that the Museum has the ability to access. Assets in this category generally
include mutual funds and listed equity and debt securities traded on an exchange.
Level 2 – Inputs other than Level 1 that are observable, either directly or indirectly, such as quoted
prices for similar assets or liabilities; quoted prices in markets that are not active; or other inputs that
are observable or can be corroborated by observable market data for substantially the same term as the
assets or liabilities.
Level 3 – Pricing inputs are unobservable for the instrument and/or include situations where there is
little, if any, market activity for the instrument. The inputs into the determination of fair value require
significant management judgement or estimation.
In some instances, the inputs used to measure fair value may fall into different levels of the fair value hierarchy.
In such instances, an instrument’s level within the hierarchy is based on the lowest level of input that is
significant to the fair value measurement.
Market price is affected by a number of factors, including the type of instrument and the characteristics specific
to that instrument. Subsequent market fluctuations could materially affect the fair value of instruments reported
in these financial statements.
Cash and Cash Equivalents Cash and cash equivalents consist of cash, money market funds, and treasury bills with a maturity of ninety days
or less when acquired. Bank deposits are often in excess of federally insured limits. However, management
monitors the credit standing of its banking partners and has not experienced any losses on such accounts.
Pledges Receivable and Contribution Revenue Contributions are recorded as unrestricted, temporarily restricted, or permanently restricted support depending
on the existence and nature of any donor restrictions.
Contributions, including unconditional promises to give (pledges), are recognized as revenues in the period
committed. Conditional promises to give are not recognized until such time as the conditions on which they
depend are substantially met. Intentions to give which are not legally enforceable are recorded when the gift is
received.
Contributions of assets other than cash are recorded at their estimated fair value when originally pledged or
donated. The initially recorded fair value is generally considered a Level 1 or Level 2 measurement depending
on the nature of the donated asset. Contributions to be received after one year are discounted using risk‐
adjusted discount rates at the date of the pledge agreement. These discount rates range from approximately one
to five percent. This is considered a Level 2 fair value measurement. Amortization of the discount is recorded as
Museum of Science Notes to Financial Statements – June 30, 2018 and 2017
9
additional contribution revenue in accordance with donor‐imposed restrictions, if any, on the contributions. An
allowance for uncollectible pledges receivable is provided based on management’s judgement of potential
defaults based on the performance and circumstances associated with each pledge.
Investments Investments are carried at fair value, as described earlier. Investments associated with the Museum’s
endowment are pooled, with returns net of investment fees being allocated based on the source of the funds.
Interest, dividends, and net gains or losses on investments are reported as increases or decreases in permanently
restricted net assets if the terms of the original gift require that they be applied to the principal of a permanent
endowment fund; as increases or decreases in temporarily restricted net assets if the terms of the gift or relevant
state law impose restrictions on the use of income or net gains and losses; and as increases or decreases in
unrestricted net assets in all other cases.
Assets and Liabilities under Split Interest Agreements Assets and liabilities under split‐interest agreements are recorded at fair value and in the appropriate net asset
category based on donor stipulation. Revenue related to these agreements is recognized as a contribution equal
to the present value of expected future benefits. Agreements for which the Museum is not the trustee are
recorded as assets net of the associated liability, while agreements for which the Museum holds the assets are
reported gross, with the associated liability reflected separately as a liability under split interest agreement.
During the term of these agreements, changes in the value of split interest agreements are recognized in the
statement of activities based on accretion of the discounted amount of the contribution and reevaluations of the
expected future benefits to be received by the Museum given life expectancies and other factors, including
changes in discount rates. The initially recorded fair value of the donated investments is determined based on
the nature of the investment received, and generally represent Level 1 measurements, while the initial
measurement of the related obligations are Level 2 or Level 3, given life expectancy and other factors used in
determining the effect of these obligations on measurement.
Property, Plant, and Equipment Property, plant and equipment are stated at cost, or fair value at the date of donation in the case of gifts. The
level of the fair value measurement depends on the nature of the donated asset. Betterments which materially
add to the value of the related assets or materially extend the useful life of the assets are capitalized. Normal
replacements and minor equipment purchases are included as operating expenses. The Museum capitalizes the
cost of standing exhibits and traveling exhibits produced by the Museum for rent by other institutions. The cost
of hosted traveling exhibitions produced by others and other short‐term exhibits are expensed as incurred.
Depreciation is recorded on the straight‐line basis over the following estimated useful lives:
Building and improvements 10 – 40 years
Equipment 03 – 20 years
Exhibits 05 – 40 years
Certain extraordinary exhibit components, such as fossils, are considered inexhaustible assets with an indefinite
useful life and are therefore not depreciated.
Museum Collections and Archives The Museum’s collections consist of approximately 30,000 artifacts used primarily for educational activities
encompassing interpretations, discovery spaces, exhibits, lectures, classes, demonstrations, reference services, or
other programs. The Museum also has a historical and archival collection that documents the history of the
institution. The composition of the Museum’s collections by artifact type is as follows:
Natural Sciences 20,000 items
Cultural/Physical Science 05,000 items
Artwork 02,000 items
Institutional History 03,000 items
Archives 01,100 linear feet
Museum of Science Notes to Financial Statements – June 30, 2018 and 2017
10
The Museum’s Collections Management Policy stipulates that the Museum will only acquire objects useful in
fulfilling the educational purpose stated in its mission. The Museum accepts only those objects that can be
immediately put on display in an exhibit, used in educational programs, or used in future programming.
Items may be de‐accessioned from the collections if they are determined to be no longer useful or relevant in
assisting the Museum in fulfilling its mission. Consistent with the American Alliance of Museums’ Code of
Ethics, Museum policy specifies that proceeds from the de‐accessioning of an item may only be used for the
conservation or acquisition of other collections items.
In accordance with current practice generally followed by museums, collections are generally not recorded as
assets in the accompanying financial statements. Purchased additions to the collections are recorded as expenses
at the time acquired. Although artifacts from the collections may from time to time be incorporated into exhibits,
the Museum’s exhibits themselves are not considered part of its collections, and may be capitalized under the
Museum’s property, plant, and equipment policies. However, artifacts and artworks with a value of $250,000 or
greater acquired specifically for incorporation into an exhibit and capitalized as part of that exhibit may be
formally accessioned into the Museum’s collections in order to be afforded the protections of the Museum’s
Collections Management Policy.
Recognition of Earned Revenue and Deferred Revenue
Government grants consists of federal, state, and international government funds awarded in support of the
Museum’s exhibits and programs, and is recorded as revenue as expenditures are made for the supported
activities. Grants received in support of the Museum’s general operations are recorded as revenue when
received.
Admissions consists of fees paid for entrance to the Museum’s exhibit halls, theaters, and special attractions, and
is recorded as revenue on the date of visit.
Membership consists of fees paid for household, library, and corporate memberships, and is recorded
proportionally over the period of the membership.
Educational programs includes revenue received for the Museum’s overnights program, courses, traveling and
outreach programs, professional development, rental of traveling exhibits, and sale of curriculum materials.
These fees are recorded at the time the related service is provided.
Ancillary services includes income derived from the Museum’s events and conference services, garage, food
services, and store, and is recorded on the date the related service is provided.
Other income includes facility rental income, fund‐raising and other event ticket sales, and corporate
sponsorships. Sponsorship agreements provide for the sponsors’ name and/or logo to be displayed on Museum
signage, exhibits, advertising, and website, and also provide certain admission and event privileges.
Sponsorship revenue is recognized proportionally over the term of the sponsorship agreement. The remaining
components of other income are recognized as the related services are provided.
In accordance with these revenue recognition policies, prepayments and deposits are recorded as deferred
revenue until the corresponding revenue recognition processes are complete.
Asset Retirement Obligation The Museum recognizes the initial fair value of a liability for legal obligations associated with asset retirements
in the period in which the obligation is incurred. When the liability is initially recorded, the cost of the asset
retirement obligation is capitalized by increasing the carrying amount of the related long‐lived asset. This is
considered a Level 2 fair value measurement. The liability is accreted to its present value each period, and the
capitalized cost associated with the retirement obligation is depreciated over the useful life of the related asset.
The asset retirement obligations will be adjusted on an ongoing basis due to the passage of time, new laws and
regulations and revisions to either the timing or amounts of original estimates. Upon settlement of the
obligation, any difference between the cost to settle the asset retirement obligation and the liability recorded is
recognized as a gain or loss in the statement of activities.
Museum of Science Notes to Financial Statements – June 30, 2018 and 2017
11
Contributed Services and Gifts in Kind Donated materials are reported as contributions in the accompanying financial statements at their estimated fair
values at the time of receipt. Donated services are reported when services are performed which would
otherwise have been purchased or performed by Museum personnel, and are recorded at the estimated amount
the Museum would have paid for their performance. Fair value determination of these contributions is generally
a Level 1 or Level 2 measurement depending on the nature of the donated goods or services.
Use of Designated Funds Use of designated funds represents allocations from reserves, quasi‐endowment income, and other designated
funds to fund operating activities and capital projects.
Transfers from Operating Funds Transfers from the operating fund include the use of operating funds to fund capital projects, additions to
reserves, and other discretionary transfers.
Other Transfers Other transfers include the redesignation of temporarily restricted funds to endowment, either per donor
stipulations that unused endowment income revert to principal at year‐end, or as part of fund‐raising programs
whereby funds raised in excess of a capital project’s needs are to be used to create an endowment to support the
ongoing operations or maintenance of the funded assets. Other transfers also include transfers related to the
funding or recovery of underwater endowment funds and redesignation of reserves to quasi‐endowment.
Income and Other Taxes The Museum is exempt from income taxation on activities related to its charitable purposes under the provisions
of Section 501(c)(3) of the Internal Revenue Code and is qualified to receive tax‐deductible gifts and bequests
under the U.S. tax code. The Museum is subject to tax on income from any business it conducts which is
unrelated to its charitable purposes. These activities generally include event and conference services revenue for
events of a purely social nature, rental income from parking spaces in the Museum’s garage, investment income
from certain endowment investments, and ticket income from non‐scientific offerings in the Museum’s
planetarium and Omni and 4‐D theaters. Taxes paid for these activities are recorded in the accompanying
financial statements as expenses of the department generating the associated unrelated income.
The Museum is also responsible for calculating, collecting, and remitting sales and liquor taxes in various
jurisdictions.
The Museum accounts for the effect of any uncertain tax positions on the basis of whether it is more likely than
not that positions taken, or expected to be taken, in a tax return will be sustained upon examination by the
relevant taxing authority. If a tax position or positions are deemed to result in uncertainties of those positions,
the unrecognized tax benefit is estimated based on a “cumulative probability assessment” that aggregates the
estimated liability for all uncertain tax positions. The Museum considers its status as a tax‐exempt entity and the
determination of income as related or unrelated to its exempt purpose to be its only significant income tax
positions, and has determined that such positions do not result in an uncertainty requiring recognition. The
Museum is not currently under income tax examination by any jurisdiction. The Museum’s Federal and state tax
returns are generally open for examination for three years following the date filed.
Use of Accounting Estimates The preparation of financial statements in conformity with US GAAP requires management to make estimates
and assumptions that affect the reported amounts of assets and liabilities at the date of the financial statements
and the reported amounts of revenues and expenses during the reporting period. Actual results could differ
from these estimates. Significant estimates include allowances for doubtful accounts and pledges receivable,
present value factors used for pledges, fair values of certain investments, capitalization of assets and
determination of useful lives assigned to depreciable assets, asset and liability values associated with leased
equipment, obligations under annuity and split‐interest arrangements, liabilities associated with asset retirement
obligations, and indirect cost and employee fringe benefit allocation rates.

Museum of Science Notes to Financial Statements – June 30, 2018 and 2017
12
Reclassifications Certain reclassifications have been made to the prior year financial statements in order to conform with the
current year presentation.

Museum of Science Notes to Financial Statements – June 30, 2018 and 2017
13
NOTE 3 – PLEDGES RECEIVABLE
Pledges are expected to be realized in the following time frame as of June 30, 2018 and 2017:
(in thousands) 2018 2017
In one year or less 5,215$ 4,315$
Between one and five years 2,468 6,115
Greater than five years 30 ‐
Less allowance for unfulfilled pledges (79) (102)
Less discount to present value (87) (234)
Net present value of pledges receivable, net of allowances 7,547$ 10,094$
Net present value of pledges by purpose as of June 30, 2018 and 2017 are as follows:
(in thousands) 2018 2017
Purpose Restrictions
Operating and similar funds
Exhibits 1,179$ 1,339$
Education and outreach programs 588 594
Teacher and curriculum programs 594 633
Other program activities 161 160
General and other 416 753
Capital exhibits, property, plant, and equipment 1,452 2,829
Total operating and similar funds 4,390 6,308
Endowment and quasi‐endowmentExhibits ‐ 574
Education and outreach programs 3,082 2,982
Total endowment and quasi‐endowment 3,082 3,556
Unrestricted pledges with effective time restrictions 154 332
Less allowance for unfulfilled pledges (79) (102)
Net present value of pledges receivable, net of allowances 7,547$ 10,094$
Concentration of Risk As of June 30, 2018 and 2017, 85% and 74%, respectively, of gross pledges consisted of pledges from two major
donors.
Conditional Promises to Give As of June 30, 2018 and 2017, the Museum had $19,250,000 and $19,030,000, respectively, in conditional pledges.
Non-binding Intentions In addition to enforceable promises to give, the Museum often receives promises that an individual will
recommend that a gift be made from a donor‐advised fund or a foundation over which the individual does not
have control. As donor‐advised funds and foundations are not legally bound to honor such recommendations,
these promises are not recorded in the financial statements. Any gifts resulting from these recommendations are
recorded when received. As of June 30, 2018 and 2017, the Museum had $1,671,000 and $1,504,000, respectively,
in outstanding non‐binding intentions.
Museum of Science Notes to Financial Statements – June 30, 2018 and 2017
14
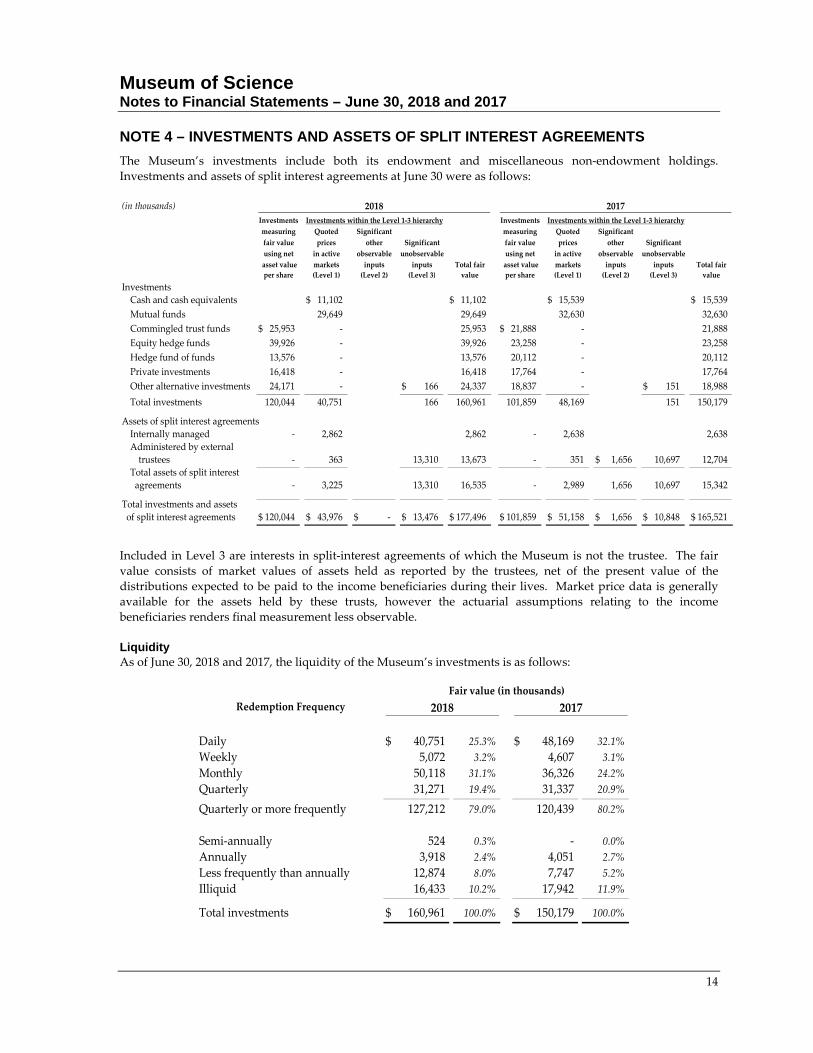
NOTE 4 – INVESTMENTS AND ASSETS OF SPLIT INTEREST AGREEMENTS
The Museum’s investments include both its endowment and miscellaneous non‐endowment holdings.
Investments and assets of split interest agreements at June 30 were as follows:
(in thousands)
Investments Investments within the Level 1‐3 hierarchy Investments
measuring Quoted Significant measuring Quoted Significant
fair value prices other Significant fair value prices other Significant
using net in active observable unobservable using net in active observable unobservable
asset value markets inputs inputs Total fair asset value markets inputs inputs Total fair
per share (Level 1) (Level 2) (Level 3) value per share (Level 1) (Level 2) (Level 3) value
Investments
Cash and cash equivalents 11,102$ 11,102$ 15,539$ 15,539$
Mutual funds 29,649 29,649 32,630 32,630
Commingled trust funds 25,953$ ‐ 25,953 21,888$ ‐ 21,888
Equity hedge funds 39,926 ‐ 39,926 23,258 ‐ 23,258
Hedge fund of funds 13,576 ‐ 13,576 20,112 ‐ 20,112
Private investments 16,418 ‐ 16,418 17,764 ‐ 17,764
Other alternative investments 24,171 ‐ 166$ 24,337 18,837 ‐ 151$ 18,988
Total investments 120,044 40,751 166 160,961 101,859 48,169 151 150,179
Assets of split interest agreements
Internally managed ‐ 2,862 2,862 ‐ 2,638 2,638
Administered by external
trustees ‐ 363 13,310 13,673 ‐ 351 1,656$ 10,697 12,704
Total assets of split interest
agreements ‐ 3,225 13,310 16,535 ‐ 2,989 1,656 10,697 15,342
Total investments and assets
120,044$ 43,976$ ‐$ 13,476$ 177,496$ 101,859$ 51,158$ 1,656$ 10,848$ 165,521$ of split interest agreements
2018 2017
Investments within the Level 1‐3 hierarchy
Included in Level 3 are interests in split‐interest agreements of which the Museum is not the trustee. The fair
value consists of market values of assets held as reported by the trustees, net of the present value of the
distributions expected to be paid to the income beneficiaries during their lives. Market price data is generally
available for the assets held by these trusts, however the actuarial assumptions relating to the income
beneficiaries renders final measurement less observable.
Liquidity As of June 30, 2018 and 2017, the liquidity of the Museum’s investments is as follows:
Redemption Frequency 2018 2017
Daily 40,751$ 25.3% 48,169$ 32.1%
Weekly 5,072 3.2% 4,607 3.1%
Monthly 50,118 31.1% 36,326 24.2%
Quarterly 31,271 19.4% 31,337 20.9%
Quarterly or more frequently 127,212 79.0% 120,439 80.2%
Semi‐annually 524 0.3% ‐ 0.0%
Annually 3,918 2.4% 4,051 2.7%
Less frequently than annually 12,874 8.0% 7,747 5.2%
Illiquid 16,433 10.2% 17,942 11.9%
Total investments 160,961$ 100.0% 150,179$ 100.0%
Fair value (in thousands)
Museum of Science Notes to Financial Statements – June 30, 2018 and 2017
15
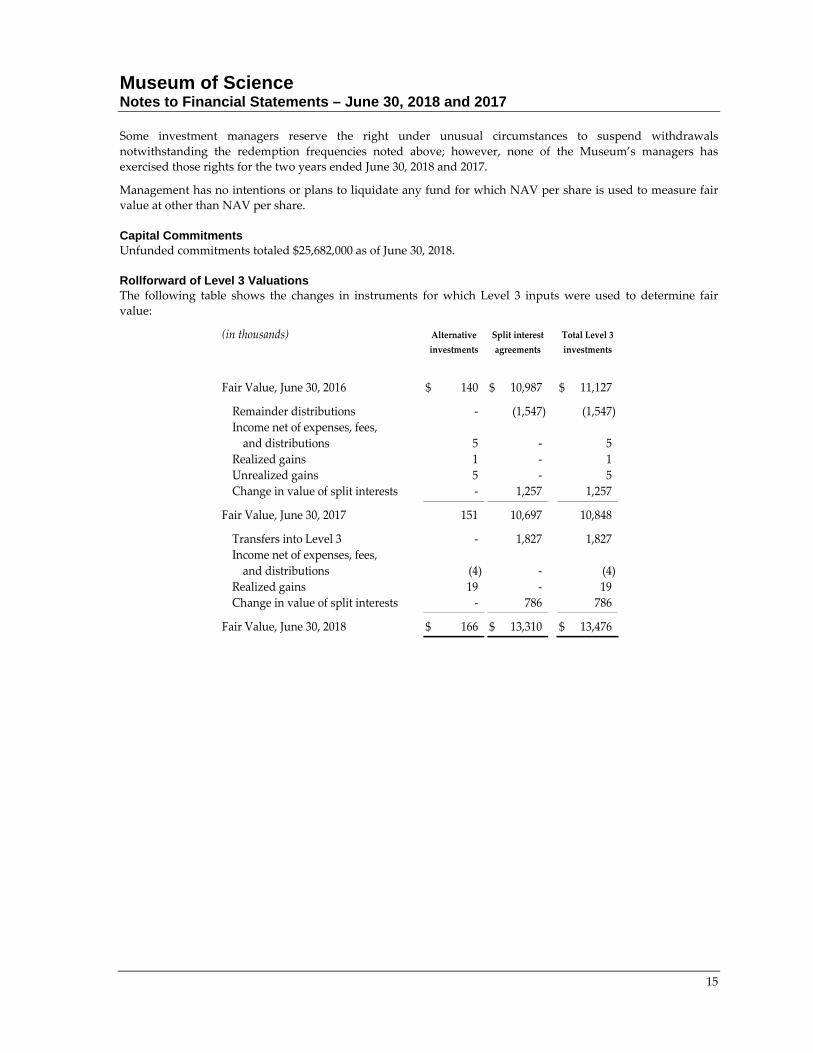
Some investment managers reserve the right under unusual circumstances to suspend withdrawals
notwithstanding the redemption frequencies noted above; however, none of the Museum’s managers has
exercised those rights for the two years ended June 30, 2018 and 2017.
Management has no intentions or plans to liquidate any fund for which NAV per share is used to measure fair
value at other than NAV per share.
Capital Commitments Unfunded commitments totaled $25,682,000 as of June 30, 2018.
Rollforward of Level 3 Valuations The following table shows the changes in instruments for which Level 3 inputs were used to determine fair
value:
(in thousands)
Fair Value, June 30, 2016 140$ 10,987$ 11,127$
Remainder distributions ‐ (1,547) (1,547)
Income net of expenses, fees,
and distributions 5 ‐ 5
Realized gains 1 ‐ 1
Unrealized gains 5 ‐ 5
Change in value of split interests ‐ 1,257 1,257
Fair Value, June 30, 2017 151 10,697 10,848
Transfers into Level 3 ‐ 1,827 1,827
Income net of expenses, fees,
and distributions (4) ‐ (4)
Realized gains 19 ‐ 19
Change in value of split interests ‐ 786 786
Fair Value, June 30, 2018 166$ 13,310$ 13,476$
Split interest
agreements
Total Level 3
investments
Alternative
investments

Museum of Science Notes to Financial Statements – June 30, 2018 and 2017
16
NOTE 5 – ENDOWMENT
The Museum’s endowment includes both donor‐restricted endowment funds and funds designated by the Board
of Trustees to function as endowments (“quasi‐endowments”). The endowment consists of 118 individual
donor‐restricted endowment funds and 29 quasi‐endowment funds established for a variety of purposes. The
net assets associated with endowment funds including quasi‐endowments, are classified and reported based on
the existence or absence of donor imposed restrictions. As of June 30, 2018 and 2017, the endowment accounted
for $156,367,000 and $146,327,000 of the Museum’s investments, respectively, inclusive of additions to the
endowment which had been received and liquidations which had been recorded but not yet invested/withdrawn
at each year‐end.
In 2018, the Museum liquidated $610,000 of its board‐designated quasi‐endowment to fund marketing,
advancement, and facility projects associated with its long range plan. In 2018, the Museum also liquidated
$931,000 of its quasi‐endowment and transferred the funds to the newly separated Clubhouse Network as part of
its obligations under the separation agreement (see Note 14).
The Museum follows the “Uniform Prudent Management of Institutional Funds Act” (“UPMIFA”) as
promulgated in Massachusetts. The Board of Trustees of the Museum has interpreted UPMIFA as requiring the
preservation of the original gift as of the gift date of the donor‐restricted endowment funds absent explicit donor
stipulations to the contrary. As a result of this interpretation, the Museum classifies as permanently restricted
net assets, (a) the original value of gifts donated to the permanent endowment, (b) the original value of
subsequent gifts to the permanent endowment, and (c) accumulations to the permanent endowment made in
accordance with the direction of the applicable donor gift instrument at the time the accumulation is added to
the fund. The remaining portion of the donor‐restricted endowment fund that is not classified as permanently
restricted net assets is classified as temporarily restricted net assets until those amounts are appropriated for
expenditure by the Museum in a manner consistent with the standard of prudence prescribed by UPMIFA. In
accordance with UPMIFA, the Museum considers the following factors in making a determination to
appropriate or accumulate endowment funds:
1) The duration and preservation of the fund
2) The purposes of the Museum and the donor‐restricted endowment fund
3) General economic conditions
4) The possible effect of inflation and deflation
5) The expected total return from income and the appreciation of investments
6) Other resources of the Museum
7) The investment policies of the Museum.
Endowment funds segregated by net asset class at June 30, 2018 and 2017 are as follows:
(in thousands)
Temporarily Permanently
Unrestricted restricted restricted Total
Donor‐restricted funds 71,420$ 74,482$ 145,902$
Board‐designated funds 10,465$ ‐ ‐ 10,465
Total endowment net assets 10,465$ 71,420$ 74,482$ 156,367$
Temporarily Permanently
Unrestricted restricted restricted Total
Donor‐restricted funds 64,079$ 71,064$ 135,143$
Board‐designated funds 11,184$ ‐ ‐ 11,184
Total endowment net assets 11,184$ 64,079$ 71,064$ 146,327$
2017
2018

Museum of Science Notes to Financial Statements – June 30, 2018 and 2017
17
The following schedules summarize the change in endowment net assets for the years ended June 30, 2018 and
2017:
(in thousands)
Temporarily Permanently
Unrestricted restricted restricted Total
Endowment net assets, beginning of year 11,184$ 64,079$ 71,064$ 146,327$
Investment return:
Investment income, net of fees 330 366 ‐ 696
Net appreciation 970 11,699 27 12,696
Total investment return 1,300 12,065 27 13,392
Contributions 99 ‐ 3,305 3,404
Other additions to corpus 166 ‐ 86 252
Endowment income per spending policy (743) (4,724) ‐ (5,467)
Other changes:
Liquidation for long range plan (610) ‐ ‐ (610)
Liquidation for separation of business unit (931) ‐ ‐ (931)
Endowment net assets, end of year 10,465$ 71,420$ 74,482$ 156,367$
2018
Temporarily Permanently
Unrestricted restricted restricted Total
Endowment net assets, beginning of year 10,053$ 55,133$ 39,901$ 105,087$
Investment return:
Investment income, net of fees 120 147 ‐ 267
Net appreciation 1,278 13,415 36 14,729
Total investment return 1,398 13,562 36 14,996
Contributions 192 ‐ 29,557 29,749
Other additions to corpus 51 ‐ 1,570 1,621
Endowment income per spending policy (574) (4,552) ‐ (5,126)
Other changes:
Funding of underwater funds 64 (64) ‐ ‐
Endowment net assets, end of year 11,184$ 64,079$ 71,064$ 146,327$
2017

Museum of Science Notes to Financial Statements – June 30, 2018 and 2017
18
Endowment Funds with Deficits (i.e. Underwater funds) From time to time, the fair value of assets associated with individual donor‐restricted endowment funds may fall
below the value of the initial and subsequent donor gift amounts. When such endowment deficits exist, they are
classified as a reduction of unrestricted net assets. There were no such deficits as of June 30, 2018 and 2017.
In order to preserve the original gift in accordance with the Board’s interpretation of UPMIFA, the Museum does
not appropriate for expenditure that portion of a fund which represents the value of the initial and subsequent
gift amounts. For donor‐restricted endowment funds, the Museum’s Spending Allocation Policy (see below) is
suspended during any month when such appropriation would leave the fund in deficit, and only current period
interest and dividend income is allocated for spending.
Return Objectives and Risk Parameters The Museum has adopted endowment investment and spending policies that attempt to provide a predictable
stream of funding to programs supported by the endowment while seeking to maintain the purchasing power of
endowment assets. Under this policy, the return objective for the endowment assets, measured over a full
market cycle, shall be to maximize the return against a blended index, based on the endowment’s target asset
allocation applied to the appropriate individual benchmarks.
Strategies Employed for Achieving Investment Objectives To achieve its long‐term rate of return objectives, the Museum relies on a total return strategy in which
investment returns are achieved through both capital appreciation (realized and unrealized gains) and current
yield (interest and dividends). The Museum targets a diversified asset allocation that places greater emphasis on
investments whose underlying holdings are equity‐based to achieve its long‐term objectives within prudent risk
constraints.
Endowment Spending Allocation Policy and Relationship to Investment Objectives Prior to July 1, 2017, the Museum’s spending allocation policy appropriated for expenditure an amount of up to
5 percent of the 20‐quarter moving average of the fair value of the endowment as measured at the December 31
preceding the fiscal year in which the distribution is planned. For the year beginning July 1, 2017, the policy was
changed to 4.75% of the 16‐quarter moving average. On a monthly basis, one twelfth of the pre‐determined
annual amount is allocated among the individual endowment funds on the basis of each fund’s fair value as
compared to that of the pool as a whole. Donor‐restricted funds with deficits in any month are excepted from
this policy during that month and allocated only their share of interest and dividend income received. In
establishing this policy, the Board considered the expected long term rate of return on its endowment.
Accordingly, over the long term, the Museum expects its current asset allocation policy to provide sufficient
endowment growth to fund its spending policy and also maintain the purchasing power of the endowment
assets. The asset allocation and spending policies are reviewed periodically and may be adjusted as necessary to
meet these objectives.
Under the base spending allocation policy, large gifts may have a distorting effect on the allocation of income to
existing funds until such time as they are fully absorbed into the lookback period. Therefore, the Board reserves
the right to exempt unusually large endowment additions from the standard procedure and subject those gifts to
a separate allocation policy. When it does so, the Board will seek to approximate the allocation rate applied to
the main endowment, while protecting the future earning power of the exempted fund. Funds with special
allocation policies may be migrated back into the standard policy at such time as the effect on other funds of
doing so is negligible.
In July 2016, the Museum received a 3‐year endowment pledge of unprecedented size, and has chosen to exempt
it from participation in the standard income allocation policy and instead apply a specific policy agreed to by the
donor. This policy calls for increasing predetermined annual appropriation amounts until June 2024, after which
each fiscal year’s appropriation is to be 4 percent of the 20 quarter moving average of the fair value of the fund as
measured at the preceding December 31.
Museum of Science Notes to Financial Statements – June 30, 2018 and 2017
19
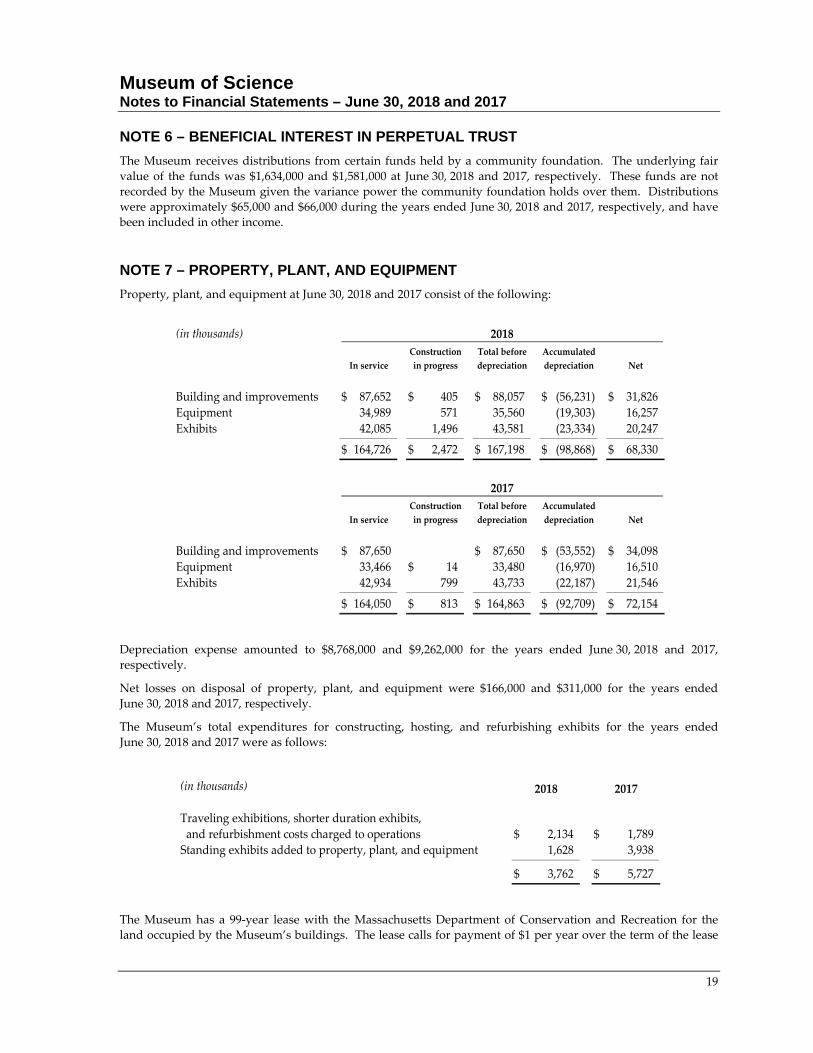
NOTE 6 – BENEFICIAL INTEREST IN PERPETUAL TRUST
The Museum receives distributions from certain funds held by a community foundation. The underlying fair
value of the funds was $1,634,000 and $1,581,000 at June 30, 2018 and 2017, respectively. These funds are not
recorded by the Museum given the variance power the community foundation holds over them. Distributions
were approximately $65,000 and $66,000 during the years ended June 30, 2018 and 2017, respectively, and have
been included in other income.
NOTE 7 – PROPERTY, PLANT, AND EQUIPMENT
Property, plant, and equipment at June 30, 2018 and 2017 consist of the following:
(in thousands)
Construction Total before Accumulated
11 In service in progress depreciation depreciation Net
Building and improvements 87,652$ 405$ 88,057$ (56,231)$ 31,826$
Equipment 34,989 571 35,560 (19,303) 16,257
Exhibits 42,085 1,496 43,581 (23,334) 20,247
164,726$ 2,472$ 167,198$ (98,868)$ 68,330$
Construction Total before Accumulated
12 In service in progress depreciation depreciation Net
Building and improvements 87,650$ 87,650$ (53,552)$ 34,098$
Equipment 33,466 14$ 33,480 (16,970) 16,510
Exhibits 42,934 799 43,733 (22,187) 21,546
164,050$ 813$ 164,863$ (92,709)$ 72,154$
2018
2017
Depreciation expense amounted to $8,768,000 and $9,262,000 for the years ended June 30, 2018 and 2017,
respectively.
Net losses on disposal of property, plant, and equipment were $166,000 and $311,000 for the years ended
June 30, 2018 and 2017, respectively.
The Museum’s total expenditures for constructing, hosting, and refurbishing exhibits for the years ended
June 30, 2018 and 2017 were as follows:
(in thousands) 2018 2017
Traveling exhibitions, shorter duration exhibits,
and refurbishment costs charged to operations 2,134$ 1,789$
Standing exhibits added to property, plant, and equipment 1,628 3,938
3,762$ 5,727$
The Museum has a 99‐year lease with the Massachusetts Department of Conservation and Recreation for the
land occupied by the Museum’s buildings. The lease calls for payment of $1 per year over the term of the lease
Museum of Science Notes to Financial Statements – June 30, 2018 and 2017
20
and expires on December 1, 2047, with an option to renew for another 99 years under the same terms and
conditions as the original lease. Management does not assign a value to this agreement due to the nature of the
parcel at the time the Museum entered into the agreement. Therefore no value is recorded on the statement of
financial position, nor is any contribution recognized on the statement of activities.
NOTE 8 – MANAGEMENT AGREEMENTS AND OTHER VENDOR CONTRACTS
The Museum has contracted with an outside vendor to operate its food services. This contract expires in 2020
and is cancelable with notice. The vendor has made capital improvements totaling $4,056,000 associated with
the food service facilities, with these outlays being amortized on a straight‐line basis over a 20‐year schedule.
Should the Museum terminate the agreement, it is obligated to pay the vendor the unamortized balance of the
liability under management agreement, which was $1,385,000 and $1,590,000, as of June 30, 2018 and 2017,
respectively. The current portion of $205,000 is reflected in accounts payable and accrued liabilities each year.
The Museum has also contracted with an outside vendor to operate its gift shop. This contract expires in 2020.
Both agreements provide for minimum annual rental payments to the Museum, with additional amounts due
based on each vendor’s revenue. The combined minimum rent due each year under these contracts is $1,825,000.
Total actual revenue realized was $2,242,000 and $2,324,000 for the years ended June 30, 2018 and 2017,
respectively, which is included in ancillary services and other income.
In 2014, the Museum entered into a contract with a movie studio to develop a large traveling exhibition. The
agreement licenses the Museum to use intellectual property and custom‐developed materials for a period of 10
years. In 2017, the Museum entered into another contract with the same studio to produce a second copy of the
exhibit under similar terms. The two copies of the exhibit are on tour nationally and internationally and are
expected to be rented to 3‐5 institutions per year over the course of the license period, with the expectation that
such rentals will cover the initial investment and generate additional revenue for future projects.
NOTE 9 – ANNUITY PAYABLE, DEFERRED COMPENSATION, AND BENEFIT PLANS
The Museum has an annuity agreement with a related party individual which provides for fixed annual
payments for life. Using standard actuarial methods and life tables, management has estimated the net present
value of this obligation as $219,000 and $229,000 at June 30, 2018 and 2017, respectively. Of these amounts, the
current portion of $45,000 is included in accounts payable and accrued expenses each year.
In addition, the Museum has a non‐qualified deferred compensation plan under section 457 of the Internal
Revenue Code covering certain employees. Assets associated with this plan in the amount of $863,000 and
$729,000 at June 30, 2018 and 2017, respectively, are included in other assets, with the corresponding obligation
to the employees included in deferred compensation. For the years ended June 30, 2018 and 2017, the Museum
contributed $48,000 and $41,000, respectively, to the 457 plan.
The Museum has a long‐term employment agreement with its President and Director that provides for severance
payments upon termination. As these provisions are conditional on the President and Director’s continued
employment in good standing, no amount is recorded for the future portion of this contract on the financial
statements.
The Museum has two defined contribution plans for the benefit of its employees: a 403(b) savings plan (“the
Savings Plan”) and a 401(a) retirement plan (“the Retirement Plan”).
The Savings Plan allows employees to defer a percentage of their compensation on a pre‐ or post‐tax basis (or
both) subject to IRS limits. All employees are eligible to participate in the Savings Plan. All employees, except
interns, are automatically enrolled in the Savings Plan on the first day of the month following their date of hire at
a rate of 3% of the employee’s compensation, and employees may cease or resume participation at any time.
The Museum contributes between 2.25% and 4.5% (depending on age) of eligible employees’ compensation to
the Retirement Plan. These percentages are subject to annual review and may be changed at the discretion of the

Museum of Science Notes to Financial Statements – June 30, 2018 and 2017
21
Museum’s management. In addition, the Retirement Plan provides a match of up to 50% of the first 6% of an
employeeʹs contributions to the Savings Plan. Employees scheduled to work at least 17.5 hours per week who
have completed one year of service are automatically enrolled in the Retirement Plan. Vesting provisions for
Retirement Plan vary according to length of service.
For the years ended June 30, 2018 and 2017, the Museum incurred $1,187,000 and $1,341,000, respectively, in
contribution costs to the Retirement Plan. The Museum does not make contributions to the Savings Plan.
NOTE 10 – LEASES
The Museum leases energy conservation, office, 4‐D theater, and other equipment under capital leases that
expire at various dates through July, 2024.
The 4‐D theater equipment lease agreement also includes the provision of programs, supplies, and maintenance
services for the theater. The portion of the annual payments representing those items are expensed in the year
paid. Future payments on the programs, supplies, and maintenance portion of the agreement totaled $2,173,000
as of June 30, 2018.
Future minimum lease payments under capital leases with terms of more than one year at June 30, 2018 are as
follows:
(in thousands) Capital 4‐D programs
leases and services
2019 661$ 324$
2020 547 337
2021 540 350
2022 527 363
2023 520 376
After 2023 554 423
Total minimum lease payments 3,349 2,173$
Interest (498)
Present value of net minimum lease payments 2,851
(514)
Unamortized debt issuance costs (14)
Net long term obligations under capital leases 2,323$
Current portion of capital lease obligations included
in accounts payable and accrued liabilities
The net book value of assets acquired under capital leases was $2,987,000 and $3,622,000 as of June 30, 2018 and
2017, respectively.
Museum of Science Notes to Financial Statements – June 30, 2018 and 2017
22
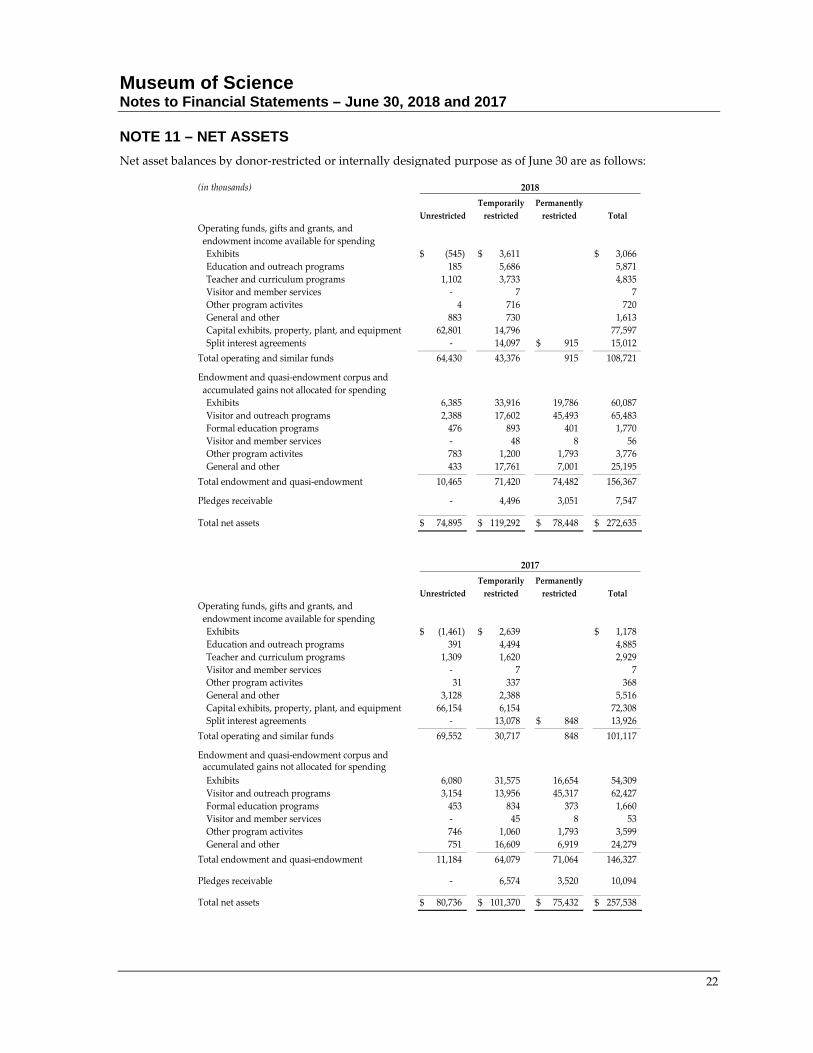
NOTE 11 – NET ASSETS
Net asset balances by donor‐restricted or internally designated purpose as of June 30 are as follows:
(in thousands)
Temporarily Permanently
Unrestricted restricted restricted Total
Operating funds, gifts and grants, and
endowment income available for spending
Exhibits (545)$ 3,611$ 3,066$
Education and outreach programs 185 5,686 5,871
Teacher and curriculum programs 1,102 3,733 4,835
Visitor and member services ‐ 7 7
Other program activites 4 716 720
General and other 883 730 1,613
Capital exhibits, property, plant, and equipment 62,801 14,796 77,597
Split interest agreements ‐ 14,097 915$ 15,012
Total operating and similar funds 64,430 43,376 915 108,721
Endowment and quasi‐endowment corpus and
accumulated gains not allocated for spending
Exhibits 6,385 33,916 19,786 60,087
Visitor and outreach programs 2,388 17,602 45,493 65,483
Formal education programs 476 893 401 1,770
Visitor and member services ‐ 48 8 56
Other program activites 783 1,200 1,793 3,776
General and other 433 17,761 7,001 25,195
Total endowment and quasi‐endowment 10,465 71,420 74,482 156,367
Pledges receivable ‐ 4,496 3,051 7,547
Total net assets 74,895$ 119,292$ 78,448$ 272,635$
2018
Temporarily Permanently
Unrestricted restricted restricted Total
Operating funds, gifts and grants, and
endowment income available for spending
Exhibits (1,461)$ 2,639$ 1,178$
Education and outreach programs 391 4,494 4,885
Teacher and curriculum programs 1,309 1,620 2,929
Visitor and member services ‐ 7 7
Other program activites 31 337 368
General and other 3,128 2,388 5,516
Capital exhibits, property, plant, and equipment 66,154 6,154 72,308
Split interest agreements ‐ 13,078 848$ 13,926
Total operating and similar funds 69,552 30,717 848 101,117
Endowment and quasi‐endowment corpus and accumulated gains not allocated for spending
Exhibits 6,080 31,575 16,654 54,309
Visitor and outreach programs 3,154 13,956 45,317 62,427
Formal education programs 453 834 373 1,660
Visitor and member services ‐ 45 8 53
Other program activites 746 1,060 1,793 3,599
General and other 751 16,609 6,919 24,279
Total endowment and quasi‐endowment 11,184 64,079 71,064 146,327
Pledges receivable ‐ 6,574 3,520 10,094
Total net assets 80,736$ 101,370$ 75,432$ 257,538$
2017
Museum of Science Notes to Financial Statements – June 30, 2018 and 2017
23
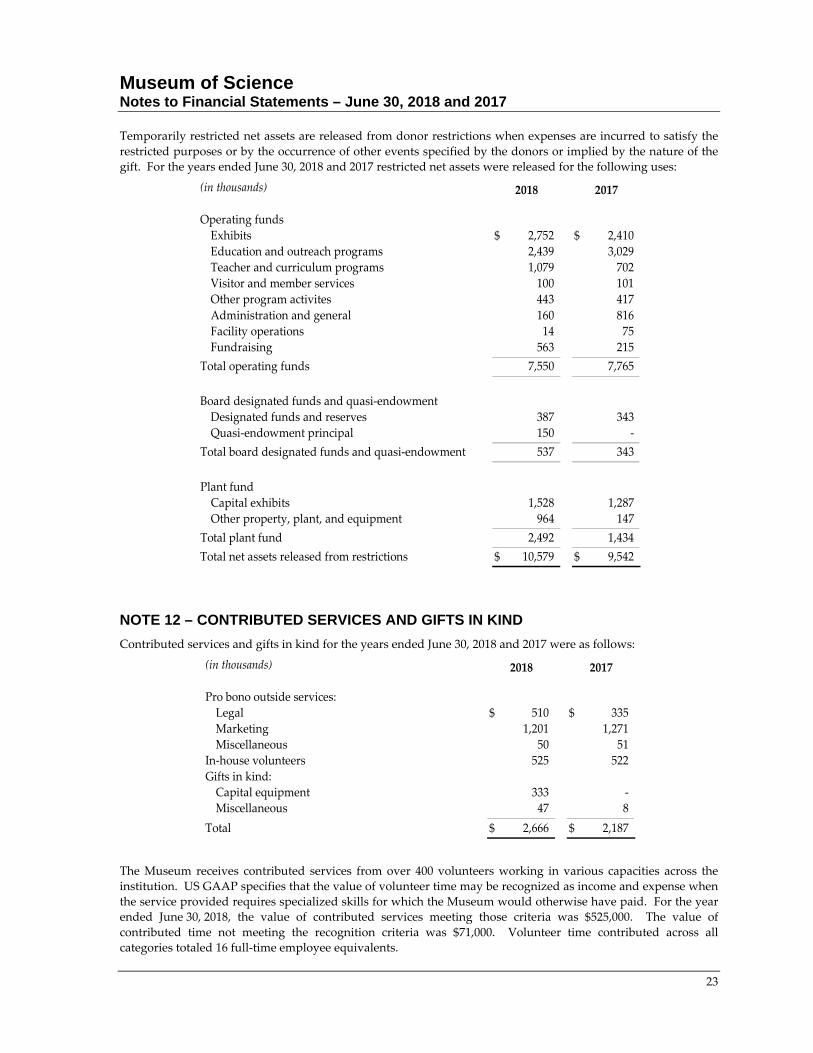
Temporarily restricted net assets are released from donor restrictions when expenses are incurred to satisfy the
restricted purposes or by the occurrence of other events specified by the donors or implied by the nature of the
gift. For the years ended June 30, 2018 and 2017 restricted net assets were released for the following uses:
(in thousands) 2018 2017
Operating funds
Exhibits 2,752$ 2,410$
Education and outreach programs 2,439 3,029
Teacher and curriculum programs 1,079 702
Visitor and member services 100 101
Other program activites 443 417
Administration and general 160 816
Facility operations 14 75
Fundraising 563 215
Total operating funds 7,550 7,765
Board designated funds and quasi‐endowment
Designated funds and reserves 387 343
Quasi‐endowment principal 150 ‐
Total board designated funds and quasi‐endowment 537 343
Plant fund
Capital exhibits 1,528 1,287
Other property, plant, and equipment 964 147
Total plant fund 2,492 1,434
Total net assets released from restrictions 10,579$ 9,542$
NOTE 12 – CONTRIBUTED SERVICES AND GIFTS IN KIND
Contributed services and gifts in kind for the years ended June 30, 2018 and 2017 were as follows:
(in thousands) 2018 2017
Pro bono outside services:
Legal 510$ 335$
Marketing 1,201 1,271
Miscellaneous 50 51
In‐house volunteers 525 522
Gifts in kind:
Capital equipment 333 ‐
Miscellaneous 47 8
Total 2,666$ 2,187$
The Museum receives contributed services from over 400 volunteers working in various capacities across the
institution. US GAAP specifies that the value of volunteer time may be recognized as income and expense when
the service provided requires specialized skills for which the Museum would otherwise have paid. For the year
ended June 30, 2018, the value of contributed services meeting those criteria was $525,000. The value of
contributed time not meeting the recognition criteria was $71,000. Volunteer time contributed across all
categories totaled 16 full‐time employee equivalents.

Museum of Science Notes to Financial Statements – June 30, 2018 and 2017
24
NOTE 13 – GOVERNMENT AWARDS
The Museum has received federal, state, and international government awards to support both its general
operations and specific projects and programs. Funds expended in connection with these grants are subject to
review or audit by the granting agencies. Government support for the years ended June 30, 2018 and 2017 was
as follows:
(in thousands) 2017
State Federal Intʹl Total
Direct cost support 4 6 8
General operating support 57$ 57$ 68$
Exhibits ‐ 808$ 808 1,740
Programs 16 1,783 39$ 1,838 1,983
Capital projects 212 277 ‐ 489 208
Other ‐ 11 ‐ 11 ‐
285 2,879 39 3,203 3,999
Indirect cost recovery ‐ 803 15 818 866
Net change in estimate for
unbilled subawards ‐ 444 ‐ 444 (245)
Total 285$ 4,126$ 54$ 4,465$ 4,620$
2018
These figures include only transactions under awards as that term is defined in applicable government
regulations. Revenue under contracts and other agreements whereby a government entity procures goods or
services from the Museum in the same manner as a non‐government customer are recorded on the revenue line
associated with the goods or services procured.
The Museum’s federal awards include substantial subawards. At the end of each fiscal year, the Museum
estimates and accrues charges incurred, but not yet billed, by its subawardees in order to more accurately reflect
total program costs. The accrual is reversed in the subsequent fiscal year as actual subaward billings are
received. These accrued charges are not billed to government funders; only actual charges are billed for
reimbursement.
NOTE 14 – SEPARATION OF BUSINESS UNIT
On February 2, 2018, the Museum signed an agreement separating its Clubhouse Network program into an
independent 501(c)(3) corporation. The Clubhouse Network is a community of 100 clubhouses located in 18
countries providing mentored afterschool programs to underserved teenagers to develop technological skills.
Individual member clubhouses are independent organizations, while the flagship site and network
administration were, prior to the separation, part of the Museum.
The separation agreement required the Museum to transfer certain financial assets to the new organization,
including various unexpended gifts and grants restricted to Clubhouse programs and a quasi‐endowment
designated for the same purpose. Total assets to be transferred were $1,472,000, of which $1,261,000 had been
paid as of June 30, 2018 and $211,000 remained in accounts payable.
The new Clubhouse Network, Inc. is wholly independent of the Museum. However, the Museum will act as
fiscal agent on certain federal awards until such time as the Clubhouse Network develops the systems and
expertise to accept direct responsibility for such awards.
Museum of Science Notes to Financial Statements – June 30, 2018 and 2017
25
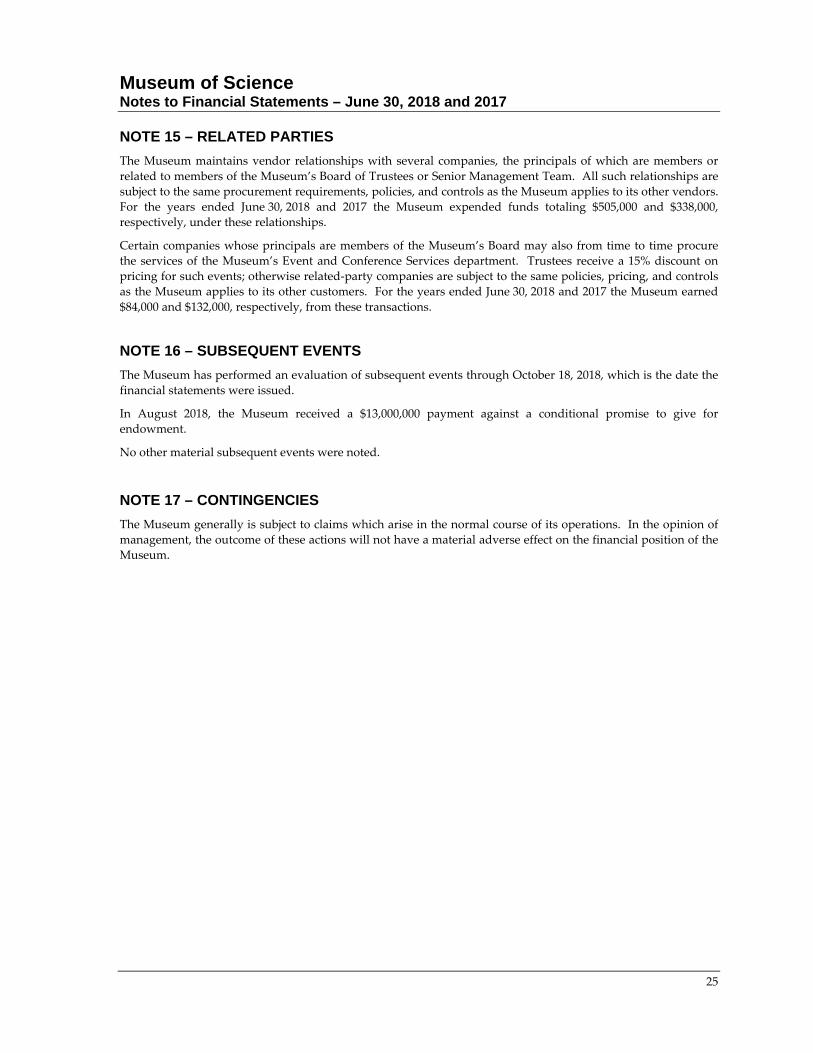
NOTE 15 – RELATED PARTIES
The Museum maintains vendor relationships with several companies, the principals of which are members or
related to members of the Museum’s Board of Trustees or Senior Management Team. All such relationships are
subject to the same procurement requirements, policies, and controls as the Museum applies to its other vendors.
For the years ended June 30, 2018 and 2017 the Museum expended funds totaling $505,000 and $338,000,
respectively, under these relationships.
Certain companies whose principals are members of the Museum’s Board may also from time to time procure
the services of the Museum’s Event and Conference Services department. Trustees receive a 15% discount on
pricing for such events; otherwise related‐party companies are subject to the same policies, pricing, and controls
as the Museum applies to its other customers. For the years ended June 30, 2018 and 2017 the Museum earned
$84,000 and $132,000, respectively, from these transactions.
NOTE 16 – SUBSEQUENT EVENTS
The Museum has performed an evaluation of subsequent events through October 18, 2018, which is the date the
financial statements were issued.
In August 2018, the Museum received a $13,000,000 payment against a conditional promise to give for
endowment.
No other material subsequent events were noted.
NOTE 17 – CONTINGENCIES
The Museum generally is subject to claims which arise in the normal course of its operations. In the opinion of
management, the outcome of these actions will not have a material adverse effect on the financial position of the
Museum.
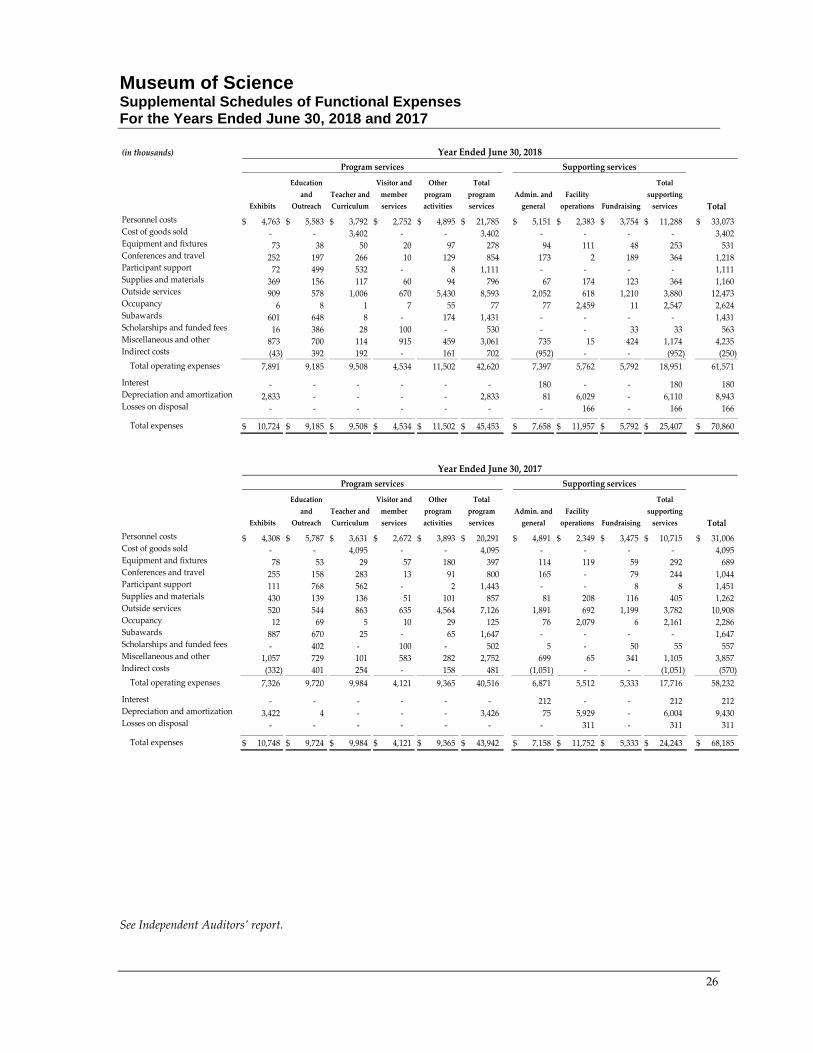
Museum of Science Supplemental Schedules of Functional Expenses For the Years Ended June 30, 2018 and 2017
26
(in thousands)
Exhibits
Education
and
Outreach
Teacher and
Curriculum
Visitor and
member
services
Other
program
activities
Total
program
services
Admin. and
general
Facility
operations Fundraising
Total
supporting
services Total
Personnel costs 4,763$ 5,583$ 3,792$ 2,752$ 4,895$ 21,785$ 5,151$ 2,383$ 3,754$ 11,288$ 33,073$ Cost of goods sold ‐ ‐ 3,402 ‐ ‐ 3,402 ‐ ‐ ‐ ‐ 3,402 Equipment and fixtures 73 38 50 20 97 278 94 111 48 253 531 Conferences and travel 252 197 266 10 129 854 173 2 189 364 1,218 Participant support 72 499 532 ‐ 8 1,111 ‐ ‐ ‐ ‐ 1,111 Supplies and materials 369 156 117 60 94 796 67 174 123 364 1,160 Outside services 909 578 1,006 670 5,430 8,593 2,052 618 1,210 3,880 12,473 Occupancy 6 8 1 7 55 77 77 2,459 11 2,547 2,624 Subawards 601 648 8 ‐ 174 1,431 ‐ ‐ ‐ ‐ 1,431 Scholarships and funded fees 16 386 28 100 ‐ 530 ‐ ‐ 33 33 563 Miscellaneous and other 873 700 114 915 459 3,061 735 15 424 1,174 4,235 Indirect costs (43) 392 192 ‐ 161 702 (952) ‐ ‐ (952) (250)
Total operating expenses 7,891 9,185 9,508 4,534 11,502 42,620 7,397 5,762 5,792 18,951 61,571
Interest ‐ ‐ ‐ ‐ ‐ ‐ 180 ‐ ‐ 180 180 Depreciation and amortization 2,833 ‐ ‐ ‐ ‐ 2,833 81 6,029 ‐ 6,110 8,943 Losses on disposal ‐ ‐ ‐ ‐ ‐ ‐ ‐ 166 ‐ 166 166
Total expenses 10,724$ 9,185$ 9,508$ 4,534$ 11,502$ 45,453$ 7,658$ 11,957$ 5,792$ 25,407$ 70,860$
Exhibits
Education
and
Outreach
Teacher and
Curriculum
Visitor and
member
services
Other
program
activities
Total
program
services
Admin. and
general
Facility
operations Fundraising
Total
supporting
services Total
Personnel costs 4,308$ 5,787$ 3,631$ 2,672$ 3,893$ 20,291$ 4,891$ 2,349$ 3,475$ 10,715$ 31,006$ Cost of goods sold ‐ ‐ 4,095 ‐ ‐ 4,095 ‐ ‐ ‐ ‐ 4,095 Equipment and fixtures 78 53 29 57 180 397 114 119 59 292 689 Conferences and travel 255 158 283 13 91 800 165 ‐ 79 244 1,044 Participant support 111 768 562 ‐ 2 1,443 ‐ ‐ 8 8 1,451 Supplies and materials 430 139 136 51 101 857 81 208 116 405 1,262 Outside services 520 544 863 635 4,564 7,126 1,891 692 1,199 3,782 10,908 Occupancy 12 69 5 10 29 125 76 2,079 6 2,161 2,286 Subawards 887 670 25 ‐ 65 1,647 ‐ ‐ ‐ ‐ 1,647 Scholarships and funded fees ‐ 402 ‐ 100 ‐ 502 5 ‐ 50 55 557 Miscellaneous and other 1,057 729 101 583 282 2,752 699 65 341 1,105 3,857 Indirect costs (332) 401 254 ‐ 158 481 (1,051) ‐ ‐ (1,051) (570)
Total operating expenses 7,326 9,720 9,984 4,121 9,365 40,516 6,871 5,512 5,333 17,716 58,232
Interest ‐ ‐ ‐ ‐ ‐ ‐ 212 ‐ ‐ 212 212 Depreciation and amortization 3,422 4 ‐ ‐ ‐ 3,426 75 5,929 ‐ 6,004 9,430 Losses on disposal ‐ ‐ ‐ ‐ ‐ ‐ ‐ 311 ‐ 311 311
Total expenses 10,748$ 9,724$ 9,984$ 4,121$ 9,365$ 43,942$ 7,158$ 11,752$ 5,333$ 24,243$ 68,185$
Program services Supporting services
Program services
Year Ended June 30, 2018
Supporting services
Year Ended June 30, 2017
See Independent Auditors’ report.
THE END.