Embed Size (px)
Citation preview
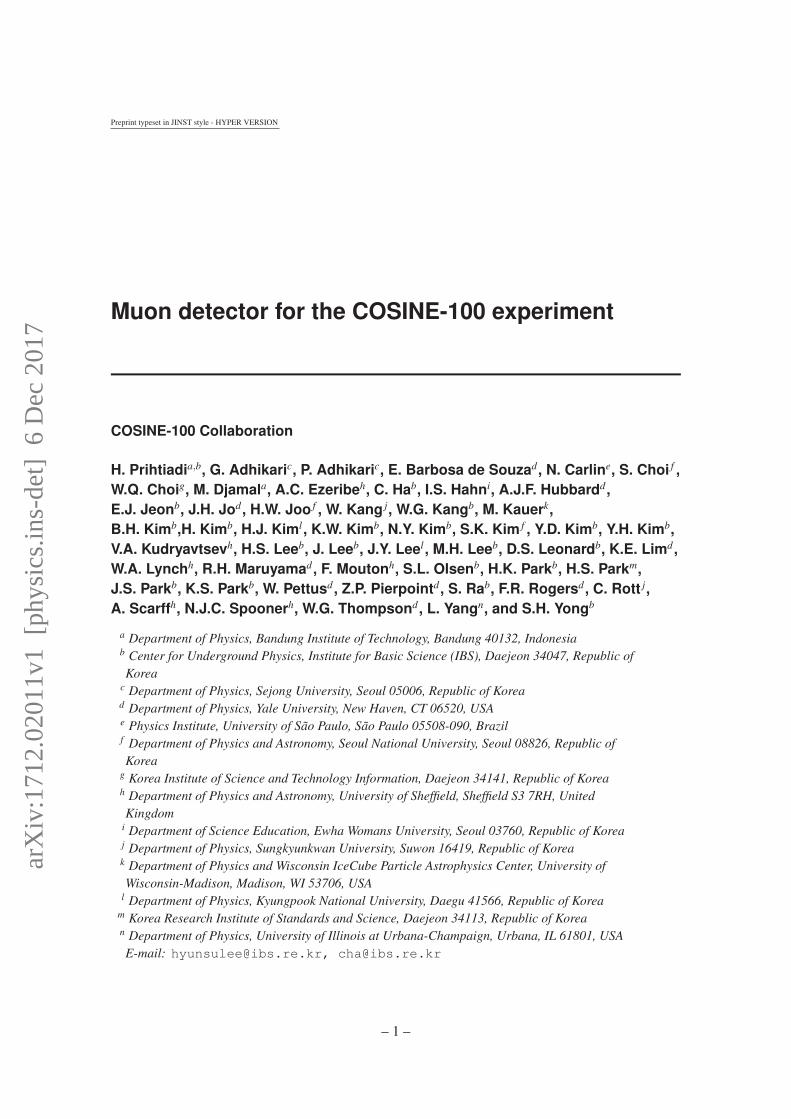
Preprint typeset in JINST style - HYPER VERSION
Muon detector for the COSINE-100 experiment
COSINE-100 Collaboration
H. Prihtiadia,b, G. Adhikaric, P. Adhikaric, E. Barbosa de Souzad , N. Carline, S. Choi f ,W.Q. Choig, M. Djamala, A.C. Ezeribeh, C. Hab, I.S. Hahni, A.J.F. Hubbardd ,E.J. Jeonb, J.H. Jod , H.W. Joo f , W. Kang j, W.G. Kangb, M. Kauerk,B.H. Kimb,H. Kimb, H.J. Kiml, K.W. Kimb, N.Y. Kimb, S.K. Kim f , Y.D. Kimb, Y.H. Kimb,V.A. Kudryavtsevh, H.S. Leeb, J. Leeb, J.Y. Leel, M.H. Leeb, D.S. Leonardb, K.E. Limd ,W.A. Lynchh, R.H. Maruyamad , F. Moutonh, S.L. Olsenb, H.K. Parkb, H.S. Parkm,J.S. Parkb, K.S. Parkb, W. Pettusd , Z.P. Pierpointd , S. Rab, F.R. Rogersd , C. Rott j,A. Scarffh, N.J.C. Spoonerh, W.G. Thompsond , L. Yangn, and S.H. Yongb
a Department of Physics, Bandung Institute of Technology, Bandung 40132, Indonesiab Center for Underground Physics, Institute for Basic Science (IBS), Daejeon 34047, Republic ofKorea
c Department of Physics, Sejong University, Seoul 05006, Republic of Koread Department of Physics, Yale University, New Haven, CT 06520, USAe Physics Institute, University of São Paulo, São Paulo 05508-090, Brazilf Department of Physics and Astronomy, Seoul National University, Seoul 08826, Republic ofKorea
g Korea Institute of Science and Technology Information, Daejeon 34141, Republic of Koreah Department of Physics and Astronomy, University of Sheffield, Sheffield S3 7RH, UnitedKingdom
i Department of Science Education, Ewha Womans University, Seoul 03760, Republic of Koreaj Department of Physics, Sungkyunkwan University, Suwon 16419, Republic of Koreak Department of Physics and Wisconsin IceCube Particle Astrophysics Center, University ofWisconsin-Madison, Madison, WI 53706, USA
l Department of Physics, Kyungpook National University, Daegu 41566, Republic of Koream Korea Research Institute of Standards and Science, Daejeon 34113, Republic of Korean Department of Physics, University of Illinois at Urbana-Champaign, Urbana, IL 61801, USAE-mail: [email protected], [email protected]
– 1 –
arX
iv:1
712.
0201
1v1
[ph
ysic
s.in
s-de
t] 6
Dec
201
7
ABSTRACT: The COSINE-100 dark matter search experiment has started taking physics data withthe goal of performing an independent measurement of the annual modulation signal observedby DAMA/LIBRA. A muon detector was constructed by using plastic scintillator panels in theoutermost layer of the shield surrounding the COSINE-100 detector. It is used to detect cosmic raymuons in order to understand the impact of the muon annual modulation on dark matter analysis.Assembly and initial performance test of each module have been performed at a ground laboratory.The installation of the detector in Yangyang Underground Laboratory (Y2L) was completed in thesummer of 2016. Using three months of data, the muon underground flux was measured to be328 ± 1(stat.)± 10(syst.) muons/m2/day. In this report, the assembly of the muon detector and theresults from the analysis are presented.
KEYWORDS: Cosmic-Ray Muons; COSINE-100 Experiment; Dark Matter; Plastic Scintillator;Muon Detector.

Contents
1. Introduction 1
2. Assembly of The Muon Detector 2
3. Underground measurement 5
4. Summary 8
1. Introduction
When a primary cosmic ray particle interacts with a molecule in the atmosphere, a shower ofenergetic hadrons including pions (π±) and kaons (K±) are generated. These quickly decay andproduce relativistic muons [1, 2] that are highly boosted with the livetime long enough to reach thesurface and deep underground laboratories. Therefore, they can be a significant background sourcein underground physics experiments. Because muons can produce spallation neutrons that canproduce scintillation signals in a crystal detector and could mimic those expected for dark matterparticles. It is essential to understand muon and muon-induced events in direct dark matter searchexperiments [3, 4].
Phenomena attributed to dark matter could be explained as being due to the effects of previ-ously unseen particles such as weakly interacting massive particles (WIMPs) which are stronglymotivated by theory [5, 6]. Numerous experiments have searched for WIMPs by directly detect-ing nuclei recoiling from WIMP–nucleon interactions in low background detectors located deepunderground [7, 8, 9]. A positive annual modulation signal would be a signature for dark matterdue to changes in the relative motion of the Earth orbits the Sun in the galaxy cluster. Amongvarious dark matter search experiments, the DAMA/LIBRA experiment using a NaI(Tl) crystal ar-ray [10, 11, 12] is extremely interesting because an annual modulation was observed, which can beinterpreted as WIMP–nucleon interactions [13].
Owing to temperature and density variations in the atmosphere, it is well known that the muonrate is modulated annually [14, 15, 16]. This fact motivated the consideration of muons as a pos-sible source to explain the DAMA/LIBRA signal [17, 18, 19]. However, this possibility remainsunresolved because there is a phase difference between the muon and expectations for WIMP-induced modulations [20], and the rates for muon-induced neutrons predicted in simulation-basedstudies [21, 22] are too low to explain the modulation observed by the DAMA/LIBRA experiment.
The COSINE-100 experiment is a collaboration between the Korea Invisible Mass Search (KIMS) [23,24, 25] and DM-Ice [15, 16] experiments to confirm or refute the annual modulation signal ob-served by the DAMA/LIBRA experiment. The COSINE-100 experiment was commissioned andhas been taking physics data since September 2016 with a 106 kg array of low-background NaI(Tl)
– 1 –
crystals in the Yangyang Underground Laboratory (Y2L) in Korea [26]. One of its features is theoutermost plastic scintillator panels surrounding the main detector, which are used to tag muonevents. In this paper, the assembly and initial performance of the muon detector is described aswell as a measurement of the cosmic ray flux.
2. Assembly of The Muon Detector
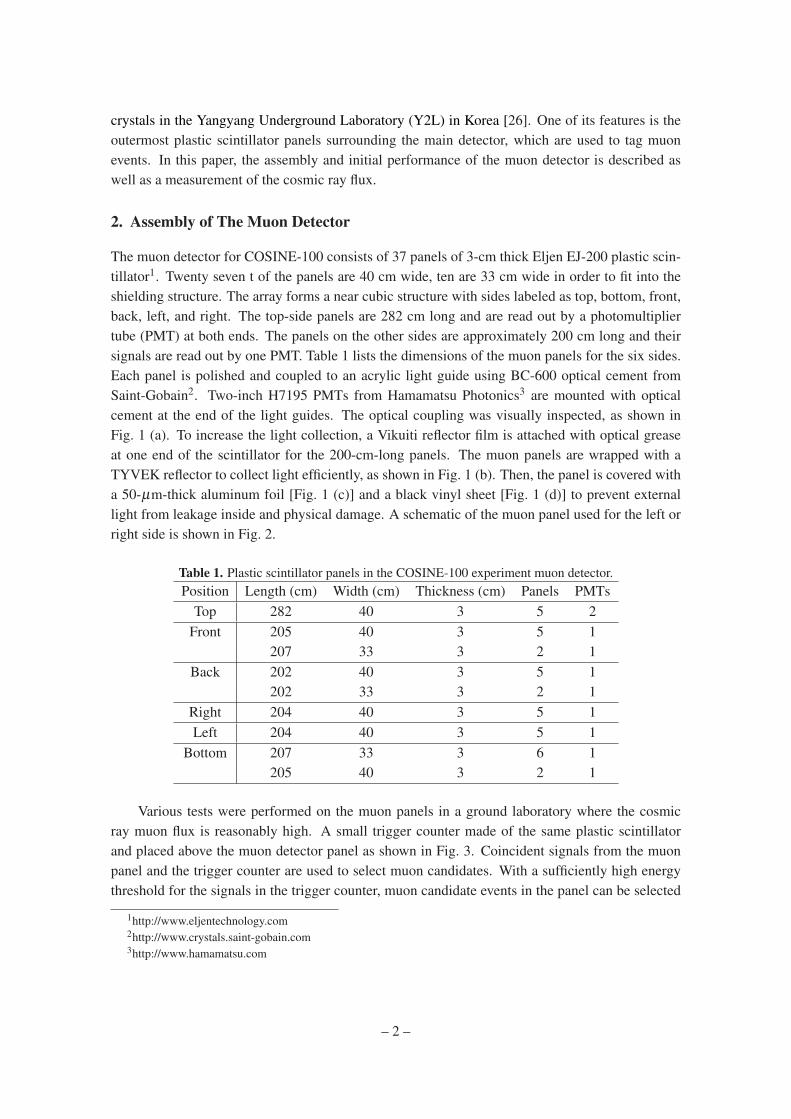
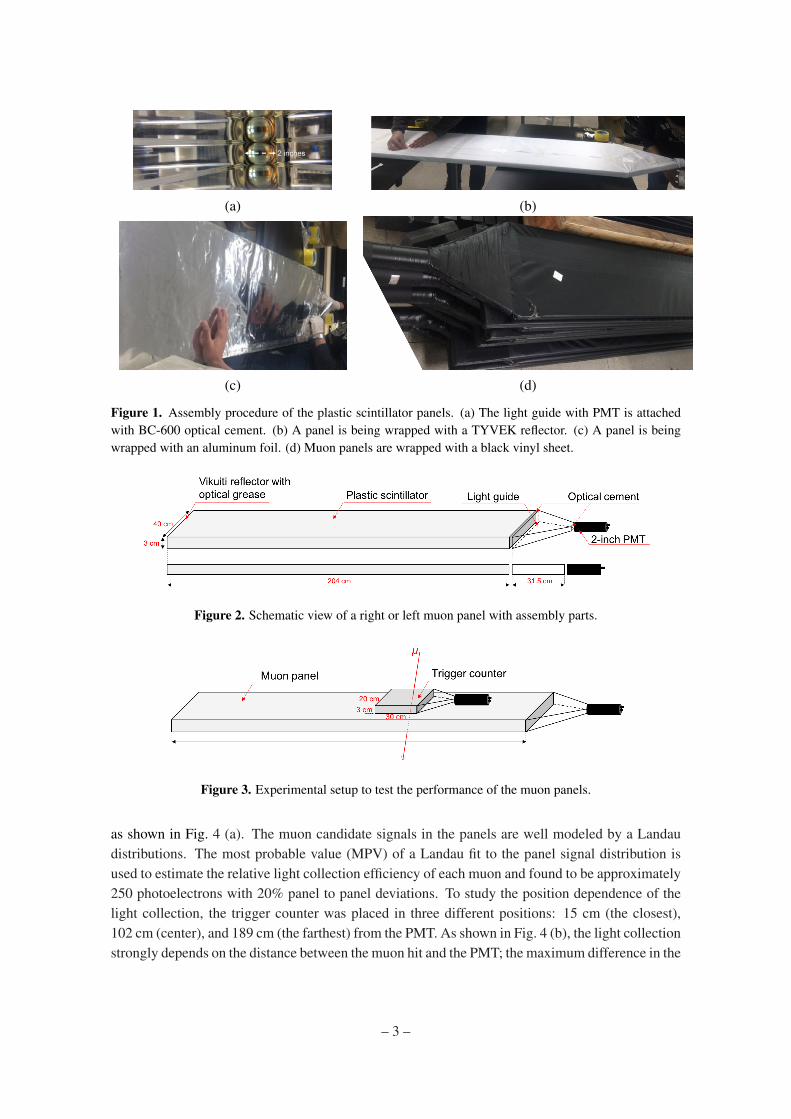
The muon detector for COSINE-100 consists of 37 panels of 3-cm thick Eljen EJ-200 plastic scin-tillator1. Twenty seven t of the panels are 40 cm wide, ten are 33 cm wide in order to fit into theshielding structure. The array forms a near cubic structure with sides labeled as top, bottom, front,back, left, and right. The top-side panels are 282 cm long and are read out by a photomultipliertube (PMT) at both ends. The panels on the other sides are approximately 200 cm long and theirsignals are read out by one PMT. Table 1 lists the dimensions of the muon panels for the six sides.Each panel is polished and coupled to an acrylic light guide using BC-600 optical cement fromSaint-Gobain2. Two-inch H7195 PMTs from Hamamatsu Photonics3 are mounted with opticalcement at the end of the light guides. The optical coupling was visually inspected, as shown inFig. 1 (a). To increase the light collection, a Vikuiti reflector film is attached with optical greaseat one end of the scintillator for the 200-cm-long panels. The muon panels are wrapped with aTYVEK reflector to collect light efficiently, as shown in Fig. 1 (b). Then, the panel is covered witha 50-µm-thick aluminum foil [Fig. 1 (c)] and a black vinyl sheet [Fig. 1 (d)] to prevent externallight from leakage inside and physical damage. A schematic of the muon panel used for the left orright side is shown in Fig. 2.
Table 1. Plastic scintillator panels in the COSINE-100 experiment muon detector.Position Length (cm) Width (cm) Thickness (cm) Panels PMTs
Top 282 40 3 5 2Front 205 40 3 5 1
207 33 3 2 1Back 202 40 3 5 1
202 33 3 2 1Right 204 40 3 5 1Left 204 40 3 5 1
Bottom 207 33 3 6 1205 40 3 2 1
Various tests were performed on the muon panels in a ground laboratory where the cosmicray muon flux is reasonably high. A small trigger counter made of the same plastic scintillatorand placed above the muon detector panel as shown in Fig. 3. Coincident signals from the muonpanel and the trigger counter are used to select muon candidates. With a sufficiently high energythreshold for the signals in the trigger counter, muon candidate events in the panel can be selected
1http://www.eljentechnology.com2http://www.crystals.saint-gobain.com3http://www.hamamatsu.com
– 2 –
2 inches
(a) (b)
(c) (d)
Figure 1. Assembly procedure of the plastic scintillator panels. (a) The light guide with PMT is attachedwith BC-600 optical cement. (b) A panel is being wrapped with a TYVEK reflector. (c) A panel is beingwrapped with an aluminum foil. (d) Muon panels are wrapped with a black vinyl sheet.
Figure 2. Schematic view of a right or left muon panel with assembly parts.
Figure 3. Experimental setup to test the performance of the muon panels.
as shown in Fig. 4 (a). The muon candidate signals in the panels are well modeled by a Landaudistributions. The most probable value (MPV) of a Landau fit to the panel signal distribution isused to estimate the relative light collection efficiency of each muon and found to be approximately250 photoelectrons with 20% panel to panel deviations. To study the position dependence of thelight collection, the trigger counter was placed in three different positions: 15 cm (the closest),102 cm (center), and 189 cm (the farthest) from the PMT. As shown in Fig. 4 (b), the light collectionstrongly depends on the distance between the muon hit and the PMT; the maximum difference in the
– 3 –

/ ndf = 82.61 / 712χ
Constant 14.9± 267.8
MPV 97.5± 8637
Sigma 53.7± 1189
ADC Sum (a.u.)10000 20000 30000 40000 50000
Num
ber
of E
vent
s
0
20
40
60
80 / ndf = 82.61 / 712χ
Constant 14.9± 267.8
MPV 97.5± 8637
Sigma 53.7± 1189
ADC Sum (a.u.)10000 20000 30000 40000 50000
Num
ber
of E
vent
s
0
20
40
60
80
15 cm from PMT
102 cm from PMT
189 cm from PMT
(a) (b)
Figure 4. (a) Muon candidate events selected by the trigger counter and modeled by a Landau distribution.(b) Position-dependent charge distribution for a 204 cm long muon panel.
light collection was 45%. However, muon candidate events far from the PMT were well separatedfrom background events. The muon selection threshold for each panel is determined from the dataaccumulated at the lowest light yield locations.
Figure 5. Schematic view of the muon tagging efficiency setup.
ADC sum (a.u.)5000 10000 15000 20000 25000 30000
Num
ber
of E
vent
s
210
310
410
510
Channel 1
Channel 2
ADC sum (a.u.)0 10000 20000 30000 40000 50000 60000 70000 80000
Num
ber
of E
vent
s
1
10
210
310
410
Muon threshold
ADC sum (a.u.)0 10000 20000 30000 40000 50000 60000 70000 80000
Num
ber
of E
vent
s
1
10
210
310
410
Muon threshold
(a) (b) (c)
Figure 6. (a) Charge distributions of the two trigger panels in the setup of Fig. 5. Charge distributions ofchannel 3 (b) and channel 4 (c) applying muon selection requirements for channel 1 (>4800) and channel2 (>5400).
To estimate the muon detection efficiency as well as measure the muon flux, four panels werestacked as shown in Fig. 5. A trigger for muon candidate events requires a coincident signals in atop (channel 1)–bottom (channel 2) pair. When the trigger is satisfied, data are recorded from allfour channels. If muons passing through the top–bottom pair are selected, these muons should also
– 4 –
pass the middle two panels. An offline selection signal threshold for muon candidates is applied forthe top and bottom panels to remove the environmental γ–or β–induced backgrounds as shown inFig. 6 (a). For the charge distributions of the middle two panels, the selected events are inspectedto see whether they are accepted as muon events as shown in Figs. 6 (b) and 6 (c). A total of425,824 events are selected as muon candidates from the top–bottom pairs. From this result, muondetection efficiency for the muon panels is determined approximately to be 99.6%; the 0.4% losscould include a systematic uncertainty due to minor misalignments of the panels. Muon candidateevents selected by coincident signals from the middle two panels are used to determine the muonflux at the ground laboratory, which is 136 ± 7 muons/m2/s.
3. Underground measurement
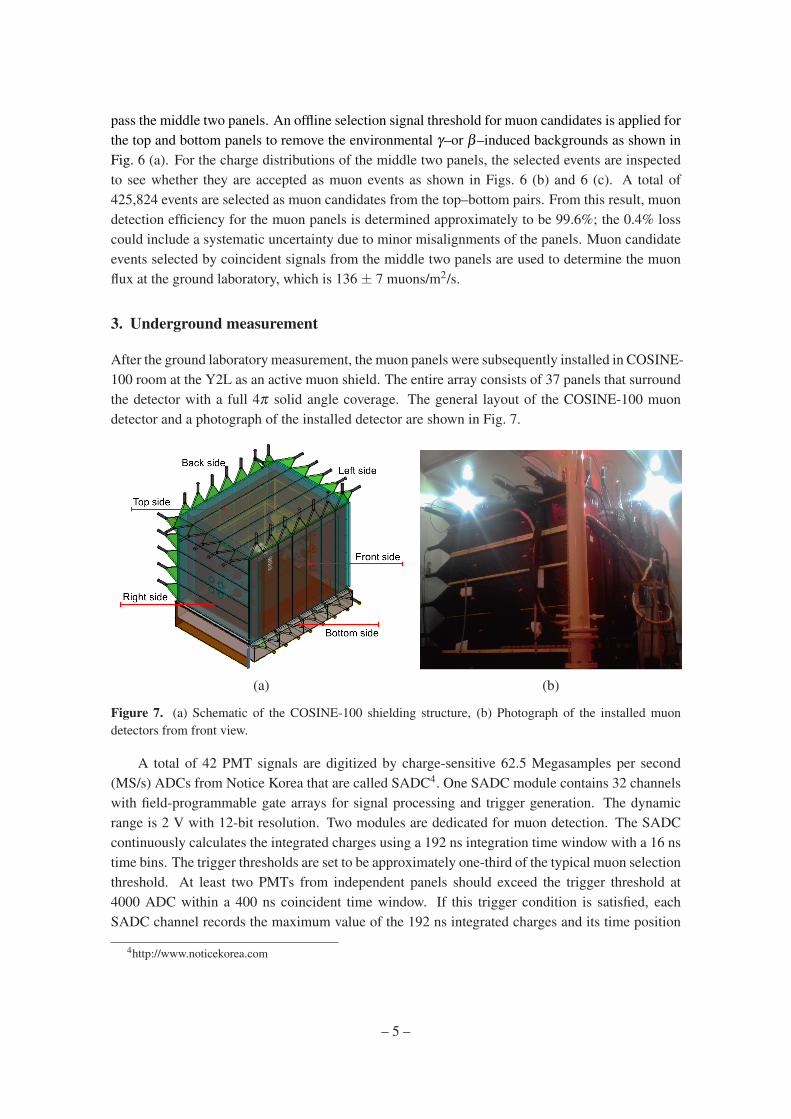
After the ground laboratory measurement, the muon panels were subsequently installed in COSINE-100 room at the Y2L as an active muon shield. The entire array consists of 37 panels that surroundthe detector with a full 4π solid angle coverage. The general layout of the COSINE-100 muondetector and a photograph of the installed detector are shown in Fig. 7.
(a) (b)
Figure 7. (a) Schematic of the COSINE-100 shielding structure, (b) Photograph of the installed muondetectors from front view.
A total of 42 PMT signals are digitized by charge-sensitive 62.5 Megasamples per second(MS/s) ADCs from Notice Korea that are called SADC4. One SADC module contains 32 channelswith field-programmable gate arrays for signal processing and trigger generation. The dynamicrange is 2 V with 12-bit resolution. Two modules are dedicated for muon detection. The SADCcontinuously calculates the integrated charges using a 192 ns integration time window with a 16 nstime bins. The trigger thresholds are set to be approximately one-third of the typical muon selectionthreshold. At least two PMTs from independent panels should exceed the trigger threshold at4000 ADC within a 400 ns coincident time window. If this trigger condition is satisfied, eachSADC channel records the maximum value of the 192 ns integrated charges and its time position
4http://www.noticekorea.com
– 5 –
within a 4 µs search window (a range of approximately −2 to 2 µs from the trigger position).Information for the six sides is calculated by combining the information of the panels constitutingeach side. The ADC charges are added for a given side panels, but the timing is selected from theone which has the maximum charge.
Muon flux in underground laboratories shows significantly reduced rate [27]. Because thesurviving deep underground muons still have high energies, most of the muons penetrate throughall of the detector materials while leaving relatively large energy depositions. Energetic muonsshould deposit energies that are greater than the minimum ionization energy, which is approxi-mately 6 MeV for a 3-cm-thick plastic scintillator [2] and is much larger than the typical γ or β
energies produced by environmental background components. In addition, because the muon de-tector provides 4π coverage of the COSINE-100 detector, muon signals can be expected to occuron at least two sides of the detector. Therefore, muon candidate events can be selected accordingto their energy deposits and coincidence requirements.
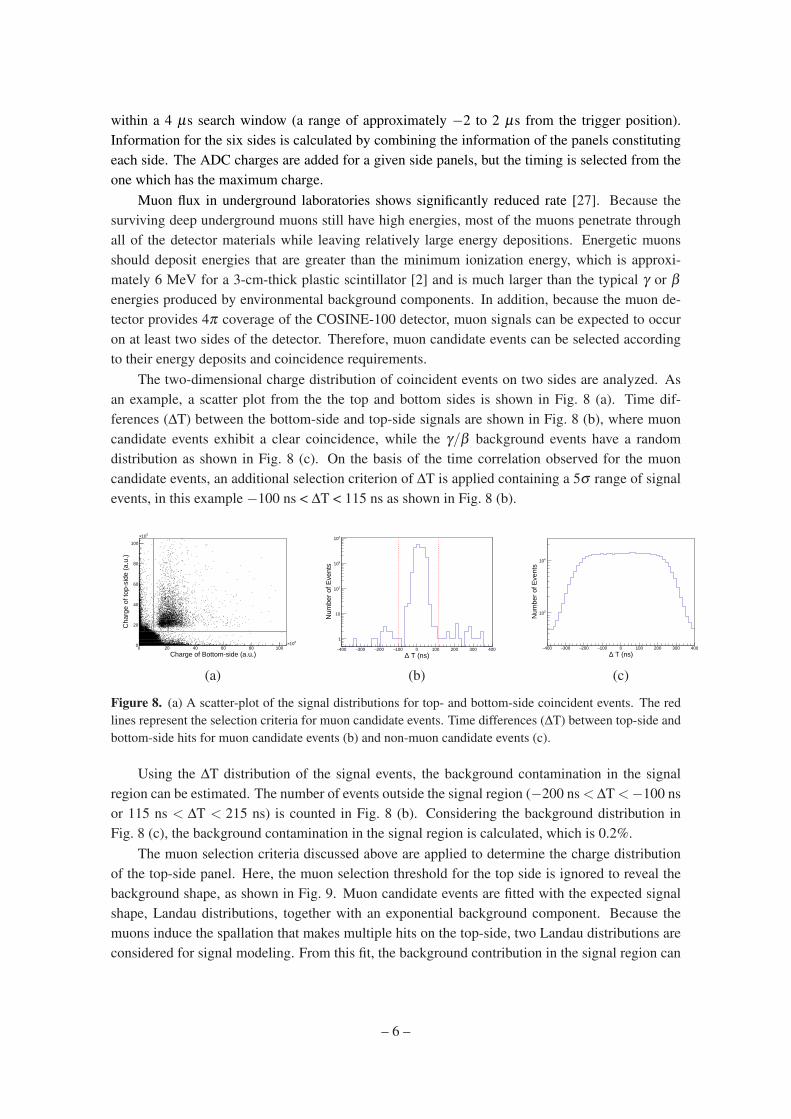
The two-dimensional charge distribution of coincident events on two sides are analyzed. Asan example, a scatter plot from the the top and bottom sides is shown in Fig. 8 (a). Time dif-ferences (∆T) between the bottom-side and top-side signals are shown in Fig. 8 (b), where muoncandidate events exhibit a clear coincidence, while the γ/β background events have a randomdistribution as shown in Fig. 8 (c). On the basis of the time correlation observed for the muoncandidate events, an additional selection criterion of ∆T is applied containing a 5σ range of signalevents, in this example −100 ns < ∆T < 115 ns as shown in Fig. 8 (b).
Charge of Bottom-side (a.u.)0 20 40 60 80 100
310×
Cha
rge
of to
p-si
de (
a.u.
)
0
20
40
60
80
100
310×
T (ns)∆400− 300− 200− 100− 0 100 200 300 400
Num
ber
of E
vent
s
1
10
210
310
410
T (ns)∆400− 300− 200− 100− 0 100 200 300 400
Num
ber
of E
vent
s
310
410
(a) (b) (c)
Figure 8. (a) A scatter-plot of the signal distributions for top- and bottom-side coincident events. The redlines represent the selection criteria for muon candidate events. Time differences (∆T) between top-side andbottom-side hits for muon candidate events (b) and non-muon candidate events (c).
Using the ∆T distribution of the signal events, the background contamination in the signalregion can be estimated. The number of events outside the signal region (−200 ns < ∆T <−100 nsor 115 ns < ∆T < 215 ns) is counted in Fig. 8 (b). Considering the background distribution inFig. 8 (c), the background contamination in the signal region is calculated, which is 0.2%.
The muon selection criteria discussed above are applied to determine the charge distributionof the top-side panel. Here, the muon selection threshold for the top side is ignored to reveal thebackground shape, as shown in Fig. 9. Muon candidate events are fitted with the expected signalshape, Landau distributions, together with an exponential background component. Because themuons induce the spallation that makes multiple hits on the top-side, two Landau distributions areconsidered for signal modeling. From this fit, the background contribution in the signal region can
– 6 –
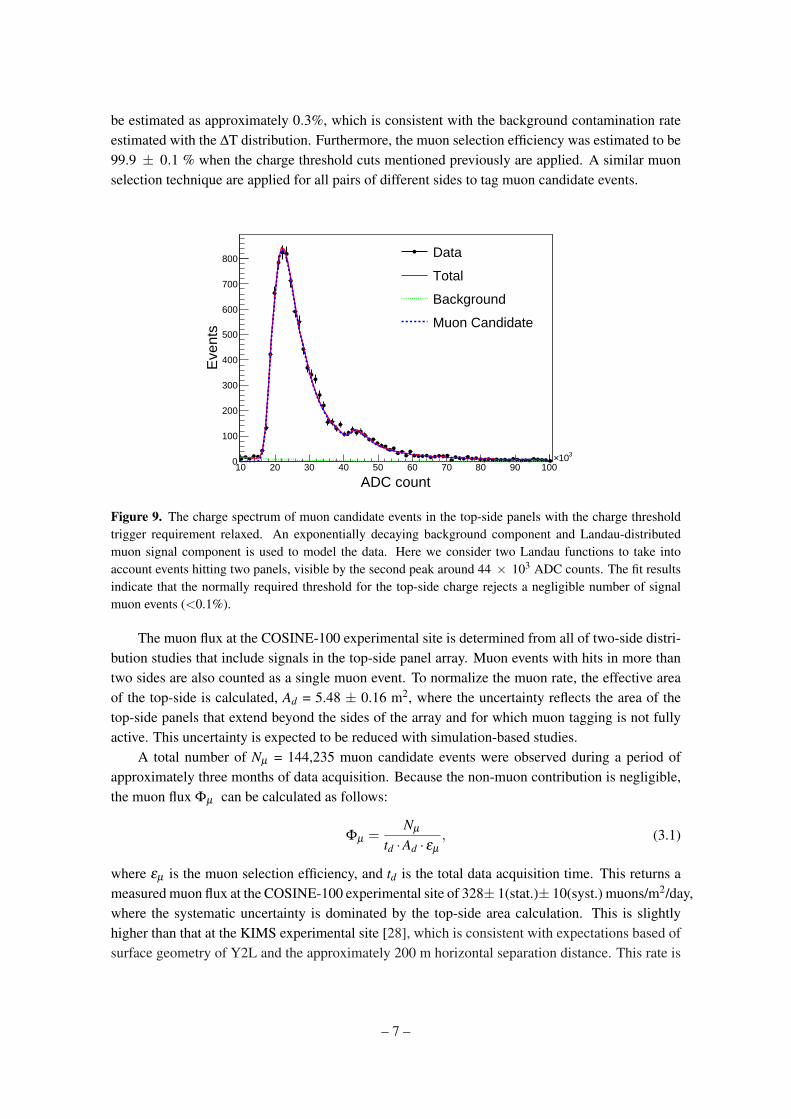
be estimated as approximately 0.3%, which is consistent with the background contamination rateestimated with the ∆T distribution. Furthermore, the muon selection efficiency was estimated to be99.9 ± 0.1 % when the charge threshold cuts mentioned previously are applied. A similar muonselection technique are applied for all pairs of different sides to tag muon candidate events.
ADC count10 20 30 40 50 60 70 80 90 100
310×
Eve
nts
0
100
200
300
400
500
600
700
800 Data
Total
Background
Muon Candidate
Figure 9. The charge spectrum of muon candidate events in the top-side panels with the charge thresholdtrigger requirement relaxed. An exponentially decaying background component and Landau-distributedmuon signal component is used to model the data. Here we consider two Landau functions to take intoaccount events hitting two panels, visible by the second peak around 44 × 103 ADC counts. The fit resultsindicate that the normally required threshold for the top-side charge rejects a negligible number of signalmuon events (<0.1%).
The muon flux at the COSINE-100 experimental site is determined from all of two-side distri-bution studies that include signals in the top-side panel array. Muon events with hits in more thantwo sides are also counted as a single muon event. To normalize the muon rate, the effective areaof the top-side is calculated, Ad = 5.48 ± 0.16 m2, where the uncertainty reflects the area of thetop-side panels that extend beyond the sides of the array and for which muon tagging is not fullyactive. This uncertainty is expected to be reduced with simulation-based studies.
A total number of Nµ = 144,235 muon candidate events were observed during a period ofapproximately three months of data acquisition. Because the non-muon contribution is negligible,the muon flux Φµ can be calculated as follows:
Φµ =Nµ
td ·Ad · εµ
, (3.1)
where εµ is the muon selection efficiency, and td is the total data acquisition time. This returns ameasured muon flux at the COSINE-100 experimental site of 328± 1(stat.)± 10(syst.) muons/m2/day,where the systematic uncertainty is dominated by the top-side area calculation. This is slightlyhigher than that at the KIMS experimental site [28], which is consistent with expectations based ofsurface geometry of Y2L and the approximately 200 m horizontal separation distance. This rate is
– 7 –

approximately 2.8 ×10⁻⁵ times the muon rate of the ground laboratory measurement. As shown inFig. 10, the muon rate measured during a three-month period is very stable. A muon-induced eventstudy with the NaI(Tl) crystals has started while data acquisition continues.
Date09/23/16 09/30/16 10/07/16 10/14/16 10/21/16 10/28/16 11/04/16 11/11/16 11/18/16 11/25/16 12/02/16 12/09/16 12/16/16 12/23/16
/day
2N
umbe
r of
muo
ns/m
280
300
320
340
360
380
400
Figure 10. Measurement of the muon flux at the COSINE-100 detector over a three-month period.
4. Summary
An array of muon detectors was installed around the outer detector shielding of the COSINE-100experiment. The purpose is to tag and study the correlations between crystal and muon eventsthat can mimic WIMP-like signals. Several tests were performed to validate the performance ofthe detector. The muon selection efficiency was found to be 99.9 ± 0.1 %, with only approxi-mately 0.3% fake muon events. This detection efficiency is sufficient for the COSINE-100 ex-periment. Using three months of data, the muon flux at the experimental site was measured tobe 328± 1(stat.)± 10(syst.) muons/m2/day. Currently, data acquisition is ongoing to obtain suffi-ciently large statistics for the modulation analysis.
Acknowledgments
We thank the Korea Hydro and Nuclear Power (KHNP) Company for providing undergroundlaboratory space at Yangyang. This work is supported by the Institute for Basic Science (IBS)under project code IBS-R016-A1, Republic of Korea; an Alfred P. Sloan Foundation Fellow-ship; NSF Grant Nos. PHY-1151795, PHY-1457995, DGE-1122492, and DGE-1256259; Wis-consin IceCube Particle Astrophysics Center (WIPAC), the Wisconsin Alumni Research Founda-tion; Yale University; and DOE/NNSA Grant No. DE-FC52-08NA28752, United States; STFCGrant ST/N000277/1, United Kingdom; and CNPq and grant # 2017/02952-0, São Paulo ResearchFoundation (FAPESP), Brazil.
References
[1] T. Gaisser, Cosmic ray and particle physics, Cambridge University Press (1990).
[2] C. Patrignani et al. (Particle Data Group), The Review of Particle physics, Chin. Phys. C 40 (2016)100001.
– 8 –
[3] B. Schmidt et al., Muon-induced background in the EDELWEISS dark matter search, Astropart. Phys.44 (2013) 28.
[4] D.S. Akerib et al., Radiogenic and Muon-Induced Backgrounds in the LUX Dark Matter Detector,Astropart. Phys. 62 (2015) 33.
[5] B.W. Lee and S. Weinberg, Cosmological Lower Bound on Heavy-Neutrino Masses, Phys. Rev. Lett. 39(1977) 165.
[6] G. Jungman, M. Kamionkowski, and K. Griest, Supersymmetric Dark Matter, Phys. Rep. 267 (1996)195.
[7] P. Cushman et al., Working Group Report: WIMP Dark Matter Direct Detection, arXiv:1310.8327(2013).
[8] T.M. Undagoitia and L. Rauch, Dark matter direct-detection experiments, J. Phys. G 43 (2016) 013001.
[9] K. Freese et al., Annual Modulation of Dark Matter: A Review, Rev. Mod. Phys. 85 (2013) 1561.
[10] R. Bernabei et al., New results from DAMA/LIBRA, Eur. Phys. J. C 67 (2010) 39.
[11] R. Bernabei et al., Final model independent result of DAMA/LIBRA-phase 1, Eur. Phys. J. C 73(2013) 2648.
[12] R. Bernabei et al., New results and prespectives of DAMA/LIBRA, EPJ Web Conf. 70 (2014) 00043.
[13] C. Savage et al., Compatibility of DAMA/LIBRA dark matter detection with other searches, JCAP 04(2009) 010.
[14] G. Bellini et al., Cosmic-muon flux and annual modulation in Borexino at 3800 m water-equivalentdepth, JCAP 05 (2012) 015.
[15] J. Cherwinka et al., First data from DM-Ice17, Phys. Rev. D 95 (2014) 092005.
[16] E. Barbosa de Souza et al., First search for a dark matter annual modulation signal with NaI(Tl) inthe Southern Hemisphere by DM-Ice17, Phys. Rev. D 95 (2017) 032006.
[17] D. Nygren, A testable conventional hypothesis for the DAMA-LIBRA annual modulation,unpublished, ArXiv:1102.0815 (2012).
[18] J. H. Davis, Fitting the annual modulation in DAMA with neutrons from muons and neutrinos, Phys.Rev. Lett. 113 (2014) 081302.
[19] J.P. Ralston, One model explains DAMA/LIBRA, CoGENT, CDMS, and XENON, arXiv:1006.5255(2010).
[20] A. S. Malgin, Seasonal modulations of the underground cosmic-ray muon energy, J. Exp. Theor. Phys.121 (2015) 212.
[21] E.J. Jeon and Y.D. Kim, A simulation-based study of the neutron backgrounds for NaI dark matterexperiments, Astropart. Phys. 73 (2016) 28.
[22] J. Klinger and V.A. Kudryavtsev, Muon-Induced Neutrons Do Not Explain the DAMA Data, Phys.Rev. Lett. 114 (2015) 151301.
[23] K.W. Kim et al., Tests on NaI(Tl) crystals for WIMP search at Yangyang Underground Laboratory,Astropart. Phys. 62 (2015) 249.
[24] P. Adhikari et al., Understanding internal backgrounds in NaI(Tl) crystals toward a 200 kg array forthe KIMS-NaI experiment, Eur. Phys. J. C 76 (2016) 185.
– 9 –
[25] G. Adhikari et al., Understanding NaI(Tl) crystal background for dark matter searches, Eur. Phys. J.C 77 (2017) 437.
[26] G. Adhikari et al., Design and Performance of the COSINE-100 Experiment, ArXiv:1710.05299(2017).
[27] E.V. Bugaev et al., Atmospheric muon flux at sea level, underground, and underwater, Phys. Rev. D58 (1998) 054001.
[28] J.J. Zhu et al., Study on the muon background in the underground laboratory of KIMS, High Energ.Phys. Nucl. 29 (2005) 8.
– 10 –