Embed Size (px)
Citation preview

Municipal Energy Assessment Phase I: Building Heating Analysis
In support of the
Mohawk Trail Woodlands Partnership
For
Ashfield, Massachusetts
September 27, 2017
Prepared by
UMass Clean Energy Extension
209 Agricultural Engineering 250 Natural Resources Way Amherst, MA 01003‐9295
413.545.8510
[email protected] https://ag.umass.edu/clean‐energy

Table of Contents
Executive Summary .......................................................................................................................................... 1
1. Introduction ................................................................................................................................................. 3
1.1 Purpose of this Report ................................................................................................................................. 3
1.2 Green Communities Designation and Grant Program ................................................................................. 3
2. Energy Accounts and Analysis ...................................................................................................................... 4
2.1 MassEnergyInsight & Accounts Overview ................................................................................................... 4
2.2 Energy Consumption ................................................................................................................................... 4
3. Building Energy Analysis ............................................................................................................................... 5
3.1 Building Inventory ........................................................................................................................................ 5
3.2 Analysis Tools ............................................................................................................................................... 5
3.3 Summary of Key Building Performance Metrics .......................................................................................... 6
3.4 Graphical Representation of Key Building Characteristics .......................................................................... 6
4. Clean Energy Technologies and Best Practices .............................................................................................. 8
4.1 Efficiency in Building Operations ................................................................................................................. 8
4.2 Clean Heating and Cooling ........................................................................................................................... 8
4.3 Solar Power Generation ............................................................................................................................... 9
4.4 Vehicle Operations ...................................................................................................................................... 9
5. Considerations for Energy Project Prioritization ......................................................................................... 10
6. Next Steps .................................................................................................................................................. 11
Appendix A – Municipal Energy Efficiency Best Practices ................................................................................ 12
Appendix B – Clean Heating Technologies ...................................................................................................... 14
Appendix C – Extended Building Analysis ....................................................................................................... 16
Appendix D – Additional Energy Consumption Charts .................................................................................... 24

UMass Clean Energy Extension Municipal Energy Assessment Report for Ashfield, Massachusetts 1
Executive Summary As part of the Mohawk Trail Woodlands Partnership (MTWP), the town of Ashfield invited UMass Clean Energy
Extension (CEE) to analyze thermal energy use in its municipal buildings with the goal of identifying opportunities
to reduce municipal energy consumption, greenhouse gas emissions, and operating costs – and identify potential
clean heating and cooling opportunities.
Using municipal building information and historical heating data, our findings and recommendations related to
building heating operations are summarized as follows:
Total Municipal Energy Consumption – The total energy usage in Ashfield in FY2016 was 2,910 MMBtu.
Of this, 25% was used for heating (propane and heating oil), 17% used for electricity, and 58% used for
transportation (gasoline and diesel).
Town Garage – The Town Garage accounts for 28% of the town’s building‐related energy (i.e., heating
fuel and electricity). In addition, the temperature at which the building’s heating systems turn on is high
when compared to typical garage buildings, which should have significant setbacks. Based on this analysis
CEE recommends that Ashfield place a high priority on investigating efficiency through a review of
envelope construction, heating distribution operations, and heating‐related electrical systems.
Town Hall – The Town Hall is the second largest building‐related energy consumer and has a high balance
point, suggesting that it may have opportunities for envelope improvements. The Town Hall has the
lowest energy intensity (i.e., energy consumption per square foot) of the town’s key buildings and, as
such, should be considered a medium priority for additional energy assessments. CEE recommends an
efficiency assessment that includes a review of building controls and settings, heating distribution
operations, and an assessment of clean heating technologies.
Library – The Library accounts for 15% of the town’s building‐related energy consumption and should be
given a medium priority for energy efficiency measures. The library has the highest heating fuel intensity
(i.e., energy usage per square foot) and the third highest consumption of the town’s key buildings – and
a low balance point temperature compared to the town’s other buildings. Based on this analysis, we
recommend an efficiency assessment that includes a review of building controls and settings, heating
distribution operations, and an assessment of clean heating technologies.
Fire Station – The Fire Station consumes the smallest percentage of the town’s building‐related energy.
The building’s electrical consumption is also correlated to the weather and increases as outside
temperatures get colder. The town should place a lower priority on investigating electrical systems in the
building that are responding to weather conditions. While efficiency investments at the fire station may
have a smaller impact on reducing Ashfield's total heating load, they may still be financially attractive.
During investigations, it will be important to confirm that the building is not indirectly heated by electrical
systems.
Transportation – Transportation fuels account for the majority (55%) of the town’s total municipal energy
use (including building‐related, infrastructure, and transportation energy); Ashfield should therefore place
a high priority on investigating strategies such as route optimization, switching to more efficient hybrid
or electric vehicles, and considering transportation efficiency best‐practices as described in Section 4
below.
UMass Clean Energy Extension Municipal Energy Assessment Report for Ashfield, Massachusetts 2
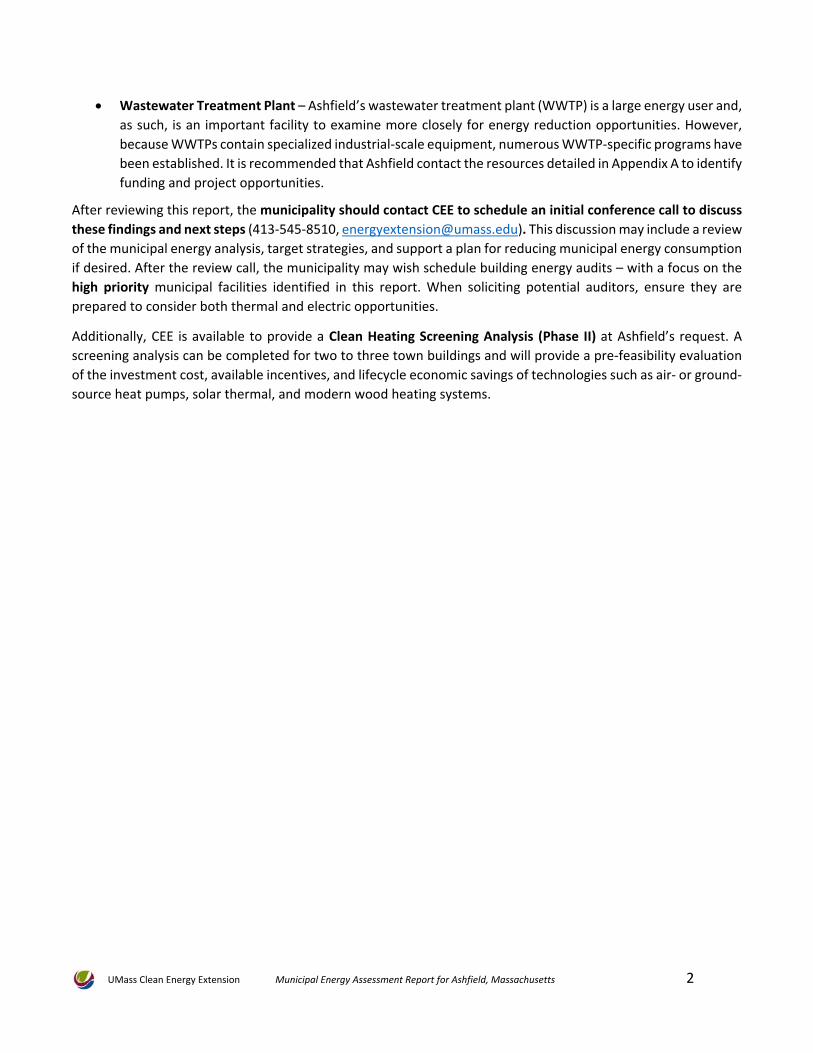
Wastewater Treatment Plant – Ashfield’s wastewater treatment plant (WWTP) is a large energy user and,
as such, is an important facility to examine more closely for energy reduction opportunities. However,
because WWTPs contain specialized industrial‐scale equipment, numerous WWTP‐specific programs have
been established. It is recommended that Ashfield contact the resources detailed in Appendix A to identify
funding and project opportunities.
After reviewing this report, the municipality should contact CEE to schedule an initial conference call to discuss
these findings and next steps (413‐545‐8510, [email protected]). This discussion may include a review
of the municipal energy analysis, target strategies, and support a plan for reducing municipal energy consumption
if desired. After the review call, the municipality may wish schedule building energy audits – with a focus on the
high priority municipal facilities identified in this report. When soliciting potential auditors, ensure they are
prepared to consider both thermal and electric opportunities.
Additionally, CEE is available to provide a Clean Heating Screening Analysis (Phase II) at Ashfield’s request. A
screening analysis can be completed for two to three town buildings and will provide a pre‐feasibility evaluation
of the investment cost, available incentives, and lifecycle economic savings of technologies such as air‐ or ground‐
source heat pumps, solar thermal, and modern wood heating systems.

UMass Clean Energy Extension Municipal Energy Assessment Report for Ashfield, Massachusetts 3
1. Introduction
1.1 Purpose of this Report UMass Clean Energy Extension (CEE) has been engaged by the state Department of Energy Resources (DOER) to
support the Mohawk Trail Woodlands Partnership (MTWP), a planning and public outreach process exploring
interest in a new partnership with State and Federal agencies for 21 municipalities in northwestern
Massachusetts. Working in Collaboration with Franklin Regional Council of Governments (FRCOG) and Berkshire
Regional Planning Council (BRPC), CEE is providing technical and analytical support to municipalities related to
their heating fuel and overall energy consumption. The purposes of this report are to:
Identify the heating energy usage characteristics for the municipality (described in Section 2);
Provide building specific analyses to indicate performance metrics (described in Section 3);
Introduce Ashfield to a range of technologies and strategies to manage energy consumption, including
clean heating technologies and energy efficiency best practices (described in Section 4);
Assist in prioritizing targets for municipal energy reduction opportunities (described in Section 5); and
Provide additional detailed building analyses to support further engineering studies and/or the solicitation
of contractor quotes (described in Appendices).
1.2 Green Communities Designation and Grant Program Ashfield is a designated Green Community within DOER’s Green Communities Designation and Grant Program.
More than half of the cities and towns in Massachusetts are designated as Green Communities, and have received
grants toward clean energy projects. This report provides Ashfield with a basis for pursuing Green Communities
competitive grant funding for deeper analysis and additional clean energy projects. For more information on the
Green Communities program, contact CEE or your Green Communities regional coordinator
(http://www.mass.gov/eea/energy‐utilities‐clean‐tech/green‐communities/).

UMass Clean Energy Extension Municipal Energy Assessment Report for Ashfield, Massachusetts 4
2. Energy Accounts and Analysis
2.1 MassEnergyInsight & Accounts Overview Data used in this analysis was provided directly to CEE by town officials or sourced from Ashfield’s
MassEnergyInsight (MEI) account. MEI is a web‐based tool provided by DOER at no cost to all cities and towns in
the state, and enables cities and towns to develop an energy‐use baseline, track and analyze energy use and costs,
prioritize energy projects, and communicate about energy use and greenhouse gas emissions. Data from electric
accounts are automatically uploaded to the town’s MEI account. Energy data is entered into MEI in two distinct
ways: Delivered fuels (e.g., propane, gasoline) data is gathered from town records or vendors and then entered
manually into MEI. In coordination with town officials, CEE has ensured that the town’s MEI platform is accurate
and current to the best of its abilities.
The data included in this report has been organized in alignment with the Massachusetts Fiscal year (July 1st to
June 30th). As of FY 2016, Ashfield's energy consumption of all‐fuels is billed to 12 accounts: 5 electric, 4 propane,
2 oil, and 2 transportation accounts.
2.2 Energy Consumption The following graphs outline the town's total energy consumption in FY2016 and provide a comparison of the
town's individual accounts and facilities. The town’s energy consumption by fuel type is broken down in Figure 1
below. Transportation fuels are the largest fuel usage, at 40% for diesel and 18% gasoline, or 58% total. Propane
accounts for 19% of total usage, and heating oil accounts for 6% ‐‐ suggesting that heated buildings may also be
an important focus area for future energy efficiency efforts.
Additional figures displaying the municipality’s energy consumption are given in Appendix D.
Figure 1: Energy use by type
UMass Clean Energy Extension Municipal Energy Assessment Report for Ashfield, Massachusetts 5
3. Building Energy Analysis
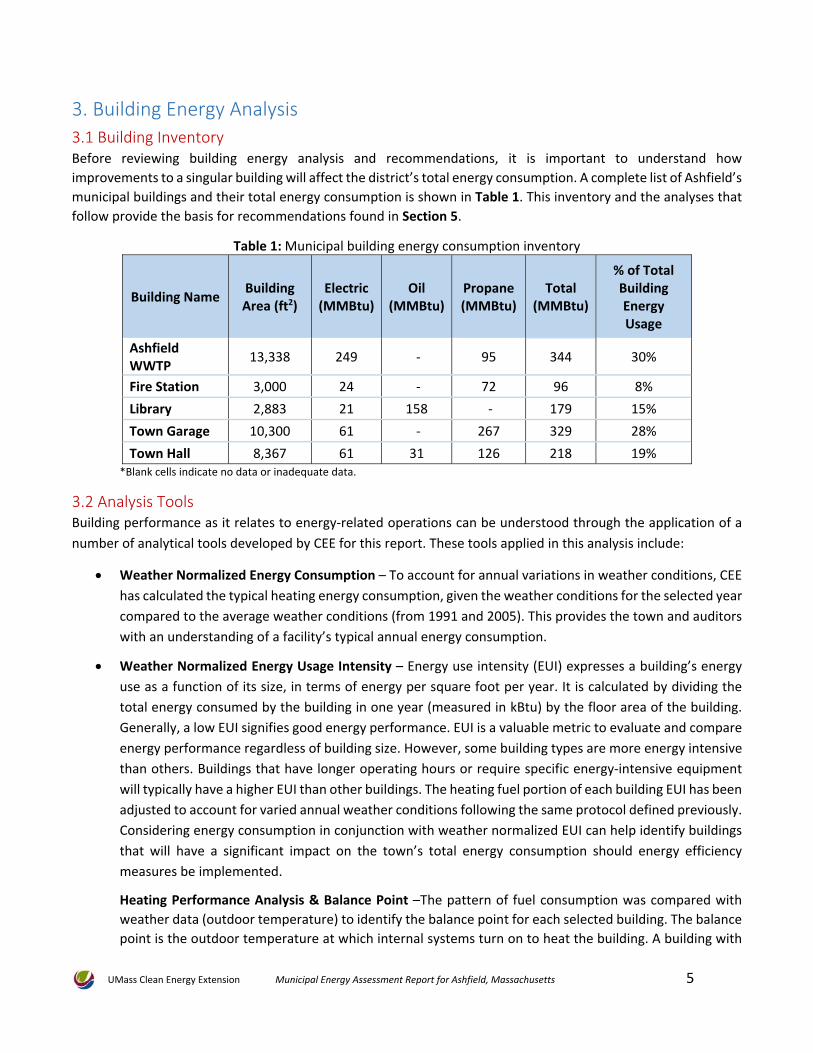
3.1 Building Inventory Before reviewing building energy analysis and recommendations, it is important to understand how
improvements to a singular building will affect the district’s total energy consumption. A complete list of Ashfield’s
municipal buildings and their total energy consumption is shown in Table 1. This inventory and the analyses that
follow provide the basis for recommendations found in Section 5.
Table 1: Municipal building energy consumption inventory
Building Name Building Area (ft2)
Electric (MMBtu)
Oil (MMBtu)
Propane (MMBtu)
Total (MMBtu)
% of Total Building Energy Usage
Ashfield WWTP
13,338 249 ‐ 95 344 30%
Fire Station 3,000 24 ‐ 72 96 8%
Library 2,883 21 158 ‐ 179 15%
Town Garage 10,300 61 ‐ 267 329 28%
Town Hall 8,367 61 31 126 218 19% *Blank cells indicate no data or inadequate data.
3.2 Analysis Tools Building performance as it relates to energy‐related operations can be understood through the application of a
number of analytical tools developed by CEE for this report. These tools applied in this analysis include:
Weather Normalized Energy Consumption – To account for annual variations in weather conditions, CEE
has calculated the typical heating energy consumption, given the weather conditions for the selected year
compared to the average weather conditions (from 1991 and 2005). This provides the town and auditors
with an understanding of a facility’s typical annual energy consumption.
Weather Normalized Energy Usage Intensity – Energy use intensity (EUI) expresses a building’s energy
use as a function of its size, in terms of energy per square foot per year. It is calculated by dividing the
total energy consumed by the building in one year (measured in kBtu) by the floor area of the building.
Generally, a low EUI signifies good energy performance. EUI is a valuable metric to evaluate and compare
energy performance regardless of building size. However, some building types are more energy intensive
than others. Buildings that have longer operating hours or require specific energy‐intensive equipment
will typically have a higher EUI than other buildings. The heating fuel portion of each building EUI has been
adjusted to account for varied annual weather conditions following the same protocol defined previously.
Considering energy consumption in conjunction with weather normalized EUI can help identify buildings
that will have a significant impact on the town’s total energy consumption should energy efficiency
measures be implemented.
Heating Performance Analysis & Balance Point –The pattern of fuel consumption was compared with
weather data (outdoor temperature) to identify the balance point for each selected building. The balance
point is the outdoor temperature at which internal systems turn on to heat the building. A building with

UMass Clean Energy Extension Municipal Energy Assessment Report for Ashfield, Massachusetts 6
a balance point that is higher than 60°F is a good candidate for operational (e.g. keeping overhead garage
doors closed) or structural changes (e.g. adding Insulation) that would decrease the building’s heat loss
through the envelope.
3.3 Summary of Key Building Performance Metrics To better understand building operation and make informed decisions regarding energy investments, the tools
discussed in Section 3.2 were applied to key buildings and shown in Table 2. Findings and interpretations related
to this information is included in Section 5 of this report. The full background analysis is shown in Appendix C.
Table 2: Summary of key building energy consumption and performance metrics
Building Name Energy Consumption*
(MMBtu) Energy Use Intensity*
(kBtu/ft2) Heating Performance (Balance Point °F)
Town Garage 294 29 64.8
Key Interpretations: The Town Garage has a high energy consumption, a low EUI, a high balance point, and a high electricity consumption. Improvements to this building will have a significant impact on the town. However, the low EUI suggests that energy efficiency measures may not be as readily available compared to the Library. Ashfield should make Town Garage a high priority for assessments.
Town Hall 198 24 64.8
Key Interpretations: The Town Hall has a high energy consumption and a low EUI. Although improvements to this building will have a significant impact on the town, solutions may not be readily available. Ashfield should make Town Hall a medium priority for assessments.
Library 159 55 63.1
Key Interpretations: The Library building has a relatively high energy consumption and the highest EUI. Improvements may be readily available. The Library should be considered a medium priority.
Fire Station 87 29 63.1
Key Interpretations: The Fire Station has a relatively low energy consumption and a low EUI for the town. Improvements to this building will have a limited impact to the town’s energy consumption. As such, it should be given a lower priority for further assessment – but thoroughly examined for opportunities nonetheless. *Weather Normalized
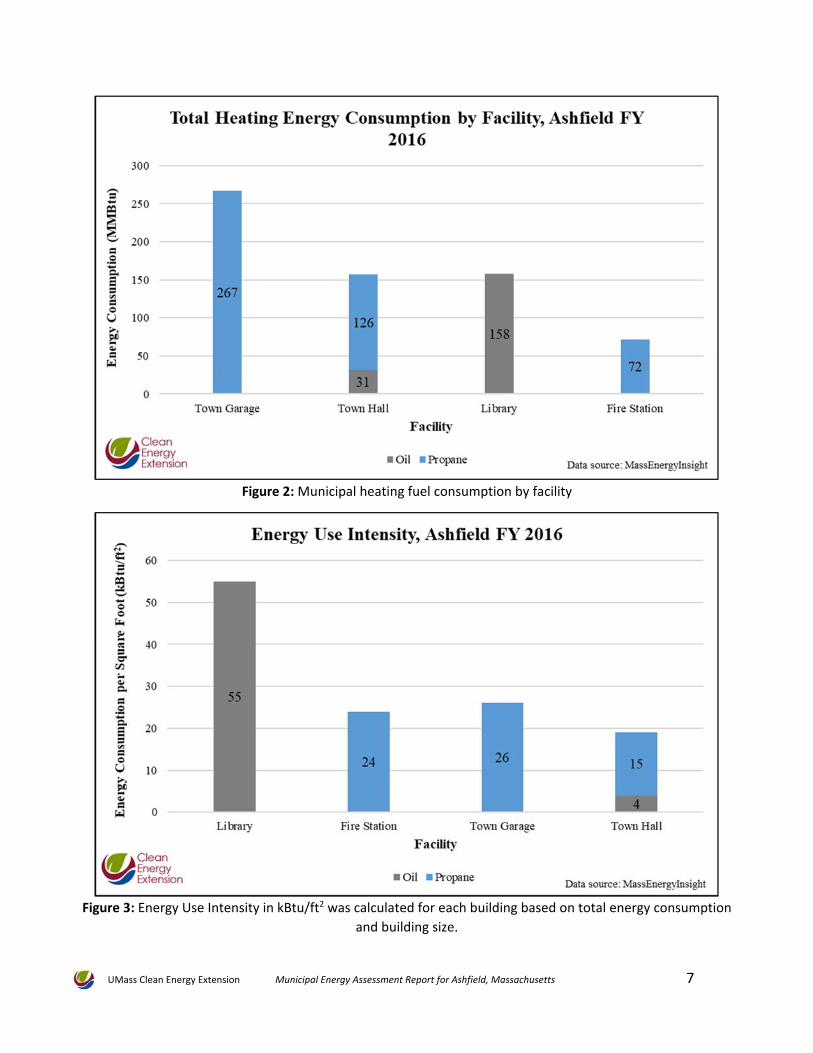
3.4 Graphical Representation of Key Building Characteristics The following provides additional graphical representation of Ashfield’s heating energy consumption by building
for the most recent complete fiscal year. The buildings are displayed in terms of total municipal heating fuel
consumption (Figure 2) and EUI (Figure 3). These graphs give a visual comparison of the Ashfield’s buildings and
heating fuel accounts.
UMass Clean Energy Extension Municipal Energy Assessment Report for Ashfield, Massachusetts 7
Figure 2: Municipal heating fuel consumption by facility
Figure 3: Energy Use Intensity in kBtu/ft2 was calculated for each building based on total energy consumption
and building size.
UMass Clean Energy Extension Municipal Energy Assessment Report for Ashfield, Massachusetts 8
4. Clean Energy Technologies and Best Practices Understanding the baseline energy conditions described earlier in this report provides a strong foundation to
identify and implement energy improvements. This section provides an overview of energy efficiency
opportunities and clean heating and cooling technologies, with more detail provided in the appendices.
This information will help to familiarize the town with potential options to reduce its energy consumption,
operating costs and environmental impact. CEE staff is available to discuss these options and how they apply to
the town’s facilities and operations.
4.1 Efficiency in Building Operations Opportunities to improve energy efficiency may include equipment upgrades, building envelope improvements,
maintenance practices, behavioral or operational changes, or the use of automated controls. The effort and cost
required to implement energy efficiency improvements ranges from little or no‐cost modifications of existing
equipment or behaviors to major investment projects.
Cities and towns that have earned Green Communities designation from the Massachusetts Department of Energy
Resources (DOER) are eligible for grants to help fund energy efficiency projects. For more information, see
http://www.mass.gov/eea/energy‐utilities‐clean‐tech/green‐communities/. Also consult with your utility
company to find out about eligibility for Mass Save incentives or rebates.
See Appendix A for information on energy efficiency best practices.
4.2 Clean Heating and Cooling Clean heating and cooling, or renewable thermal, technologies can be used to substantially reduce or eliminate
consumption of traditional fossil fuels in municipal buildings. Established technologies include air‐source heat
pumps, ground‐source heat pumps, solar thermal heating, and modern wood heating.
The Massachusetts Clean Energy Center’s (MassCEC) Clean Heating and Cooling programs offer rebates to support
the installation of renewable heating, hot water, and cooling technologies at facilities across the Commonwealth.
These technologies are generally more cost‐effective to operate than traditional fossil‐fuel systems and can
reduce greenhouse gas emissions, while maintaining a high level of comfort, automatic operations, and reliability.
MassCEC provides substantial rebates toward implementation of clean heating and cooling systems. Find more
information on the programs and technologies at http://www.masscec.com/government‐non‐profit/clean‐
heating‐and‐cooling, as well as in Appendix B.
DOER is currently finalizing its Alternative Portfolio Standard regulation, which will provide additional incentives
for the operation of clean heating technologies. Grants received through the Green Communities program may
also be applied to clean heating and cooling systems upon review with DOER.
Additionally, if some municipal buildings are clustered together, there may be an opportunity for a district heating
system where centralized heating equipment serves multiple buildings, which may reduce the capital and
operational costs for new clean heating equipment. Other technologies such as combined heat and power can be
used with district heating for increased efficiency and reliability.
See Appendix B for additional information on clean heating and cooling technologies.
UMass Clean Energy Extension Municipal Energy Assessment Report for Ashfield, Massachusetts 9
4.3 Solar Power Generation Generating electrical power onsite can often provide environmental and financial benefits to a community. Solar
electric systems, also known as solar photovoltaics or solar PV, convert sunlight into electrical energy through an
array of solar panels that connect to a building's electrical system or directly to the electrical grid.
With federal and state incentives, solar electricity is often a cost‐effective way for municipalities to reduce their
energy costs for the long run, while also reducing their environmental impact. A robust solar industry in
Massachusetts is eager to work with municipalities to develop, host, or serve as net metering off‐takers for solar
electricity.
Additional information relating to solar photovoltaic systems can be found on the MassCEC website:
http://www.masscec.com/solar‐electricity. The Department of Energy Resources is launching its new SMART
program (http://www.mass.gov/eea/energy‐utilities‐clean‐tech/renewable‐energy/rps‐aps/development‐of‐
the‐next‐solar‐incentive.html) in 2018 to continue to advance the solar PV market in Massachusetts.
4.4 Vehicle Operations Vehicle fuel accounts for as much as a quarter of total energy consumption for many Massachusetts
municipalities, but it may be overlooked during efficiency assessments. There are several other ways to reduce
vehicle fuel use:
Right‐size vehicles for their tasks
Optimize vehicle routes
Regularly check and maintain air pressure in tires
Educate employees on vehicle idling protocol
Evaluate hybrid, electric or more efficient models vehicles to replace the vehicles that currently use the
most fuel
Consider fuel efficiency and alternative fuel vehicles in all new vehicle purchases, including those that are
exempt from Green Communities criterion 4 mandatory efficiency improvement requirements

UMass Clean Energy Extension Municipal Energy Assessment Report for Ashfield, Massachusetts 10
5. Considerations for Energy Project Prioritization Following are facility‐specific key findings and recommendations from CEE’s analysis of Ashfield’s energy data.
These can help to prioritize future energy assessments and energy efficiency efforts:
Town Garage – The Town Garage accounts for 28% of the town’s building‐related energy (i.e., heating
fuel and electricity). In addition, the temperature at which the building’s heating systems turn on is high
when compared to typical garage buildings, which should have significant setbacks. Based on this analysis
CEE recommends that Ashfield place a high priority on investigating efficiency through a review of
envelope construction, heating distribution operations, and heating‐related electrical systems.
Town Hall – The Town Hall is the second largest building‐related energy consumer and has a high balance
point, suggesting that it may have opportunities for envelope improvements. The Town Hall has the
lowest energy intensity (i.e., energy consumption per square foot) of the town’s key buildings and, as
such, should be considered a medium priority for additional energy assessments. CEE recommends an
efficiency assessment that includes a review of building controls and settings, heating distribution
operations, and an assessment of clean heating technologies.
Library – The Library accounts for 15% of the town’s building‐related energy consumption and should be
given a medium priority for energy efficiency measures. The library has the highest heating fuel intensity
(i.e., energy usage per square foot) and the third highest consumption of the town’s key buildings – and
a low balance point temperature compared to the town’s other buildings. Based on this analysis, we
recommend an efficiency assessment that includes a review of building controls and settings, heating
distribution operations, and an assessment of clean heating technologies.
Fire Station – The Fire Station consumes the smallest percentage of the town’s building‐related energy.
The building’s electrical consumption is also correlated to the weather and increases as outside
temperatures get colder. The town should place a lower priority on investigating electrical systems in the
building that are responding to weather conditions. While efficiency investments at the fire station may
have a smaller impact on reducing Ashfield's total heating load, they may still be financially attractive.
During investigations, it will be important to confirm that the building is not indirectly heated by electrical
systems.
Transportation – Transportation fuels account for the majority (55%) of the town’s total municipal energy
use (including building‐related, infrastructure, and transportation energy); Ashfield should therefore place
a high priority on investigating strategies such as route optimization, switching to more efficient hybrid
or electric vehicles, and considering transportation efficiency best‐practices as described in Section 4
above.
Wastewater Treatment Plant – Ashfield’s wastewater treatment plant (WWTP) is a large energy user and,
as such, is an important facility to examine more closely for energy reduction opportunities. However,
because WWTPs contain specialized industrial‐scale equipment, numerous WWTP‐specific programs have
been established. It is recommended that Ashfield contact the resources detailed in Appendix A to
identify funding and project opportunities.

UMass Clean Energy Extension Municipal Energy Assessment Report for Ashfield, Massachusetts 11
6. Next Steps As a next step, the municipality should contact CEE to schedule an initial conference call to discuss these findings
and recommendations. This discussion may include a review of the municipal energy analysis, target strategies,
and support a plan for reducing municipal energy consumption if desired. After the review call, the municipality
may wish to schedule energy audits – with a focus on the high priority municipal facilities identified in this report.
When soliciting potential auditors, ensure they are prepared to consider both thermal and electric opportunities.
Additionally, CEE is available to provide a Clean Heating Screening Analysis (Phase II) at Ashfield’s request. A
screening analysis can be completed for two to three town buildings. The screening analysis will provide a pre‐
feasibility evaluation of the investment cost, available incentives, and lifecycle economic savings of technologies
such as air‐ or ground‐source heat pumps, solar thermal, and modern wood heating systems.
CEE is grateful for the opportunity to serve Ashfield, and for the support of town officials in developing this
analysis. CEE is available to assist the town with next steps and to discuss other energy‐related suggestions/ideas
the town may have. Please do not hesitate to contact CEE with any additional questions or comments regarding
this analysis (413.545.8510, [email protected]).
UMass Clean Energy Extension Municipal Energy Assessment Report for Ashfield, Massachusetts 12
Appendix A – Municipal Energy Efficiency Best Practices The UMass Clean Energy Extension recommends that municipalities consider the following energy efficiency best
practices. Financial support for these efforts may be available through Green Communities grants or Mass Save
incentives or rebates. For more information, see http://www.mass.gov/eea/energy‐utilities‐clean‐tech/green‐
communities/ and consult your utility company representative.
Optimize Building Controls Many buildings have building/energy management systems or programmable thermostats that are not operating
to their full potential. These control systems need to be properly programmed and maintained in order to be
effective in optimizing building operation and energy use. Energy efficiency opportunities may be identified by
periodically retrocommissioning these systems or reviewing temperature setpoints and schedules, comparing to
building occupancy, making any necessary adjustments, and testing to make sure that the related equipment is
operating as intended.
Control systems may record environmental conditions and operational parameters, and review of this data can
be very helpful in maximizing the value of the system and identifying any performance problems with HVAC
equipment.
For selected buildings, utility companies may be able to provide electrical billing data in 15‐minute intervals, which
can also be very useful in understanding electricity use patterns throughout the day/week and identifying
opportunities to optimize building operation.
Several Green Communities have seen great benefits from these practices, some with the assistance of fault
detection and diagnostic software or circuit‐level monitoring by consulting companies. Utility pay‐for‐
performance programs may provide incentives based on the achieved savings.
Install/Upgrade HVAC controls Advanced controls can improve the efficiency of some HVAC systems without the substantial investments required
to replace major equipment. These technologies include:
Energy recovery ventilators or heat recovery ventilators use a heat exchanger to preheat or precool
incoming fresh air by reclaiming energy from the outgoing exhaust air.
Demand control ventilation automatically adjusts the amount of outside air let into the building to
optimize energy use while providing occupants with the right amount of fresh air.
Integrate Energy Efficiency into Purchasing Decisions Efficiency ranges widely for many types of energy‐consuming equipment. Incremental costs range depending on
the product type, but sometimes there is sometimes little to no added cost for high efficiency models of new
equipment, and in other cases the long term energy savings can justify a higher purchase price for an efficient
model. Information about efficiency of many types of products – including appliances, commercial kitchen
equipment, electronics, HVAC equipment, office equipment and more – is available from the ENERGY STAR
program at http://energystar.gov/products and http://energystar.gov/purchasing.
Use Power Management Software on Computers The ENERGY STAR program offers free support on computer power management to reduce electricity
consumption when computers are not in use, detailed at http://energystar.gov/powermanagement.
UMass Clean Energy Extension Municipal Energy Assessment Report for Ashfield, Massachusetts 13
Implement an Energy Engagement Program Some Green Communities have had success with programs that educate municipal employees, students and other
building occupants about their energy reduction goals and encourage simple behavioral actions such as turning
off lights, computers and other equipment when not in use.
Investigate Energy Efficiency Opportunities in Water and Wastewater Treatment Plants Water and wastewater treatment plants are often among the highest energy consuming facilities in cities and
towns. Support for projects in these facilities may include the following programs, where applicable:
The UMass Center for Energy Efficiency and Renewable Energy, CEE’s partner organization, offers free,
in‐depth assessments of plants with annual energy costs of at least $100,000. The Center conducts a site
visit with a thorough review of equipment and processes, then provides a detailed report with
recommended energy efficiency opportunities, including estimates for energy and cost savings and
implementation costs. More information is available at http://ceere.org/iac.
The Massachusetts Department of Environmental Protection (MassDEP), with funding assistance from
the Massachusetts Department of Energy Resources, is planning to award grants to municipal water and
wastewater treatment plants in support of clean energy and increased efficiency in our water
infrastructure. The agency is planning to make grant applications available in the fall of 2017. For more
information, see http://www.mass.gov/eea/agencies/massdep/climate‐energy/energy/ or contact
MassDEP: Michael DiBara, (508‐767‐2885, [email protected]), James Doucett (617‐292‐5868,
[email protected]), or Ann Lowery (617‐292‐5846, [email protected]).
MassCEC is offering up to $150,000 in funding for the piloting of innovative technologies at publicly‐
owned wastewater treatment facilities across the Commonwealth. This program focuses on innovative
technologies aimed at one the three focus areas: (1) increasing energy efficiency, (2) recovering resources
for reuse, or (3) removing nutrients including nitrogen and phosphorous. Additional information can be
found on the MassCEC website: http://www.masscec.com/innovation‐wastewater‐treatment‐plants.
Mass Rural Water Association (MassRWA) provides free on‐site technical assistance to small and rural
wastewater treatment and collection systems through the Wastewater Technical Assistance Program and
the Wastewater Training and Technical Assistance Program both funded by the U.S. Department of
Agriculture's Rural Utilities Service. These programs provide hands‐on assistance and training to
wastewater systems in areas such as operator certification, treatment, biological process control,
laboratory procedures, collection systems, smoke testing, and maintenance. The emphasis of the
technical assistance is promoting low cost, long‐term solutions. Learn more at http://massrwa.org/ or
contact Dave Kaczenski ([email protected]) for assistance or information about MassRWA’s
Wastewater Programs.
The Water Innovation Network for Sustainable Small Systems (WINSSS) at UMass develops research
opportunities, conducts piloting projects, and provides technical assistance at small‐scale wastewater and
drinking water systems. Learn more at http://www.umass.edu/winsss/ or contact Patrick Wittbold
([email protected]) for more information.

UMass Clean Energy Extension Municipal Energy Assessment Report for Ashfield, Massachusetts 14
Appendix B – Clean Heating Technologies Clean heating and cooling, or renewable thermal, technologies can be used to substantially reduce or eliminate
consumption of traditional fossil fuels in municipal buildings. The following are descriptions of these technologies
from the Massachusetts Clean Energy Center website. See more information at
http://www.masscec.com/government‐non‐profit/clean‐heating‐and‐cooling.
Air‐Source Heat Pumps Air‐source heat pumps (ASHPs) can provide cost‐effective and energy‐efficient heating and cooling for your
building’s space. While traditional systems burn fuel to create heat, a heat pump instead works by moving heat
into or out of a space. Though they require electricity to operate, efficient ASHPs use 40‐70 percent less electricity
than traditional electric‐resistance heating. Rebates of up to $210,000 are available.
Key points:
Easy to install in existing buildings and compatible with any type of existing heating system
Often installed to supplement existing heating systems
Provide both heating and cooling in a single, efficient unit without the need to install ductwork
Lowest up‐front cost of any clean heating and cooling technology, and can be more cost effective to
operate than traditional oil, propane, or electric heat
Modern Wood Heating Modern wood heating systems use wood chips or wood pellets to produce heat, much in the same way traditional
boilers or furnaces use oil, propane, or natural gas. Biomass heating systems can often integrate into existing
heating systems, and can fulfill all of a building's heating and hot water needs. Systems are typically fully‐
automated, and require limited maintenance. Wood chip and pellet delivery is available in most parts of the
Commonwealth. Rebates of up to $250,000 are available for commercial‐scale systems and $27,000 for small‐
scale systems.
Key points:
Typically installed in buildings with baseboard hot water heating, but furnace options are also available
for buildings with forced air heating
Can be more cost‐effective than heating with traditional oil, propane, or electric heat
Ground‐Source Heat Pumps Ground‐source heat pumps (GSHPs) can provide cost‐effective, energy‐efficient space heating and cooling, hot
water and process heat by utilizing the nearly constant temperature underground to transfer heat between the
ground and your facility. GSHPs are typically the most efficient type of heat pump. Though they require electricity
to operate, efficient GSHPs can provide the same amount of heating for substantially less than traditional electric
heating. Grants of up to $250,000 are available for commercial‐scale systems and $25,000 for small‐scale systems.
Key points:
Great option for new construction, but can also replace existing forced air or hydronic heating systems

UMass Clean Energy Extension Municipal Energy Assessment Report for Ashfield, Massachusetts 15
High installation costs are offset by long‐term energy cost savings compared with electric heat, oil,
propane, or even natural gas heating plus highly efficient cooling
Solar Hot Water Solar hot water systems use the energy of the sun to heat water for use in your home’s hot water system. Solar
hot water systems reduce the usage of traditional water heating fuels (such as oil, electricity or natural gas) and
thereby reduce the amount you spend purchasing these fuels. Rebates of up to $100,000 are available.
Key points:
Great option for both existing buildings and new construction
Can reduce water heating costs and greenhouse gas emissions at your facility
Especially cost‐effective for buildings currently heating water with oil, propane or electricity
UMass Clean Energy Extension Municipal Energy Assessment Report for Ashfield, Massachusetts 16
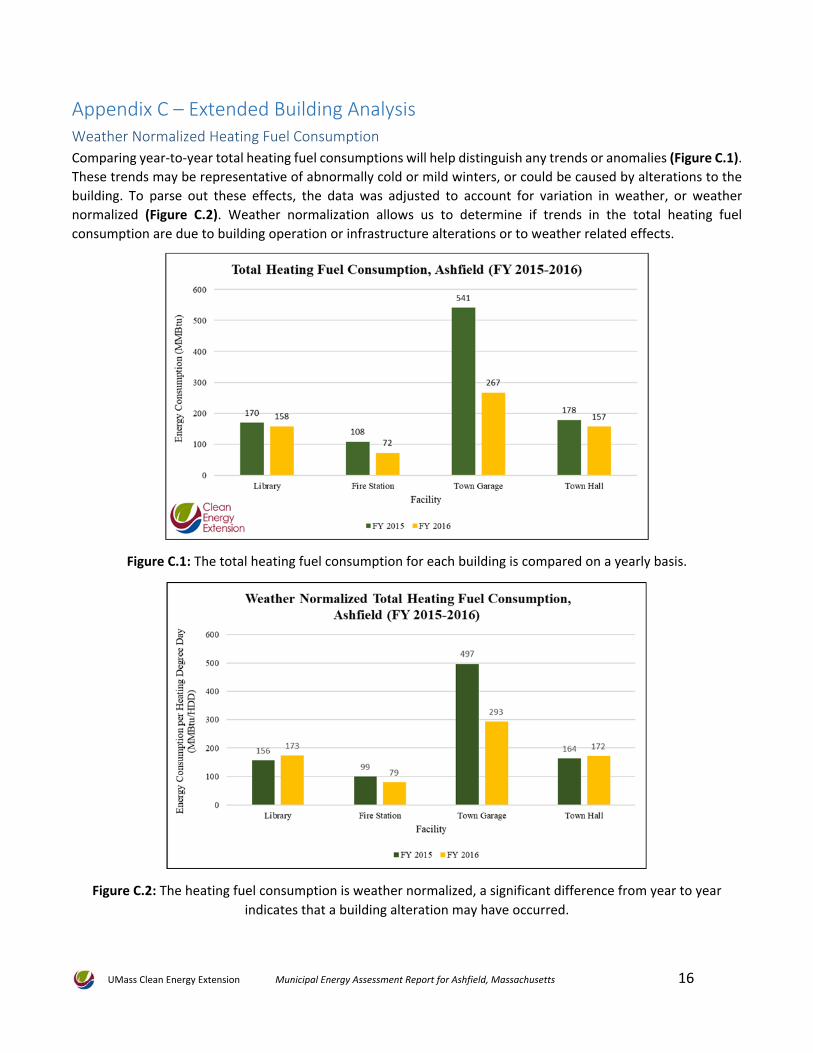
Appendix C – Extended Building Analysis Weather Normalized Heating Fuel Consumption
Comparing year‐to‐year total heating fuel consumptions will help distinguish any trends or anomalies (Figure C.1).
These trends may be representative of abnormally cold or mild winters, or could be caused by alterations to the
building. To parse out these effects, the data was adjusted to account for variation in weather, or weather
normalized (Figure C.2). Weather normalization allows us to determine if trends in the total heating fuel
consumption are due to building operation or infrastructure alterations or to weather related effects.
Figure C.1: The total heating fuel consumption for each building is compared on a yearly basis.
Figure C.2: The heating fuel consumption is weather normalized, a significant difference from year to year
indicates that a building alteration may have occurred.
UMass Clean Energy Extension Municipal Energy Assessment Report for Ashfield, Massachusetts 17
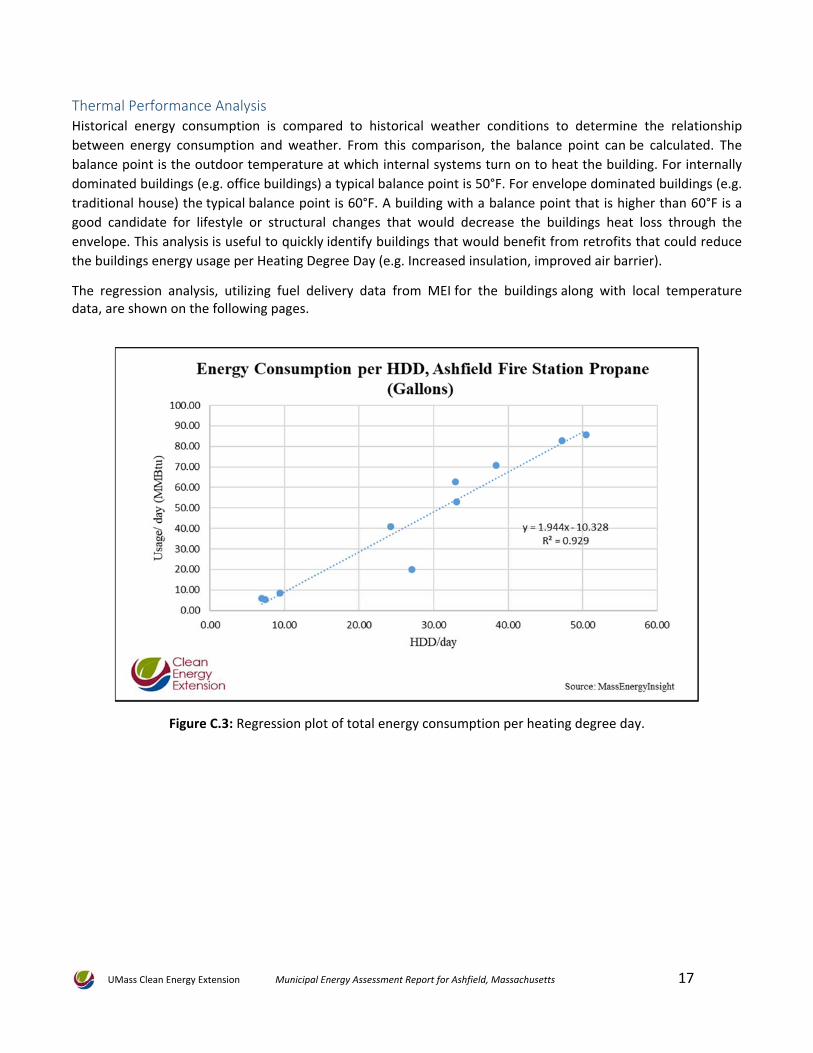
Thermal Performance Analysis Historical energy consumption is compared to historical weather conditions to determine the relationship
between energy consumption and weather. From this comparison, the balance point can be calculated. The
balance point is the outdoor temperature at which internal systems turn on to heat the building. For internally
dominated buildings (e.g. office buildings) a typical balance point is 50°F. For envelope dominated buildings (e.g.
traditional house) the typical balance point is 60°F. A building with a balance point that is higher than 60°F is a
good candidate for lifestyle or structural changes that would decrease the buildings heat loss through the
envelope. This analysis is useful to quickly identify buildings that would benefit from retrofits that could reduce
the buildings energy usage per Heating Degree Day (e.g. Increased insulation, improved air barrier).
The regression analysis, utilizing fuel delivery data from MEI for the buildings along with local temperature data, are shown on the following pages.
Figure C.3: Regression plot of total energy consumption per heating degree day.

UMass Clean Energy Extension Municipal Energy Assessment Report for Ashfield, Massachusetts 18
Table C.1: The baseload, balance point, correlation and heating sizing of the building is calculated and displayed
in the table below.
Baseload, Ashfield Fire Station Propane (Gallons)
Intercept 15th Percentile
‐1.13 0.73
Correlation
R2 Pearson
0.929 0.964
Slope (energy unit/°F)/intercept (energy unit) 0.21
Balance Point (°F) 64.81
Heating Sizing (MBtuh) 158.63
Figure C.4: Regression plot of total energy consumption per heating degree day.
UMass Clean Energy Extension Municipal Energy Assessment Report for Ashfield, Massachusetts 19
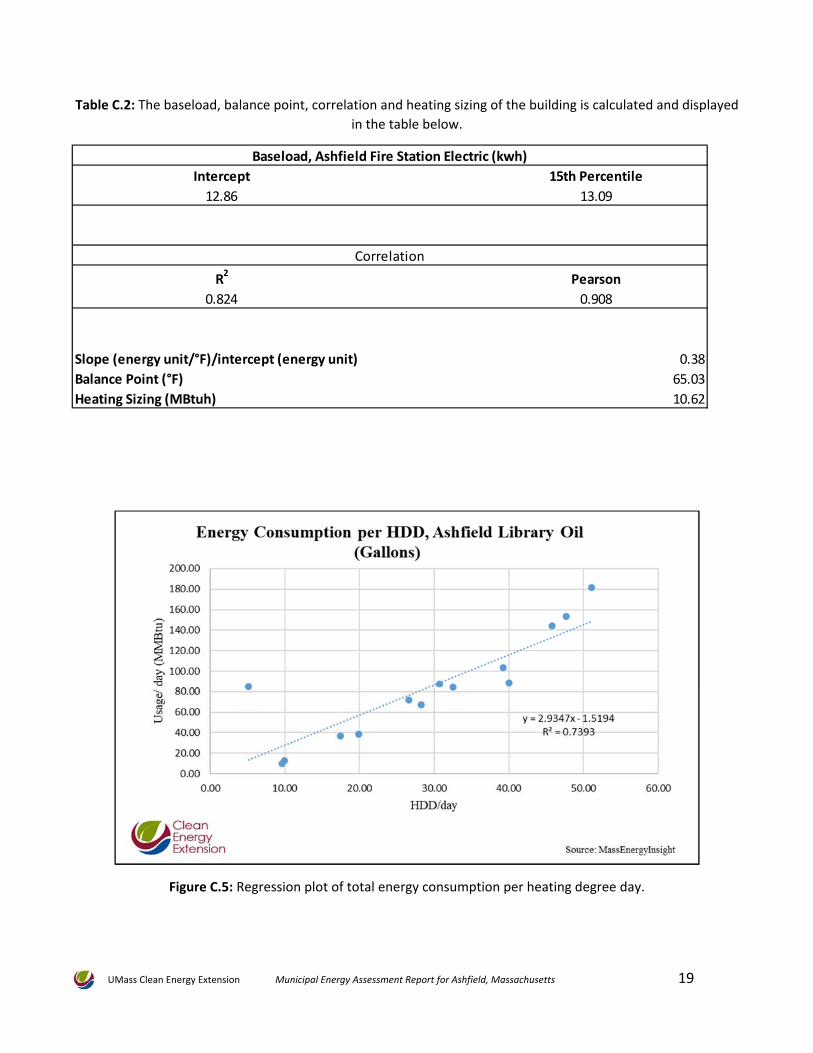
Table C.2: The baseload, balance point, correlation and heating sizing of the building is calculated and displayed
in the table below.
Figure C.5: Regression plot of total energy consumption per heating degree day.
Intercept 15th Percentile
12.86 13.09
R2
Pearson
0.824 0.908
Slope (energy unit/°F)/intercept (energy unit) 0.38
Balance Point (°F) 65.03
Heating Sizing (MBtuh) 10.62
Baseload, Ashfield Fire Station Electric (kwh)
Correlation
UMass Clean Energy Extension Municipal Energy Assessment Report for Ashfield, Massachusetts 20
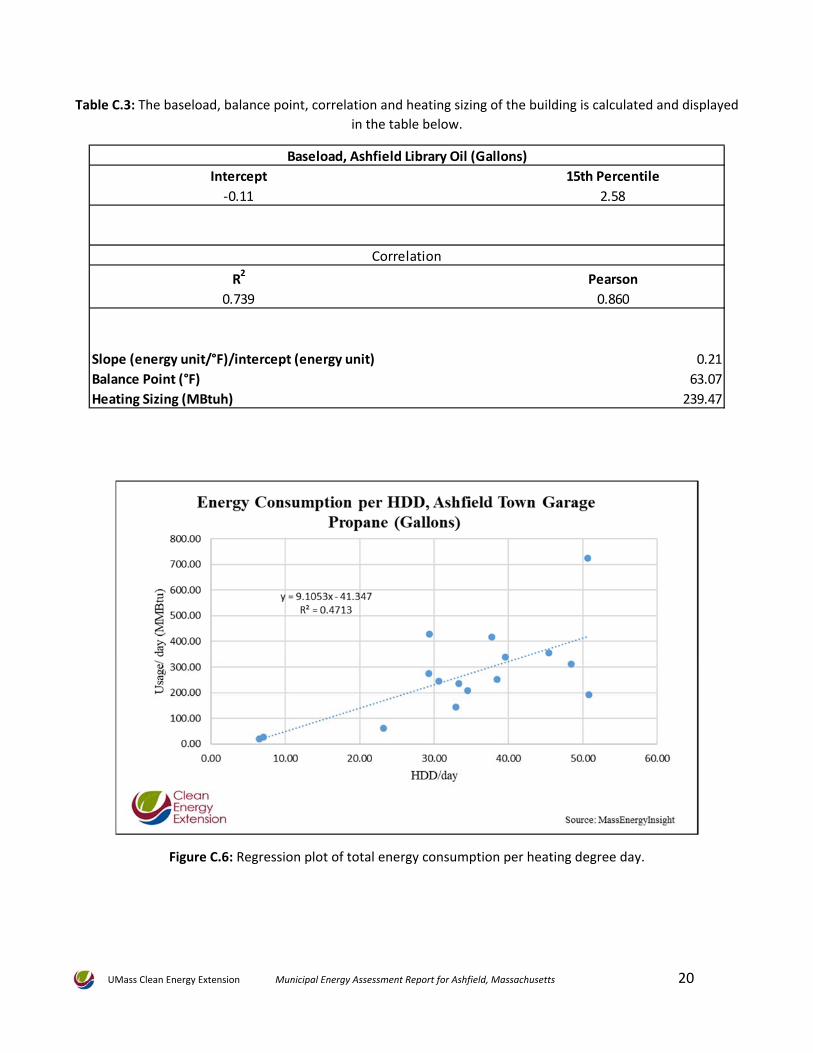
Table C.3: The baseload, balance point, correlation and heating sizing of the building is calculated and displayed
in the table below.
Figure C.6: Regression plot of total energy consumption per heating degree day.
Intercept 15th Percentile
‐0.11 2.58
R2
Pearson
0.739 0.860
Slope (energy unit/°F)/intercept (energy unit) 0.21
Balance Point (°F) 63.07
Heating Sizing (MBtuh) 239.47
Baseload, Ashfield Library Oil (Gallons)
Correlation
UMass Clean Energy Extension Municipal Energy Assessment Report for Ashfield, Massachusetts 21
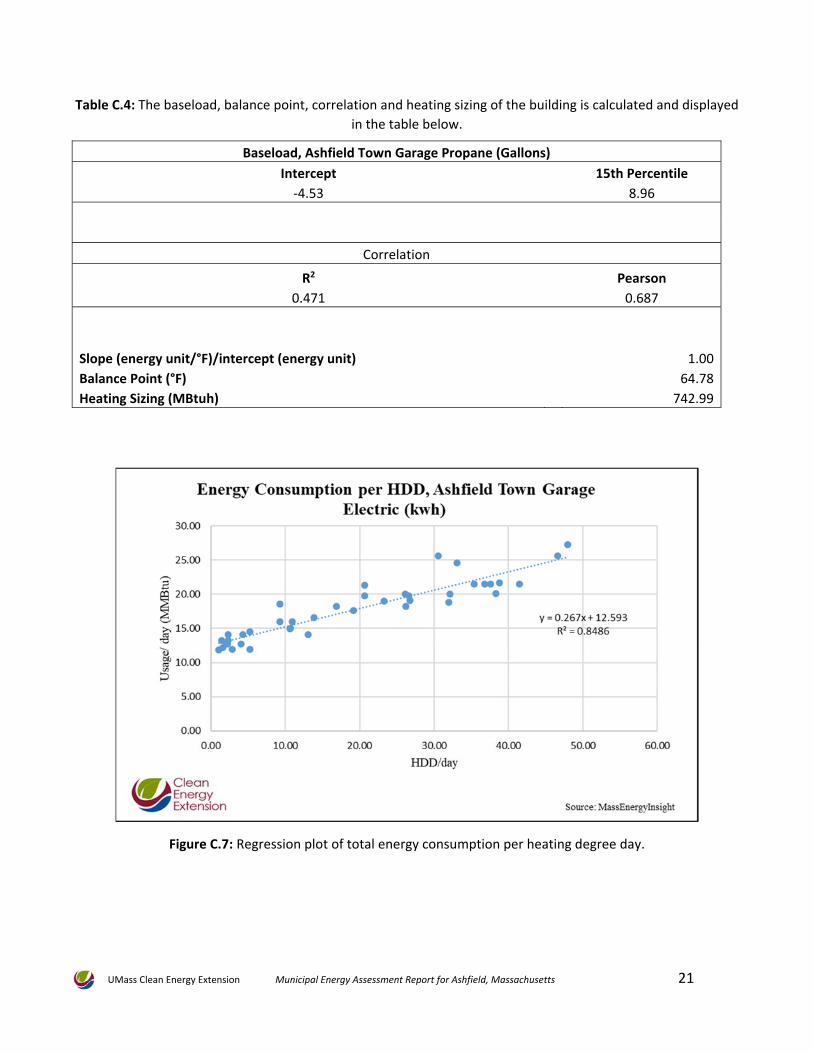
Table C.4: The baseload, balance point, correlation and heating sizing of the building is calculated and displayed
in the table below.
Figure C.7: Regression plot of total energy consumption per heating degree day.
Baseload, Ashfield Town Garage Propane (Gallons)
Intercept 15th Percentile
‐4.53 8.96
Correlation
R2 Pearson
0.471 0.687
Slope (energy unit/°F)/intercept (energy unit) 1.00
Balance Point (°F) 64.78
Heating Sizing (MBtuh) 742.99
UMass Clean Energy Extension Municipal Energy Assessment Report for Ashfield, Massachusetts 22
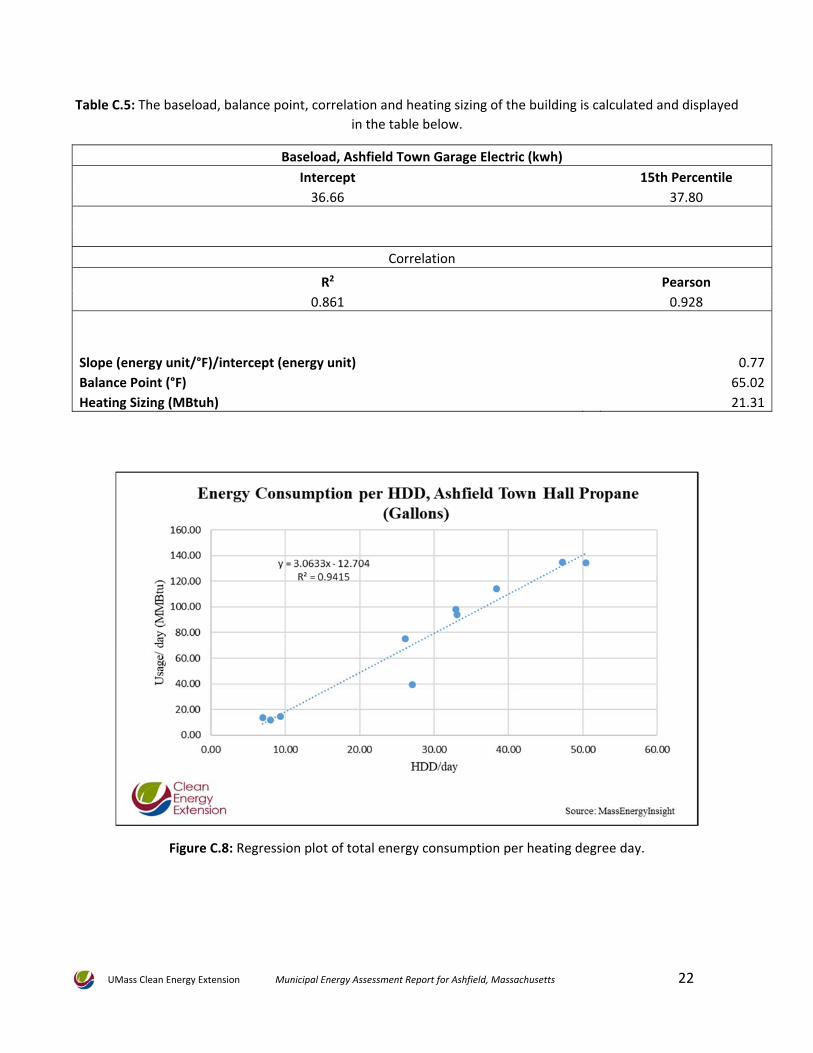
Table C.5: The baseload, balance point, correlation and heating sizing of the building is calculated and displayed
in the table below.
Baseload, Ashfield Town Garage Electric (kwh)
Intercept 15th Percentile
36.66 37.80
Correlation
R2 Pearson
0.861 0.928
Slope (energy unit/°F)/intercept (energy unit) 0.77
Balance Point (°F) 65.02
Heating Sizing (MBtuh) 21.31
Figure C.8: Regression plot of total energy consumption per heating degree day.

UMass Clean Energy Extension Municipal Energy Assessment Report for Ashfield, Massachusetts 23
Table C.6: The baseload, balance point, correlation and heating sizing of the building is calculated and displayed
in the table below.
Baseload, Ashfield Town Hall Propane (Gallons)
Intercept 15th Percentile
‐1.39 1.51
Correlation
R2 Pearson
0.941 0.970
Slope (energy unit/°F)/intercept (energy unit) 0.34
Balance Point (°F) 64.76
Heating Sizing (MBtuh) 249.96
UMass Clean Energy Extension Municipal Energy Assessment Report for Ashfield, Massachusetts 24
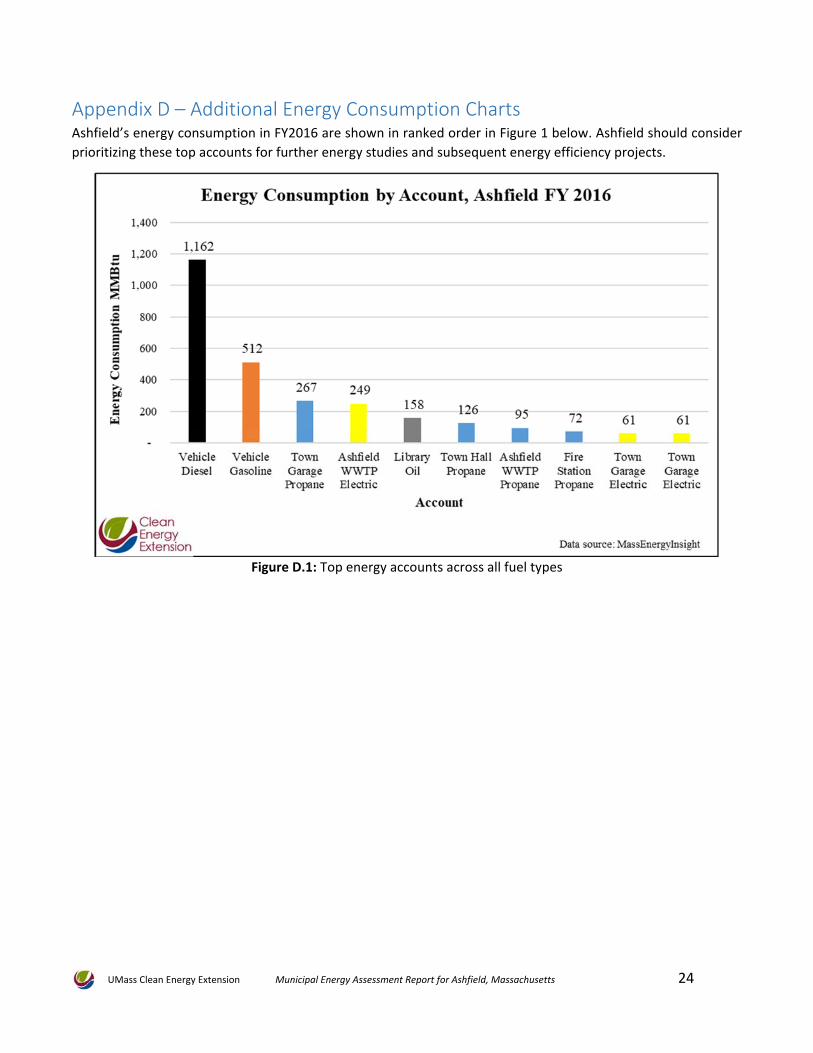
Appendix D – Additional Energy Consumption Charts Ashfield’s energy consumption in FY2016 are shown in ranked order in Figure 1 below. Ashfield should consider
prioritizing these top accounts for further energy studies and subsequent energy efficiency projects.
Figure D.1: Top energy accounts across all fuel types

UMass Clean Energy Extension Municipal Energy Assessment Report for Ashfield, Massachusetts 25
Figure D.2: Largest to smallest energy consumers (all fuels and electricity) by building and fuel type.