Embed Size (px)
Citation preview

MPRAMunich Personal RePEc Archive
Constitutions, Regulations, and Taxes:Contradictions of Different Aspects ofDecentralization
Alexander Libman
University of Mannheim
June 2009
Online at http://mpra.ub.uni-muenchen.de/15854/MPRA Paper No. 15854, posted 22. June 2009 01:22 UTC
Graduate School of Economic and Social Sciences GESS ‰ University of Mannheim ‰ gess.uni-mannheim.de CDSE ‰ University of Mannheim ‰ cdse.uni-mannheim.de
Director: Prof. Dr. Ernst-Ludwig von Thadden ‰ Department of Economics ‰ University of Mannheim ‰ D-68131 Mannheim,
Phone: +49(0621)1812034 ‰ Fax: +49(0621)1812042
June 2009
*Alexander Libman, CDSE, University of Mannheim, [email protected]
Financial support from the Deutsche Forschungsgemeinschaft through Graduiertenkolleg Risk and Liquidity in
Financial, Commodity, and Factor Markets is gratefully acknowledged.
Discussion Paper No. 58
Constitutions, Regulations, and Taxes: Contradictions of Different
Aspects of Decentralization Alexander Libman*
1
Constitutions, Regulations, and Taxes:
Contradictions of Different Aspects of Decentralization++++
by
Alexander Libman
CDSE, University of Mannheim
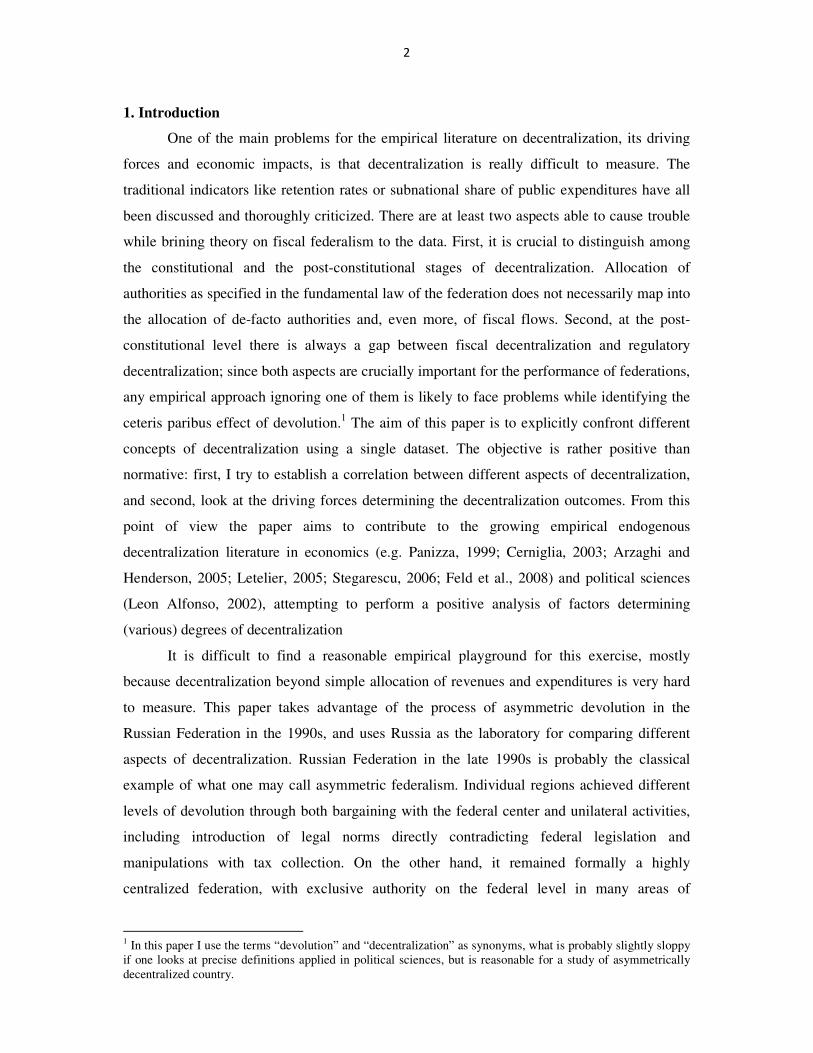
Abstract
The paper confronts different aspects of decentralization: fiscal decentralization, post-
constitutional regulatory decentralization, and constitutional decentralization – using a single
dataset from Russian Federation of the Yeltsin period as a politically asymmetric country. It
finds virtually no correlation between different decentralization aspects; moreover, three
processes of devolution appearing in the same country at the same time seem to be driven by
different (though partly overlapping) forces. Hence, a specific aspect of decentralization is
hardly able to serve as a proxy for another one or for the overall decentralization process.
June 2009
+
The paper was presented at the Center for European Economic Research (ZEW) in December 2008 and at the
Higher School of Economics in Moscow in April 2009. The author appreciates the comments of Lars P. Feld,
Elena Shkrebela, Leonid Yakonson and Steffen Osterloh. All mistakes are my own.
2
1. Introduction
One of the main problems for the empirical literature on decentralization, its driving
forces and economic impacts, is that decentralization is really difficult to measure. The
traditional indicators like retention rates or subnational share of public expenditures have all
been discussed and thoroughly criticized. There are at least two aspects able to cause trouble
while brining theory on fiscal federalism to the data. First, it is crucial to distinguish among
the constitutional and the post-constitutional stages of decentralization. Allocation of
authorities as specified in the fundamental law of the federation does not necessarily map into
the allocation of de-facto authorities and, even more, of fiscal flows. Second, at the post-
constitutional level there is always a gap between fiscal decentralization and regulatory
decentralization; since both aspects are crucially important for the performance of federations,
any empirical approach ignoring one of them is likely to face problems while identifying the
ceteris paribus effect of devolution.1 The aim of this paper is to explicitly confront different
concepts of decentralization using a single dataset. The objective is rather positive than
normative: first, I try to establish a correlation between different aspects of decentralization,
and second, look at the driving forces determining the decentralization outcomes. From this
point of view the paper aims to contribute to the growing empirical endogenous
decentralization literature in economics (e.g. Panizza, 1999; Cerniglia, 2003; Arzaghi and
Henderson, 2005; Letelier, 2005; Stegarescu, 2006; Feld et al., 2008) and political sciences
(Leon Alfonso, 2002), attempting to perform a positive analysis of factors determining
(various) degrees of decentralization
It is difficult to find a reasonable empirical playground for this exercise, mostly
because decentralization beyond simple allocation of revenues and expenditures is very hard
to measure. This paper takes advantage of the process of asymmetric devolution in the
Russian Federation in the 1990s, and uses Russia as the laboratory for comparing different
aspects of decentralization. Russian Federation in the late 1990s is probably the classical
example of what one may call asymmetric federalism. Individual regions achieved different
levels of devolution through both bargaining with the federal center and unilateral activities,
including introduction of legal norms directly contradicting federal legislation and
manipulations with tax collection. On the other hand, it remained formally a highly
centralized federation, with exclusive authority on the federal level in many areas of
1 In this paper I use the terms “devolution” and “decentralization” as synonyms, what is probably slightly sloppy
if one looks at precise definitions applied in political sciences, but is reasonable for a study of asymmetrically
decentralized country.
3
regulation, as well as in fiscal affairs. In this paper I use three proxies to measure the degree
of asymmetric devolution achieved by individual regions. First, a more traditional indicator of
tax retention rates is applied to measure the degree of fiscal decentralization. Second, I use
the data of the Federal Register to obtain the share and the number of regional acts directly
contradicting federal law, thus accounting for regulatory decentralization on the post-
constitutional level. Finally, I construct an index to obtain the degree of autonomy
incorporated in regional constitutions (using their version as of in late 1990s), therefore
measuring the constitutional decentralization. The main finding of the paper is that fiscal
decentralization, post-constitutional regulatory decentralization and decentralization
incorporated in constitutions seem to be virtually unrelated to each other; moreover, different
factors identified in the theory are at work for different aspects of decentralization.
The paper is organized as follows. In the next section I discuss the problem of
measuring the degree of decentralization in the literature. The third section briefly considers
the design of the Russian federalism, presents different dimensions of decentralization and
looks at their correlation. The fourth section focuses on determinants of endogenous
decentralization in Russia and the econometric problems of the analysis. The fifth section
reports the main results with respect to the driving forces of decentralization, and the last
section concludes.
2. Measuring the degree of decentralization
Since decentralization seems to be one of the main concepts for economic and political
reforms in both developing and developed countries, there exists a multitude of intersecting
and diverging theoretical and empirical concepts for measuring decentralization, often applied
as “proxies” for one another (Sharma, 2006). To start with, the main problem of the literature
is actually not the choice between “centralized” and “decentralized” governments, but rather
between political, or constitutional (which in turn may refer to the autonomy of decision-
making, autonomous appointment of governments and their ability to participate in federal
decision-making), and administrative (which mostly refers to the construction of public
administration, i.e. deconcentration of bureaucracy) decentralization (Hutchcroft, 2001; Ali,
2002; Schneider, 2003). For a large country (in terms of population or territory)
administrative decentralization is unavoidable and undisputable simply because of technical
reasons of governability. Hence, the question for the optimal degree of decentralization
usually refers to the decision-making autonomy of regional governments (although a world
with agency problems and power asymmetries administrative decentralization may “turn into”
political autonomy of regional governments through the informal migration of authority).

4
A further distinction should be made, as already noticed, between the (already defined)
constitutional decentralization and post-constitutional decentralization. The post-
constitutional decentralization reflects the outcomes of the political process, once the
constitutional rules are set, rather than the rules themselves. The distinction is particularly
simple in fiscal matters: the constitutional decentralization implies the right of regions to
independently decide on revenues and expenditures of their budgets; the post-constitutional
decentralization, however, means just the allocation of funds between center and regions. In
countries like Germany states receive substantial portion of tax revenue, but have virtually no
right to decide on bases and rates for taxes (which are then federal or joint responsibility). In
what follows fiscal decentralization refers exclusively to these post-constitutional outcomes
(as it is the case in almost all empirical studies, though not all of them acknowledge it). The
situation is slightly more complicated, if one looks at the regulations. The constitutional
decentralization, once again, means the allocation of decision-making rights on standards and
norms for economic activity. However, this allocation may be different from the “real”
significance of regional and federal regulations for economic agents. For example, it is
possible that one of the parties (either center or states) is more active in filling their
“regulatory niche” with acts and norms, than the other. Once again, regulatory
decentralization in this paper refers to the post-constitutional “relative importance” of federal
and regional law for economic agents. Obviously, it is a vague concept, which I will,
however, operationalize in what follows.
This paper therefore looks at three concepts of decentralization: constitutional and two
post-constitutional (regulatory and fiscal2) dimensions of devolution. The literature often
attempts to combine constitutional and post-constitutional analysis constructing a measure
incorporating both (more simply accessible) outcomes of regulation and (more problematic)
allocation of authorities; it may, however, be reasonable, if possible, to look at these issues
separately. The constitutional level is usually more stable, than the post-constitutional
outcomes, although in the developing countries it may also become quite volatile and even
determined by individual personnel decisions. The list of post-constitutional dimensions may
be expanded to include further aspects of governance (say, allocation of personnel between
levels of political system, cf. Treisman, 2002); however, even measuring three main
dimensions of devolution is a non-trivial task
The literature on fiscal decentralization usually relies on indicators like share of
subnational (tax) revenues and / or expenditures, which are, in spite of common usage, also
very often criticized both because of measurement problems (impact of tax and non-tax
2 The concepts may be similar to fiscal and regulatory interjurisdictional competition (Oates, 2002).

5
revenues, spatial allocation of federal expenditures, influence of interbudgetary transfers) and
especially because they ignore the degree of autonomy (i.e. constitutional decentralization) in
the decision-making with respect to fiscal matters (Ebel and Yilmaz, 2002). Hence, there have
been a number of attempts to correct the data incorporating the degree of fiscal autonomy in
the analysis (Stegarescu, 2005). The regulatory decentralization is obviously much harder to
measure, since the variety of policy aspects to be considered may be huge. On the other hand,
it is also more difficult to come to data for the international analysis, and the intranational
variation may be insufficient. Hence, scholars usually focus on specific aspects of regulation
providing a suitable basis for the analysis. For example, Strumpf and Oberholzer-Gee (2002)
test the impact of preference heterogeneity on decentralization by studying the liquor control
rules in the U.S. municipalities. Traub and Sigman (2007) examine the “voluntary
decentralization” in the area of several health and safety laws in the United States.
The constitutional decentralization has been subject to a great variety of studies. The
most popular approach is to construct an index, incorporating several aspects of
decentralization as well as may be several outcome measures. Marks et al. (2008) provide a
comprehensive review of these indices (as well as construct their own one). An alternative
could be to measure the actual policy interconnection between different levels of government.
Sheng (2007) studies the biographies of party secretaries in China to understand the logic of
political decentralization, and Landry (2004) looks at the tenure duration and promotion
patterns of local officials as response to formal decentralization. Finally, special political
situations may provide source for analysis of constitutional decentralization. For example,
Hennessey (2008) discusses a specific experiment of home rule establishment for American
municipalities.
In spite of the obvious importance of the topic, the literature explicitly comparing
different dimensions of decentralization is very small (Treisman, 2002; Schneider, 2003;
Blume and Voigt, 2008) and mostly focuses on international settings. A related analysis is
done by Liu (2007), who performs a cluster analysis of different dimensions of
decentralization in order to identify the typical combinations empirically observed, and Falleti
(2004) in a case study of Latin American countries, who investigates the dynamic interaction
of different decentralization aspects. Finally, Treisman (2002) and Blume and Voigt (2008)
look at the correlation of different forms of decentralization and socioeconomic and political
country characteristics, including country size, ethnic division, colonial origin, economic
development and level of democracy. However, data compatibility across nations adds an
additional dimension to the measurement problem. Hence it is reasonable to look at different
dimensions of decentralization and their origin using the intra-national variation of

6
decentralization, which, however, to my knowledge have never been considered empirically
before.
Once the subnational variation in taken into account, a further distinction should be
made. First, one can focus on the decentralization within subnational units, if they are
different enough. For example, Feld et al. (2008) perform an analysis of fiscal
decentralization within the cantons of Switzerland, using the extreme heterogeneity of their
financial constitutions. Second, however, the degree of devolution achieved by each region
versus the central government is often heterogeneous, implying the development of what one
may call “asymmetric federalism”. While asymmetries in terms of outcomes of economic
policies (say, retention rates) are always present in federations (but may have substantially
different origin), the asymmetry at the level of constitutional decentralization is a more rare
phenomenon, which is, however, observed in a variety of countries. The best example may be
Spain, where each “communidad autonoma” determines the scope of autonomy from the
“menu” offered by the federal government individually, but asymmetry is incorporated in
political systems of countries like United Kingdom, Canada, Belgium or India. Asymmetry is
also a feature of Russian federalism, which, combined with a large number of regions,
provides us with substantial intra-national variation for a reasonable statistical analysis and
makes Russia an attractive laboratory – however, it is important to remember that it is not a
“unique” feature of Russia and hence may generate more generally applicable results.
3. Dimensions of decentralization in Russia
3.1. Russian asymmetric federalism and decentralization
The development of the Russian asymmetric federalism has already been subject to
numerous studies in both economics and political science. First, the basic elements of
asymmetry were already inherited from the Soviet period: the federation still consists of
national republics, administrative units (oblast or krai) and autonomous okrugs. Although in
the early 1990s the situation was quite different, the currently valid constitution of 1993
proclaimed an identical status of all “subjects of the Federation” (the official designation of
all regions regardless of their status). However, previous norms, as well as informal
bargaining processes granted the national republics special privileges. Second, the asymmetric
federalism in the 1990s appeared from bilateral and multilateral bargaining between the
regions and the centre, partly initiated by the regions (Stoner-Weiss, 1998). Third, the federal
law (acts of the parliament and also presidential decrees) was also used to give additional

7
authorities to regions.3 Finally, the key component of asymmetry were the unilateral activities
of the regions: manipulations with the tax retention rates and the so-called “war of laws”, i.e.
introduction of regional legislation (including regional constitutions) directly contradicting
the federal acts (and also the constitution of Russia). As a result, Russian regions obtained
significantly different degree of autonomy, resulting into substantial differences of regional
legal regimes and economic policies (Polishchuk, 2001).
As already mentioned, this paper looks at three dimensions of decentralization in
Russia. The fiscal decentralization is measured by the traditional variable of tax retention rate
(share of regional government in the overall tax revenue collected from its territory).
Although the data is published by the Federal Statistical Authority (Goskomstat) on the
annual basis, in order to ensure compatibility with other data, which are available only in a
cross-section, I take the average over 1995-1999 (with 1995 being the first year after the
reform of the federalism in 1994, establishing the existing system of interbudgetary relations
in Russia, and 1999 being the last year of the Yeltsin’s presidency before the re-centralization
attempts under Putin started).
A unique advantage of the Russian dataset is that one can use a specific measure for
the regulatory decentralization encompassing multiple dimensions of economic regulation.
As already mentioned, the regional legislation in the late Yeltsin period included a large
number of significant contradictions to the federal law. Although the federal law existed,
regional courts and regional police, captured by local governments, usually enforced the local
law – so, the federal acts simply did not matter for economic agents. After the start of the
Putin’s presidency, one of the first steps of the new government was to revise the regional law
in order to ensure the predominance of the federal legislation. As part of this effort, the
Ministry of Justice established the so-called Federal Register (federal’nyi registr), or
catalogue of regional acts (both of the legislatures and of executive bodies, but incorporating
legal norms) in power at that moment. The acts included in the Register should pass an
examination by the expert commission established by the Ministry of Justice, which
determines their compatibility with the federal law. As a result, a statement is published,
which is then included in the file in the Federal Register as well. The acts contradicting
federal law should be abolished or changed; however the file in the Register remains, even if
the act is not valid any more. Although originally the Register was unable to cover all
3 The earliest decrees were set in 1992 and covered regions like Tyumen, Karelia (granted the right to use 90%
of federal taxes collected on its territory in 1992-1994 for funding of its development fund) or Ingushetia (since
1994 businesses registered in this republic did not pay federal taxes).
8
regional acts (a revision process certainly takes time), after several years one can be sure that
most acts passed by the regions were included in the Register.
I use the Register statistics as published by the Ministry of Justice on December 31,
2006 and calculate two indicators. First, I take the share of acts, which were assessed as
contradicting the federal law, in the total number of acts for which an expert opinion is
present (which is, as one should mention, smaller, than the overall number of acts included in
the Register), as indicator of the degree of regulatory devolution achieved by a particular
region. In order to understand this variable, one should recall, that de-jure Russian Federation
has been an extremely centralized political entity in terms of regulatory authorities, mostly
vested in the central government. However, due to its weakness regions basically received the
option to “re-design” the federal law simply by making own acts. Hence, if the share of these
acts is high, the regions have “re-designed” federal legislation to a greater extend and central
regulations matters less for economic agents. In theory, higher decentralization implies that
regional government makes different law than the federal one (of course, in certain settings
both governments produce identical policies – but then the debate on decentralization is
economically meaningless). If the share of contradicting acts is high, it means that the
regional policies are really different (and, in particular, “more different” than for regions with
low share) from the federal standards, and hence, regions achieved substantial degree of
devolution.
This measure may, however, face two problems. First, it may be too small because of
the acts passed after 2001 in the Putin’s period (when the war of laws was reduced
significantly) and included in the Register. A solution were to take an earlier data for the
Register; but in this case one runs into a problem of potentially neglected “old” acts, which
may be still under revision. Second, it is possible that the acts are more likely to be passed in
general if the region is willing to violate the federal law: if it does not desire it, it just remains
silent over a certain area of regulation, which is then covered by the federal acts. Hence, I also
use the total number of acts contradicting the federal law as a proxy for regulatory
decentralization. As shown bellow, both values are significantly correlated, but it is still
necessary to look at both to establish the robustness of the results.
The devolution at the constitutional level in Russia is, as usually, a relatively tricky
part for an empirical study. There is a certain literature addressing this problem by examining
the reasons for establishment and for the duration of power-sharing agreements (Dusseault et
al., 2005; Söderlund, 2006; Obydenkova, 2008). Obviously, the existence of a power-sharing
agreement may be treated as an indicator for higher constitutional devolution. However, there
9
is no research looking at the content of the treaties.4 This paper does apply a different measure
of constitutional decentralization, looking directly at the content of regional constitutions. In
the Soviet times, all union and autonomous republics already obtained a constitution, mostly
built according to the same scheme. After the collapse of the USSR, most republics adopted
new constitutions. Moreover, other regions (without the status of republics) also passed their
articles (ustav). The constitutions were quite similar in terms of guarantees and rights declared
to their citizens (and hence, there is no variation in their socio-economic content, unlike in
case of, say, OECD constitutions, see Ben-Bassat and Dahan, 2008), with may be the only
exception of the agricultural land private property. However, they varied quite substantially
in terms of the design of political system and also the distribution of power between the
federal government and the region. It is particularly true for the constitutions of 20 republics,5
since articles of other regions were more homogenous (although also partly incompatible with
the federal law). I use six main dimensions of divergence in term of center-region relations for
the republican constitutions (as they were valid in 1999) in order to construct the index. The
dimensions include (see also Bartsiz, 2001):
• property on natural resources (regions, in spite of the federal regulation, declare natural
resources – mostly mineral – their possession or take over the right to regulate the
resources access regime);
• international agreements (regions, in spite of the federal regulation, declare their right to
sign international agreements with other countries independently from the Russian
Federation);
• state of emergency (the region takes over the right to declare the state of emergency, or
restricts the right of the federation to declare the state of emergency on its territory);
4 Although, the content of the treaties was not identical (Martinez-Vazquez, 2002); the degree of autonomy can
be reasonably approximated by the duration of the agreement. In the earlier treaties the powers of regions were
mostly larger, as specified in later treaties, when the very procedure and structure of a treaty was standardized
(Boltenkova, 1998; Kurnyshov, 1998; Solnick, 2002). The agreements with Tatarstan and Bashkortostan – the
first territories to sign - allowed these republics to receive all excises and rental payments for the natural
resources instead of federal centre. Sakha, the third region with especially high political bargaining in the early
1990s, received the right to use part of the federal taxes collected on its territory for funding of federal program,
i.e. a limitation was put rather on the expenditures, than revenues side of the budget. Later treaties either did not
include any fiscal arrangements, or were mostly based on the Sakha scheme. Some of them (e.g. Sverdlovsk) set
a clear right of the regions to stop transferring taxes, if the federation does not follow its expenditures
obligations. It is necessary to be aware, that the major advantages of the regions were of non-fiscal nature –
control over oil and gas exploration in Tatarstan and Bashkortostan (Tatneft, the Tatarstan’s oil company,
became one of the largest in Russia) and for diamond industry in Sakha (the ALROSA holding is still controlled
by the Sakha government). 5 There are 21 republics in the Russian Federation, but Chechnya is excluded from analysis given the lack of
somehow reliable data.

10
• restrictions on regional branches of federal government (this feature applies basically to
one country, Dagestan, which restricts the right of federal agencies to establish their local
branches on its territory by requiring a special agreement);
• restrictions on validity of federal acts (the region requires federal acts to be ratified by the
regional legislature; declares its right to (temporary) put federal law out of action; declares
the priority of regional law at least in the area of shared responsibility of the federation
and the region and / or reserves the right to take over the federal responsibilities if the
federation does not implement them) and
• special regime of interbudgetary relations (Bashkortostan and Sakha reserve their right to
determine the share of the federation in the over tax revenue from the region; Tyva
maintains its own customs service).
Naturally, many of these provisions have never been implemented in practice. But it is exactly
what this paper intends to test: is there any relation between “higher autonomy” declared in
the constitution and the outcomes of the decentralization process as measured by the fiscal
and regulatory decentralization. I construct the index as follows: the region with respective
provision receives 1, otherwise 0. Hence, the index may vary from 6 (all provisions
contradicting federal law implemented) to 0 (no provisions implemented). The components of
the index are reported in the Appendix A.
Obviously, all three indicators applied in this paper are far from being perfect. The
problem of the fiscal decentralization is that formal indicators of tax structure do not cover a
high variety of financial flows between the centre and the regions and between the regions
and the economic actors (e.g. non-monetary transactions, barter, and redistribution of property
rights, see Eckardt, 2002). Even despite relatively high centralization in the field of taxation,
regional governments still have sufficient additional powers via related business groups and
banks etc (Rosefielde and Vennikova, 2004). Moreover, the use of parafiscal funds was quite
common in the 1990s.6 Put it differently, tax retention rates may have little in common with
the actual ability to produce public goods. The indicator of regulatory decentralization may be
distorted by the fact, that federal controllers of the Ministry of Justice were not entirely
impartial in terms of allocating their effort among regions (though a relatively late data of the
Federal Register status employed here should guarantee that all regions have had enough time
to be thoroughly controlled) and the decisions on compatibility with the federal law. Finally,
6 For example, in Kalmykiya, one of the Russian republics in the Southern region, companies after registration
paid a special “registration fee” to a so-called “Fund of Presidential Programs”. Even in the modern Russia,
where the degree of federal control over these schemes is significantly higher, regional governments have
enough opportunities to let the businesses “voluntary” pay for some regional projects, creating an additional tax,
which is not covered by official statistics.

11
the constitutions discussed rarely address directly the issues of fiscal and regulatory
decentralization; the index applied is rather an indirect measure. Nevertheless, the status of
the data is still better than in most other cases, and hence one can at least try to establish
statistical regularities in terms of interrelation between different aspects of decentralization.
3.2. Interrelations of dimensions of decentralization
The first problem to be considered in the framework of this paper is whether different
dimensions of decentralization are related to each other. Table 1 reports simple pairwise
correlations between four indicators used in this paper. First of all, one can see that there is
virtually no correlation between different aspects of decentralization. The same holds if other
control variables are taken into account. Hence, one can conclude, that different aspects of
decentralization process in one country, based on interaction of identical agents with
(obviously) identical preferences, result into different outcomes.
Table 1: Correlation of different aspects of decentralization
Fiscal Regulatory (share) Regulatory
(number)
Constitutional
Fiscal 1.000
Regulatory (share) -0.020
(0.852)
1.000
Regulatory (number) 0.071
(0.513)
0.686***
(0.000)
1.000
Constitutional 0.170
(0.475)
0.087
(0.715)
0.084
(0.724)
1.000
Notes: numbers in parenthesis are p-values. *** significant at 1% level.
However, the absence of correlation is to a certain extend an outcome of outliers – individual
regions with strong deviation from the common trend. For example, excluding Ingushetia,
Kalmykiya, Altai Republic and Taimyr from the sample, one obtains strong and significant
positive correlation between fiscal and regulatory (share) decentralization (see Figure 1).7 For
the regulatory decentralization measured by number of negative conclusions of the experts of
the Ministry of Justice, the result is robust to outliers, and it is obviously difficult to carry out
this analysis for constitutional decentralization, which is an ordered variable. Nevertheless,
7 Three regions mentioned belong to the so-called “tax havens”, i.e. regions pursuing an internal offshore
strategy in order to attract capital, partly due to abovementioned special regulations. Taimyr is a difficult case
from the point of view of the fiscal decentralization; the tax revenue is strongly dependent upon the activity of
the largest company, Norilski Nikel, which has actively implemented tax optimization schemes (for example, in
2000 and 2001 the activity of this company from the point of view of VAT optimization effectively led to
negative tax revenue of the regional budget).

12
even if it is the outliers which drive the absence of decentralization, it still does not change the
fact, that different aspects of the decentralization process follow different paths.
Saratov Kaliningrad
Yaroslavl
Tambov
LipetskChita
Samara
Vologda
Khanty Mansi
OmskIrkutskNovgorod
Kaluga
Murmansk
Moscow (Obl.)
Tula
Moscow (City)
VladimirVoronezh
Kostroma
Riazan
Mariy ElSmolensk
Evereyskaia
Yamal Nenets
StavropolRostovUdmurtia
Krasnoiarsk
Ulianovsk
Tomsk
SverdlovskaiaSt. Petersburg
Leningradskaia
Northern Ossetia
Chukotka
Orel
Khabarovski
Briansk
Amur
OrenburgKrasnodar
IvanovoBelgorod
KomiAstrakhan
Chuvashia
Kurgan
Penza
Kemerovo
PskovTver
Cheliabinsk
Taimyr
Perm
Aginsk Buriat
Magadan
Nizhny Novgorod
Tiumen
Kamchatka
Buriat iaDagestan
KurskMordoviaSakhalin
Altai (Krai)
Khakassia
Komi-PermAdygeia
Kirov
Kabardino-BalkariaTyva
NovosibirskVolgograd
Arkhangelsk
Tatarstan
KoriakBashkortostanKarelia
Kalmykia
Evenk
Altai (Rep.)
Sakha
Nenets
Karachaevo-Cherkessia
Ust Ordyn Buriat
Ingushetia
Primorski
.2.4
.6.8
1F
iscal decentr
aliz
ation
0 .1 .2 .3Regulatory decentralization (share)
(a)
Saratov
Lipetsk
Kaluga
Mariy ElTambov
Taimyr
Yamal Nenets
Ulianovsk
Samara
Yaroslavl
Vologda
Tula
Khanty Mansi
Smolensk
Briansk
Evereyskaia
Chita
Riazan
Murmansk
Kaliningrad
Udmurtia
Irkutsk
OrenburgOmsk
Aginsk Buriat
Novgorod
Stavropol
Tomsk
LeningradskaiaOrelRostovVoronezhVladimir
Chukotka
Moscow (Obl.)
KostromaPskov
Ust Ordyn BuriatEvenk
Northern OssetiaKomi-PermNenets
BelgorodIvanovo
Kamchatka
St. Petersburg
Penza
Kemerovo
Tyva
Kursk
Amur
Koriak
Komi
KrasnoiarskDagestan
Perm
Kurgan
Tver
Magadan
Novosibirsk
Buriatia
Krasnodar
Khakassia
Arkhangelsk
Mordovia
Altai (Krai)
Cheliabinsk
Sverdlovskaia
SakhalinKirov
Adygeia
Nizhny Novgorod
Astrakhan
Tatarstan
Kabardino-Balkaria
Chuvashia
Moscow (City)
Khabarovski
Ingushetia
Tiumen
Altai (Rep.)
Kalmykia
Volgograd
Karelia
Karachaevo-Cherkessia
Bashkortostan
Primorski
Sakha
.2.4
.6.8
1F
iscal
decentr
aliz
atio
n
0 200 400 600 800Regulatory decentralization (number)
(b)
Figure 1: Correlation of decentralization indices; red line – total sample, green line – excluding four outliers
13
4. Endogenous decentralization in Russia: data and empirical strategy
4.1. Factors of decentralization
Although so far I have focused on measuring decentralization in Russia, the aim of
this exercise is to empirically identify the factors determining the degree of devolution
achieved by individual regions according to different dimensions. From this point of view it is
necessary to identify the variables able to serve as proxies for the main theoretical factors able
to influence devolution. The theoretical literature on endogenous decentralization has been
rapidly growing over the last decade. Simplifying a lot, one may probably distinguish among
five main hypotheses able to influence the process of decentralization. First, decentralization
depends upon the trade-off between preference heterogeneity (or other forms of
heterogeneity, which may be easier to measure, like income) and benefits from centralized
public goods provision and insurance (Alesina and Spolaore, 2003). For an asymmetric
federation it basically implies that regions with higher “preference distance” from the rest of
the country are likely to be more decentralized. Second, federations design specific
redistribution schemes between regions, which may influence the resulting demand for
decentralization (on both rule and policy level) (Buchanan and Faith, 1987). Third,
decentralization may result from the rules (both written and unwritten) regulating the
bargaining process between the federal government and the regions and from relative
bargaining power of the parties (Filippov et al., 2004). Fourth, political system (dictatorship
vs. democracy; parliament vs. referendum; presidential vs. parliamentary republic) and may
be important for determining the structure of the decentralization (Feld et al., 2006; Libman,
2008a). Fifth, outcome of decentralization may be impacted by interest groups on federal and
regional level (Ruta, 2007). One should, however, not forget that the decentralization may
simply result from persistence in policies and politics, and hence, be outcome of path
dependence. Thus it is necessary for find variables to measure the all factors mentioned above
in the particular case of the Russian asymmetric federalism:
Bargaining power: First, it is reasonable to assume that bargaining power is related to
the region’s economic endowment. I apply four indicators to measure these factors: territory,
population, average income per capita and share of oil and gas extraction (particularly
important for Russia). The choice of variables seems to relatively straightforward given the
economic structure of Russia and availability of data. Second, bargaining power could come
from the region’s ability to secede, which seems to play an important role in the design of
Russian federalism in the 1990s (Dombrovsky, 2006). This effect is captured by two
variables: dummy for border region and geographical distance between regional capital and
Moscow. Third, one more variable in this selection may be share of urban population (higher
14
bargaining power of metropolitan areas), which, however, may also reflect preference
heterogeneity.
Bargaining rules: The main problem for measuring this indicator is that Russia at least
formally is characterized by a uniform political system. Nevertheless, I use the following
proxies: (1) formal status of the region – dummy for republics and dummy for autonomous
okrugs; (2) dummy for power-sharing agreements (though this variable is particularly
problematic due to the endogeneity problem - power-sharing agreements are both result and
consequences of bargaining) and (3) degree of tensions between the federal center and the
region: I use the MFK Renaissance and the Russian Union of Industrialists and Entrepreneurs
RUIE indices of tensions to account for this effect.8
Preferences: In a semi-authoritarian country like Russia in the 1990s the impact of
public preferences may be significant, but should not be over-estimated. Gel’man and Popova
(2003) describe the differences of preferences in terms of “market for symbolic goods”, where
regional governments act as the “supply side” and play the crucial role. I use three variables to
measure potential differences in preferences: (1) the preference difference may result from the
ethnic composition of the region, which is measured by the share of ethnically Russian
population9 and (2) the “distance” of the average income per capita in the region from the
average over the whole Russian Federation.
Political institutions: Since Russian regions are characterized by a wide variety of
political arrangements, it is also reasonable to look at specifics of regional politics. I look at
two indicators: (1) the level of democratization, estimated by an index of Carnegie Center and
(2) the power concentration within the office of the regional governors (there are three indices
available for the Yeltsin period: Jarocinska (2004), RUIE and Urban Institute (UI)).
Redistribution: The most obvious way to capture this effect is to include a measure of
the federal transfers in the regressions, though one, once again, may run into significant
endogeneity problem.
8 It may seem to be strange to include bargaining rules in the analysis, if one recalls that in Russia unilateral
devolution often implied direct violations of federal law. However, even in these cases, the desire of regions to
ignore federal legislation depends on the “costs” and “benefits” of autonomy, which, in turn, may be functions of
bargaining rules. Or, stated otherwise, rules of the higher order explain why actors ignore or follow rules of the
lower order. 9 For the Russian Federation this indicator makes more sense than, say, religion or language. First, in Russia the
ethnic identification is very important, partly because it was enforced through the government for the last eight
decades – from the establishment of national republics by the Communist Party to the requirements to put ethnic
origin (‘nacional’nost) in passports abolished only recently. Second, religious and linguistic self-identification is
usually highly correlated with ethnicity (of course, there are deeper differences like more or less “active”
participation in the religious affairs, or degree of command of a language, but they are also much more
problematic to measure).
15
Lobbying is measured by the index of regulatory capture, developed by Slinko,
Yakovlev and Zhuravskaya (2005). Since the lobbying activity in the Russia is mostly
intransparent, it is hardly possible to cover it with other variables.
Path dependence could be most simply measured by the status of the region (for the
period of the mature Russian federalism after adoption of the constitution in 1993). Hence,
significant results for dummy republic and dummy autonomous region have a double
interpretation in terms of rules of bargaining and path dependence. However, for this study I
use a specific indicator of declarations of regional elites (based on event count by Dowley
(1998) for the early 1990s10
). The declarations of the first year of independence seem to be a
good proxy for the orientation of regional elites, which could be preserved in the future.
The variables of bargaining power, bargaining rules and preferences are expected to
have a positive sign, i.e. increase the degree of devolution; the variables of redistribution, on
the contrary, should have a negative sign, decreasing the desire of the region to achieve higher
autonomy. It is impossible to make predictions for political institutions and lobbying, since
the literature is inconclusive. Moreover, the path dependence variable is likely to have a
positive sign, since the active declarations of regions in the early 1990s could in fact map into
higher devolution. Details on the variables are reported in Appendix A.
One can immediately see that this broad selection of variables faces three problems:
multicollinearity, endogeneity and measurement error. On the one hand, many of the variables
are highly correlated with each other, partly by construction (i.e. tension indices include the
existence of power-sharing agreements; power indices include natural resources etc.). The
problem of collinearity is especially important for the income per capita and distance from the
average income per capita (although one should notice, that the second is not a linear
transformation of the first; so, collinearity is not perfect). It is also acute for dummies republic
/ autonomous region and share of Russians (since the autonomous territories are in fact per
construction of the Soviet territorial design regions where the share of Russians is usually
smaller).
The endogeneity problem is always present in research on endogenous
decentralization. For Russia the situation is ambiguous. On the one hand, one can disregard
several “traditional” dimensions of endogeneity like mobility of population (as a factor
influencing both ethnic composition and population size), partly because of short time horizon
of the analysis, but partly because of Russian specifics (like low population migration).
10 This variable does not represent the current power and aspirations of governor, first, because of the time lag,
and second, because of the shift to less public political environment in the second half of the 1990s (as opposed
to the early period of Russian independence).
16
However, there are also dimensions where endogeneity may become of greater importance; in
particular, it is true for “bargaining rules” variables like power sharing treaties and fiscal
transfers. The decision to establish a power sharing treaty (usually resulting from a long
bargaining period) and the decision to manipulate federal law / introduce a regional
constitution with strong degree of devolution may be made simultaneously; retention rates
obviously depend on federal transfers, if one takes the effect on tax effort into account.
Finally, the problem may be even greater because of time-invariant dependent variables,
which prevent me from exploiting the time variation of controls. In several cases
(constitutional decentralization, existence of power-sharing agreement) I just “fixed” a
particular moment in time, when the variables were measured, what is, of course, a huge
simplification, which is unavoidable given the quality of data.
Finally, measurement errors are particularly important for what one may call “expert
opinion” variables: democratization, tensions, lobbying, declarations of regional elites, but
also power sharing treaties (the point is that in Russia the existence and the structure of
treaties were often not disclosed or only partly disclosed; so, the variable capturing only the
“main” treaties may simply loose too much information). One should notice, that “expert
opinion” variables are particularly problematic from the point of view of endogeneity and
multicollinearity problems as well.
4.2. Econometric strategy
I attempt to partly fix these problems by using the following procedure. In the first
step I estimate the “basic” specification, which does not include “expert opinion” variables.
Since most decentralization indicators do not vary over time, I estimate a cross-section for 88
Russian regions (i.e. all regions including Chechnya) and average time-varying variables over
1995-1999. The choice of the period is, as already mentioned, straightforward: the reforms of
1994 established the basic structure of modern Russian federalism, and in 2000 the reforms of
Putin significantly reduced the ability of regions for asymmetric devolution (for example, the
regional legislation and constitutions were standardized according to the federal law).
For the fiscal decentralization and the share of negative conclusions to all conclusions
as indicator of regulatory decentralization the simple OLS could be applied. The number of
negative conclusions is a count variable, and hence a Poisson or a negative binomial model
should be applied. Because the data are characterized by overdispersion, I estimate the
negative binomial model (although I have also estimated the Poisson model and did not find
any significant differences). Finally, constitutional decentralization is measured by a discrete
ordered variable. A usual approach to estimate is the ordered logit. In order to solve the

17
multicollinearity problem, I estimate two “basic” specifications for each dimension of
decentralization: with distance from average income and with average income per capita. I
also exclude the share of Russians at this stage, since it is highly collinear with dummy
republic, in all six regressions.11
In the regressions for constitutional decentralization the share
of Russians is still included to control for potential effect of ethnic heterogeneity within the
sample of national republics, which, as I will show, is indeed significant.12
For the fiscal
decentralization I also include two variables measuring the structure of the tax base, since the
composition of tax revenue may as well have an impact on the outcome: volume of retail
trade and net profits of the enterprises (Libman and Feld, 2008).
The next step aims to look at the measurement error and multicollinearity problems
more closely. First, I re-estimate the regressions by varying the sets of controls and also by
adding the “expert opinion” variables one by one. In this case I am rather interested in the
robust results, which keep constant over different specifications, than in analysis of each
individual specification. Second, as a “limiting case” for this analysis I take a completely
agnostic view on the validity of variables and theories and perform an extreme bounds
analysis. Obviously, for the extremely small sample of constitutional decentralization these
experiments are limited in terms of selection of variables simultaneously included in
regressions; it is inevitable, but, of course, means that I may have lost the “precisely correct”
specification in my estimates.
The third step of the analysis finally focuses on the endogeneity problem. It is
important to notice, that an unambiguous solution of this issue is hardly possible in the
framework of this study. First of all, there is no clear set of “hypothesis-driven” variables
extended by a set of controls. In fact, almost all variables I use (with the exception of tax base
variables for fiscal decentralization) are driven by hypotheses. Hence, however, one requires a
large list of instruments to achieve at least exact identification in the first stage – a task
certainly beyond any reasonable research exercise. Moreover, cross-sectional data with
relatively small sample exacerbate the problem of low efficiency of IV estimator. Hence, what
I am doing in what follows is in fact only a partial solution: I restrict my attention to results,
11 It is an interesting question whether it makes more sense to include share of Russians or dummies autonomous
okrug and republic in the analysis. From the theoretical point of view share of Russians is easier to explain,
because the link to the preference heterogeneity is obvious. However, for the Russian Federation it seems more
suitable to focus on institutional variables. First, the effect of ethnic composition of the population on policies in
the short run automatically goes through the specifics of political institutions - in this case, republican status.
Second, since Russia is a semi-autocracy at best, public preferences may be less important than preferences of
political elites – and for the latter republican status is very important (cf. Obydenkova, 2008). Finally, since the
status of a republic was usually granted by the Soviet government (all current republics were either republics or
autonomous oblast in the RSFSR), it is not subject to reverse causality problem at all. 12 I have also estimated respective specification for other dimensions of decentralization, but did not find any
significant results for share of Russians.

18
which remain robust at the second step of the econometric strategy; therefore I ignore the
problem of endogenous controls (the usual way to deal with this issue – exclusion of potential
endogenous controls and analysis of robustness of results with and without them – is per
construction performed at the second step). As I will show, most of the “suspicious” variables
actually turn out to be insignificant, thus “resolving” me from the endogeneity problem, so,
part of the problem disappears “by default”. There are however cases when two-stage
estimation techniques are required. Of course, in this case the results are based on “hope” that
the omitted variable bias through the exclusion of endogenous controls and the bias from
reverse causality from endogenous controls do not run in the same direction (and hence the
results become not robust in these two settings). Hence, the results of this paper in terms of
endogeneity analysis should be treated with great caution.
5. Endogenous decentralization in Russia: results
5.1. Basic regressions
As the first step in the analysis I consider the “basic” specifications without “expert
opinion” variables”. The results are reported in Table 2. As usually, for the OLS
specifications I check the distribution of residuals using the Jarque-Bera test; if it is
significant, I estimate regression after exclusion of outliers until the test becomes
insignificant. A reasonable interpretation is possible only for results, which are robust to this
modification. However, the omission of outliers has virtually no effect on the outcomes of the
estimations.
There are several results interesting from the point of view of the theoretical
predictions. Fiscal decentralization (specifications (1) and (2)) seems to be particularly driven
by the bargaining factors; especially regions with large territory and large distance from
Moscow are likely to have higher retention rates. Interestingly enough, though income per
capita is insignificant, distance from average income has a significant negative impact on the
degree of devolution in fiscal area. This is a surprising result, since it means that regions with
higher preference distance are likely to have lower retention rates. One possible interpretation
could be that not only the size of the distance, but also its sign matters: relatively poor and
relatively rich regions have different expectations towards federation. However, replacing the
measure of distance by the simple difference between average income in the federation and
the regional income yields insignificant results. Hence both too large and too poor regions
accept lower retention rates. It is obvious that for poor regions lower retention rates may be
19
associated with expectation of higher redistribution through the federation.13
It is however
more problematic for rich regions. Yet another explanation could be the desire of the federal
government to control rich regions and to limit their autonomy – logic similar to the
appointment policy of Chinese government (see Sheng, 2007).
For the regulatory decentralization (specifications (3) and (4)) results for the
specification with number and with share of negative conclusions vary slightly. First, one
finds a strong and significant effect of the rules of bargaining / path dependence factors:
republics are on average able to achieve higher degree of devolution, although I was unable to
find any effect of the republic status for fiscal decentralization. Distance from Moscow is also
significant and positive, but it is partly non-robust to outliers (for share, but not for number of
negative conclusions).14
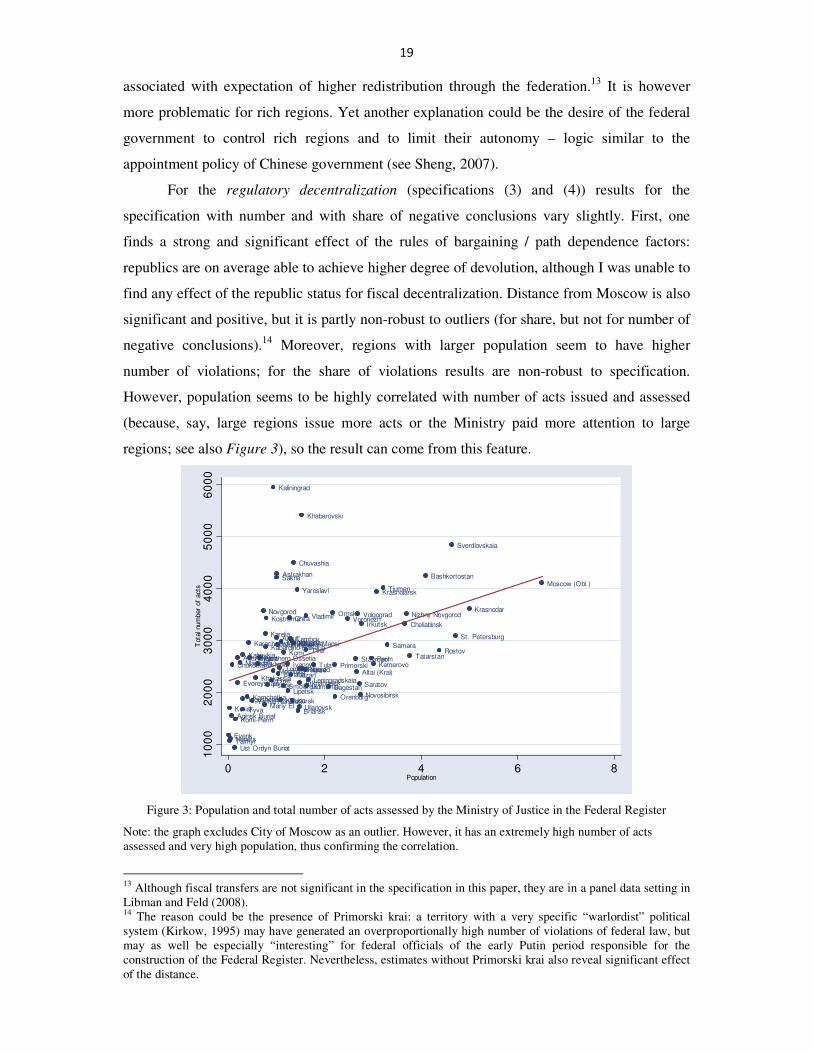
Moreover, regions with larger population seem to have higher
number of violations; for the share of violations results are non-robust to specification.
However, population seems to be highly correlated with number of acts issued and assessed
(because, say, large regions issue more acts or the Ministry paid more attention to large
regions; see also Figure 3), so the result can come from this feature.
Evenk
Koriak
TaimyrNenets
Aginsk Buriat
Chukotka
Ust Ordyn Buriat
Komi-Perm
Altai (Rep.)
Evereyskaia
Magadan
Tyva
Kalmykia
IngushetiaKamchatka
Karachaevo-Cherkessia
Adygeia
Yamal Nenets
Khakassia
SakhalinNorthern Ossetia
Novgorod
Mariy El
Karelia
Kabardino-Balkaria
Kostroma
PskovOrel
Kaliningrad
Mordovia
Sakha
Amur
Astrakhan
Murmansk
BuriatiaTomsk
Kaluga
Kurgan
Smolensk
Komi
Ivanovo
Lipetsk
Chita
Tambov
Riazan
Kursk
Vologda
Chuvashia
Khanty Mansi
Yaroslavl
BrianskUlianovsk
Belgorod
Arkhangelsk
Khabarovski
PenzaKirov
Tver
Vladimir
UdmurtiaLeningradskaia
Tula
Dagestan
Omsk
Primorski
Orenburg
Voronezh
Stavropol
Altai (Krai)
Volgograd
Saratov
Novosibirsk
Irkutsk
PermKemerovo
KrasnoiarskTiumen
Samara
Cheliabinsk
Nizhny Novgorod
Tatarstan
Bashkortostan
Rostov
Sverdlovskaia
St. Petersburg
Krasnodar
Moscow (Obl.)
10
00
20
00
30
00
40
00
50
00
60
00
Tota
l num
ber
of
acts
0 2 4 6 8Population
Figure 3: Population and total number of acts assessed by the Ministry of Justice in the Federal Register
Note: the graph excludes City of Moscow as an outlier. However, it has an extremely high number of acts
assessed and very high population, thus confirming the correlation.
13
Although fiscal transfers are not significant in the specification in this paper, they are in a panel data setting in
Libman and Feld (2008). 14
The reason could be the presence of Primorski krai: a territory with a very specific “warlordist” political
system (Kirkow, 1995) may have generated an overproportionally high number of violations of federal law, but
may as well be especially “interesting” for federal officials of the early Putin period responsible for the
construction of the Federal Register. Nevertheless, estimates without Primorski krai also reveal significant effect
of the distance.

20
Table 2: Factors of decentralization, 1995-1999
(1) (2) (3) (4) (5) (6) (7) (8)
OLS OLS OLS OLS
Negative
binomial
Negative
binomial Ordered logit Ordered logit
Fiscal Fiscal
Regulatory
(share)
Regulatory
(share)
Regulatory
(number)
Regulatory
(number) Constitutional Constitutional
Territory 0.051** 0.051*** 0.002 0.000 0.129 0.119 8.957 6.247
(0.020) -0.017 (0.012) (0.012) (0.085) (0.086) (8.482) (9.804)
Population -0.010 -0.014 0.005 0.005 0.140*** 0.140*** 1.378 2.044
(0.011) (0.010) (0.003) (0.003) (0.035) (0.035) (0.867) (1.775)
Oil and gas 0.015 0.159 0.042 0.041 0.460 0.442 95.876 124.153
(0.180) (0.132) (0.04) (0.036) (0.307) (0.286) (143.094) (172.252)
Income per capita -0.042 -0.019 -0.087 1.840
(0.043) (0.012) (0.091) (6.492)
Distance from
average income -0.102** -0.019 -0.082 13.230
(0.046) (0.013) (0.094) (19.367)
Dummy
autonomous okrug 0.090 0.123* 0.043* 0.039 -0.188 -0.213
(0.071) (0.066) (0.025) (0.025) (0.199) (0.201)
Dummy republic 0.028 0.038 0.053*** 0.053*** 0.581*** 0.579***
(0.030) (0.027) (0.012) (0.012) (0.120) (0.121)
Distance from
Moscow 0.010** 0.009** 0.006* 0.006* 0.057** 0.053** 0.837 1.364
(0.005) (0.004) (0.004) (0.003) (0.023) (0.022) (0.726) (1.754)
Dummy border
region 0.024 0.024 0.006 0.006 0.065 0.066 -1.857 -2.453
(0.022) (0.021) (0.010) (0.010) (0.103) (0.102) (2.694) (4.226)
Share of Russians -13.396** -10.592
(6.583) (7.801)
Urbanization 1.134 1.312 -0.636 -0.765* -2.440 -3.175 212.057* 281.125
(1.109) (1.062) (0.472) (0.454) (4.135) (4.038) (113.072) (185.913)
Fiscal transfers -0.140 -0.106 -0.003 0.009 0.154 0.205 17.297* 21.011
(0.104) (0.104) (0.039) (0.040) (0.415) (0.429) (9.758) (19.225)
Retail trade 0.000 0.001
(0.001) (0.001)
Net profit -0.004 -0.004**
(0.003) (0.002)
Constant 0.597*** 0.583*** 0.116*** 0.117*** 5.173*** 5.185***
(0.083) (0.086) (0.036) (0.037) (0.368) (0.382)
Observations 88 88 88 88 88 88 20 20
Pseudo R2 0.037 0.037 0.490 0.503
R2 0.277 0.321 0.407 0.404
F-stat 10.57*** 9.90*** 7.53*** 8.10***
Wald Chi-stat 90.61*** 91.28*** 26.08*** 36.63***
J.-B. test 195.3*** 134.3*** 56.37*** 63.15***
LR proportional
odds test
32.28 31.44
Notes: numbers in parenthesis are standard errors. * significant at 10% level, ** significant at 5% level, ***
significant at 1% level. Robust standard errors applied. For the analysis of outliers see Appendix B.
21
The estimations for the constitutional decentralization (specifications (5) and (6)) are
especially problematic because of small sample. It is surprising that one obtains a reasonable
statistical significance for this sample at all. Nevertheless, some results should be mentioned.
First, in the specification with average income per capita urbanization and fiscal transfers
seem to have significant and positive effect on devolution; while the first effect once again
confirms the theory, the second may in fact indicate the presence of reverse causality in the
data: regions with higher autonomy have also received higher “pacifying” transfers.
Moreover, share of Russians has a significant and negative impact; unlike other
specifications, where it seemed to matter only if the dummy republic was excluded (as I will
show in what follows), for constitutional decentralization one finds an additional direct effect
even for the sample consisting of republics – regions with lower share of ethnic Russians
seem to have higher level of constitutional devolution. These effects, however, vanish if
distance from average income instead of average income is used.
Several robustness tests can be implemented at this stage. First, I estimated all
regressions including both distance from average income and average income per capita. For
fiscal decentralization distance is still significant and negative, while income is not; for
regulatory (both share and number) and constitutional decentralization both variables are
insignificant. Hence, my results are robust to this modification. Second, I account for the fact
that dependent variables in specifications (1) – (4) are bounded from above by performing
log-odds transformation (Log (Variable / (1- Variable)) and re-estimating the regressions.
Basically, all results are robust, but urbanization and dummy autonomous region loose
significance. Third, since the variables might be determined jointly, I also estimate pairs (1)
and (3) and (2) and (4) as seemingly unrelated regressions (for other variables using system
of equations is unreasonable; it is impossible to use linear- and non-linear models in one
system, and reducing all models to linear form guarantees misspecification of at least one
equation, and therefore, of the whole system). Once again, the results are robust, with the only
exception urbanization for regulatory decentralization in specification with distance from
average income.
5.2. Modified specifications and expert opinion variables
The next step of my analysis is, as mentioned, to look at the variations of
specifications of regressions, and also at potential impact of expert opinion variables. The
individual regressions are reported in Appendix B. I construct all specifications using the same
logic. Each of the first three dimensions of decentralization is covered by 28 regressions: 14
with average income per capita and 14 with distance from average income. In each of these

22
six subgroups the first five regressions are modifications of the basic regression, accounting
for individual factors of decentralization. The first and the second regressions experiment
with probably the most reasonable variables for Russian devolution: bargaining power and
dummy republic / autonomous okrug. Given strong democratic deficits in Russia and
potential endogeneity of fiscal transfers, as well as unclear impact of urbanization on power
distribution, these variables should be most likely to influence the structure of
decentralization. Further regressions explore the role of ethnic heterogeneity. The third
regression estimates a specification including share of Russians, dummy republic and dummy
autonomous okrug; the fourth regression drops the dummies. The fifth regression is the “basic
specification” reported above. Further nine regressions add the expert opinion variables one
by one. Of course, if different expert opinion variables measure the same thing (like different
tension indices), I include only one of them (they are also usually highly correlated);
otherwise the variable, once included, remains in the specification – so, I basically move
towards regressions with larger number of controls. For the constitutional decentralization,
since the sample is smaller, I necessarily have to focus on smaller number of specifications
with a limited selection of controls.
In order to make the comparison of the outcomes more transparent, I summarize the
results in Table 3. As in case of basic regressions, for the residuals from the absolute majority
of the OLS regressions the Jarque-Bera test is highly significant, I also control for potential
effect of outliers, excluding the observations until Jarque-Bera becomes insignificant. The list
of outliers for regulatory and fiscal decentralization differs dramatically: while for the
regulatory decentralization the main outliers are City of Moscow (due to its obvious status of
the capital and “closeness” to the federal government), for the fiscal decentralization the list
of outliers mostly includes tax havens in different combinations, several autonomous regions
(Taimyr and Aginsk Buriat), as well as two republics Tatarstan and Bashkortostan, which
received a special tax regime through the power-sharing agreement. City of Moscow and
Republic of Sakha are also listed among the outliers. Difference in the list of outliers may also
confirm that the regulatory and fiscal decentralization were driven by different factors.
Moreover, the estimations confirm that the choice of dummy republic / autonomous okrugs
over share of Russians was correct. First, if all three variables are included, share of Russians
is never significant (although dummy republic may remain significant). Second, if the dummy
republic was significant and positive in the initial specification, after it is dropped and
replaced by the share of Russians, the latter becomes significant and negative.
23
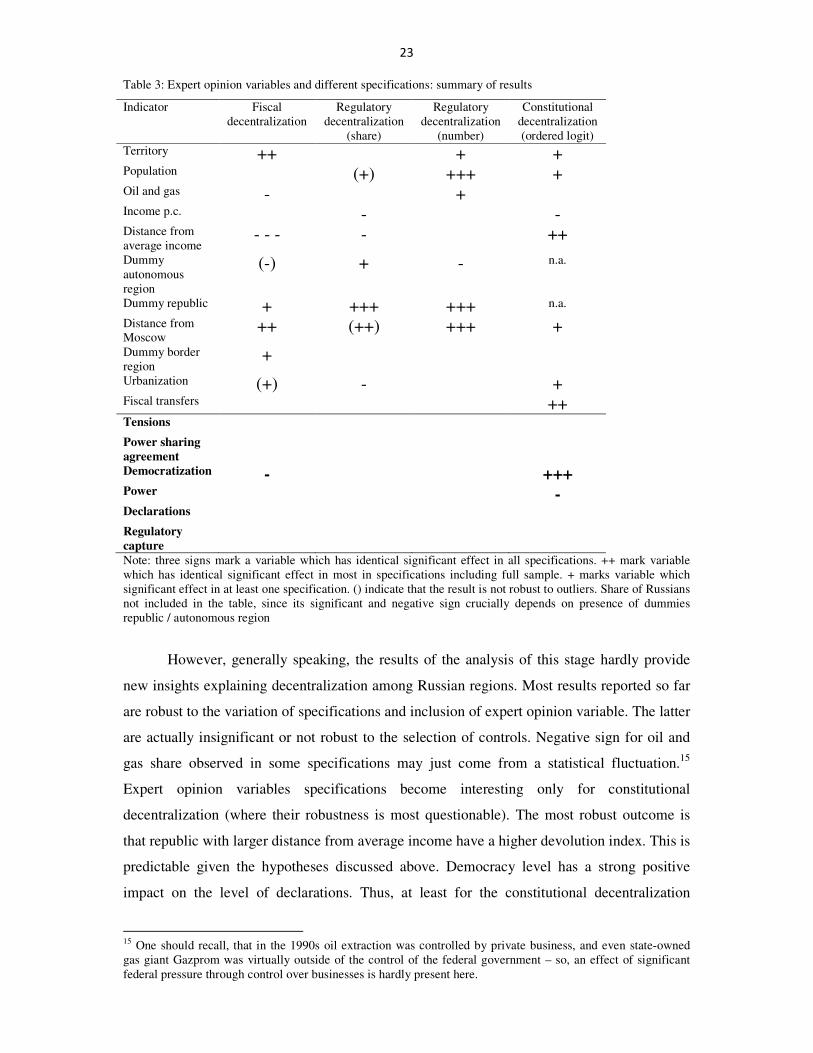
Table 3: Expert opinion variables and different specifications: summary of results
Indicator Fiscal
decentralization
Regulatory
decentralization
(share)
Regulatory
decentralization
(number)
Constitutional
decentralization
(ordered logit)
Territory ++ + + Population (+) +++ + Oil and gas - + Income p.c. - - Distance from
average income - - - - ++
Dummy
autonomous
region
(-) + - n.a.
Dummy republic + +++ +++ n.a.
Distance from
Moscow ++ (++) +++ +
Dummy border
region +
Urbanization (+) - + Fiscal transfers ++ Tensions Power sharing
agreement
Democratization - +++ Power - Declarations Regulatory
capture
Note: three signs mark a variable which has identical significant effect in all specifications. ++ mark variable
which has identical significant effect in most in specifications including full sample. + marks variable which
significant effect in at least one specification. () indicate that the result is not robust to outliers. Share of Russians
not included in the table, since its significant and negative sign crucially depends on presence of dummies
republic / autonomous region
However, generally speaking, the results of the analysis of this stage hardly provide
new insights explaining decentralization among Russian regions. Most results reported so far
are robust to the variation of specifications and inclusion of expert opinion variable. The latter
are actually insignificant or not robust to the selection of controls. Negative sign for oil and
gas share observed in some specifications may just come from a statistical fluctuation.15
Expert opinion variables specifications become interesting only for constitutional
decentralization (where their robustness is most questionable). The most robust outcome is
that republic with larger distance from average income have a higher devolution index. This is
predictable given the hypotheses discussed above. Democracy level has a strong positive
impact on the level of declarations. Thus, at least for the constitutional decentralization
15 One should recall, that in the 1990s oil extraction was controlled by private business, and even state-owned
gas giant Gazprom was virtually outside of the control of the federal government – so, an effect of significant
federal pressure through control over businesses is hardly present here.
24
democracy indeed seems to be a factor supporting the desire for autonomy. However, the
small sample for constitutional decentralization makes the analysis of course problematic.
Moreover, while in the basic specifications the likelihood ratio test did not suggest a violation
of proportional-odds assumption, this is not the case for specifications with expert opinion
variables. The usual way to solve the problem is to estimate the generalized ordered logit
regression; however, in a very small sample with four cut-off levels it is extremely
problematic. 16
5.3. Extreme bounds analysis
A more formal way to approach the problem of robustness of specifications, which
becomes crucial in a small sample environment, is to implement an extreme bounds analysis.
Once again, this method has its merits and demerits. On the one hand, it is a more systematic
analysis of effect of specification on estimation outcomes. However, on the other hand, while
so far my selection of specifications was at least partly driven by the structure of theories, the
EBA simply looks at all possible combinations of regressors. Theoretically, it is possible that
the “true” result is reflected just by one specification, which is “lost” in endless combinations
of EBA. Hence, it is important to interpret the results of EBA in a conservative fashion: while
they are unlikely to give evidence against the influence of certain parameters on
decentralization, if the covariates survive the EBA, it provides additional argument in favor of
the influence.
This paper uses two versions of EBA. The original suggestion of Levine and Renelt
(1992) was to estimate the upper and the lower bounds by taking all possible combinations of
regressors and to look at the smallest estimate minus two standard errors and at the largest
estimate plus two standard errors. If the null is within the interval formed by the upper and the
lower bounds, the impact is not robust. Sala-i-Martin (1997) proposes a less extreme version
of the approach, considering the entire distribution of the coefficient. In this case the
coefficient is robust if the CDF(0) statistics is sufficiently high. Most applications of the EBA
in the literature assume some variables to be present in all regressions (mostly because of
16
Nevertheless, I still tried to apply this method for all regressions where proportional-odds assumption might be
problematic. Unfortunately, most results are extremely non-robust (and also do not confirm observations for
ordered logit). Nevertheless, the results with respect to distance from the average income and fiscal transfers
seem to be relatively robust in terms of sign and significance. The only interesting observation is that more
variables get significant for higher cut-off levels – though the sign varies from level to level. Small size of the
sample does not allow further investigation. Democracy level turns its sign; now it becomes negative and
significant. A conservative approach would allow me to claim that there is a relatively stable positive association
between fiscal transfers and distance from the average income on the one side and constitutional decentralization
on the other; further outcomes are not robust and may be driven by the specification and (violated) proportional-
odds assumption.

25
theoretical results or research traditions) and vary the rest. Unfortunately, the literature on
endogenous decentralization is too young to develop similar assumptions. So, I take all
possible combinations for all possible variables (from bivariate regression to regression with
all possible covariates). Unfortunately, in this setting the multicollinearity can impose very
high volatility of coefficients over regressions; however, there is no better theoretically
motivated alternative.
The EBA for fiscal and regulatory decentralization is performed for 16 variables:
territory, population, share of oil and gas, income per capita, distance from average income,
dummy autonomous region and dummy republic (obviously, both not included in the
constitutional decentralization regressions), distance from Moscow, urbanization, fiscal
transfers, tensions (RUIE), power (Jarocinska), dummy power sharing agreement,
democratization, declarations and regulatory capture (not included in the constitutional
decentralization regressions due to the extremely small sample size): so, regressions include
from 1 to 16 covariates. For the constitutional decentralization I take the combinations of no
more than 7 variables, given that the sample is extremely small. Of course, for the EBA for
each variable I use only regressions including this variable. As a robust result I consider only
variables with CDF(0) > .95 as in Sala-i-Martin (1997).
The results are reported in Table 4. From the point of view of the original Levine and
Renelt approach, there is not a single variable with both upper and lower bounds strictly
larger (or smaller) zero. This is hardly surprising and quite typical for empirical research.
However, the Sala-i-Martin approach yields some robust variables, mostly identical to those
reported above.
For the fiscal decentralization I find a robust and positive impact of the size of the
territory, of the population and of the distance from Moscow, as well as robust negative
impact of distance from the average income and of population. The results fit the previous
observations with the only exception of the population, which turns out to have a robust
impact because of a multitude of regressions where territory is absent (and population is
highly significant and negative). This is to a certain extend an artifact of the extremely
agnostic perception of the set of controls applied here. Nevertheless, the observation is
interesting, because it is counterintuitive: it seems that large regions (by population) have
smaller bargaining power vis-à-vis the federal center, while large regions (by territory) have
larger one.
For the regulatory decentralization measured by the share of acts I find a robust and
positive impact of distance from Moscow and of the dummy republic. These results just
confirm the regularities reported above.
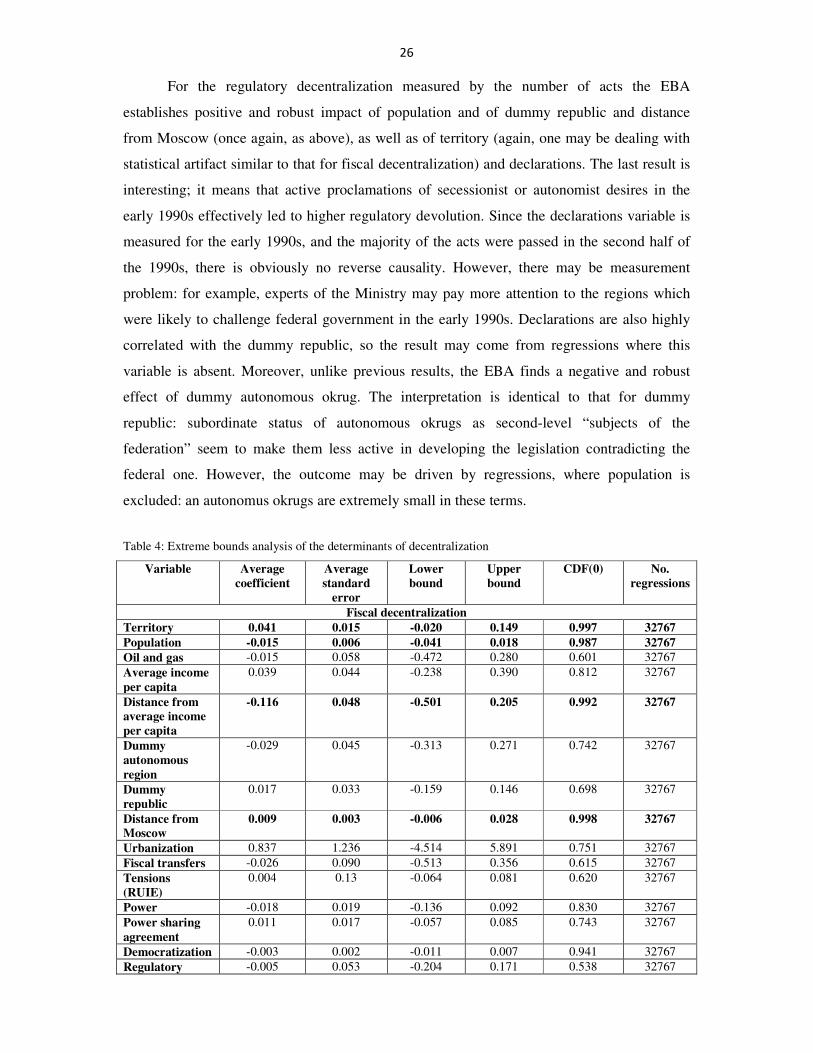
26
For the regulatory decentralization measured by the number of acts the EBA
establishes positive and robust impact of population and of dummy republic and distance
from Moscow (once again, as above), as well as of territory (again, one may be dealing with
statistical artifact similar to that for fiscal decentralization) and declarations. The last result is
interesting; it means that active proclamations of secessionist or autonomist desires in the
early 1990s effectively led to higher regulatory devolution. Since the declarations variable is
measured for the early 1990s, and the majority of the acts were passed in the second half of
the 1990s, there is obviously no reverse causality. However, there may be measurement
problem: for example, experts of the Ministry may pay more attention to the regions which
were likely to challenge federal government in the early 1990s. Declarations are also highly
correlated with the dummy republic, so the result may come from regressions where this
variable is absent. Moreover, unlike previous results, the EBA finds a negative and robust
effect of dummy autonomous okrug. The interpretation is identical to that for dummy
republic: subordinate status of autonomous okrugs as second-level “subjects of the
federation” seem to make them less active in developing the legislation contradicting the
federal one. However, the outcome may be driven by regressions, where population is
excluded: an autonomus okrugs are extremely small in these terms.
Table 4: Extreme bounds analysis of the determinants of decentralization
Variable Average
coefficient
Average
standard
error
Lower
bound
Upper
bound
CDF(0) No.
regressions
Fiscal decentralization
Territory 0.041 0.015 -0.020 0.149 0.997 32767
Population -0.015 0.006 -0.041 0.018 0.987 32767
Oil and gas -0.015 0.058 -0.472 0.280 0.601 32767
Average income
per capita
0.039 0.044 -0.238 0.390 0.812 32767
Distance from
average income
per capita
-0.116 0.048 -0.501 0.205 0.992 32767
Dummy
autonomous
region
-0.029 0.045 -0.313 0.271 0.742 32767
Dummy
republic
0.017 0.033 -0.159 0.146 0.698 32767
Distance from
Moscow
0.009 0.003 -0.006 0.028 0.998 32767
Urbanization 0.837 1.236 -4.514 5.891 0.751 32767
Fiscal transfers -0.026 0.090 -0.513 0.356 0.615 32767
Tensions
(RUIE)
0.004 0.13 -0.064 0.081 0.620 32767
Power -0.018 0.019 -0.136 0.092 0.830 32767
Power sharing
agreement
0.011 0.017 -0.057 0.085 0.743 32767
Democratization -0.003 0.002 -0.011 0.007 0.941 32767
Regulatory -0.005 0.053 -0.204 0.171 0.538 32767

27
Variable Average
coefficient
Average
standard
error
Lower
bound
Upper
bound
CDF(0) No.
regressions
capture
Declarations 0.033 0.026 -0.074 0.139 0.900 32767
Regulatory decentralization (share)
Territory 0.008 0.011 -0.041 0.061 0.762 32767
Population 0.003 0.004 -0.016 0.018 0.760 32767
Oil and gas 0.019 0.032 -0.259 0.160 0.723 32767
Average income
per capita
-0.003 0.023 -0.169 0.188 0.559 32767
Distance from
average income
per capita
-0.008 0.027 -0.253 0.187 0.622 32767
Dummy
autonomous
region
-0.006 0.021 -0.160 0.115 0.609 32767
Dummy
republic
0.052 0.017 -0.026 0.138 0.999 32767
Distance from
Moscow
0.006 0.003 -0.005 0.019 0.968 32767
Urbanization -0.821 0.506 -2.894 2.346 0.946 32767
Fiscal transfers 0.049 0.042 -0.167 0.259 0.878 32767
Tensions
(RUIE)
-0.015 0.010 -0.068 0.025 0.927 32767
Power 0.009 0.012 -0.044 0.083 0.780 32767
Power sharing
agreement
-0.017 0.012 -0.058 0.017 0.929 32767
Democratization -0.001 0.001 -0.006 0.004 0.709 32767
Regulatory
capture
-0.013 0.039 -0.176 0.114 0.627 32767
Declarations 0.017 0.013 -0.058 0.065 0.904 32767
Regulatory decentralization (number)
Territory 0.164 0.091 -0.256 0.636 0.965 32767
Population 0.106 0.037 -0.084 0.255 0.998 32767
Oil and gas 0.259 0.343 -1.674 1.609 0.775 32767
Average income
per capita
0.012 0.211 -2.046 1.741 0.522 32767
Distance from
average income
per capita
0.093 0.250 -2.034 2.572 0.645 32767
Dummy
autonomous
region
-0.760 0.181 -2.450 0.287 0.999 32767
Dummy
republic
0.526 0.173 -0.401 1.268 0.999 32767
Distance from
Moscow
0.055 0.024 -0.044 0.173 0.989 32767
Urbanization -4.495 4.574 -31.708 20.473 0.837 32767
Fiscal transfers 0.343 0.448 -2.298 2.641 0.778 32767
Tensions
(RUIE)
-0.148 0.097 -0.718 0.237 0.936 32767
Power 0.146 0.120 -0.418 0.965 0.889 32767
Power sharing
agreement
-0.050 0.114 -0.411 0.394 0.670 32767
Democratization 0.001 0.010 -0.045 0.042 0.538 32767
Regulatory
capture
-0.141 0.402 -1.604 1.258 0.637 32767
Declarations 0.273 0.138 -0.401 0.846 0.977 32767
Constitutional decentralization
Territory 5.001 4.245 -33.447 68.604 0.881 2510
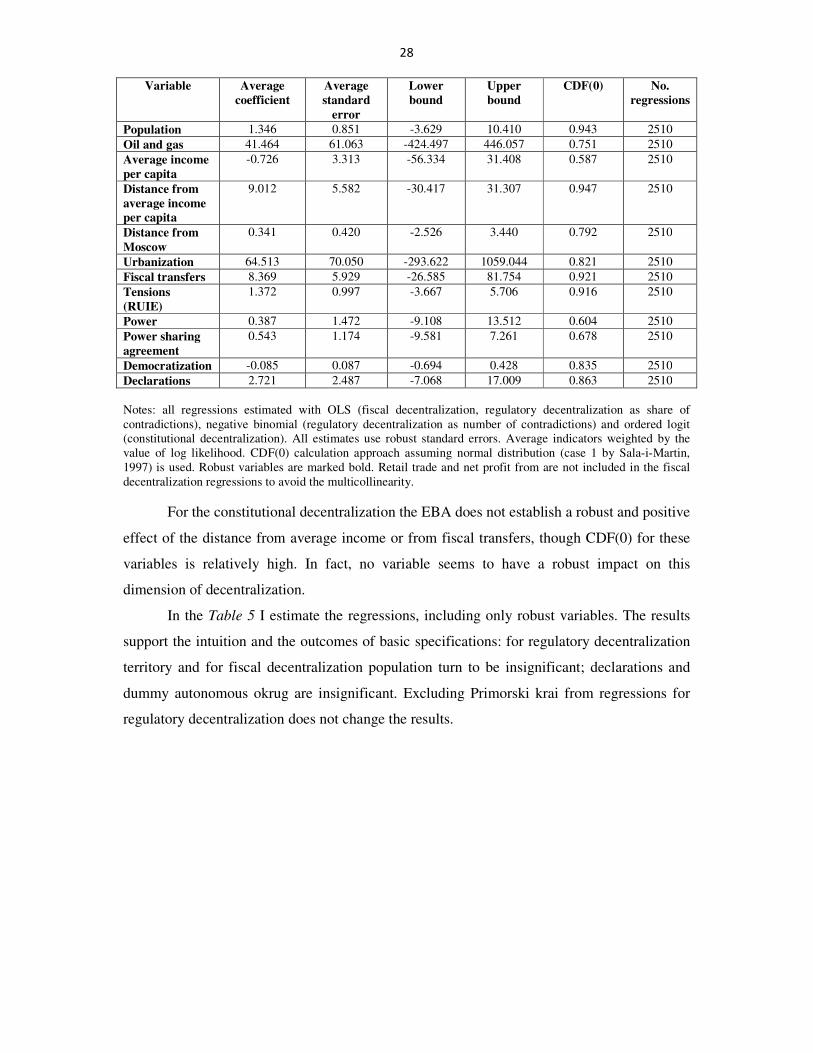
28
Variable Average
coefficient
Average
standard
error
Lower
bound
Upper
bound
CDF(0) No.
regressions
Population 1.346 0.851 -3.629 10.410 0.943 2510
Oil and gas 41.464 61.063 -424.497 446.057 0.751 2510
Average income
per capita
-0.726 3.313 -56.334 31.408 0.587 2510
Distance from
average income
per capita
9.012 5.582 -30.417 31.307 0.947 2510
Distance from
Moscow
0.341 0.420 -2.526 3.440 0.792 2510
Urbanization 64.513 70.050 -293.622 1059.044 0.821 2510
Fiscal transfers 8.369 5.929 -26.585 81.754 0.921 2510
Tensions
(RUIE)
1.372 0.997 -3.667 5.706 0.916 2510
Power 0.387 1.472 -9.108 13.512 0.604 2510
Power sharing
agreement
0.543 1.174 -9.581 7.261 0.678 2510
Democratization -0.085 0.087 -0.694 0.428 0.835 2510
Declarations 2.721 2.487 -7.068 17.009 0.863 2510
Notes: all regressions estimated with OLS (fiscal decentralization, regulatory decentralization as share of
contradictions), negative binomial (regulatory decentralization as number of contradictions) and ordered logit
(constitutional decentralization). All estimates use robust standard errors. Average indicators weighted by the
value of log likelihood. CDF(0) calculation approach assuming normal distribution (case 1 by Sala-i-Martin,
1997) is used. Robust variables are marked bold. Retail trade and net profit from are not included in the fiscal
decentralization regressions to avoid the multicollinearity.
For the constitutional decentralization the EBA does not establish a robust and positive
effect of the distance from average income or from fiscal transfers, though CDF(0) for these
variables is relatively high. In fact, no variable seems to have a robust impact on this
dimension of decentralization.
In the Table 5 I estimate the regressions, including only robust variables. The results
support the intuition and the outcomes of basic specifications: for regulatory decentralization
territory and for fiscal decentralization population turn to be insignificant; declarations and
dummy autonomous okrug are insignificant. Excluding Primorski krai from regressions for
regulatory decentralization does not change the results.
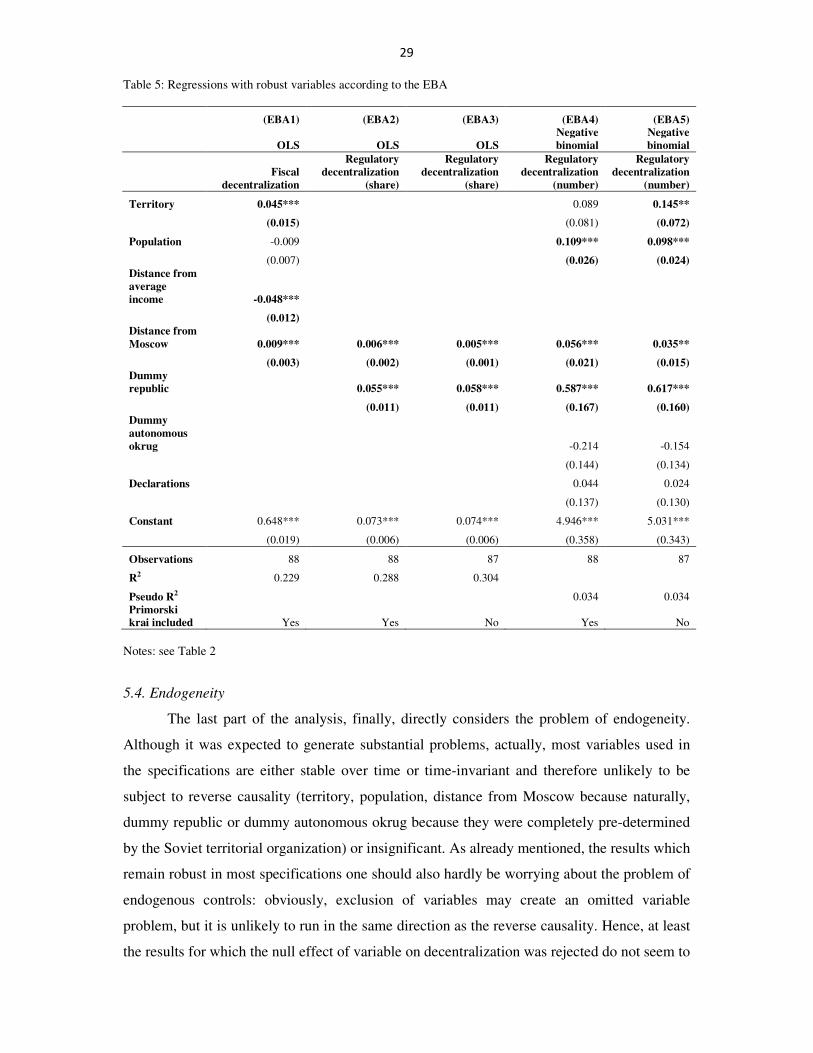
29
Table 5: Regressions with robust variables according to the EBA
(EBA1) (EBA2) (EBA3) (EBA4) (EBA5)
OLS OLS OLS
Negative
binomial
Negative
binomial
Fiscal
decentralization
Regulatory
decentralization
(share)
Regulatory
decentralization
(share)
Regulatory
decentralization
(number)
Regulatory
decentralization
(number)
Territory 0.045*** 0.089 0.145**
(0.015) (0.081) (0.072)
Population -0.009 0.109*** 0.098***
(0.007) (0.026) (0.024)
Distance from
average
income -0.048***
(0.012)
Distance from
Moscow 0.009*** 0.006*** 0.005*** 0.056*** 0.035**
(0.003) (0.002) (0.001) (0.021) (0.015)
Dummy
republic 0.055*** 0.058*** 0.587*** 0.617***
(0.011) (0.011) (0.167) (0.160)
Dummy
autonomous
okrug -0.214 -0.154
(0.144) (0.134)
Declarations 0.044 0.024
(0.137) (0.130)
Constant 0.648*** 0.073*** 0.074*** 4.946*** 5.031***
(0.019) (0.006) (0.006) (0.358) (0.343)
Observations 88 88 87 88 87
R2 0.229 0.288 0.304
Pseudo R2 0.034 0.034
Primorski
krai included Yes Yes No Yes No
Notes: see Table 2
5.4. Endogeneity
The last part of the analysis, finally, directly considers the problem of endogeneity.
Although it was expected to generate substantial problems, actually, most variables used in
the specifications are either stable over time or time-invariant and therefore unlikely to be
subject to reverse causality (territory, population, distance from Moscow because naturally,
dummy republic or dummy autonomous okrug because they were completely pre-determined
by the Soviet territorial organization) or insignificant. As already mentioned, the results which
remain robust in most specifications one should also hardly be worrying about the problem of
endogenous controls: obviously, exclusion of variables may create an omitted variable
problem, but it is unlikely to run in the same direction as the reverse causality. Hence, at least
the results for which the null effect of variable on decentralization was rejected do not seem to

30
suffer from endogeneity through reverse causality. Of course, as already mentioned, the very
approach I use does not completely resolve the omitted variable bias problem, and therefore
even for these variables some caution is required. Moreover, it is impossible to make any
claims with respect to the results for which the null hypothesis was actually not rejected or
happened to be rejected in a non-robust fashion through different specifications: for this
variables endogeneity bias may make me ignore actually existing effects – once again, a
reason for caution.
There are, however, several cases when the endogeneity problem may be driving the
robust results. The most troubling cases are distance from the average income for fiscal and
constitutional decentralization and fiscal transfers and distance from the average income (both
robust results) for constitutional decentralization. In what follows I examine the problem
more closely, using the instrumental variables techniques. One should notice that the chosen
instruments are often not unambiguous; hence, the results should be treated with caution.
In case of fiscal decentralization the link between fiscal policy and economic
performance in Russian regions is questionable (Libman and Feld, 2008; Libman, 2008),
probably indicating that the endogeneity problem may not be crucial. Nevertheless, as an
additional robustness check I apply the IV estimation. The choice of instruments is not so
simple: although virtually all variables are related to growth, all variables may act as proxies
for preference distance and thus impact the decentralization. The theory existing so far does
not allow us to make a clear choice. An instrument I use in this setting is the absolute value of
the difference between the mean number of conclusions (positive and negative) in the Federal
Register for a region and the number of conclusion for this specific region (denoted as
“differences in conclusions” henceforth). This variable looks like an analogue of the distance
of the number of acts (or conclusions) in a particular region from the federal average.
Assuming the density of regulation has an impact on economic performance, it is likely to
influence distance from average income. However, it is unlikely to be related to fiscal
decentralization, because, as shown above, fiscal decentralization and regulatory
decentralization have little in common. It is also difficult to come to a conclusion why the
number of acts in a region may impact its devolution from the taxation point of view.
Moreover, although the degree of devolution may have an impact on the policies of the
Ministry of Justice, the latter most certainly does not look at fiscal affairs (which are far
outside of its field of responsibility). Hence, the variable may be a reasonable predictor for
endogenous regressor and does not influence the dependent variable. Statistically, that is
exactly what one observes while including difference in conclusions in the decentralization
regression (it is insignificant) and in the first-stage regressions (significant, however,

31
depending upon the specification; the F-value is, however, much smaller than 10 suggesting a
weak instrument problem). In Table 6 I report some specifications for the IV estimator.
Although the result yields the expected sign, it is not always significant, partly depending
upon specification and choice of controls.
The problem of endogeneity for constitutional decentralization may be more
important. There is a substantial literature linking interbudgetary grants to loyalty of Russian
regions to the center (Treisman, 1996, 1998; Solanko, 1999; Popov, 2004; Jarocinska, 2004;
Dombrovsky, 2006): the question is whether it is the “loyal” or the “secessionist” regions
receiving higher amount of funds, but for the purposes of this paper it is sufficient that the
link might exist. Higher declared autonomy may as well have an impact on political process
and thus on democratization levels. However, for a sample of 20 observations it is hardly
possible to solve the problem. Moreover, IV estimation in models with discrete outcomes can
be problematic, since it generally does not provide point identification. Point identification is
possible with triangular models, which, however, impose restrictive assumptions (cf. Chesher,
2008). One of the possible ways to at least approach the problem is to apply a two-stage
ordered logit model (for specifications where proportional odds assumption was not violated)
with Murphy-Topel standard error correction; implementation of this approach for applied
research is discussed by Hole (2006). I have experimented with this approach, using as the
instrument for distance from average income, as above, differences in conclusions; and for
fiscal transfers the average retail trade in the region is applied.17
Unfortunately, the
experiments with different specifications give insignificant results, though the sign remains
after the instrumentation. Hence, the effects are likely to be caused by endogeneity.
17
This instrument may be a good predictor for fiscal transfers, because it is an important indicator for the tax
base generated by the regional economy. On the other hand, the variable is unlikely to have any effect on
constitutional decentralization; the only way how the variable could have an impact on the decentralization
process is through income per capita, which, as already mentioned, turned to be insignificant. In fact, both
instruments are highly significant in first-stage OLS regressions and insignificant while added to ordered logit
regressions.

32
Table 6: Endogeneity of distance from average income
(IV1) (IV2) (IV3) (IV4)
IV IV IV IV
Territory 0.043** 0.047** 0.052** 0.052**
(0.017) (0.018) (0.024) (0.022)
Distance from
Moscow 0.011*** 0.009*** 0.007* 0.007**
(0.003) (0.003) (0.004) (0.003)
Oil and gas 0.046 0.057 0.004 0.005
(0.124) (0.132) (0.521) (0.396)
Distance from
average income -0.066* -0.088* -0.020 -0.020
(0.039) (0.050) (0.181) (0.148)
Dummy republic 0.010 0.002 0.002
(0.033) (0.043) (0.037)
Dummy
autonomous okrug 0.067 0.027 0.027
(0.044) (0.118) (0.087)
Retail trade -0.000 -0.000
(0.002) (0.002)
Net profit -0.003 -0.003
(0.004) (0.003)
Population 0.000
(0.017)
Constant 0.635*** 0.639*** 0.628*** 0.628***
(0.019) (0.018) (0.030) (0.051)
Observations 88 88 88 88
R2 0.209 0.229 0.236 0.236
F-stat 11.20*** 7.28*** 12.81*** 19.71***
First stage: t-stat for
external instrument 4.55*** 3.98*** 1.63 2.13**
Note: See Table 2. Instrument is difference in conclusions for distance from average income
6. Conclusion
Decentralization encompasses multiple aspects with partly sophisticated connection to
each other. This paper tried to look at both interrelation of different aspects of decentralization
and the factors of the endogenous devolution using the example of the Russian Federation. In
an asymmetric setting with weak rule of law and public hierarchy different forms of
devolution became subject of bargaining between the federal government and the regions.
However, identical agents seem to generate completely different outcomes for different
components of the decentralization process. In particular, I looked at decentralization at the
rules level, i.e. allocation of authorities set by regional constitutions, as well as at the
decentralization at the outcomes level, i.e. split of tax revenue and the regulation authority.
Indeed, constitutional and both post-constitutional level forms of decentralization are not
33
correlated to each other. It is important to notice, that the paper does not attempt to reveal a
“true” or “correct” measure of decentralization: all three dimensions may be relevant
depending upon the particular policy and research question – one should just carefully
identify what one is looking for.
Moreover, different aspects of decentralization are driven by different sets of factors.
While fiscal decentralization is influenced by some bargaining power (territory, distance from
Moscow) and preference (distance from the average income) parameters, regulatory
decentralization is heavily determined by the bargaining rules and / or path dependence
(status of the republic). Distance from Moscow seems to be the only variable influencing both
dimensions of decentralization. Generally speaking, geography (distance from Moscow,
territory of the regions) appears to be a very strong factor influencing the endogenous
decentralization. Since Russia is a relatively well developed country (and does not have the
“classical” problems of developing world, where certain parts of the territory may be simply
cut off from the central administration), this result is especially interesting. Finally, the sets of
outliers for regulatory and fiscal decentralization differ completely. Constitutional
decentralization seems to be related to parameters like distance from the average income and
fiscal transfers; however, estimations are extremely problematic due to small sample,
proportional-odds assumption and endogeneity and do not seem to be robust in the extreme
bounds analysis.
There are a number of limitations for the study from the point of view of the
generalization of results. First, all indicators have limited ability to measure the underlying
decentralization concepts. Second, the contradiction between unilateral and bilateral
devolution and formally highly symmetric design of the Russian federalism may influence the
results. Third, I am considering a relatively short time period in an unstable institutional,
economic and political environment. For example, the data includes the period of economic
crisis in 1998, which had a profound impact on the behavior of all bargaining parties. Finally,
this paper has only limited ability to resolve the endogeneity problem (as usually); hence, the
results should be treated rather like correlations than causal links. Nevertheless, it still
provides additional evidence in favor of the suspicion that different aspects of decentralization
are really different from each other in terms of determinants and outcomes, what may be quite
important for the empirical studies of the factors and impact of decentralization.
References
Alesina, Alberto, and Enrico Spolaore (2003): The Size of Nations, Cambridge MA: MIT Press
Ali, Amal Kamal (2002): Understanding Decentralization: Local Power over Decision-Making for
Comprehensive Planning in Florida. PhD Thesis, Florida State University
34
Arzaghi, Mohammad, and J. Vernon Henderson (2005): Why Countries Are Fiscally Decentralizing. Journal of
Public Economics 89:1157-1189
Bartsiz, Igor (2001): Rossiiskaya Anomiya. Gosudarstvennaya Sluzhba (1)
Ben-Bassat, Avi, and Momi Dahan (2008): Social Rights in the Constitutions and in Practice. Journal of
Comparative Economics 36:103-119
Blume, Lorenz, and Stefan Voigt (2008): Federalism and Decentralization – A Critical Survey of Frequently
Used Indicators. MAGKS Working Paper No. 21
Boltenkova, L.F. (1998): Dogovory mezhdu Organami Gosudarstvennoi Vlasti RF i Organami Gosudarstvennoi
Vlasti Subjektov RF o Raspredelenii Predmetov Vedenia i Polnomochii. Mimeo
Buchanan, James M., and Roger L. Faith (1987): Secession and the Limits of Taxation: Towards a Theory of
Internal Exit. American Economic Review 77:1023-1031
Cerniglia, Floriana (2003): Decentralization in the Public Sector: Quantitative Aspects in Federal and Unitary
Countries. Journal of Policy Modeling 25:749-776
Chesher, Andrew (2008): Instrumental Variable Models for Discrete Outcomes. Mimeo
Dombrovsy, Vyacheslav (2006): What Kept the Russian Federation Intact? Testing the Internal Exit Model of
Buchanan and Faith, in: Ott, Attiat F., and Richard Cebula (eds.): Empirical Public Economics.
Cheltenham: Edward Elgar
Dowley, Kathleen M. (1998): Striking the Federal Bargain in Russia: Comparative Regional Government
Strategies. Communist and Post-Communist Studies 31:359-380
Dusseault, David, Hansen, Martin Ejnar, and Slava Mijhailov (2005): The Significance of Economy in the
Russian Bi-Lateral Treaty Process. Communist and Post-Communist Studies 38(1):121-130
Ebel, Robert D., and Serdar Yilmaz (2002): On the Measurement and Impact of Fiscal Decentralization. Mimeo
Eckardt, Sebastian (2002): Russia’s Market Distorting Federalism: Decentralization, Governance and Economic
Performance in Russia in the 1990s. Arbeitspapier des Osteuropa-Instituts der Freien Universität Berlin
42/2002
Falleti, Tulia G. (2005): A Sequential Theory of Decentralization: Latin American Cases in Comparative
Perspective. American Political Science Review 99(3):327-346
Feld, Lars P., Schaltegger, Christoph, and Jan Schnellenbach (2008): On Government Centralization and Fiscal
Referendums. European Economic Review 52(4):611-645
Feld, Lars P., Schaltegger, Christoph, and Jan Schnellenbach (2006): The Impact of Referendums on the
Centralization of Public Goods Provision: A Political Economy Approach. CESifo Working Paper No.
1803
Filippov, Mikhail, Ordershook, Peter C., and Olga Shvetsova (2004): Designing Federalism: A Theory of Self-
Sustainable Federal Institutions, Cambridge
Freinkman, Lev, Treisman, Daniel, and Stepan Titov (1999): Subnational Budgeting in Russia. World Bank
Technical Paper No.452
Gel’man, Vladimir, and Evgenia Popova (2003): Regional’nye Politicheskie Elity i Strategii Regional’noi
Identichnisti v Sovremennoi Rossii, in: Gel’man, V., and T. Hopf (eds.): Centr i Regional’nye Identichnosti
v Rossii. St. Petersburg
Hennessey, Jessica (2008): The Adoption of Constitutional Home Rule: A Test of Endogenous Policy
Decentralization. Mimeo
Hole, Arne Risa (2006): Calculating Murphy–Topel Variance Estimates in Stata: A Simplified Procedure. Stata
Journal 6: 521–529
Hutchcroft, Paul D. (2001): Decentralization in Administration and Politics: Assessing Territorial Dimension of
Authority and Power. Governance 14(1):23-53
Jarocinska, Elena (2004): Determinants of Intergovernmental Transfers in Russia: Political Factors versus
Objective Criteria. Mimeo
Kirkow, Peter (1995): Regional Warlordism in Russia: The Case of Primorskii Krai. Europe-Asia Studies
47(6):923-947
Kurnyshov, V.V. (1998): Analis Normativno-Pravovoi Basy Snizhenia Ekonomicheskoi, Social’noi i Pravovoi
Asimmetrii v Rasvitii Regionov Rossiiskoi Federacii. Mimeo
Landry, Pierre F. (2004): Adaptive Authoritarianism in Asia: Decentralization, Regulation, and Promotion.
Mimeo
Letelier, Leonardo (2005): Explaining Fiscal Decentralization. Public Finance Review 33:155-183
Leon Alfonso, Sandra (2002): Explanatory Factors of Fiscal Decentralization. Mimeo
Levine, Ross, and David Renelt (1992): A Sensitivity Analysis of Cross-Country Growth Regressions. American
Economic Review 82(4): 942-963
Libman, Alexander (2008): Democracy, Size of Bureaucracy, and Economic Growth: Evidence from the Russian
Regions. Mimeo
Libman, Alexander (2008a): Devolution in (Non-)Democracies. Mimeo
Libman, Alexander, and Lars P. Feld (2008): Strategic Tax Collection and Fiscal Decentralization: The Case of
Russia. Mimeo
35
Liu, Chih-Huang (2007): What Type of Fiscal Decentralization System Has Better Performance? PhD Thesis,
University of Maryland
Marks, Gary, Hooghe, Liesbet, and Arjan H. Schakel (2008): Regional Authority in 42 Countries, 1956-2006: A
Measure and Five Hypotheses. Special Issue of Regional and Federal Studies 18(2-3)
Martinez-Vazquez, Jorge (2002): Asymmetric Federalism in Russia: Cure or Poison? Andrew Young School of
Policy Studies ISP Working Paper 03-04
Oates, Wallace E. (2002): Fiscal and Regulatory Competition: Theory and Evidence. Perspektiven der
Wirtschaftspolitik 3(4):377-390
Obydenkova, Anastassia (2008): Democratization, Regionalization and Europeanization in Russia: Interplay of
National and Transnational Factors. Saarbrücken: VDM Verlag
Panizza, Ugo (1999): On the Determinants of Fiscal Centralization: Theory or Evidence. Journal of Public
Economics 74:93-139
Polishchuk, Leonid (2001): Legal Initiatives of Russian Regions: Determinants and Effects, in: Murrell, P. (ed.):
The Value of Law in Transition Economies, University of Michigan Press, Ann Arbor: 330-368
Popov, Vladimir (2004): Fiscal Federalism in Russia: Rules versus Electoral Politics. Comparative Economic
Studies 46:515-541
Rosefielde, Steven, and Natalia Vennikova (2004): Fiscal Federalism in Russia: A Critique of the OECD
Proposal. Cambridge Journal of Economics 28:307-318
Ruta, Michele (2007): Lobbying and Political (Dis)integration. Mimeo
Sala-i-Martin, Xavier (1997): I Just Ran Two Million Regressions. American Economic Review 87(2): 178-183
Schneider, Aaron (2003): Decentralization: Conceptualization and Measurement. Studies in Comparative
International Development 38(3):32-56
Sharma, Chanchal Kumar (2006): Decentralization Dilemma: Measuring the Degree and Evaluating the
Outcomes. Indian Journal of Political Science 67(1):49-64
Sheng, Yumin (2007): Global Market Integration and Central Political Control: Foreign Trade and
Intergovernmental Relations in China. Comparative Political Studies 40(4): 405-434
Slinko, Irina, Yakovlev, Evgeny, and Ekaterina Zhuravskaya (2005): Laws for Sale: Evidence from Russia.
American Law and Economics Review 7:284-318
Solnick, Steven L. (2002): Federalism and State-Building: Post-Communist and Post-Colonial Perspectives. In:
Reynolds, A. (ed.): The Architecture of Democracy: Constitutional Design, Conflict Management, and
Democracy. Oxford University Press
Söderlund, Peter (2006): The Dynamics of Federalism in Russia: A Study of Formal and Informal Power
Resources of the Regional Chief Executives in Russian Centre-Region Relations. Abo: Abo Academy
University Press
Solanko, Laura (1999): Regional Budgets and Intergovernmental Transfers in Russian North and Northwest
Regions. BOFIT Online (6)
Stegarescu, Dan (2005): Public Sector Decentralization: Measurement Concepts and Recent International
Trends. Fiscal Studies 26(3): 301-333
Stegarescu, Dan (2006): Decentralizing Government in an Integrating World. Heidelberg: Physica
Stoner-Weiss, Kathryn (1998): Russian Federalism and Regionalism. Paper presented at the Symposium on the
State of the Post-Soviet Politics field at University of Texas at Austin, November 13
Strumpf, Koleman S., and Felix Oberholzer-Gee (2002): Endogenous Policy Decentralization: Testing the
Central Tenet of Economic Federalism. Journal of Political Economy 110:1-36
Traub, Leah G., and Hilary Sigman (2007): “Cooperative Federalism” as a Strategic Interaction: Voluntary
Decentralization in Environmental Policy. NBER Working Paper No. 13238
Treisman, Daniel S. (1996): The Politics of Intergovernmental Transfers in Post-Soviet Russia. British Journal
of Political Science 26:299-335
Treisman, Daniel S. (1998): Fiscal Redistribution in a Fragile Federation: Moscow and the Regions in 1994.
British Journal of Political Science 28: 185-222
Treisman, Daniel S. (2002): Defining and Measuring Decentralization: A Global Perspective. Mimeo
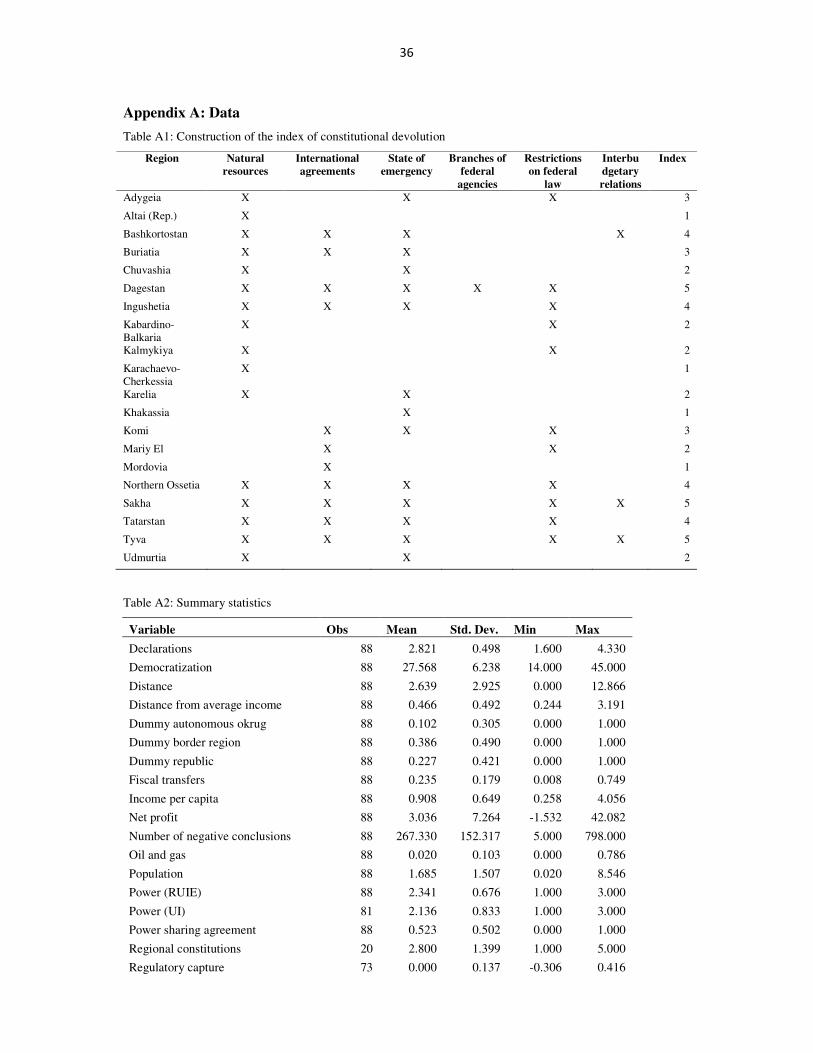
36
Appendix A: Data
Table A1: Construction of the index of constitutional devolution
Region Natural
resources
International
agreements
State of
emergency
Branches of
federal
agencies
Restrictions
on federal
law
Interbu
dgetary
relations
Index
Adygeia X X X 3
Altai (Rep.) X 1
Bashkortostan X X X X 4
Buriatia X X X 3
Chuvashia X X 2
Dagestan X X X X X 5
Ingushetia X X X X 4
Kabardino-
Balkaria
X X 2
Kalmykiya X X 2
Karachaevo-
Cherkessia
X 1
Karelia X X 2
Khakassia X 1
Komi X X X 3
Mariy El X X 2
Mordovia X 1
Northern Ossetia X X X X 4
Sakha X X X X X 5
Tatarstan X X X X 4
Tyva X X X X X 5
Udmurtia X X 2
Table A2: Summary statistics
Variable Obs Mean Std. Dev. Min Max
Declarations 88 2.821 0.498 1.600 4.330
Democratization 88 27.568 6.238 14.000 45.000
Distance 88 2.639 2.925 0.000 12.866
Distance from average income 88 0.466 0.492 0.244 3.191
Dummy autonomous okrug 88 0.102 0.305 0.000 1.000
Dummy border region 88 0.386 0.490 0.000 1.000
Dummy republic 88 0.227 0.421 0.000 1.000
Fiscal transfers 88 0.235 0.179 0.008 0.749
Income per capita 88 0.908 0.649 0.258 4.056
Net profit 88 3.036 7.264 -1.532 42.082
Number of negative conclusions 88 267.330 152.317 5.000 798.000
Oil and gas 88 0.020 0.103 0.000 0.786
Population 88 1.685 1.507 0.020 8.546
Power (RUIE) 88 2.341 0.676 1.000 3.000
Power (UI) 81 2.136 0.833 1.000 3.000
Power sharing agreement 88 0.523 0.502 0.000 1.000
Regional constitutions 20 2.800 1.399 1.000 5.000
Regulatory capture 73 0.000 0.137 -0.306 0.416
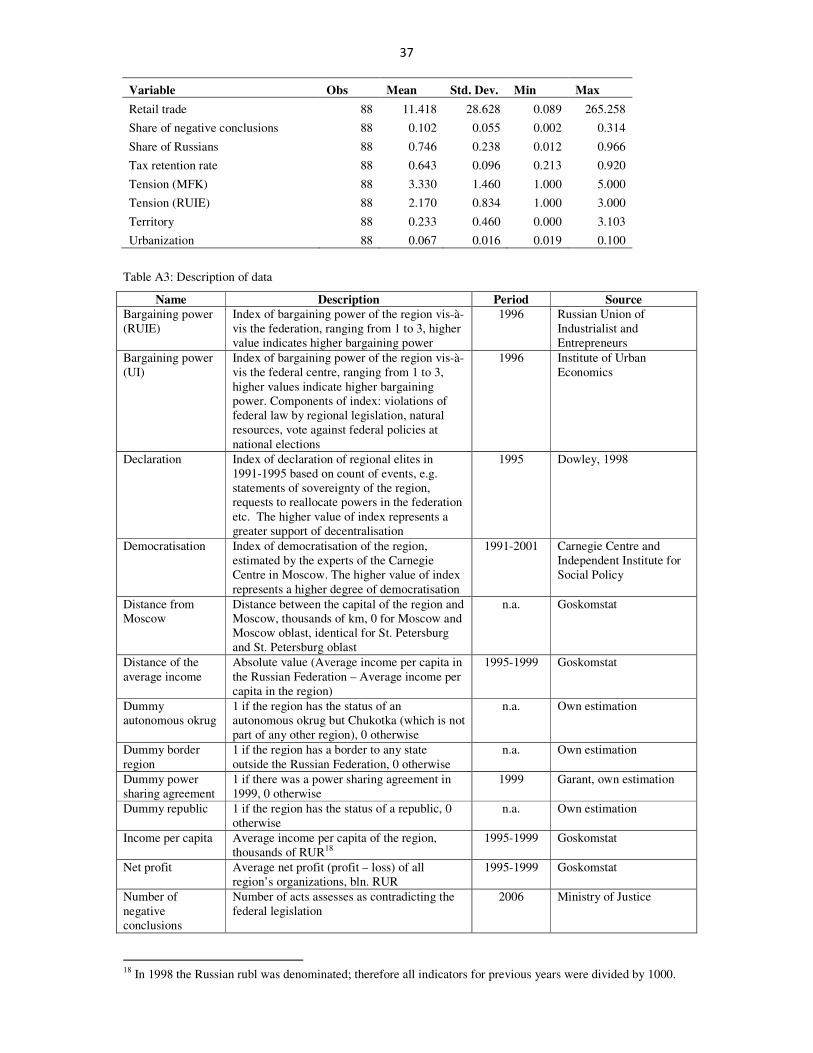
37
Variable Obs Mean Std. Dev. Min Max
Retail trade 88 11.418 28.628 0.089 265.258
Share of negative conclusions 88 0.102 0.055 0.002 0.314
Share of Russians 88 0.746 0.238 0.012 0.966
Tax retention rate 88 0.643 0.096 0.213 0.920
Tension (MFK) 88 3.330 1.460 1.000 5.000
Tension (RUIE) 88 2.170 0.834 1.000 3.000
Territory 88 0.233 0.460 0.000 3.103
Urbanization 88 0.067 0.016 0.019 0.100
Table A3: Description of data
Name Description Period Source
Bargaining power
(RUIE)
Index of bargaining power of the region vis-à-
vis the federation, ranging from 1 to 3, higher
value indicates higher bargaining power
1996 Russian Union of
Industrialist and
Entrepreneurs
Bargaining power
(UI)
Index of bargaining power of the region vis-à-
vis the federal centre, ranging from 1 to 3,
higher values indicate higher bargaining
power. Components of index: violations of
federal law by regional legislation, natural
resources, vote against federal policies at
national elections
1996 Institute of Urban
Economics
Declaration Index of declaration of regional elites in
1991-1995 based on count of events, e.g.
statements of sovereignty of the region,
requests to reallocate powers in the federation
etc. The higher value of index represents a
greater support of decentralisation
1995 Dowley, 1998
Democratisation Index of democratisation of the region,
estimated by the experts of the Carnegie
Centre in Moscow. The higher value of index
represents a higher degree of democratisation
1991-2001 Carnegie Centre and
Independent Institute for
Social Policy
Distance from
Moscow
Distance between the capital of the region and
Moscow, thousands of km, 0 for Moscow and
Moscow oblast, identical for St. Petersburg
and St. Petersburg oblast
n.a. Goskomstat
Distance of the
average income
Absolute value (Average income per capita in
the Russian Federation – Average income per
capita in the region)
1995-1999 Goskomstat
Dummy
autonomous okrug
1 if the region has the status of an
autonomous okrug but Chukotka (which is not
part of any other region), 0 otherwise
n.a. Own estimation
Dummy border
region
1 if the region has a border to any state
outside the Russian Federation, 0 otherwise
n.a. Own estimation
Dummy power
sharing agreement
1 if there was a power sharing agreement in
1999, 0 otherwise
1999 Garant, own estimation
Dummy republic 1 if the region has the status of a republic, 0
otherwise
n.a. Own estimation
Income per capita Average income per capita of the region,
thousands of RUR18
1995-1999 Goskomstat
Net profit Average net profit (profit – loss) of all
region’s organizations, bln. RUR
1995-1999 Goskomstat
Number of
negative
conclusions
Number of acts assesses as contradicting the
federal legislation
2006 Ministry of Justice
18
In 1998 the Russian rubl was denominated; therefore all indicators for previous years were divided by 1000.

38
Name Description Period Source
Oil & gas share Average share of oil extraction in the region
in the total oil extraction in Russia plus share
of the gas extraction in the region to the total
gas extraction in Russia over two
1995-1999 Goskomstat
Population Average population of the region, mln. people 1995-1999 Goskomstat
Power
(Jarocinska)
Index of power of regional governors, based
on data like years in office, share on regional
elections, control of parliament etc. The
higher value of index represents a higher
influence of regional governor.
1995-2000 Jarocinska, 2004
Regional
constitutions
Index of autonomy incorporated in regional
constitutions (see table 1)
1999 Own estimation, based on
data from Garant
Retail trade Average total retail trade revenue (current
prices), bln. RUR
1995-1999 Goskomstat
Share of fiscal
transfers
Average fiscal transfers from other budgets
over total expenditures of the region’s
consolidated budget
1995-2003 Until 1997: Freinkman,
Treisman and Titov, 1999
Since 1998: Ministry of
Finance
Share of negative
conclusions
Number of acts assessed as contradicting the
federal legislation over total number of acts
assessed as either contradicting or conforming
the federal legislation
2006 Ministry of Justice
Share of Russians Share of ethnic Russians in the region’s
population
2002 Russia’s Census, 2002
State capture Index of regulatory capture: residual average
preferential treatment concentration after
controlling for the number of preferential
treatments 1995-2000. The higher value of
index represents a higher degree of capture
2000 Slinko, Yakovlev and
Zhuravskaya, 2005
Tax retention rate Average tax income of the consolidated
regional budget executed over total tax
collection on the territory of the region
1995-1999 Until 1997: Freinkman,
Treisman and Titov, 1999
Since 1998: Ministry of
Finance (for budget data),
State Tax Service and
Goskomstat (for tax
collection data)
Tensions (MFK) Index of tensions between the federal and the
regional governments, ranging from 1 to 5,
higher value indicates higher level of
tensions. Components of index: number of
critical statements of governors against
president, electoral support of the president in
the region and existence of power-sharing
agreement
1997
MFK Renaissance
Tensions (RUIE) Index of tensions between the federal and the
regional government, ranging from 1 to 3,
higher value indicates higher level of tensions
1996 Russian Union of
Industrialist and
Entrepreneurs
Territory Territory of the region, mln. sq.km, 0 for
Moscow and St. Petersburg
n.a. Goskomstat
Urbanization Average share of urban population, % 1995-1999 Goskomstat
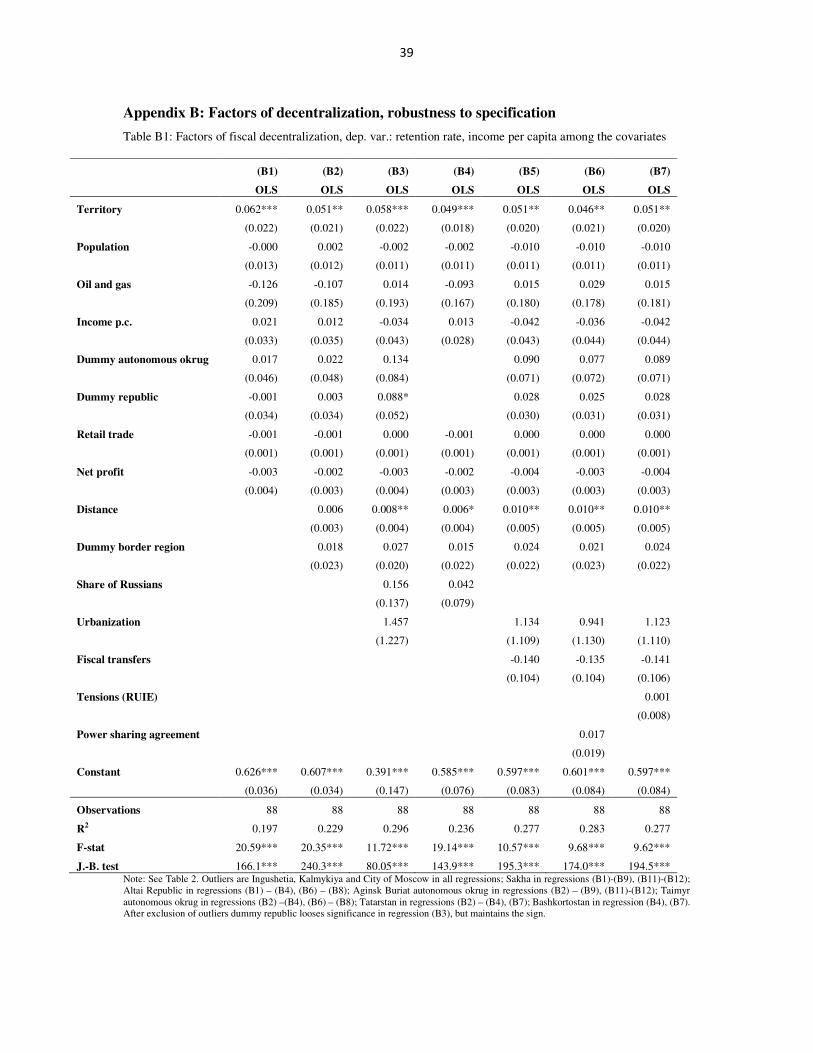
39
Appendix B: Factors of decentralization, robustness to specification
Table B1: Factors of fiscal decentralization, dep. var.: retention rate, income per capita among the covariates
(B1) (B2) (B3) (B4) (B5) (B6) (B7)
OLS OLS OLS OLS OLS OLS OLS
Territory 0.062*** 0.051** 0.058*** 0.049*** 0.051** 0.046** 0.051**
(0.022) (0.021) (0.022) (0.018) (0.020) (0.021) (0.020)
Population -0.000 0.002 -0.002 -0.002 -0.010 -0.010 -0.010
(0.013) (0.012) (0.011) (0.011) (0.011) (0.011) (0.011)
Oil and gas -0.126 -0.107 0.014 -0.093 0.015 0.029 0.015
(0.209) (0.185) (0.193) (0.167) (0.180) (0.178) (0.181)
Income p.c. 0.021 0.012 -0.034 0.013 -0.042 -0.036 -0.042
(0.033) (0.035) (0.043) (0.028) (0.043) (0.044) (0.044)
Dummy autonomous okrug 0.017 0.022 0.134 0.090 0.077 0.089
(0.046) (0.048) (0.084) (0.071) (0.072) (0.071)
Dummy republic -0.001 0.003 0.088* 0.028 0.025 0.028
(0.034) (0.034) (0.052) (0.030) (0.031) (0.031)
Retail trade -0.001 -0.001 0.000 -0.001 0.000 0.000 0.000
(0.001) (0.001) (0.001) (0.001) (0.001) (0.001) (0.001)
Net profit -0.003 -0.002 -0.003 -0.002 -0.004 -0.003 -0.004
(0.004) (0.003) (0.004) (0.003) (0.003) (0.003) (0.003)
Distance 0.006 0.008** 0.006* 0.010** 0.010** 0.010**
(0.003) (0.004) (0.004) (0.005) (0.005) (0.005)
Dummy border region 0.018 0.027 0.015 0.024 0.021 0.024
(0.023) (0.020) (0.022) (0.022) (0.023) (0.022)
Share of Russians 0.156 0.042
(0.137) (0.079)
Urbanization 1.457 1.134 0.941 1.123
(1.227) (1.109) (1.130) (1.110)
Fiscal transfers -0.140 -0.135 -0.141
(0.104) (0.104) (0.106)
Tensions (RUIE) 0.001
(0.008)
Power sharing agreement 0.017
(0.019)
Constant 0.626*** 0.607*** 0.391*** 0.585*** 0.597*** 0.601*** 0.597***
(0.036) (0.034) (0.147) (0.076) (0.083) (0.084) (0.084)
Observations 88 88 88 88 88 88 88
R2 0.197 0.229 0.296 0.236 0.277 0.283 0.277
F-stat 20.59*** 20.35*** 11.72*** 19.14*** 10.57*** 9.68*** 9.62***
J.-B. test 166.1*** 240.3*** 80.05*** 143.9*** 195.3*** 174.0*** 194.5*** Note: See Table 2. Outliers are Ingushetia, Kalmykiya and City of Moscow in all regressions; Sakha in regressions (B1)-(B9), (B11)-(B12);
Altai Republic in regressions (B1) – (B4), (B6) – (B8); Aginsk Buriat autonomous okrug in regressions (B2) – (B9), (B11)-(B12); Taimyr
autonomous okrug in regressions (B2) –(B4), (B6) – (B8); Tatarstan in regressions (B2) – (B4), (B7); Bashkortostan in regression (B4), (B7). After exclusion of outliers dummy republic looses significance in regression (B3), but maintains the sign.
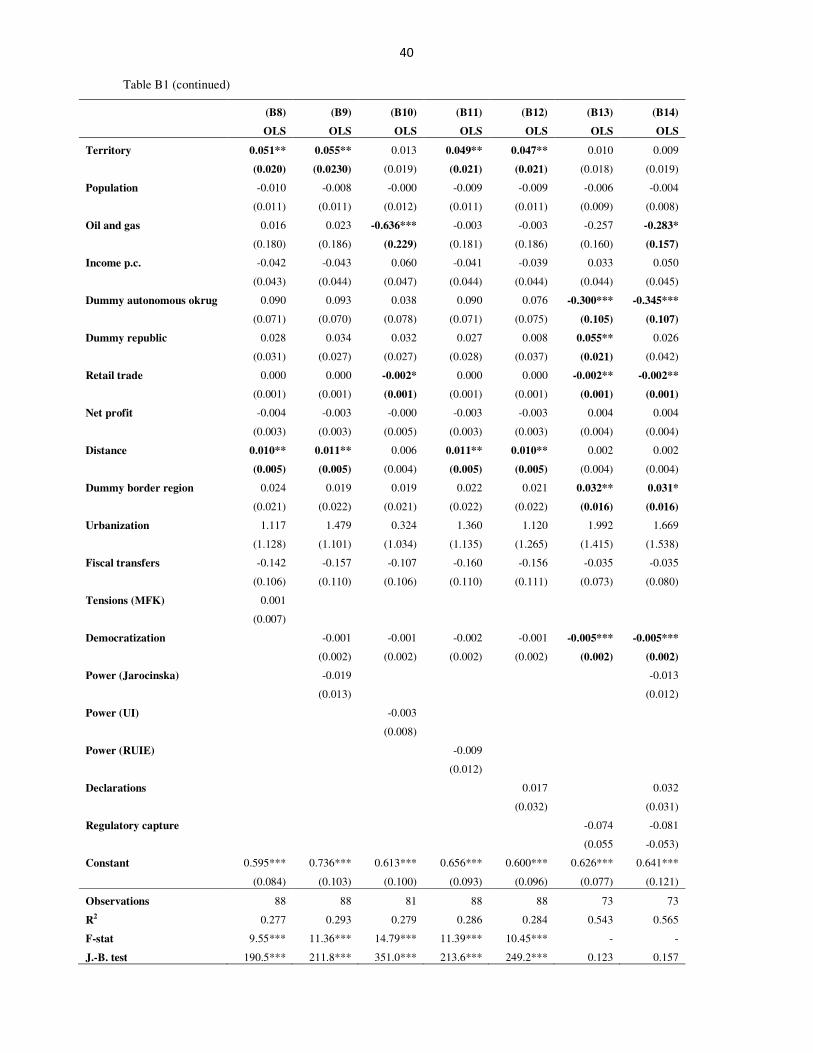
40
Table B1 (continued)
(B8) (B9) (B10) (B11) (B12) (B13) (B14)
OLS OLS OLS OLS OLS OLS OLS
Territory 0.051** 0.055** 0.013 0.049** 0.047** 0.010 0.009
(0.020) (0.0230) (0.019) (0.021) (0.021) (0.018) (0.019)
Population -0.010 -0.008 -0.000 -0.009 -0.009 -0.006 -0.004
(0.011) (0.011) (0.012) (0.011) (0.011) (0.009) (0.008)
Oil and gas 0.016 0.023 -0.636*** -0.003 -0.003 -0.257 -0.283*
(0.180) (0.186) (0.229) (0.181) (0.186) (0.160) (0.157)
Income p.c. -0.042 -0.043 0.060 -0.041 -0.039 0.033 0.050
(0.043) (0.044) (0.047) (0.044) (0.044) (0.044) (0.045)
Dummy autonomous okrug 0.090 0.093 0.038 0.090 0.076 -0.300*** -0.345***
(0.071) (0.070) (0.078) (0.071) (0.075) (0.105) (0.107)
Dummy republic 0.028 0.034 0.032 0.027 0.008 0.055** 0.026
(0.031) (0.027) (0.027) (0.028) (0.037) (0.021) (0.042)
Retail trade 0.000 0.000 -0.002* 0.000 0.000 -0.002** -0.002**
(0.001) (0.001) (0.001) (0.001) (0.001) (0.001) (0.001)
Net profit -0.004 -0.003 -0.000 -0.003 -0.003 0.004 0.004
(0.003) (0.003) (0.005) (0.003) (0.003) (0.004) (0.004)
Distance 0.010** 0.011** 0.006 0.011** 0.010** 0.002 0.002
(0.005) (0.005) (0.004) (0.005) (0.005) (0.004) (0.004)
Dummy border region 0.024 0.019 0.019 0.022 0.021 0.032** 0.031*
(0.021) (0.022) (0.021) (0.022) (0.022) (0.016) (0.016)
Urbanization 1.117 1.479 0.324 1.360 1.120 1.992 1.669
(1.128) (1.101) (1.034) (1.135) (1.265) (1.415) (1.538)
Fiscal transfers -0.142 -0.157 -0.107 -0.160 -0.156 -0.035 -0.035
(0.106) (0.110) (0.106) (0.110) (0.111) (0.073) (0.080)
Tensions (MFK) 0.001
(0.007)
Democratization -0.001 -0.001 -0.002 -0.001 -0.005*** -0.005***
(0.002) (0.002) (0.002) (0.002) (0.002) (0.002)
Power (Jarocinska) -0.019 -0.013
(0.013) (0.012)
Power (UI) -0.003
(0.008)
Power (RUIE) -0.009
(0.012)
Declarations 0.017 0.032
(0.032) (0.031)
Regulatory capture -0.074 -0.081
(0.055 -0.053)
Constant 0.595*** 0.736*** 0.613*** 0.656*** 0.600*** 0.626*** 0.641***
(0.084) (0.103) (0.100) (0.093) (0.096) (0.077) (0.121)
Observations 88 88 81 88 88 73 73
R2 0.277 0.293 0.279 0.286 0.284 0.543 0.565
F-stat 9.55*** 11.36*** 14.79*** 11.39*** 10.45*** - -
J.-B. test 190.5*** 211.8*** 351.0*** 213.6*** 249.2*** 0.123 0.157

41
Table B2: Factors of fiscal decentralization, dep. var.: retention rate, distance from average income per capita
among the covariates
(B15) (B16) (B17) (B18) (B19) (B20) (B21)
OLS OLS OLS OLS OLS OLS OLS
Territory 0.078*** 0.059*** 0.057*** 0.053*** 0.051*** 0.048*** 0.051***
(0.019) (0.018) (0.016) (0.017) (0.017) (0.018) (0.017)
Population -0.008 -0.005 -0.008 -0.008 -0.014 -0.015 -0.014
(0.011) (0.010) (0.010) (0.010) (0.010) (0.010) (0.010)
Oil and gas 0.094 0.114 0.152 0.061 0.159 0.17 0.159
(0.109) (0.113) (0.136) (0.097) (0.132) (0.135) (0.133)
Distance from average
income -0.062* -0.068* -0.093** -0.038* -0.102** -0.098** -0.102**
(0.035) (0.035) (0.042) (0.020) (0.046) (0.045) (0.046)
Dummy autonomous
okrug 0.060 0.060 0.157** 0.123* 0.114* 0.123*
(0.053) (0.052) (0.078) (0.066) (0.065) (0.066)
Dummy republic 0.000 0.006 0.085 0.038 0.035 0.038
(0.034) (0.034) (0.051) (0.027) (0.028) (0.028)
Retail trade 0.001 0.001 0.001 0.000 0.001 0.001 0.001
(0.001) (0.001) (0.001) (0.001) (0.001) (0.001) (0.001)
Net profit -0.004** -0.003* -0.004* -0.002 -0.004** -0.004** -0.004**
(0.002) (0.002) (0.002) (0.002) (0.002) (0.002) (0.002)
Distance from Moscow 0.007** 0.008** 0.008** 0.009** 0.009** 0.009**
(0.003) (0.004) (0.003) (0.004) (0.004) (0.004)
Dummy border region 0.015 0.027 0.008 0.024 0.022 0.024
(0.023) (0.020) (0.023) (0.021) (0.022) (0.021)
Share of Russians 0.124 0.036
(0.130) (0.080)
Urbanization 1.588 1.312 1.204 1.313
(1.008) (1.062) (1.057) (1.060)
Fiscal transfers -0.106 -0.105 -0.106
(0.104) (0.105) (0.106)
Tensions (RUIE) -0.000
(0.008)
Power sharing
agreement 0.012
(0.017)
Constant 0.664*** 0.638*** 0.421*** 0.614*** 0.583*** 0.586*** 0.583***
(0.021) (0.024) (0.137) (0.070) (0.086) (0.087) (0.087)
Observations 88 88 88 88 88 88 88
R2 0.215 0.256 0.333 0.244 0.321 0.324 0.321
F-stat 22.07*** 19.94*** 9.74*** 18.83*** 9.90*** 9.19*** 9.11***
J.-B. test 176.3*** 246.0*** 66.34*** 163.1*** 134.3*** 125.6*** 134.3***
Note: See Table 2. Outliers are Moscow City, Ingushetia, Kalmykiya, Aginsk Buriat autonomous okrug in all regressions;
Altai Republic in (B15)-(B23), (B25)-(B26); Tatarstan in (B15), (B18)-(B19), (B21); Sakha in (B16), (B18)-(B26); Taimyr
in (B16), (B18)-(B23), (B25)-(B26), Bashkortostan in (B21). After exclusion of outliers net profit in (B15) – (B16), (B19)-
(B20), (B22)-(B23), (B25)-(B26) looses significance, but maintains its sign; dummy autonomous region in (B17), (B19)-
(B23), (B25) looses significance, but maintains its sign, urbanization in (B23) looses significance, but maintains its sign.
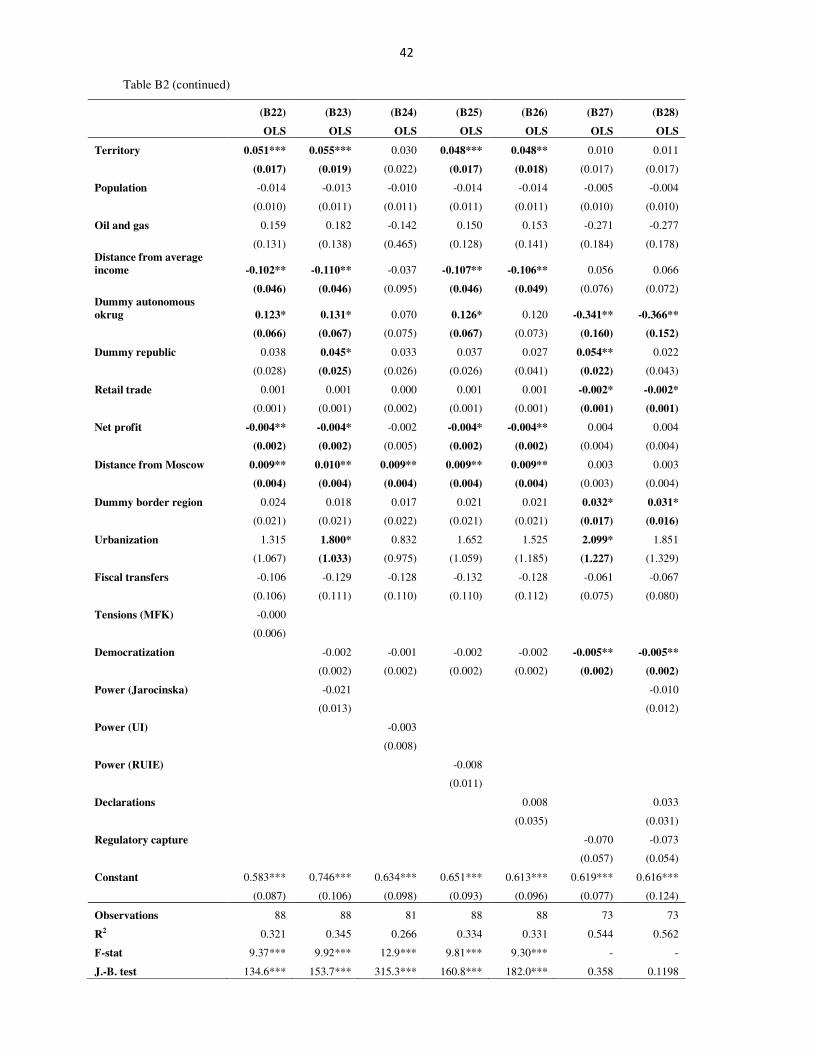
42
Table B2 (continued)
(B22) (B23) (B24) (B25) (B26) (B27) (B28)
OLS OLS OLS OLS OLS OLS OLS
Territory 0.051*** 0.055*** 0.030 0.048*** 0.048** 0.010 0.011
(0.017) (0.019) (0.022) (0.017) (0.018) (0.017) (0.017)
Population -0.014 -0.013 -0.010 -0.014 -0.014 -0.005 -0.004
(0.010) (0.011) (0.011) (0.011) (0.011) (0.010) (0.010)
Oil and gas 0.159 0.182 -0.142 0.150 0.153 -0.271 -0.277
(0.131) (0.138) (0.465) (0.128) (0.141) (0.184) (0.178)
Distance from average
income -0.102** -0.110** -0.037 -0.107** -0.106** 0.056 0.066
(0.046) (0.046) (0.095) (0.046) (0.049) (0.076) (0.072)
Dummy autonomous
okrug 0.123* 0.131* 0.070 0.126* 0.120 -0.341** -0.366**
(0.066) (0.067) (0.075) (0.067) (0.073) (0.160) (0.152)
Dummy republic 0.038 0.045* 0.033 0.037 0.027 0.054** 0.022
(0.028) (0.025) (0.026) (0.026) (0.041) (0.022) (0.043)
Retail trade 0.001 0.001 0.000 0.001 0.001 -0.002* -0.002*
(0.001) (0.001) (0.002) (0.001) (0.001) (0.001) (0.001)
Net profit -0.004** -0.004* -0.002 -0.004* -0.004** 0.004 0.004
(0.002) (0.002) (0.005) (0.002) (0.002) (0.004) (0.004)
Distance from Moscow 0.009** 0.010** 0.009** 0.009** 0.009** 0.003 0.003
(0.004) (0.004) (0.004) (0.004) (0.004) (0.003) (0.004)
Dummy border region 0.024 0.018 0.017 0.021 0.021 0.032* 0.031*
(0.021) (0.021) (0.022) (0.021) (0.021) (0.017) (0.016)
Urbanization 1.315 1.800* 0.832 1.652 1.525 2.099* 1.851
(1.067) (1.033) (0.975) (1.059) (1.185) (1.227) (1.329)
Fiscal transfers -0.106 -0.129 -0.128 -0.132 -0.128 -0.061 -0.067
(0.106) (0.111) (0.110) (0.110) (0.112) (0.075) (0.080)
Tensions (MFK) -0.000
(0.006)
Democratization -0.002 -0.001 -0.002 -0.002 -0.005** -0.005**
(0.002) (0.002) (0.002) (0.002) (0.002) (0.002)
Power (Jarocinska)
-0.021
-0.010
(0.013) (0.012)
Power (UI)
-0.003
(0.008)
Power (RUIE)
-0.008
(0.011)
Declarations
0.008
0.033
(0.035) (0.031)
Regulatory capture
-0.070 -0.073
(0.057) (0.054)
Constant 0.583*** 0.746*** 0.634*** 0.651*** 0.613*** 0.619*** 0.616***
(0.087) (0.106) (0.098) (0.093) (0.096) (0.077) (0.124)
Observations 88 88 81 88 88 73 73
R2 0.321 0.345 0.266 0.334 0.331 0.544 0.562
F-stat 9.37*** 9.92*** 12.9*** 9.81*** 9.30*** - -
J.-B. test 134.6*** 153.7*** 315.3*** 160.8*** 182.0*** 0.358 0.1198

43
Table B3: Factors of regulatory decentralization, dep. var.: share of negative conclusions to all conclusions on
regional acts in the Federal Register, income per capita among the covariates
(B29) (B30) (B31) (B32) (B33) (B34) (B35)
OLS OLS OLS OLS OLS OLS OLS
Territory 0.018* 0.003 0.002 0.002 0.002 0.008 0.003
(0.009) (0.011) (0.011) (0.012) (0.012) (0.011) (0.01)
Population 0.000 0.005 0.005 0.001 0.005 0.007 0.006
(0.003) (0.003) (0.004) (0.004) (0.003) (0.004) (0.003)
Oil and gas -0.006 0.048 0.044 0.036 0.042 0.017 0.05
(0.049) (0.043) (0.041) (0.043) (0.04) (0.041) (0.041)
Income per capita -0.019** -0.028*** -0.019 -0.021** -0.019 -0.023 -0.016
(0.009) (0.010) (0.012) (0.010) (0.012) (0.014) (0.011)
Dummy
autonomous okrug 0.064*** 0.063*** 0.045 0.043* 0.056* 0.045*
(0.019) (0.020) (0.029) (0.025) (0.029) (0.025)
Dummy republic 0.056*** 0.060*** 0.056*** 0.053*** 0.056*** 0.056***
(0.012) (0.011) (0.021) (0.012) (0.011) (0.013)
Distance from
Moscow 0.007** 0.006* 0.006* 0.006* 0.006* 0.007*
(0.003) (0.004) (0.003) (0.004) (0.003) (0.004)
Dummy border
region 0.007 0.006 -0.001 0.006 0.009 0.006
(0.010) (0.010) (0.011) (0.010) (0.010) (0.010)
Share of Russians 0.009 -0.096***
(0.043) (0.023)
Urbanization -0.641 -0.636 -0.426 -0.491
(0.424) (0.472) (0.524) (0.501)
Fiscal transfers -0.003 -0.006 0.01
(0.039) (0.041) (0.036)
Tension (RUIE) -0.011
(0.007)
Power sharing
agreement -0.020
-0.013
Constant 0.096*** 0.077*** 0.108** 0.174*** 0.116*** 0.110*** 0.123***
(0.009) (0.011) (0.052) (0.023) (0.036) (0.038) (0.035)
Observations 88 88 88 88 88 88 88
R2 0.295 0.394 0.407 0.327 0.407 0.432 0.431
F-stat 6.74*** 7.35*** 7.75*** 5.95*** 7.53*** 6.65*** 7.35***
J.-B. test 161.7*** 35.94*** 55.91*** 31.36*** 56.37*** 32.7*** 34.41***
Notes: numbers in parenthesis are standard errors. * significant at 10% level, ** significant at 5% level, ***
significant at 1% level. Robust standard errors applied. Outliers are Primorski krai in all regressions and City of
Moscow in regressions (B29)-(B37) and (B39)-(B40). After exclusion of outliers distance from Moscow in
regressions (B31) (p=0.102), (B37), (B39) (p=0.102); (B40) becomes insignificant but maintains the sign;
dummy autonomous okrug in regression (B39) becomes insignificant (p=0.102) but maintains the sign.
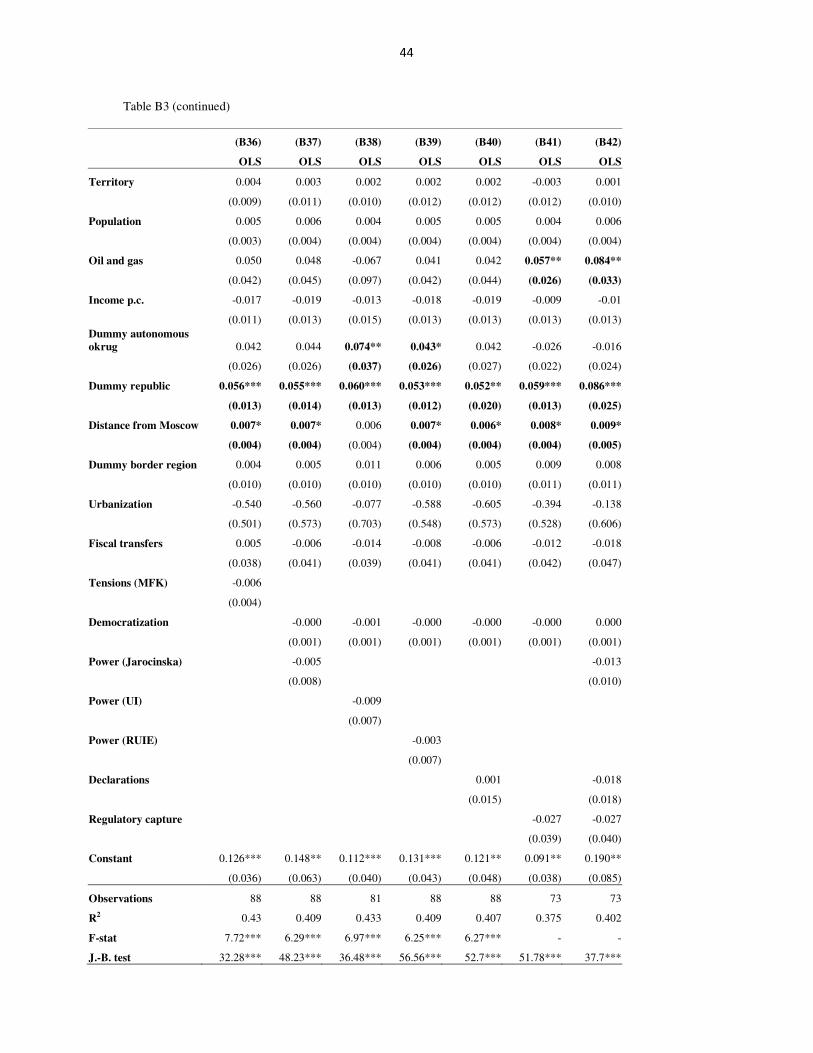
44
Table B3 (continued)
(B36) (B37) (B38) (B39) (B40) (B41) (B42)
OLS OLS OLS OLS OLS OLS OLS
Territory 0.004 0.003 0.002 0.002 0.002 -0.003 0.001
(0.009) (0.011) (0.010) (0.012) (0.012) (0.012) (0.010)
Population 0.005 0.006 0.004 0.005 0.005 0.004 0.006
(0.003) (0.004) (0.004) (0.004) (0.004) (0.004) (0.004)
Oil and gas 0.050 0.048 -0.067 0.041 0.042 0.057** 0.084**
(0.042) (0.045) (0.097) (0.042) (0.044) (0.026) (0.033)
Income p.c. -0.017 -0.019 -0.013 -0.018 -0.019 -0.009 -0.01
(0.011) (0.013) (0.015) (0.013) (0.013) (0.013) (0.013)
Dummy autonomous
okrug 0.042 0.044 0.074** 0.043* 0.042 -0.026 -0.016
(0.026) (0.026) (0.037) (0.026) (0.027) (0.022) (0.024)
Dummy republic 0.056*** 0.055*** 0.060*** 0.053*** 0.052** 0.059*** 0.086***
(0.013) (0.014) (0.013) (0.012) (0.020) (0.013) (0.025)
Distance from Moscow 0.007* 0.007* 0.006 0.007* 0.006* 0.008* 0.009*
(0.004) (0.004) (0.004) (0.004) (0.004) (0.004) (0.005)
Dummy border region 0.004 0.005 0.011 0.006 0.005 0.009 0.008
(0.010) (0.010) (0.010) (0.010) (0.010) (0.011) (0.011)
Urbanization -0.540 -0.560 -0.077 -0.588 -0.605 -0.394 -0.138
(0.501) (0.573) (0.703) (0.548) (0.573) (0.528) (0.606)
Fiscal transfers 0.005 -0.006 -0.014 -0.008 -0.006 -0.012 -0.018
(0.038) (0.041) (0.039) (0.041) (0.041) (0.042) (0.047)
Tensions (MFK) -0.006
(0.004)
Democratization -0.000 -0.001 -0.000 -0.000 -0.000 0.000
(0.001) (0.001) (0.001) (0.001) (0.001) (0.001)
Power (Jarocinska) -0.005 -0.013
(0.008) (0.010)
Power (UI) -0.009
(0.007)
Power (RUIE) -0.003
(0.007)
Declarations 0.001 -0.018
(0.015) (0.018)
Regulatory capture -0.027 -0.027
(0.039) (0.040)
Constant 0.126*** 0.148** 0.112*** 0.131*** 0.121** 0.091** 0.190**
(0.036) (0.063) (0.040) (0.043) (0.048) (0.038) (0.085)
Observations 88 88 81 88 88 73 73
R2 0.43 0.409 0.433 0.409 0.407 0.375 0.402
F-stat 7.72*** 6.29*** 6.97*** 6.25*** 6.27*** - -
J.-B. test 32.28*** 48.23*** 36.48*** 56.56*** 52.7*** 51.78*** 37.7***

45
Table B4: Factors of regulatory decentralization, dep. var.: share of negative conclusions to all conclusions on
regional acts in the Federal Register, distance from average income per capita among the covariates
(B43) (B44) (B45) (B46) (B47) (B48) (B49)
OLS OLS OLS OLS OLS OLS OLS
Territory 0.013 -0.002 -0.001 -0.001 0.000 0.005 0.002
(0.008) (0.012) (0.012) (0.012) (0.012) (0.012) (0.011)
Population -0.000 0.004 0.005 0.000 0.005 0.007 0.006*
(0.003) (0.003) (0.003) (0.003) (0.003) (0.004) (0.003)
Oil and gas -0.004 0.032 0.039 0.024 0.041 0.016 0.051
(0.050) (0.047) (0.037) (0.039) (0.036) (0.037) (0.037)
Distance from
average income -0.023* -0.028** -0.018 -0.022** -0.019 -0.023 -0.017
(0.011) (0.012) (0.012) (0.009) (0.013) (0.014) (0.012)
Dummy
autonomous okrug 0.066*** 0.065*** 0.039 0.039 0.052* 0.043*
(0.019) (0.021) (0.028) (0.025) (0.027) (0.025)
Dummy republic 0.060*** 0.065*** 0.054*** 0.053*** 0.056*** 0.056***
(0.012) (0.011) (0.020) (0.012) (0.011) (0.012)
Distance from
Moscow 0.006* 0.006* 0.005* 0.006* 0.005 0.006*
(0.003) (0.003) (0.003) (0.003) (0.003) (0.003)
Dummy border
region 0.009 0.007 0.001 0.006 0.010 0.007
(0.010) (0.010) (0.011) (0.010) (0.010) (0.010)
Share of Russians 0.001 -0.105***
(0.042) (0.023)
Urbanization -0.829** -0.765* -0.589 -0.588
(0.377) (0.454) (0.485) (0.478)
Fiscal transfers 0.009 0.009 0.021
(0.040) (0.043) (0.038)
Tensions (RUIE) -0.011
(0.007)
Power sharing
agreement -0.019
(0.013)
Constant 0.090*** 0.068*** 0.122** 0.176*** 0.117*** 0.111*** 0.123***
(0.009) (0.01) (0.049) (0.023) (0.037) (0.039) (0.036)
Observations 88 88 88 88 88 88 88
R2 0.290 0.373 0.403 0.317 0.404 0.428 0.430
F-stat 7.47*** 6.98*** 8.14*** 6.04*** 8.10*** 6.86*** 7.72***
J.-B. test 144.2*** 31.36*** 62.2*** 30.75*** 63.15*** 39.89*** 37.79***
Notes: See Table 2. Outliers are City of Moscow for regressions (B43)-(B51) and (B53)-(B54) and Primorski
krai for all regressions. After exclusion of outliers distance from Moscow in regression (B45)-(B47), (B49),
(B50), (B53) looses significance, but maintains the sign; population in regression (B49) looses significance, but
maintains its sign.

46
Table B4 (continued)
(B50) (B51) (B52) (B53) (B54) (B55) (B56)
OLS OLS OLS OLS OLS OLS OLS
Territory 0.002 0.001 0.001 -0.000 -0.000 -0.004 0.001
(0.010) (0.011) (0.011) (0.013) (0.013) (0.012) (0.010)
Population 0.005 0.006 0.004 0.005 0.005 0.004 0.006
(0.003) (0.004) (0.004) (0.004) (0.004) (0.004) (0.005)
Oil and gas 0.052 0.049 -0.07 0.041 0.041 0.055** 0.086**
(0.038) (0.042) (0.107) (0.038) (0.040) (0.025) (0.033)
Distance from average
income -0.019 -0.020 -0.010 -0.019 -0.02 -0.010 -0.014
(0.012) (0.014) (0.016) (0.014) (0.014) (0.014) (0.015)
Dummy autonomous
okrug 0.040 0.041 0.068* 0.040 0.039 -0.025 -0.010
(0.025) (0.026) (0.034) (0.026) (0.028) (0.023) (0.027)
Dummy republic 0.057*** 0.055*** 0.060*** 0.053*** 0.051** 0.059*** 0.087***
(0.013) (0.013) (0.013) (0.012) (0.021) (0.012) (0.025)
Distance from Moscow 0.006* 0.006 0.005 0.006* 0.006 0.007* 0.009**
(0.003) (0.004) (0.004) (0.003) (0.003) (0.004) (0.004)
Dummy border region 0.004 0.005 0.011 0.006 0.006 0.009 0.008
(0.010) (0.010) (0.010) (0.010) (0.010) (0.010) (0.010)
Urbanization -0.630 -0.671 -0.221 -0.702 -0.733 -0.450 -0.153
(0.478) (0.548) (0.654) (0.517) (0.551) (0.493) (0.576)
Fiscal transfers 0.018 0.006 -0.007 0.004 0.006 -0.007 -0.010
(0.039) (0.041) (0.041) (0.041) (0.040) (0.043) (0.046)
Tensions (MFK) -0.006
(0.004)
Democratization -0.000 -0.001 -0.000 -0.000 -0.000 0.000
(0.001) (0.001) (0.001) (0.001) (0.001) (0.001)
Power (Jarocinska) -0.005 -0.013
(0.009)
(0.010)
Power (UI) -0.010
(0.007)
Power (RUIE) -0.003
(0.007)
Declarations 0.002 -0.018
(0.016)
(0.019)
Regulatory capture -0.029 -0.028
(0.039) (0.040)
Constant 0.125*** 0.152** 0.116*** 0.133*** 0.121** 0.093** 0.194**
(0.038) (0.064) (0.040) (0.044) (0.049) (0.038) (0.086)
Observations 88 88 81 88 88 73 73
R2 0.43 0.407 0.43 0.406 0.405 0.374 0.403
F-stat 7.89*** 6.82*** 7.83*** 6.77*** 6.78*** - -
J.-B. test 34.38*** 52.86*** 40.13*** 62.35*** 58.21*** 52.59*** 36.3***
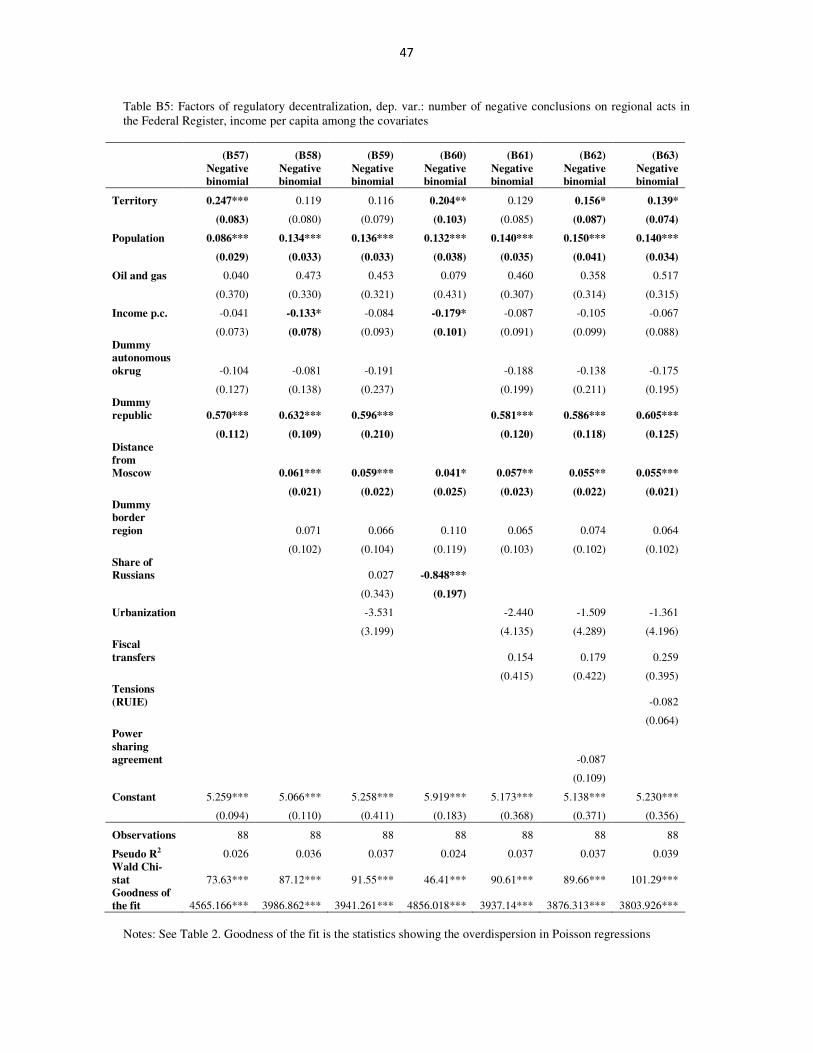
47
Table B5: Factors of regulatory decentralization, dep. var.: number of negative conclusions on regional acts in
the Federal Register, income per capita among the covariates
(B57) (B58) (B59) (B60) (B61) (B62) (B63)
Negative
binomial
Negative
binomial
Negative
binomial
Negative
binomial
Negative
binomial
Negative
binomial
Negative
binomial
Territory 0.247*** 0.119 0.116 0.204** 0.129 0.156* 0.139*
(0.083) (0.080) (0.079) (0.103) (0.085) (0.087) (0.074)
Population 0.086*** 0.134*** 0.136*** 0.132*** 0.140*** 0.150*** 0.140***
(0.029) (0.033) (0.033) (0.038) (0.035) (0.041) (0.034)
Oil and gas 0.040 0.473 0.453 0.079 0.460 0.358 0.517
(0.370) (0.330) (0.321) (0.431) (0.307) (0.314) (0.315)
Income p.c. -0.041 -0.133* -0.084 -0.179* -0.087 -0.105 -0.067
(0.073) (0.078) (0.093) (0.101) (0.091) (0.099) (0.088)
Dummy
autonomous
okrug -0.104 -0.081 -0.191 -0.188 -0.138 -0.175
(0.127) (0.138) (0.237) (0.199) (0.211) (0.195)
Dummy
republic 0.570*** 0.632*** 0.596*** 0.581*** 0.586*** 0.605***
(0.112) (0.109) (0.210) (0.120) (0.118) (0.125)
Distance
from
Moscow 0.061*** 0.059*** 0.041* 0.057** 0.055** 0.055***
(0.021) (0.022) (0.025) (0.023) (0.022) (0.021)
Dummy
border
region 0.071 0.066 0.110 0.065 0.074 0.064
(0.102) (0.104) (0.119) (0.103) (0.102) (0.102)
Share of
Russians 0.027 -0.848***
(0.343) (0.197)
Urbanization -3.531 -2.440 -1.509 -1.361
(3.199) (4.135) (4.289) (4.196)
Fiscal
transfers 0.154 0.179 0.259
(0.415) (0.422) (0.395)
Tensions
(RUIE) -0.082
(0.064)
Power
sharing
agreement -0.087
(0.109)
Constant 5.259*** 5.066*** 5.258*** 5.919*** 5.173*** 5.138*** 5.230***
(0.094) (0.110) (0.411) (0.183) (0.368) (0.371) (0.356)
Observations 88 88 88 88 88 88 88
Pseudo R2 0.026 0.036 0.037 0.024 0.037 0.037 0.039
Wald Chi-
stat 73.63*** 87.12*** 91.55*** 46.41*** 90.61*** 89.66*** 101.29***
Goodness of
the fit 4565.166*** 3986.862*** 3941.261*** 4856.018*** 3937.14*** 3876.313*** 3803.926***
Notes: See Table 2. Goodness of the fit is the statistics showing the overdispersion in Poisson regressions
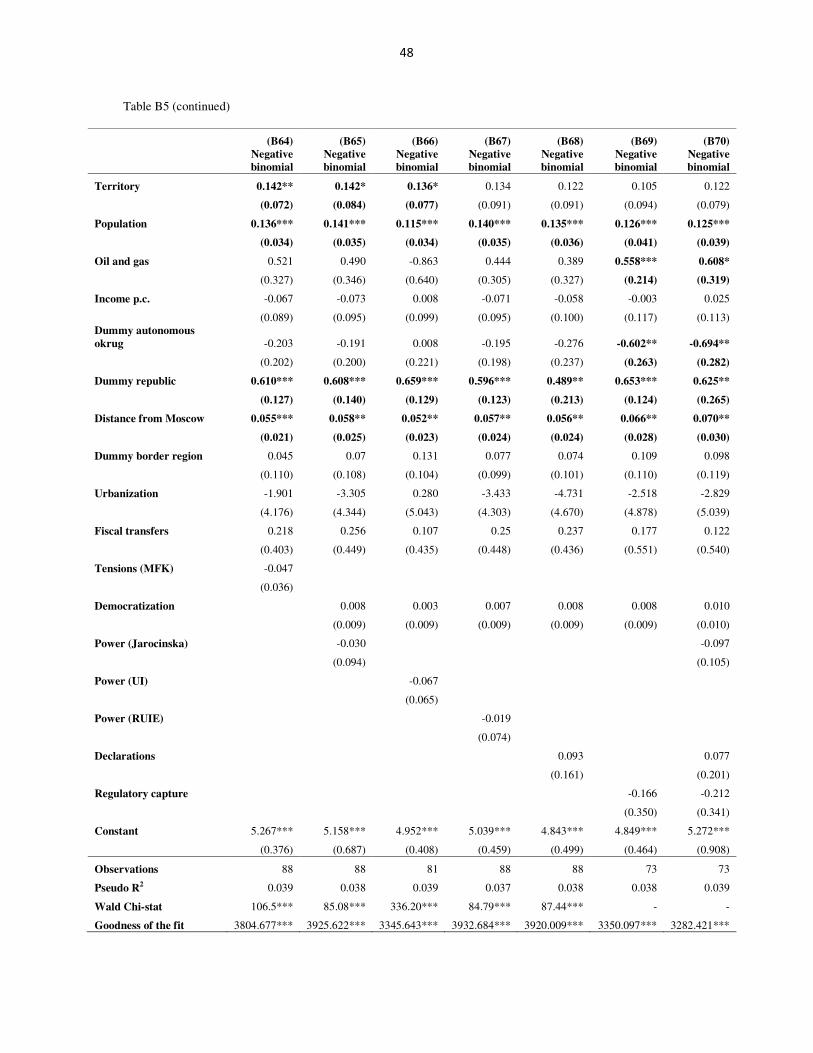
48
Table B5 (continued)
(B64) (B65) (B66) (B67) (B68) (B69) (B70)
Negative
binomial
Negative
binomial
Negative
binomial
Negative
binomial
Negative
binomial
Negative
binomial
Negative
binomial
Territory 0.142** 0.142* 0.136* 0.134 0.122 0.105 0.122
(0.072) (0.084) (0.077) (0.091) (0.091) (0.094) (0.079)
Population 0.136*** 0.141*** 0.115*** 0.140*** 0.135*** 0.126*** 0.125***
(0.034) (0.035) (0.034) (0.035) (0.036) (0.041) (0.039)
Oil and gas 0.521 0.490 -0.863 0.444 0.389 0.558*** 0.608*
(0.327) (0.346) (0.640) (0.305) (0.327) (0.214) (0.319)
Income p.c. -0.067 -0.073 0.008 -0.071 -0.058 -0.003 0.025
(0.089) (0.095) (0.099) (0.095) (0.100) (0.117) (0.113)
Dummy autonomous
okrug -0.203 -0.191 0.008 -0.195 -0.276 -0.602** -0.694**
(0.202) (0.200) (0.221) (0.198) (0.237) (0.263) (0.282)
Dummy republic 0.610*** 0.608*** 0.659*** 0.596*** 0.489** 0.653*** 0.625**
(0.127) (0.140) (0.129) (0.123) (0.213) (0.124) (0.265)
Distance from Moscow 0.055*** 0.058** 0.052** 0.057** 0.056** 0.066** 0.070**
(0.021) (0.025) (0.023) (0.024) (0.024) (0.028) (0.030)
Dummy border region 0.045 0.07 0.131 0.077 0.074 0.109 0.098
(0.110) (0.108) (0.104) (0.099) (0.101) (0.110) (0.119)
Urbanization -1.901 -3.305 0.280 -3.433 -4.731 -2.518 -2.829
(4.176) (4.344) (5.043) (4.303) (4.670) (4.878) (5.039)
Fiscal transfers 0.218 0.256 0.107 0.25 0.237 0.177 0.122
(0.403) (0.449) (0.435) (0.448) (0.436) (0.551) (0.540)
Tensions (MFK) -0.047
(0.036)
Democratization 0.008 0.003 0.007 0.008 0.008 0.010
(0.009) (0.009) (0.009) (0.009) (0.009) (0.010)
Power (Jarocinska) -0.030 -0.097
(0.094)
(0.105)
Power (UI) -0.067
(0.065)
Power (RUIE) -0.019
(0.074)
Declarations 0.093 0.077
(0.161)
(0.201)
Regulatory capture -0.166 -0.212
(0.350) (0.341)
Constant 5.267*** 5.158*** 4.952*** 5.039*** 4.843*** 4.849*** 5.272***
(0.376) (0.687) (0.408) (0.459) (0.499) (0.464) (0.908)
Observations 88 88 81 88 88 73 73
Pseudo R2 0.039 0.038 0.039 0.037 0.038 0.038 0.039
Wald Chi-stat 106.5*** 85.08*** 336.20*** 84.79*** 87.44*** - -
Goodness of the fit 3804.677*** 3925.622*** 3345.643*** 3932.684*** 3920.009*** 3350.097*** 3282.421***

49
Table B6: Factors of regulatory decentralization, dep. var.: number of negative conclusions on regional acts in
the Federal Register, distance from average income per capita among the covariates
(B71) (B72) (B73) (B74) (B75) (B76) (B77)
Negative
binomial
Negative
binomial
Negative
binomial
Negative
binomial
Negative
binomial
Negative
binomial
Negative
binomial
Territory 0.238*** 0.096 0.103 0.175* 0.119 0.143 0.132*
(0.076) (0.08) (0.081) (0.105) (0.086) (0.088) (0.075)
Population 0.087*** 0.124*** 0.133*** 0.128*** 0.140*** 0.149*** 0.140***
(0.029) (0.032) (0.032) (0.035) (0.035) (0.041) (0.034)
Oil and gas 0.066 0.376 0.408 0.049 0.442 0.343 0.514*
(0.359) (0.338) (0.300) (0.397) (0.286) (0.294) (0.299)
Distance from
average income -0.062 -0.111 -0.066 -0.209* -0.082 -0.099 -0.068
(0.096) (0.092) (0.092) (0.110) (0.094) (0.101) (0.093)
Dummy
autonomous
okrug -0.090 -0.087 -0.236 -0.213 -0.169 -0.187
(0.128) (0.147) (0.224) (0.201) (0.207) (0.195)
Dummy republic 0.582*** 0.651*** 0.578*** 0.579*** 0.583*** 0.605***
(0.111) (0.109) (0.205) (0.121) (0.119) (0.126)
Distance 0.056*** 0.056*** 0.036 0.053** 0.051** 0.052***
(0.020) (0.021) (0.023) (0.022) (0.021) (0.020)
Dummy border
region 0.082 0.067 0.115 0.066 0.075 0.065
(0.101) (0.103) (0.112) (0.102) (0.101) (0.102)
Share of
Russians -0.007 -0.938***
(0.339) (0.199)
Urbanization -4.545 -3.175 -2.418 -1.804
(2.814) (4.038) (4.108) (4.101)
Fiscal transfers 0.205 0.239 0.306
(0.429) (0.440) (0.408)
Tensions (RUIE) -0.084
(0.064)
Power sharing
agreement -0.083
(0.108)
Constant 5.247*** 5.027*** 5.332*** 5.950*** 5.185*** 5.153*** 5.233***
(0.090) (0.105) (0.386) (0.186) (0.382) (0.384) (0.366)
Observations 88 88 88 88 88 88 88
Pseudo R2 0.026 0.036 0.037 0.024 0.037 0.037 0.038
Wald Chi-stat 71.21*** 83.57*** 92.76*** 47.43*** 91.28*** 90.15*** 102.04***
Goodness of the
fit 4565.822*** 4015.856*** 3944.694*** 4869.309*** 3939.985*** 3883.001*** 3803.945***
Note: See Table 2

50
Table B6 (continued)
(B78) (B79) (B80) (B81) (B82) (B83) (B84)
Negative
binomial
Negative
binomial
Negative
binomial
Negative
binomial
Negative
binomial
Negative
binomial
Negative
binomial
Territory 0.137* 0.134 0.130* 0.125 0.114 0.092 0.115
(0.072) (0.085) (0.076) (0.093) (0.092) (0.093) (0.076)
Population 0.138*** 0.140*** 0.109*** 0.138*** 0.132*** 0.117*** 0.118***
(0.034) (0.035) (0.035) (0.035) (0.036) (0.042) (0.040)
Oil and gas 0.534* 0.463 -1.113 0.409 0.345 0.506*** 0.563*
(0.314) (0.338) (0.712) (0.294) (0.315) (0.194) (0.320)
Distance from
average income -0.077 -0.059 0.059 -0.055 -0.038 0.066 0.081
(0.094) (0.102) (0.106) (0.103) (0.107) (0.119) (0.115)
Dummy
autonomous
okrug -0.208 -0.218 -0.014 -0.225 -0.313 -0.728*** -0.796***
(0.200) (0.203) (0.209) (0.201) (0.241) (0.260) (0.277)
Dummy
republic 0.612*** 0.605*** 0.655*** 0.592*** 0.475** 0.646*** 0.607**
(0.129) (0.141) (0.129) (0.123) (0.216) (0.124) (0.267)
Distance from
Moscow 0.053*** 0.055** 0.052** 0.054** 0.054** 0.067** 0.072**
(0.020) (0.024) (0.022) (0.022) (0.022) (0.028) (0.030)
Dummy border
region 0.045 0.072 0.134 0.079 0.076 0.112 0.100
(0.109) (0.107) (0.104) (0.099) (0.100) (0.109) (0.119)
Urbanization -2.213 -4.037 -0.244 -4.197 -5.554 -3.501 -3.498
(4.068) (4.238) (4.765) (4.183) (4.500) (4.638) (4.691)
Fiscal transfers 0.274 0.286 0.048 0.277 0.253 0.093 0.048
(0.416) (0.455) (0.452) (0.453) (0.441) (0.570) (0.548)
Tensions (MFK) -0.049
(0.036)
Democratization 0.008 0.004 0.007 0.008 0.009 0.011
(0.009) (0.010) (0.009) (0.009) (0.009) (0.010)
Power
(Jarocinska) -0.032 -0.095
(0.095) (0.104)
Power (UI) -0.068
(0.065)
Power (RUIE) -0.020
(0.075)
Declarations 0.102 0.088
(0.163) (0.202)
Regulatory
capture
-0.170 -0.212
(0.350) (0.339)
Constant 5.262*** 5.194*** 4.983*** 5.069*** 4.855*** 4.902*** 5.278***
(0.383) (0.695) (0.408) (0.470) (0.504) (0.461) (0.895)
Observations 88 88 81 88 88 73 73
Pseudo R2 0.039 0.037 0.039 0.037 0.038 0.038 0.039
Wald Chi-stat 107.46*** 85.65*** 351.77*** 85.04*** 87.71*** - -
Goodness of the
fit 3805.283*** 3927.816*** 3333.526*** 3934.713*** 3919.845*** 3342.792*** 3279.356***
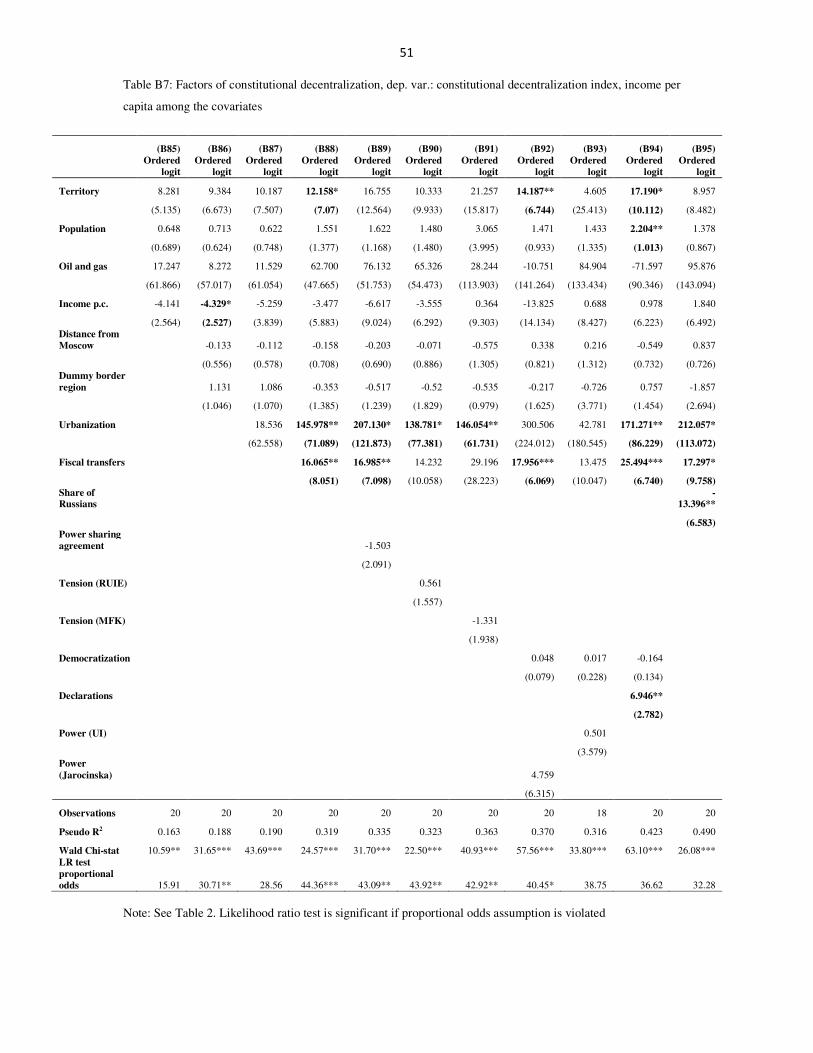
51
Table B7: Factors of constitutional decentralization, dep. var.: constitutional decentralization index, income per
capita among the covariates
(B85) (B86) (B87) (B88) (B89) (B90) (B91) (B92) (B93) (B94) (B95)
Ordered
logit
Ordered
logit
Ordered
logit
Ordered
logit
Ordered
logit
Ordered
logit
Ordered
logit
Ordered
logit
Ordered
logit
Ordered
logit
Ordered
logit
Territory 8.281 9.384 10.187 12.158* 16.755 10.333 21.257 14.187** 4.605 17.190* 8.957
(5.135) (6.673) (7.507) (7.07) (12.564) (9.933) (15.817) (6.744) (25.413) (10.112) (8.482)
Population 0.648 0.713 0.622 1.551 1.622 1.480 3.065 1.471 1.433 2.204** 1.378
(0.689) (0.624) (0.748) (1.377) (1.168) (1.480) (3.995) (0.933) (1.335) (1.013) (0.867)
Oil and gas 17.247 8.272 11.529 62.700 76.132 65.326 28.244 -10.751 84.904 -71.597 95.876
(61.866) (57.017) (61.054) (47.665) (51.753) (54.473) (113.903) (141.264) (133.434) (90.346) (143.094)
Income p.c. -4.141 -4.329* -5.259 -3.477 -6.617 -3.555 0.364 -13.825 0.688 0.978 1.840
(2.564) (2.527) (3.839) (5.883) (9.024) (6.292) (9.303) (14.134) (8.427) (6.223) (6.492)
Distance from
Moscow -0.133 -0.112 -0.158 -0.203 -0.071 -0.575 0.338 0.216 -0.549 0.837
(0.556) (0.578) (0.708) (0.690) (0.886) (1.305) (0.821) (1.312) (0.732) (0.726)
Dummy border
region 1.131 1.086 -0.353 -0.517 -0.52 -0.535 -0.217 -0.726 0.757 -1.857
(1.046) (1.070) (1.385) (1.239) (1.829) (0.979) (1.625) (3.771) (1.454) (2.694)
Urbanization 18.536 145.978** 207.130* 138.781* 146.054** 300.506 42.781 171.271** 212.057*
(62.558) (71.089) (121.873) (77.381) (61.731) (224.012) (180.545) (86.229) (113.072)
Fiscal transfers 16.065** 16.985** 14.232 29.196 17.956*** 13.475 25.494*** 17.297*
(8.051) (7.098) (10.058) (28.223) (6.069) (10.047) (6.740) (9.758)
Share of
Russians -
13.396**
(6.583)
Power sharing
agreement -1.503
(2.091)
Tension (RUIE) 0.561
(1.557)
Tension (MFK) -1.331
(1.938)
Democratization 0.048 0.017 -0.164
(0.079) (0.228) (0.134)
Declarations 6.946**
(2.782)
Power (UI) 0.501
(3.579)
Power
(Jarocinska) 4.759
(6.315)
Observations 20 20 20 20 20 20 20 20 18 20 20
Pseudo R2 0.163 0.188 0.190 0.319 0.335 0.323 0.363 0.370 0.316 0.423 0.490
Wald Chi-stat 10.59** 31.65*** 43.69*** 24.57*** 31.70*** 22.50*** 40.93*** 57.56*** 33.80*** 63.10*** 26.08***
LR test
proportional
odds 15.91 30.71** 28.56 44.36*** 43.09** 43.92** 42.92** 40.45* 38.75 36.62 32.28
Note: See Table 2. Likelihood ratio test is significant if proportional odds assumption is violated
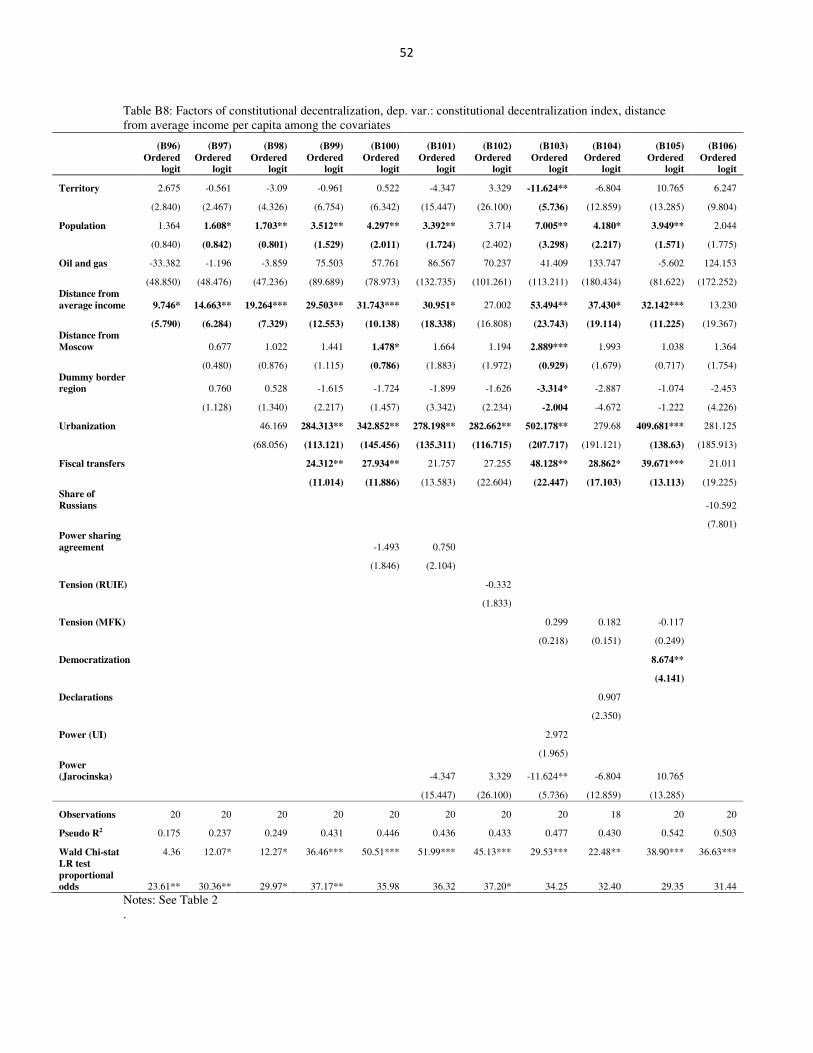
52
Table B8: Factors of constitutional decentralization, dep. var.: constitutional decentralization index, distance
from average income per capita among the covariates
(B96) (B97) (B98) (B99) (B100) (B101) (B102) (B103) (B104) (B105) (B106)
Ordered
logit
Ordered
logit
Ordered
logit
Ordered
logit
Ordered
logit
Ordered
logit
Ordered
logit
Ordered
logit
Ordered
logit
Ordered
logit
Ordered
logit
Territory 2.675 -0.561 -3.09 -0.961 0.522 -4.347 3.329 -11.624** -6.804 10.765 6.247
(2.840) (2.467) (4.326) (6.754) (6.342) (15.447) (26.100) (5.736) (12.859) (13.285) (9.804)
Population 1.364 1.608* 1.703** 3.512** 4.297** 3.392** 3.714 7.005** 4.180* 3.949** 2.044
(0.840) (0.842) (0.801) (1.529) (2.011) (1.724) (2.402) (3.298) (2.217) (1.571) (1.775)
Oil and gas -33.382 -1.196 -3.859 75.503 57.761 86.567 70.237 41.409 133.747 -5.602 124.153
(48.850) (48.476) (47.236) (89.689) (78.973) (132.735) (101.261) (113.211) (180.434) (81.622) (172.252)
Distance from
average income 9.746* 14.663** 19.264*** 29.503** 31.743*** 30.951* 27.002 53.494** 37.430* 32.142*** 13.230
(5.790) (6.284) (7.329) (12.553) (10.138) (18.338) (16.808) (23.743) (19.114) (11.225) (19.367)
Distance from
Moscow 0.677 1.022 1.441 1.478* 1.664 1.194 2.889*** 1.993 1.038 1.364
(0.480) (0.876) (1.115) (0.786) (1.883) (1.972) (0.929) (1.679) (0.717) (1.754)
Dummy border
region 0.760 0.528 -1.615 -1.724 -1.899 -1.626 -3.314* -2.887 -1.074 -2.453
(1.128) (1.340) (2.217) (1.457) (3.342) (2.234) -2.004 -4.672 -1.222 (4.226)
Urbanization 46.169 284.313** 342.852** 278.198** 282.662** 502.178** 279.68 409.681*** 281.125
(68.056) (113.121) (145.456) (135.311) (116.715) (207.717) (191.121) (138.63) (185.913)
Fiscal transfers 24.312** 27.934** 21.757 27.255 48.128** 28.862* 39.671*** 21.011
(11.014) (11.886) (13.583) (22.604) (22.447) (17.103) (13.113) (19.225)
Share of
Russians -10.592
(7.801)
Power sharing
agreement -1.493 0.750
(1.846) (2.104)
Tension (RUIE) -0.332
(1.833)
Tension (MFK) 0.299 0.182 -0.117
(0.218) (0.151) (0.249)
Democratization 8.674**
(4.141)
Declarations 0.907
(2.350)
Power (UI) 2.972
(1.965)
Power
(Jarocinska) -4.347 3.329 -11.624** -6.804 10.765
(15.447) (26.100) (5.736) (12.859) (13.285)
Observations 20 20 20 20 20 20 20 20 18 20 20
Pseudo R2 0.175 0.237 0.249 0.431 0.446 0.436 0.433 0.477 0.430 0.542 0.503
Wald Chi-stat 4.36 12.07* 12.27* 36.46*** 50.51*** 51.99*** 45.13*** 29.53*** 22.48** 38.90*** 36.63***
LR test
proportional
odds 23.61** 30.36** 29.97* 37.17** 35.98 36.32 37.20* 34.25 32.40 29.35 31.44
Notes: See Table 2
.