Embed Size (px)
Citation preview

MPRAMunich Personal RePEc Archive
The influence of stress and satisfactionon productivity
George Halkos
University of Thessaly, Department of Economics
February 2008
Online at http://mpra.ub.uni-muenchen.de/39654/MPRA Paper No. 39654, posted 25. June 2012 18:51 UTC

1
The influence of stress and satisfaction
on productivity
George Emm. Halkos and Dimitrios Bousinakis
University of Thessaly, Department of Economics,
Korai 43, 38333, Volos, Greece
Abstract
In this study, using a random sample of 425 employees in the private and public sector,
we investigate the effects of stress and job satisfaction on the functioning of a company.
Our attention is focused on factors that affect stress and job satisfaction like the number
of work hours, good relations between management and employees, good function of the
group and work related to employees’ area of education. Factor Analysis is used first in
order to identify the responsible factors for the correlation among a large number of
qualitative and quantitative variables and their influence on productivity. The extracted
factors showed us that productivity is an element affected by the two qualitative factors,
stress and satisfaction. Increased stress leads to reduced productivity and increased
satisfaction leads to increased productivity. Logistic Regression is used next presenting
us with a lot of useful elements concerning the function of stress, satisfaction and
supportive elements on productivity.
Keywords: Stress; satisfaction; productivity.
JEL classification codes: J01, J08, J81, M12, M50.
2
1. Introduction
Two important problems that modern organizations are faced with are stress and
job satisfaction of their employees. At a first look we could deduce that these two
problems are not correlated. But if we look at these issues in depth we see that one
affects the other and if both function well it could lead to positive results for employees’
work and organization.
Stress can be considered as an unpleasant emotional situation that we experience
when requirements (work-related or not) cannot be counter-balanced with our ability to
resolve them. This results in emotional changes as a reaction to this danger. It stems
from the relationship between a person and its environment and it appears as pressure that
is subjective because the same stressors can affect one person but not another. When an
employee can manage the pressures of the job and the possibility to complete a task is
substantial then stress can work as a motivating factor.
Satisfaction is a regulating factor for stress. Theories during the neo-classical
period (1920-1950) supported that employee satisfaction directly affects productivity.
They believed that there existed a cause-effect relationship between satisfaction and
productivity. This was the reason why organizations used various means in order to
increase employee productivity and thus increase productivity.
There is no doubt that in many cases productivity has to do with factors which are
external to the person, but affect performance (e.g. the performance of a salesperson is
closely linked with market mobility, despite the persuasion dynamics he/she may
possess). In many cases, also, work performance of an individual is directly linked to the

3
performance of other employees in the same space, so the individual cannot set his/her
own standards, especially if there are some informal social rules.
It is believed that job satisfaction is directly correlated with the mental health of
the workforce and the organizations’ interest in high productivity and a stable, permanent
workforce. Stress on the other hand is the main cause of problems not only in persons’
professional but also in their personal lives. It can also create physical and psychosomatic
symptoms. A stress-filled employee makes wrong decisions and has negative
relationships with coworkers. Both these elements can bear a negative outcome in the
productivity of a group thus creating an added cost to a company. Reduced productivity,
mistakes, low quality work, absenteeism are signs of a stressed employee.
On the other hand a satisfied employee is a vital prerequisite for a healthy
company. Work related stress is a vital factor to job satisfaction. When it functions as a
motivator then it results in creativity and satisfaction and consequently dissolves
boredom and mundane. When stress functions as a negative factor it results to aggression
and in low job satisfaction. Job satisfaction can lead to prevention of stressors though job
incentives.
In this study our effort focuses on the investigation and analysis of the effect of
the quality factors of stress and satisfaction on productivity. Using two-stage cluster
sampling and a random sample of 425 employees in the private and public sector we
extract two factors representing stress and job satisfaction and we investigate their effects
on the functioning of a company and/or organizations. We focus our attention on
creativity, group activity and independent work, factors that affect stress and job
satisfaction. Here, the state of stress is a result of the interaction of the environment’s
4
demands with the personal characteristics. Specifically, factors affecting creativity and
productivity are the number of work hours, good relations between management and
employees, good function of the group and work related to employees’ area of education.
Independent work increases job satisfaction and productivity of a person. It works as
reducing stress.
The structure of the paper is the following. Section 2 reviews the existing relative
literature. Section 3 presents the sampling framework and the adopted methodologies for
the analysis of the data collected. Next the empirical results derived are presented and
discussed. The last section concludes the paper and comments on the policy implications
of our empirical findings.
2. Existing studies in the literature
Many attempts have been made to interpret and define stress. The first theory on
stress belongs to Freud (1978), who considered stress as the result of reduced discharge
of libidinal energy, either due to external obstacles or due to internal ones. In the 1960s,
the cognitive approach to the personality was created, which considers that stress is
created when the individual is not capable or believes that he/she is not capable of
meeting the demands of a certain situation, and that these situations are a threat to the
individual’s health.
Aldwin (1994) considers that stress refers to the experience created as a result of
the interaction of the individual and the work environment. This interaction may lead to
psychological and physiological tension. Selye (1964) defines stress as the natural
degeneration of the body and as the non-specific response of the body to any demand

5
placed upon it. He himself recognised the meaning of positive stress, which not only
does not cause degeneration and malfunctions, but can also act as a productive factor and
as a factor of development and creation.
Karasek (1979) proposed a theoretical model, where the basic factors that cause
stress to the employee are three:
a. The work or project the employee is called to put into effect in itself.
b. The limits of initiative taken by the employee, the independence and the
margins of control he/she has in the job.
c. Social relations with seniors, colleagues and subordinates.
The existence of just one of these three factors is not enough to create stress. All three
together, however, definitely affect the employee.
Warr (1990) considers that each of Karasek’s work factors must exist at an
appropriate analogy so as not to create stress. As stressful as not having much initiative
margin may be, extremely large margins are equally stressful. According to Warr, the
basic factors burdening stress are decision-making and the development of knowledge,
abilities and experiences, satisfactory remuneration, working duties that are interesting
and varied, precise roles, physical safety, tangible targets, social recognition and the
potential for interpersonal communication.
According to Siegrist (1996), there must be a balance between what employees
“invest” in the job and what they get back. In opposite cases, they feel oppressed and
dissatisfied. The term effort contains two dimensions, exogenous and endogenous. The
former concerns the effort that the employees make in order to fulfil their working duties,
while the latter concerns the internal motives that urge them to perform (e.g. the need for

6
social recognition, etc.). As reciprocation, employees get financial remuneration from the
job, the potential to sustain or upgrade their working position, expectation satisfaction,
security etc.
There are many theories that have dealt with satisfaction; some of them are in the
same lines while others differ greatly from each other. Initially, Maslow (1954) supported
the anthropocentric function of organisations, with the existence of a hierarchy of various
need forms. Initially we have physiological needs, which are clearly biological, such as
food, clothing, accommodation etc. These constitute the base for the individual to move
on to the satisfaction of psychological needs. When physical needs are satisfied, then the
needs of safety or certainty arise. These include the need for stability, protection from
dangers, and provision for the future.
A number of researchers have found a connection between intention to leave
one’s job and job dissatisfaction (Heslop et al, 2002; Brief and Weiss, 2002; Clugston,
2000). Halpern (1999) claims that employee turnover caused by job dissatisfaction has
caused company costs in terms of recruitment, selection and training new employees.
Researchers have also studied job satisfaction in a wide range of professions like
industrial teacher educators (Brewer and McMahan-Landers, 2003 a,b), teachers (Bogler,
2002), physicians (Bergus et al., 2001), customer service employees (Carless, 2004),
student support personnel (Brewer and Clippard, 2002), youth development organizations
(Petty et al., 2005) and management of healthcare workforce (Labiris et al., 2008).
When safety needs are satisfied, then social needs arise. As a social being, the
individual needs to belong in groups, to have loving relationships with other individuals,
friendships, etc. Estimation needs constitute a development of social needs, because here

7
the individual does not only desire to belong to a group, but also to be recognised,
appreciated and respected by others. The satisfaction of these needs creates self-
confidence, power and prestige. Finally, there is the need for self-realisation that is the
need for maximising potential towards higher forms of action. The desire is to become
what somebody can become, and this state, of completion, is reached by few people.
Alderfer (1972) amended Maslow's theory and supported that if for some reason
the individual cannot satisfy his/her needs on a higher level, then he/she returns to the
needs of a lower level that are already satisfied. Through his ERG theory (Existence,
Relatedness, and Growth), Alberfer sorted the needs into three categories:
α) Existence (here we find Maslow's physical and safety needs),
β) Relatedness (Maslow's social needs),
γ) Growth (Marlow's estimation and self-realisation needs).
Finally we must mention Herzberg's (1966) theory in passing, as we believe that it
constituted the base for the development of several theories. In Herzberg's theory we find
two different kinds of factors, motivators and hygiene factors, which are related to work
satisfaction. According to Herzberg, positive stances towards work which lead to
satisfaction are related to the work content, e.g. achievement, recognition, responsibility,
development potential, and the nature of the work. These factors were named motivators
as they contribute to the urging of the individual towards greater performance and effort.
On the other hand, negative stances that lead to dissatisfaction are connected to
the framework of the organisation, such as management, supervision, remuneration,
interpersonal relationships. These factors were named hygiene factors, as they contribute

8
to the prevention of work dissatisfaction, while their effect on the creation of positive
feelings is very limited.
With reference to the relationship of satisfaction with productivity and based on
the assumption that there is a relationship, Porter and Lawler (1986) created a model in
order to examine the matter of activation. The model is based on the assumption that
rewards create satisfaction and that some times performance leads to remuneration of
various kinds, which create satisfaction in workers. Thus, productivity is related to
satisfaction through the notion of rewards and therefore comes into contrast with the neo-
classical approach, which considered satisfaction a cause and prerequisite for good
performance. There are many factors that lead to the view that the satisfied worker is not
necessarily a productive one.
Locke (1976) considers that the relationship between satisfaction and productivity
is reciprocal. It is not, thus, satisfaction that leads to productivity, but productivity that
leads to satisfaction. Then, satisfaction affects productivity mainly in an indirect way,
creating a feeling of dedication towards the organisation and its targets. Beyond this
relationship of productivity-satisfaction-productivity, it is possible to have a secondary
increase of satisfaction, provided that productivity results in the increase of other
remunerations related to work (promotion, authority, bonus, etc) that contribute to the
increase of satisfaction.
Finally, with the development of new technologies and the globalization of
economic growth a number of changes in the labour market have been experienced with
either relatively advantaged and stable employment or uncertain employment
characterized by volatility and low salaries (Ferrie et al., 1999; Paoli, 1997). Structural

9
unemployment, underemployment and early retirements have increased and continue to
increase leading to increased stress, job insecurity and lower job satisfaction.
3. Data and proposed methodologies
3.1 The questionnaire
In our study, apart from stress and satisfaction levels that interest us, we made an
effort to collect information concerning the parameters related to these elements, either
separately or as a whole. AA nnuummbbeerr ooff vvaarriiaabblleess wweerree ccoonnssiiddeerreedd ssuucchh aass tthhee ssoocciioo--
eeccoonnoommiicc ((aaggee,, mmaarriittaall ssttaattuuss,, iinnccoommee,, sseexx)) aanndd ootthheerr qquuaalliittaattiivvee ((tthhaatt ggiivvee nnoonn--nnuummeerriiccaall
iinnffoorrmmaattiioonn)) vvaarriiaabblleess lliikkee ““ccrreeaattiivviittyy wwiitthhiinn tthhee oorrggaanniizzaattiioonn””,, ““llaabboouurr aaccccoouunnttaabbiilliittyy””,,
““hhiigghheerr rreewwaarrddss”” aanndd tthhee lleevveell ooff eedduuccaattiioonn..
Relying on the existing literature a new questionnaire was developed and was first
tried in 20 employees (around 5% of the final sample). A number of modifications were
made before the final version. Testing the reliability of our instrument a Cronbach Alpha
coefficient of 0.92 was estimated. This coefficient shows how all the statements of the
questionnaire relate to one another in content.
The data collection was performed in a month time and solely by means of
personal interviews. Participants replied to a number of statements using a 5-point Likert
scale with 1 corresponding to “very little” and 5 to very much”. In case of negative
statements we had to reverse the scores with the value of 1 corresponding to “very much”
and the value of 5 corresponding to “very little”. TThhee oonneess tthhaatt aannsswweerreedd aatt tthhee eexxttrreemmee
eennddss ((¨̈vveerryy lliittttllee¨̈ oorr ¨̈lliittttllee¨̈)) sseeeemm nnoott ttoo ccoonnssiiddeerr iimmppoorrttaanntt tthhee eeffffeecctt ooff cchhaannggeess oonn
pprroodduuccttiivviittyy,, wwhheerreeaass tthhee oonneess tthhaatt aannsswweerreedd ¨̈nnoott mmuucchh´́,, ¨̈vveerryy´́ aanndd ¨̈vveerryy mmuucchh¨̈ sseeeemm ttoo

10
ccoonnssiiddeerr tthhee eeffffeecctt aass iimmppoorrttaanntt.. TThhee oonneess tthhaatt ddiidd nnoott rreeppllyy wweerree eexxcclluuddeedd ffrroomm tthhee
aannaallyyssiiss ooff tthhee ssaammppllee..
3.2 The adopted methodology
In order to analyse the relationship between stress, satisfaction and productivity,
we performed a study on a random sample of 425 individuals. The population of our
study consists of employees working in private enterprises and public organisations from
throughout the country (excluding non-profit organizations). A list of all companies
operating in Greece was provided by ICAP and this list was our sampling frame. The
entire population was used in order the sample to be representative, random and as large
as possible (Gay and Airasian, 2003).
Specifically, our sample initially contained primary units and then through them
secondary units was selected. Our work was based on the method of two-stage cluster
sampling and not on a single stage sampling, such as random, systematic or stratified.
Cluster sampling requires the division of the population into groups of elements/clusters
in such a way as each element to belong to one and only one cluster. We preferred cluster
sampling instead of stratified as the former tends to provide better results when the
elements within the cluster are heterogeneous. We have adopted a two stage cluster
sampling and developed first a frame consisting of all employees in private and public
sectors in middle and high positions. We have selected first with the use of random
numbers a random sample of 94 companies and then a random sample from each of the
94 sampled clusters.
11
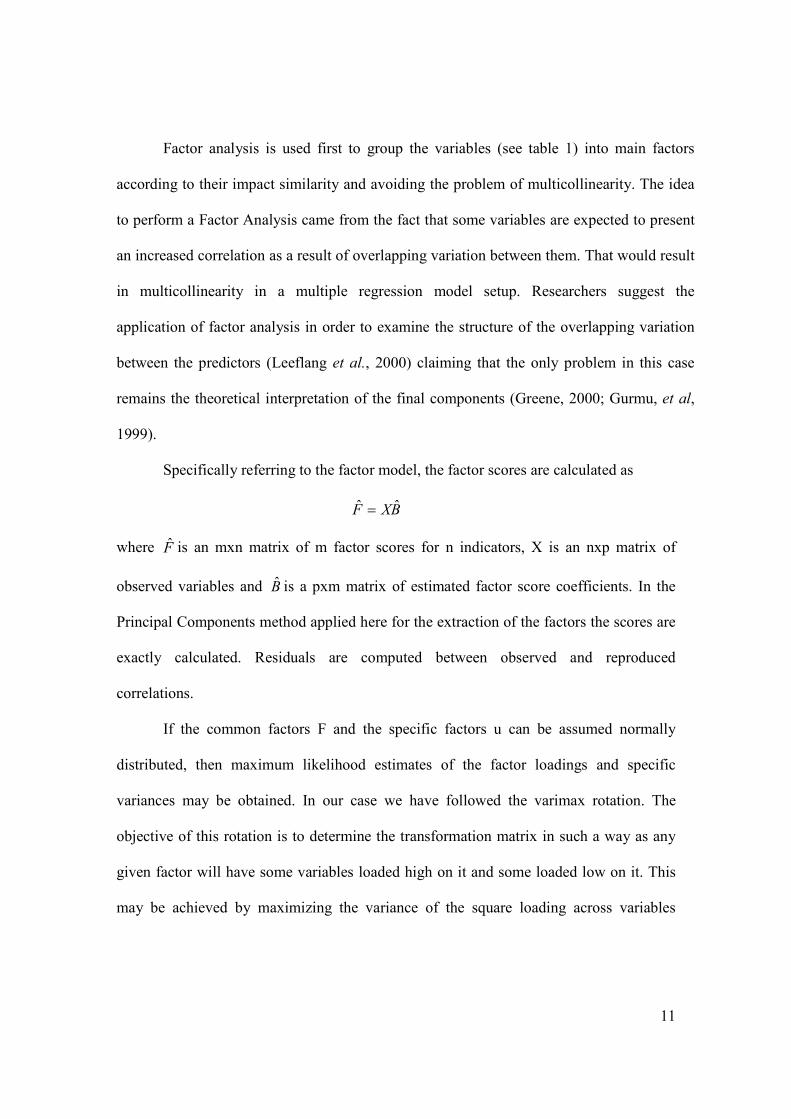
Factor analysis is used first to group the variables (see table 1) into main factors
according to their impact similarity and avoiding the problem of multicollinearity. The idea
to perform a Factor Analysis came from the fact that some variables are expected to present
an increased correlation as a result of overlapping variation between them. That would result
in multicollinearity in a multiple regression model setup. Researchers suggest the
application of factor analysis in order to examine the structure of the overlapping variation
between the predictors (Leeflang et al., 2000) claiming that the only problem in this case
remains the theoretical interpretation of the final components (Greene, 2000; Gurmu, et al,
1999).
Specifically referring to the factor model, the factor scores are calculated as
BXF ˆˆ =
where F̂ is an mxn matrix of m factor scores for n indicators, X is an nxp matrix of
observed variables and B̂ is a pxm matrix of estimated factor score coefficients. In the
Principal Components method applied here for the extraction of the factors the scores are
exactly calculated. Residuals are computed between observed and reproduced
correlations.
If the common factors F and the specific factors u can be assumed normally
distributed, then maximum likelihood estimates of the factor loadings and specific
variances may be obtained. In our case we have followed the varimax rotation. The
objective of this rotation is to determine the transformation matrix in such a way as any
given factor will have some variables loaded high on it and some loaded low on it. This
may be achieved by maximizing the variance of the square loading across variables

12
subject to the constraint that the communalities of each variable remain the same
(Johnson and Wichern, 1998; Sharma, 1996).
Next a regression analysis between the dependent variable and extracted factors is
performed. This is not new. Dunteman (1989) also suggests this process to cope with
multicollinearity in a regression analysis model and it is also an indicated way to
minimize the number of independent variables and maximize the degrees of freedom.
After presenting the basic variables and the corresponding answers of the
interviewees, we will proceed with the sampling of the effect of changes to productivity
based on those variables. More specifically as a dependent variable will use the effect of
stress and satisfaction to productivity. As independent variables were considered the
socio-economic as well as various other qualitative variables mentioned above. Various
dummy variables were constructed in relation to the ranking within the organization
(employee, supervisor, manager) as well as the impact on productivity based on different
age groups. Those variables were used in a logistic regression.
The method was preferred from the multiple regression as the dependent variable
is dichotomous and discontinued. Additionally the logistic regression is the more
appropriate monotonic function for the sample of gathered data compared to the criterion
of least squares of a multiple regression. Also the logistic regression was preferred from a
discriminant analysis since the latter is based on the hypothesis of the multivariate
normality and the equal variance-covariance matrices across teams. Those hypotheses are
not required in the logistic regression1.
11 FFoorr mmoorree ddeettaaiillss aabboouutt aapppplliiccaattiioonnss ooff llooggiissttiicc rreeggrreessssiioonn sseeee HHaallkkooss ((22000077))..
13
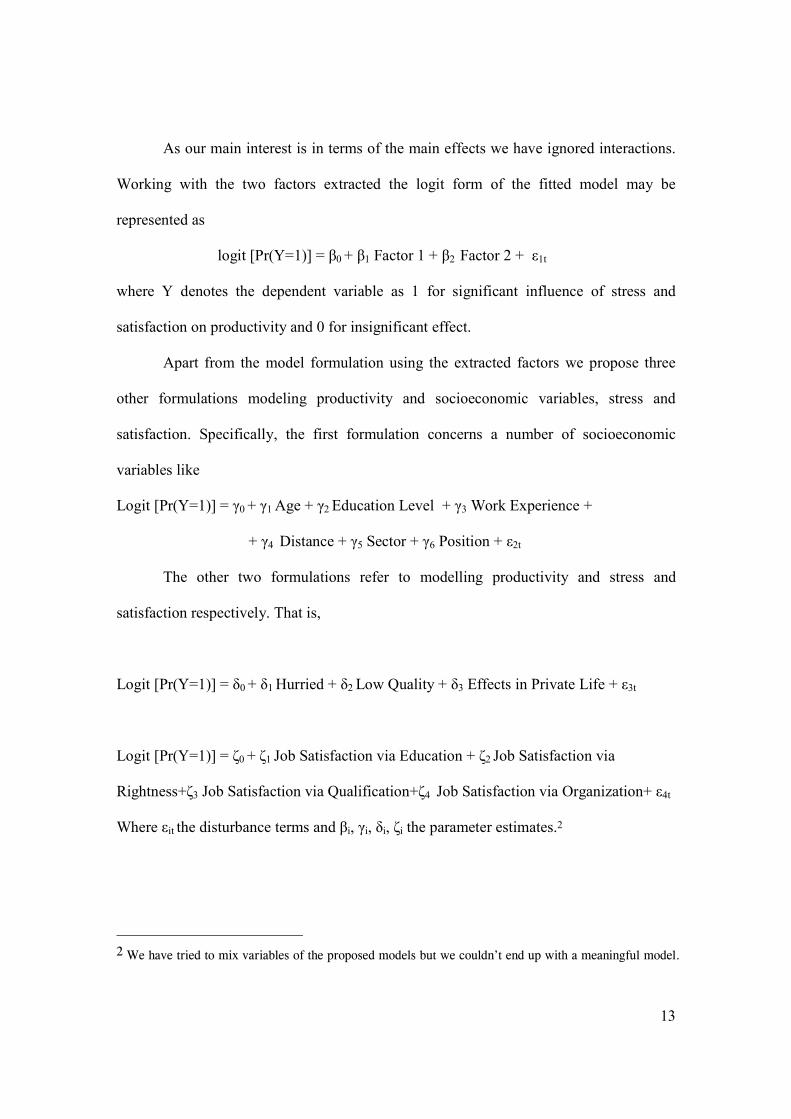
As our main interest is in terms of the main effects we have ignored interactions.
Working with the two factors extracted the logit form of the fitted model may be
represented as
logit [Pr(Y=1)] = β0 + β1 Factor 1 + β2 Factor 2 + ε1t
where Y denotes the dependent variable as 1 for significant influence of stress and
satisfaction on productivity and 0 for insignificant effect.
Apart from the model formulation using the extracted factors we propose three
other formulations modeling productivity and socioeconomic variables, stress and
satisfaction. Specifically, the first formulation concerns a number of socioeconomic
variables like
Logit [Pr(Y=1)] = γ0 + γ1 Age + γ2 Education Level + γ3 Work Experience +
+ γ4 Distance + γ5 Sector + γ6 Position + ε2t
The other two formulations refer to modelling productivity and stress and
satisfaction respectively. That is,
Logit [Pr(Y=1)] = δ0 + δ1 Hurried + δ2 Low Quality + δ3 Effects in Private Life + ε3t
Logit [Pr(Y=1)] = ζ0 + ζ1 Job Satisfaction via Education + ζ2 Job Satisfaction via
Rightness+ζ3 Job Satisfaction via Qualification+ζ4 Job Satisfaction via Organization+ ε4t
Where εit the disturbance terms and βi, γi, δi, ζi the parameter estimates.2
2 We have tried to mix variables of the proposed models but we couldn’t end up with a meaningful model.

14
4. Empirical Results
Going on to our statistical analysis, Table 1 presents factor loadings and specific
variance contributions according to Maximum Likelihood method of extraction in a
Factor Analysis setup. Looking at Table 1 it can be seen that the first 18 questions define
factor 1 (high loadings on factor 1, small or negligible loadings on factor 2) and represent
stress. The questions refer among others to stress from work to personal life and stress
from a number of cases like work environment, lack of creativity, surrounding work
relations, chances of evolution, change management, management policy etc. Similarly
the other 14 questions define factor 2 (high loadings on factor 2, small or negligible
loadings on factor 1), which represents satisfaction. The questions refer among others to
satisfaction from work role, work environment, personal work method, surrounding work
relations, utilization of knowledge-capabilities, salary etc.
The communalities being high indicate that the two factors account for a large
percentage of the sample variance of each variable and is evidence that the model
presents stability. From the same table the ΚΜΟ index is close to unit (0,860) which
implies that the sum of squares of the partial correlation coefficients between all the pairs
of variables is low. This result shows that in our case factor analysis is strong. Similarly,
the value of the Bartlett’s test of sphericity is very large (5.560,3) and the level of
statistical significance is 0,000 leading to the rejection of the null hypothesis that the
matrix of correlation coefficients is unity.

15
Table 1: Factor analysis results Component Matrix Rotated Component
Matrix
Commu-
nalities
Variables Factor 1 Factor 2 Factor 1 Factor 2
work can create difficulties in personal life 0,381 3,686Ε-02 0.350 -0.155 0.146
work stressors can affect the rest 0,497 0,118 0.491 -0.141 0.261
workload upsets people 0,450 0,293 0.536 3.469E-02 0.289
stress from transfer to or from work 0,395 0,176 0.431 -4.02E-02 0.187
stress from the work environment 0,390 0,105 0.391 -9.96E-02 0.163
stress about work hours 0,508 0,288 0.584 1.620E-03 0.341
stress about job security 0,441 0,218 0.491 -2.61E-02 0.242
stress from cooperation-communication with others 0,593 0,280 0.654 -4.67E-02 0.430
stress from lack of creativity 0,689 0,279 0.738 -9.47E-02 0.553
stress about chance further education 0,528 0,246 0.581 -4.47E-02 0.339
stress about personal work method 0,547 0,257 0.602 -4.44E-02 0.365
stress surrounding work relations 0,545 0,376 0.660 6.075E-02 0.439
stress about salary 0,569 0,175 0.582 -0.126 0.354
stress about utilization of Knowledge - capabilities 0,629 0,242 0.667 -9.78E-02 0.455
stress about relations with management-leadership 0,704 0,236 0.729 -0.140 0.552
stress about chances of evolution 0,590 0,239 0.631 -8.07E-02 0.405
stress about management policy 0,700 0,212 0.714 -0.158 0.534
stress about change management 0,532 0,251 0.587 -4.26E-02 0.346
satisfaction from the organization 0,429 -0,343 0.205 -0.509 0.302
satisfaction from work role 0,362 -0,420 0.109 -0.544 0.308
satisfaction from the work environment -0,266 0,311 -7.96E-02 0.402 0.168
satisfaction from cooperation-communication with
others
-0,439 0,278 -0.246 0.457 0.270
satisfaction from lack of creativity -0,353 0,633 2.665E-03 0.725 0.526
satisfaction about chance further education -0,305 0,489 -2.58E-02 0.576 0.332
satisfaction about personal work method -0,344 0,508 -5.11E-02 0.611 0.376
satisfaction surrounding work relations -0,216 0,116 -0.131 0.207 5.999E-02
satisfaction about salary -0,437 0,446 -0.162 0.603 0.389
satisfaction about of utilization Knowledge –
capabilities
-0,445 0,699 -4.53E-02 0.827 0.687
satisfaction about relations with management-
leadership
-0,417 0,485 -0.125 0.627 0.409
satisfaction about chances of evolution -0,366 0,586 -3.13E-02 0.690 0.478
satisfaction about management policy -0,384 0,535 -7.21E-02 0.654 0.433
satisfaction about change management -0,100 0,262 4.098E-02 0.277 7.846E-02
Cumulative Proportion of Total sample Variance Explained 65,6 63,3 63.3
KMO 0,860
Bartlett’s test of Sphericity 5.560,3 (Sig.=0.000)
The results of the fitted logistic models are presented in Table 2. The individual
statistical significance of the β estimates is presented by the Wald (Chi-square). The
significance levels of the individual statistical tests (i.e. the P-values) are presented in
parentheses and correspond to Pr>Chi-square.
16
In the model formulation using the extracted factors as explanatory variables we
have statistical significance for both factors. In the case of using the socioeconomic
variables as independent we see that the variable distance is statistically significant in all
levels of significance. Similarly, the variables work experience and educational level are
statistically significant for the levels of 0.05 and 0.1 and the variables work experience
and sector for 0.1. The variable position is statistically insignificant. In the case of the
model with the proposed variables representing stress we see that the variables low
quality and hurried are statistically significant for the levels of 0.05 and 0.1 and the
variable effect in private life for 0.1. Finally, in the case of the model with the proposed
variables representing satisfaction we see that the variables job satisfaction via rightness
and qualifications are statistically significant in all levels of significance while the
variable job satisfaction via education for the level of 0.1. The variable job satisfaction
via organization is statistically insignificant.
Being more specific, in case we run the model with the socioeconomic variables
then the coefficient of age is 1β)
=-0.636, which implies that the relative risk of this
particular variable is 1eβ)
=0.529 and the corresponding percentage change is e$β1 -1=-
0.471. This means that in relation to age the odds of persons’ ability to increase
productivity decreases by almost 47% ceteris paribus. In the case of work experience
2β)
=-0.229, which implies that the relative risk of this particular variable is 2eβ)
=1.349
and the corresponding percentage change is e$β2 -1= 0.349. This means that in relation to
work experience the odds of persons’ ability to increase productivity increases by almost
0.35% all other remaining fixed. Similarly, the odds of persons’ ability to increase
17
productivity decreases by 0.55, 0.29, 0.51 and 0.113 in relation to distance from work,
education level, sector of employment and position respectively.
We may compute the difference e i$β− 1which estimates the percentage change
(increase or decrease) in the odds π ==
=
Pr( )
Pr( )
Y
Y
1
0for every 1 unit in Xi holding all the
other X’s fixed. In case we run the model with the productivity against the stress
statistically significant variables then the coefficient of someone hurried is 1β)
=0.387,
which implies that the relative risk of this particular variable is 1eβ)
=1.473 and the
corresponding percentage change is e$β1 -1=0.473. This means that in relation to stress
expressed by hurries the odds of persons’ ability to increase productivity increase by
almost 47% ceteris paribus. In the case of low quality in the work produced 2β)
=0.483,
which implies that the relative risk of this particular variable is 2eβ)
=1.621 and the
corresponding percentage change is e$β2 -1= 0.621. This means that in relation to low
quality in production the odds of persons’ ability to increase productivity increases by
almost 0.62% all other remaining fixed. Finally, the odds of persons’ ability to increase
productivity decreases by 0.243 in relation to effects in private life all other remain fixed.
In case we run the last model with the productivity against satisfaction statistically
significant variables then the coefficient job satisfaction via education 1β)
=0.617, which
implies that the relative risk of this particular variable is 1eβ)
=1.853 and the corresponding
percentage change is e$β1 -1=0.853. This means that in relation to job satisfaction via
education the odds of persons’ ability to increase productivity increase by almost 85%
ceteris paribus. In the case of job satisfaction via rightness 2β)
=1.130, which implies that

18
the relative risk of this particular variable is 2eβ)
=3.095 and the corresponding percentage
change is e$β2 -1= 2.095. This means that in relation to job satisfaction via education the
odds of persons’ ability to increase productivity increases by almost 210% all other
remaining fixed. Finally, the odds of persons’ ability to increase productivity increases by
375% and decreases by 0.28% in relation to job satisfaction via qualification and
organizations respectively.
The Nagelkerke R square is a measure of predictability of the proposed models
(similar to R2 in a regression). To assess the model fit we compare the log likelihood
statistic (-2 log $L ) for the fitted model with the explanatory variables with this value that
corresponds to the reduced model (the one only with intercept). The likelihood ratio
statistic is quite high in all cases rejecting H0 and concluding that at least one of the β
coefficients is different from zero.
Finally, the Hosmer and Lemeshow values equal to 4.48, 5.73, 9.85 and 0.92
(with significance equal to 0.812, 0.677, 0.276 and 0.969) for the four model
formulations respectively. The non-significant X2
value indicates a good model fit in the
correspondence of the actual and predicted values of the dependent variable.

19
Table 2: The logistic regression results Variables Estimates Odds
Ratio
Estimates Odds
Ratio
EstimatesOdds
Ratio
Estimates Odds
Ratio
Constant
Wald
P-value
1.521
[100.8]
(0.000)
7.231
[22.476]
(0.000)
0.537
[0.301]
(0.583)
-2.211
[36.973]
(0.000)
Factor 1 (stress)
Wald
P-value
-0.392
[7.596]
(0.006)
00..667766
Factor 2 (satisfaction)
Wald
P-value
0.442
[10.616]
(0.001)
11..555566
Age
Wald
P-value
-0.636
[5.529]
(0.019)
00..552299
Work experience
Wald
P-value
-0.299
[3.128]
(0.077)
11..334499
Distance
Wald
P-value
-0.803
[24.511]
(0.000)
00..444488
Education level
Wald
P-value
-0.349
[4.057]
(0.044)
00..770055
Sector
Wald
P-value
-0.720
[2.998]
(0.083)
00..448877
Position
Wald
P-value
-0.120
[1.680]
(0.195)
00..888877
Hurried
Wald
P-value
0.387
[4.999]
(0.025)
1.473
Low quality
Wald
P-value
0.483
[4.558]
(0.033)
1.621
Effect in private life
Wald
P-value
-0.278
[2.815]
(0.093)
0.757
Job-satisfaction via education
Wald
P-value
0.617
[2.751]
(0.097)
1.853
Job-satisfaction via rightness
Wald
P-value
1.130
[13.45]
(0.000)
3.095
Job-satisfaction via qualifications
Wald
P-value
1.557
[24.13]
(0.000)
4.745
Job-satisfaction via organization
Wald
P-value
-0.333
[0.924]
(0.336)
0.717
Nagelkerke R2
0.1 0.16 0.1 0.34
Hosmer Lemeshow 4.478
(0.812)
5.731
(0.677)
9.850
(0.276)
0.922
(0.969)
Likelihood Ratio 331.357 225.26 246.79 393.904

20
5. Conclusions and Policy Implications
In this paper we used factor analysis in order to identify the responsible factors for
the correlation among a large number of variables and their influence on productivity.
Our results showed us that productivity is seriously affected by the two qualitative
factors, stress and satisfaction. As expected, in the former, increased stress leads to
reduced productivity and in the latter, increased satisfaction leads to increased
productivity.
Following this, logistic regression presented us with a lot of useful elements
concerning the function of stress, satisfaction and supportive elements on productivity.
Initially it showed us the effect of financial and social elements such as the importance of
experience and previous employment on productivity, but also the importance of the
knowledge that an employee will continue to work for the same organisation, since the
increase of productivity in employees of the same organisation was considerably high.
Thus, the trust in older members of staff is a point that can offer a considerable advantage
to the organisation and also a feeling of safety to the employee.
Another element that arose was the everyday ordeal concerning getting to and
from work with this element having a negative effect on employees’ productivity. A
problem of decreased productivity also arose in the case of the public sector, which may
be true, but at the same time this is connected with lack of motivation, meritocracy,
satisfaction etc. Then the influence of stress on productivity was accentuated, focused on
three elements. First, when work starts to intersect with the workers' personal life, this
has a negative effect on productivity. Second, work load is not connected to the lack of
quality in everyday work, thus quality work is more related to conscientiousness and

21
personal satisfaction than work load. And third, energetic and active individuals do not
affect productivity negatively, but positively, and this is why we mentioned the case of
creative and “useful” stress.
The satisfaction factor greatly affects productivity according to our empirical
findings. It is important for individuals to work on what they wanted and chose in their
lives, and this is why a large increase in productivity is evident from this element. It is
more important, however, to have a balance between employees’ qualifications and their
contribution to the organization and the benefits (of all kinds) offered by the organisation
to the employees.
Relying on our sample, we could mention some interesting points. The age and
family status of the employees is a particularly important factor relating to satisfaction,
because as age increases, the satisfaction from work is reduced, while the younger the
age, the higher the ambition. In the same way, those who do not have children or are not
married find greater pleasure in work with respect to their free time. With reference to
financial situation and education level, we found that workers with high incomes and
those with higher education are more ambitious than other categories. Work experience
and in particular years of work for the same organisation are a stress-reducing factor,
since mutual trust between organisation and employee contributes to this respect. With
respect to stress and satisfaction, we saw that a large percent of workers shows stress, but
also feels satisfaction from the same organisation. It is noteworthy that the satisfaction
ratio is smaller around systems of remuneration and benefits, and so injustices in the
remuneration-benefit systems of an organisation may cause considerable problems.

22
Necessary steps
Relying on our empirical results a number of steps are necessary. In particular,
1. A clear job description is needed in order to avoid phenomena of vagueness in
roles, fields of action, or role conflicts.
2. Rotation of employees, even horizontally, so that they do not reach points where
their work is monotonous and boring.
3. Change of work areas, if the initial design was not correct or if the introduction of
changes and re-classifications leads to a recasting of the work area (e.g. the
company used to have two employees in the accounts department, but due to
development the same space must now accommodate four people).
4. Creation of an environment of understanding and acceptance of such problems by
the company, so that the employee knows that it cares for him and that he is an
integral part of the organisation.
5. Constant informing and training of the employees, not only on matters concerning
their work but also on more general matters concerning the functioning and
activities of an organisation (e.g. seminars on group work, time management, stress
management etc.).
6. The existence of recognition and reward for each work achievement contributes
towards the keeping up of the employees' morale; in this way, employees adopt a
positive mood towards their role in the organisation, and the organisation shows its
members that it does not regard them only as performers, thus creating a better
working climate and reducing the feeling of insecurity and stress. Positive working
conditions are considered necessary and non-negotiable factors. Each working area,

23
but also the broader environment of the organisation, create moods, contribute
towards behaviours and lead to stances.
7. Work security and the feeling that employees are not in danger (of remaining
unpaid, being fired, being demoted) are important factors. The same applies for
control and supervision, provided, however, it is based on contribution towards
better and more just work attainment and greater group effectiveness, and not on
fear of reproach or penalty.
8. Greater independent action, so that employees can bring out and channel their
potential.
9. Better and more substantial operation of the team.
10. Creation of a Motivator framework which will be renewed and adjusted according
to needs.
11. Impulse from management for greater creativity and innovation.
12. Cooperation of management and workers, based on a mutual profitable
development of the people and the organisation.
Relying on the findings of our survey we have to admit that generalizations to other
populations must be done carefully. Additional research should focus on the ways to
increase productivity in public sectors where hearing of an action is difficult to use and
hard to move. The effect of stress and satisfaction on productivity in specific sectors or
geographical areas or professions should also be explored. Finally, more qualitative
factors affecting productivity may be explored like emotional intelligence.
Acknowledgements
We thank the ICAP Group for providing the database on the companies surveyed in our
work.

24
References
Alderfer, C.P. (1972), Existence, relatedness, and growth. Free Press, New York
Aldwin, C. M. (1994), Stress, coping and development. An integrative perspective. The
Guilford Press, New York.
Bergus, G. R., Randall, C. S., Winniford, Μ. D., Mueller, C. W. and Johnson, S. R.
(2001), “Job satisfaction and workplace characteristics of primary and specialty care phy-
sicians at a bimodal medical school”. Academic Medicine, Vol. 76, pp. 1148-1152.
Brewer, Ε.W. and Clippard, L. F. (2002), “Burnout and job satisfaction among student
support serνices personnel”. Human Resource Development Quarterly, Vol. 13, pp. 169-
186.
Brewer, Ε.W. and McMahan-Landers, J. (2003a). “Job satisfaction among industrial and
technical teacher educators”. Journal of Industrial Teacher Education, Vol. 40 No. 2, pp.
65-85.
Brewer, E.W. and McMahan-Landers, J. (2003b), “Job stress and burnout among indus-
trial and technical teacher educators”. The Journal of Vocationαl Education Research,
Vol. 28 No. 2, pp. 125-140.
Brief, Α.Ρ. and Weiss, Η.Μ. (2002), “Organizational behaviour: Affect in the
workplace”. Annual Review of Psychology, Vol. 53, pp. 279-307.
Catalano, R. (1991), “The health effects of economic insecurity”. American Journal of
Public Health, Vol. 81 No 9, pp.1148-1152.
Clugston, Μ. (2000). The mediating effects of multidimensional commitment on job
satisfaction and intent to leave. Journal of Organizational Behavior, Vol. 21, pp. 477-
486.
Dooley, D., Fielding, J. and Levi, L. (1996), “Health and unemployment”. Annual Review
of Public Health, vol. 17, pp. 449-465.
Dunteman, G.H. (1989), Principal Components Analysis. Sage, London
Elkedes, T. and Seifert, W. (1993), “Unemployment and health impairments Longitudinal
analyses for the Federal Republic of Germany”. European Journal of Public Health,
Vol. 3 No 1, pp. 28-37.
Fenwick, R. and Tausig, M. (1994), “The macroeconomic context of job stress”. Journal
of Health and Social Behavior, Vol. 35 No 3, pp. 266-282.

25
Ferrie, J., Marmot, M., Griffiths, J. and Ziglio, E. (Eds) (1999), Labour market changes
and job insecurity: A challenge for social welfare and health promotion. WHO Regional
Publications, Denmark.
Freud, S. (1978), I and the defence mechanisms. Translation Paradellis Th., Kastaniotis
Publications, Athens.
Gay, L.R. and Airasian, Ρ. (2003). Educational research: Competencies for analysis and
application (7th ed.). Upper Saddle River, NJ: Prentice-Hall.
Graetz, B. (1993), “Health consequences of employment and unemployment:
Longitudinal evidence for young men and women”. Social Science and Medicine,
Vol. 36 No 6, pp. 715-724.
Greene, W. (2000), Econometric Analysis. Prentice Hall, New Jersey.
Gurmu, S., Rilstone, P. and Stern, S. (1999), “Semiparametric estimation of count
regression models”. Journal of Econometrics, Vol. 88 No 1, pp. 123-150.
Halkos, G.E. (2007), Econometrics: Theory and Practice. Giourdas Publications, Athens.
Halpern, R. (1999). After school programs for low-income children: Promise and
challenges. Future of Children, 9(2), 81-95.
Heaney, C., Israel, B. and House, J. (1994), “Chronic job insecurity among automobile
workers: Effects on job satisfaction and health”. Social Science and Medicine, Vol. 38
No 10, pp. 1431-1437.
Heslop, Ρ., Smith, G.D., Metcalfe, C., and Macleod, J. (2002). Change in job satisfaction,
and its association with self-reported stress, cardiovascular risk factors and mortality.
Social Science & Medicine, 54, 1589-1599.
Herzberg, F. (1966), Work and the nature of man. Work Publishing Co, Cleveland.
Herzberg, F. (1968). Work and the nature of man. New York: World.
Johnson, R.A. snd Wichern, D.W. (1998), Applied Multivariate Statistical Analysis.
Prentice Hall, New Jersey
Karasek, R.A. (1979), “Job demands, job decision latitude, and mental strain:
implications for job redesign”. Administrative Science Quarterly, Vol. 24 No 2, pp. 285-
308
Labiris G., Gitona, K., Drosou, V. and Niaks, D. (2008). A proposed instrument for the
assessment of job satisfaction in Greek Mental NHS Hospitals. Journal of Medical
Systems 32, 333-341.

26
Leeflang, P., Wittink, D., Wedel, M. and Naert, P. (2000), Building models for
marketing decisions. Kluwer Academic Publishers, Boston.
Leino-Arjas, P., Liira, J., Mutanen, P., Malvivaara, A. and Matikainen, E. (1999),
“Predictors and consequences of unemployment among construction workers:
Prospective cohort study”. British Medical Journal, Vol. 319 No 7210, pp. 600-605.
Lewis, M. and Ramsay, D.S. (1997), “Stress Reactivity and self recognition”. Journal of
Child Development, Vol. 68 No 4, pp. 621-629.
Locke, E.A. (1976), The nature and causes of Job Satisfaction. Rand Mc. Nally, Chicago.
Maslow, A.H. (1954), Motivation and Personality. Harper, New York.
Paoli, P. (1997), Working conditions in European Union. European Foundation for
Living and Working Conditions, Dublin.
Petty, G.C., Brewer, .W. and Brown B. (2005), “Job satisfaction maong employees of a
youth development organization. Child and Youth Care Forum, Vol. 34 No 1, pp. 57-73
Porter, L.W. and Lawler, E.E. (1986), Managerial attitudes and performance.
Homewood, Dorsey Press, Illinois.
Selye, H. (1964), The stress of life. Mc Graw–Hill Book Co., New York.
Siegrist, J. (1996), “Adverse health effects of high- effort Low- Reward Conditions”.
Journal of Occupational Health Psychology, Vol. 1 No 1, pp.27-41.
Tennant, C. (2001), “Work-related stress and depressive disorders”. Journal of
Psychosomatic Research, Vol. 51 No 5, pp. 697-704.
Turner, J. (1995), “Economic context and the health effects of unemployment”. Journal
of Health and Social Behavior, Vol 36 No 3, pp. 213-229.
Warr, P. (1990), “Decision latitude, job demands, and employee well-being. Work and
stress”. Community of Scholars, Vol 4, pp. 285-294.
Viinamaki, H., Koskela, K. and Niskanen, L. (1993), “The impact of unemployment on
phychosomatic syptoms and mental well-being”. The International Journal of Social
Phychiatry, Vol. 39 No 4, pp. 266-273.