Embed Size (px)
Citation preview

MPRAMunich Personal RePEc Archive
Branding in food retail of high valuecrops in Asia: Case of Makhana fromBihar (India)
Bart Minten and K.M. Singh and Rajib Sutradhar
IFPRI, New Delhi, ICAR-RCER, Patna, JNU, New Delhi
14. January 2011
Online at http://mpra.ub.uni-muenchen.de/54334/MPRA Paper No. 54334, posted 13. March 2014 14:30 UTC

0
Branding in food retail of high value crops in Asia:
Case of Makhana from Bihar (India)
Bart Minten
IFPRI, Addis Ababa, Ethiopia
K.M. Singh
ICAR-RCER, Patna, India
Rajib Sutradhar
JNU, New Delhi, India
January 2011
Abstract
Local brands are rapidly emerging in food retail in Asia. However, it is not well understood what impact they have in domestic food markets. In a detailed case study of makhana in Bihar, one of the poorest states in India, we see the fast emergence - a doubling over five years leading to a share of 50% in total trade - of more expensive packaged and branded products. Two types of brands can be distinguished. Low-price brands focus exclusively on attractive glossy packing with little consideration for quality. The high-price brands pay attention to quality beyond packing, invest in advertisements and promotion, explore options for value-addition, and employ specialized salesmen. We find that information provided by most of these brands is incomplete or misleading and that there are little direct benefits to the farmers from the emergence of either of these brands. However, farmers might benefit indirectly because of the expanding product demand.
1
Branding in food retail of high value crops in Asia:
Case of Makhana from Bihar (India)
1. Introduction
Significant changes are happening in food and agricultural markets in developing countries. The
observed changes in Asia concern most importantly the emergence of modern retail in food retail
(Reardon et al., 2010) and the increased consumption of high-value agricultural products (Gulati
et al., 2007; Delgado et al., 2008). The rapid changes in these markets has led to a large body of
research to better try to understand the impacts of these changes on producers, consumers, and
on the food system as a whole (e.g. Reardon et al, 2010; Pingali, 2007; Swinnen and Vandeplas,
2010; Maertens and Swinnen, 2009). One of the changes in food systems that has recently been
documented is the decline of the sales of loose products and the rapid emergence of packed and
branded products in food retail in Asia (e.g. Pingali, 2007; Minten et al., 2010). For example, the
sales of branded rice in traditional markets in Beijing increased by 8% over the course of five
years (Reardon et al., 2010).1 Similar patterns are seemingly seen in other countries in Asia, e.g.
in a recent study in Delhi, it was shown that 31%, 70%, and 78% of all rice, wheat atta, and
mustard oil sold by traditional retailers was branded (Minten et al., 2010).
While unbranded and unpacked products are undistinguishable from those of competitors,
marketing of packed and branded produce adds a ‘brand value’ to products and while not easy to
measure, it enables sellers to charge higher prices for their products. The real benefit for the
brand-owner occurs over time as the loyality of the consumers to the brand and the cheapness of
retaining these loyal customers compared to the costs of attracting new ones make it a profitable
enterprise for a branding firm (e.g. Anholt, 2005). The increasing sales of branded food products
can be an important vehicle to add value to an agricultural product. It might have especially a lot
of appeal for market development in developing countries as it can have important impacts on
consumer as well as producer welfare (Berges-Sennou et al., 2004; Anholt, 2005).
While branded food products in domestic markets in Asia are emerging rapidly, few studies have
however looked empirically at how this branding works in practice, what the effects are in local -
1 Given that modern retail has grown at 23% over the same period (Reardon et al., 2010) and given that modern retail almost exclusively sells branded products, the effective importance of brands has even grown more.

2
traditional as well as modern - retail markets, who is selling and buying these products, who
benefits from the branding, and what the effect is on producers. The available studies in the
international development literature on branding in food markets have been limited to study the
switch from manufactured labels to private retail labels, often linked with the emergence of
modern retail (e.g. Reardon et al., 2004), or the effects of the development of brands for export
markets in developed countries (e.g. Ponte, 2002).
We present here the case study of makhana in Bihar, one of the poorest states in India. Makhana,
or gorgon nut, is an interesting product as it is almost exclusively commercialized from this state
(Singh, et al. 1994), and branding and packing for this crop was not started until recently. It is
thus a unique case study on the development of local brands in poor settings and its impact on
the value chain. We find that branding has diffused rapidly in this market. In a five year period,
the share of branded products increased from 25% to 50% of the total market. These branded
products are sold at significantly higher prices than loose products. Two types of brands can be
distinguished, i.e. low-price and high-price brands. Low-price brands focus exclusively on
attractive glossy packing with little consideration for quality. Investments are small but so are
price differences with loose products. The high-price brands pay attention to quality beyond
packing, invest in advertisements and promotion, explore options for value-addition, and employ
specialized salesmen.
The contributions to the literature are twofold. First, this is the first study that documents based
on survey results the fast emergence of brands in food retail in India. A typology of brands in
this developing and growing market is made. We find that most of these brands have incomplete
or misleading information for the consumer (on traceability of the product, on certification and
quality standards, and on direct linkages with producers). Second, we implement a unique study
set-up where surveys were fielded for all agents in the value chain. By using such a
methodology, we are able to document where the costs and benefits due to the emergence of
brands occur. While the retail prices of these brands are significantly higher than those of loose
products, we find that there are little direct benefits to the farmers from the emergence of these
brands. However, farmers might benefit indirectly because of the expanding product demand.
The structure of the paper is as follows. In Section 2, we present a conceptual framework as to
understand the potential impact of the emergence of branding in food markets. Section 3

3
provides some background information on the product studied. In Section 4, the data collection
methodology is discussed as well as some descriptive statistics. Results on the prevalence of
branding and packing are presented in Section 5. Section 6 analyzes the market structure of the
makhana sector. Section 7 then looks at the rewards to branding in the market place. In Section
8, we look at the effect of branding on producers. We finish with conclusions and implications in
Section 9.
2. Conceptual framework
Various drivers are quickly changing food demand in a number of developing countries. These
drivers include, most importantly, (1) urbanization (a larger share of the population in
developing countries is living in urban centers; given that population growth in these countries is
often high, a rapid increase in the urban population overall is usually seen); (2) income growth
(an important increase in average incomes and a reduction in poverty levels has been seen in a
number of developing countries in recent years); (3) changing lifestyle and female participation
in the workplace (women have traditionally taken care of agricultural production and/or food
preparation, but as they are increasingly entering into the urban labor force, they often have less
time to spend on these activities); and (4) increasing access to better technologies (these include,
at the household level, the spread of refrigerators, microwave ovens, and gas stoves, which allow
for the use of different foods and food preparation methods, and at the industry level, access to
better food packaging technology).
These changes have led consumers in developing countries to demand a different food basket:
(1) the quantity, per person and overall, that is demanded from urban food markets is increasing
faster than in rural areas; (2) the composition of the food basket is different, as better-off
consumers often shift away from grains and consume relatively more high-value products such
as fruits and vegetables, dairy products, meat, and fish,2 as well as more processed food for
convenience; (3) there is a demand for more choices per product and a greater variety of food
products in general; and (4) consumers in developing countries are also increasingly concerned
about quality and safety issues with regard to their food, especially as safety issues tend to be
more correlated with nonstaple foods.
2 This shift is more commonly known as Bennett’s law (Bennett 1941).

4
The changing requirements of consumers lead to a restructuring of food supply chains. The final
food supply chain arrangements are, however, shaped not only by these demand factors.
Conditioning factors such as geography,3 the population structure,4 the structure of the financial
sector, and the reliability of the justice system, among others, are important in shaping the final
outcome of the chain. Policy factors also play an important role, be it regulation, hard
infrastructure, institutions, international trade, or foreign direct investment (FDI) rules.5
Changes in the supply chain are ultimately transmitted to the rural producer. His or her
production environment and livelihood might change due to the different crops that he or she is
required to grow and due to changes in input as well as output prices. Moreover, other types of
labor, land, inputs and technologies may be used, and new requirements of the market, including
transaction requirements (such as postharvest handling) might translate into additional
investments. The producer’s behavior is, however, influenced not only by market forces but by
nonpolicy conditioning factors and policy factors as well. The rural nonfarm economy will often
strongly condition the ability of the farmer to make the requisite investments to respond to the
requirements of the transformed supply chain (Reardon et al., 2007).
The differential pull and push factors lead to a difference in food supply chains across countries
and products—as reflected in different types of institutional arrangements, which range from
spot market exchanges to full vertical integration, in which the stages of marketing, transaction,
and production are linked through ownership rather than through market exchanges (Swinnen,
2007). The effects of changes in food supply chains - such as branding - on poverty are strongly
debated in the literature. Minot and Roy (2007) distinguish four pathways by which they might
affect poor farmers and poverty overall: through a direct effect on farm income, through
backward linkages to agricultural input suppliers, by changing wages and employment, and by
affecting the food prices faced by consumers.
First, significant research has examined the effects of these changes on farm income. Higher
standards of branding companies might lead to higher technical requirements, which in turn
translate into physical investments, human capital investments, more coordination costs, and
3 For example, Reardon et al. (2007) show how changes might be strongly related to geographical locations. 4 Increasing urbanization leads to an increasing scarcity of labor in rural areas and might, through induced innovation, force the adoption of new, less labor-intensive technologies. 5 For a more detailed discussion, see Reardon and Timmer (2007).

5
practice changes at the farm level (Reardon et al., 1999). Minot and Roy (2007) argue that the
effects on smallholders in particular depend on five factors, including the relative costs of
production, the relative costs of marketing, the agrarian structure, the nature of consumer
demand, and the nature of marketing institutions. This theoretical differential effect is reflected
in the empirical research on the impact of changes in the supply chain (for a detailed overview,
see Reardon et al., 2009).
Second, a few studies have investigated the impact of changes in backward linkages. For
example, Kimenye (2002) finds that high-standard green bean production has significantly
higher backward linkages with input markets through the increased demand for chemical inputs,
irrigation services, and so on. Hernández et al. (2007) and Natawidjaja et al. (2007) find similar
results in the cases of Guatemala and Indonesia, respectively. Changes in backward linkages
could become more prevalent due to the emergence of branded products. Due to the increased
demand, the organization of supply chains for inputs might improve, as urban-produced
equipment and variable inputs might become cheaper because of economies of scale (e.g., von
Braun and Kennedy, 1994).
Third, research has also looked at the effect of changing food supply chains on labor markets and
employment in the food supply chains or in the agricultural sector itself. Researchers have
hypothesized that poverty might be reduced because of the intensive use of unskilled labor in
these new supply chains. Some recent studies have found that this impact pathway can be very
important in developing countries (e.g., Barron and Rello, 2000; Maertens and Swinnen, 2009;
McCulloh and Ota, 2002; Jarvis and Vera-Toscano, 2004).
Fourth, food prices in rural as well as urban areas might be affected due to the transformation of
the food economy. This might be partly due to changes in demand for quality as prices for
products of the same quality go up due to higher demand, or higher qualities are delivered that
fetch a higher price overall. Food prices might be different for branded products compared to
traditional loose and unbranded products.
3. Background

6
Makhana or gorgon nut is an aquatic crop that is largely grown in Northern India.6 Though
makhana is also found in wild form in China, Japan and Russia, India is the only country where
makhana is cultivated as a crop, mainly in the states of Bihar and some parts of Assam (Mishra
et al., 2003). It is estimated that Bihar accounts for more than 80 percent of total makhana
production in the country and that makhana production takes place in 20 out of its 38 districts,
mostly situated in the North of the state. Makhana as a crop can be cultivated in any pond that is
shallow and stagnant. However, localized expertise of makhana cultivation has cast doubts on its
propagation beyond its traditional territory. Makhana has shown important production increases
in the last decades and makhana cultivation has, endogenously without public research or
extension intervention, spread to ricefields that in the flooded off-season are used in some
districts in Bihar for makhana cultivation. It is estimated that while makhana cultivation done in
ponds accounted for 90% of total production 10 years ago, 65% and 35% of current production
comes from ponds and ricefields respectively.7
In those areas where makhana cultivation is done, it is estimated that about 10 or 15 village
ponds are in use. The majority of these ponds are owned by the government and leases for short-
term use are auctioned by the fishermen’s cooperative society. However, a number of ponds are
in private hands. Most of the cultivation is done by the malla caste (Mishra et al., 2003). Average
production levels are estimated to be around 0.85 tons per acre but the highest yields can go up
to 2 tons per acre. No improved varieties for makhana are currently available and higher
makhana yields can only be achieved by improved pond management, especially the application
of organic matter in the pond as well as irrigation.
Makhana cultivation is characterized by a strong seasonality. To avoid a decline in quantities
harvested, clay should regularly be removed from the ponds (usually every three or four years).
This should be done during the months of October and November. Sowing of the new crop then
takes place in the months of January or February and germination happens after 30 to 40 days. In
the case of commercialized makhana cultivation, young seedlings are transplanted from nurseries
to the ponds or rice fields. Such transplanting, as in the case of rice, usually leads to significantly
higher yields. Makhana harvesting usually starts at the end of July and can go up until the end of
6 The states of Bihar, Manipur, Orissa, Jammu and Kashmir and lower Assam. 7 Personal communication, Dr. Jha, Senior Scientist, Research Centre for Makhana, Darbhanga.

7
September or the beginning of October. Harvests are often done in different intervals (up to three
harvests) with the first harvest being the biggest one. The processing, which is informal and little
mechanized, of the harvested makhana seeds into makhana pop might then go on until
December. A pre-condition for the processing is that seeds need to first dry for about 10 days or
so.
Makhana pop has several uses. It is a highly relished food taken as namkeen, kheer, curry, etc.
(Mishra et al., 2003). Makhana pop is traditionally consumed as a snack or high-protein, low-fat
food or sweet component, as well as being a source of traditional medicine (World Bank, 2007).
Makhana further holds special importance in cultural and social life of Bihar. It is considered
obligatory for brides’ parents to send makhana to the house of the groom to serve the latter’s
family before the marriage. It is usually eaten with betel and betel nut. It is also used as a part of
final rituals in the case of death.
4. Data
4.1. Data collection
Surveys were implemented with funds from the National Agricultural Innovation Project
(NAIP). One of the components of this project aimed to improve agricultural performance, and
more particularly so in disadvantaged districts of India. Based on several indicators (agricultural
productivity per worker, agricultural wage rates, and share of the scheduled caste/tribe in total
population), 150 districts were thus assigned to the ‘disadvantaged district’ status by the
Planning Commission of India. The NAIP project in Bihar had activities in four of these
disadvantaged districts. The one district where makhana production was important, i.e.
Darbhanga, was subsequently selected to field the surveys. It is estimated that about 30,000 to
40,000 people are involved in the makhana sector in Darbhanga. The total makhana area
cultivated in Darbhangha amounted to about 1,200 hectares in 2009. This compares to a total of
15,000 hectares in Bihar. Increasing commercialization has been noted over the years. While
before the 2000s, only a tiny share of makhana was exported outside the district, it was estimated
in 2009 that almost 60% was sent outside the district.
In preparation of the survey, extensive key informant interviews were conducted before the
fielding of the surveys in the middle and end of 2009. We also had several talks with the

8
manager of Shakti Sudha, the largest processing company of makhana as to understand their
procurement, processing, and sales practices. The information collected in this stage helped then
in the design of the survey instruments.
Different types of surveys were set up in the beginning of 2010 as to understand the value chain.
They included surveys with makhana producers and a village survey, wholesale and retail trader
surveys, and a processor survey. The initial idea was to study the impact of direct procurement of
Shakti Sudha Industries on producers in the local communities. However, despite multiple
attempts with the manager of the company as well as with local traders and farmers, we were
unable to track down its suppliers from the villages where the company was active, inside the
selected district as well as outside it. This indicated that the company did not have these
downstream activities (anymore?) that it claimed to have in place earlier or, more likely, that it
never had the claimed procurement practices in place at least on a large-scale. When this
information was available, we followed the sample procedure as follows.
In the selected district, twelve makhana producing villages were randomly selected in the largest
makhana producing block (Manigachi). In each selected village, a village questionnaire was
implemented. In each selected village, a census of households was conducted to enumerate all
the makhana producers. Each household was asked questions on their total area of ponds and
makhana cultivation. From all the makhana cultivators, 18 households were randomly selected.
For all the selected households, a detailed household survey was conducted. 217 makhana
households were effectively interviewed in total, one above the target of 216, i.e. 18 households
times 12 villages. In each selected village, 2 makhana processors were interviewed as well.
We implemented the survey of makhana retailers in 50 colonies in the city of Patna. The city of
Patna has 72 wards. Ten wards were randomly selected and then five colonies in each of those 10
wards. A complete census of retailers that were selling makhana was done in each colony. A
survey was then implemented with four retailers randomly chosen from the census list. In total,
we interviewed about 150 retailers, lower than targeted as in some colonies not enough retailers
could be found. Simultaneously, a wholesale questionnaire was implemented with all the
wholesalers in Patna (a census of the wholesalers) and in the rural production areas where the
producer survey was being fielded as well as with a small number in Delhi.

9
4.2. Descriptive statistics
Table 1 presents the descriptive statistics of the interviewed makhana farmers. The average age
of the head of household is 49 years. Head of households are all male and 93% of the households
belong to the mallah caste. While some key informants indicated that other farmers than the
mallah caste were often cultivators of the pond and that the role of the mallah caste – the
traditional producers and processors of makhana - was basically reduced to wage labor for pond-
owning or –leasing households, this is thus not borne out by our data, at least in the survey area.
The size of an average household would be slightly above 7 members. Two-thirds of the
producers are member of a fishermen cooperative society but only very few are members of any
other farmers’ organization.
The households involved in makhana cultivation are relatively poor, even for Bihar standards, as
seen by several indicators (Table 1). First, 48% of the heads of households are illiterate. Second,
more than two-thirds of the producers are holders of a Below the Poverty Line (BPL) or
Antyodaya card, both indicators of severe poverty. Third, 60% of the producers interviewed
described themselves as poorer than the average household in the village. One quarter even self-
reported to be among the poorest in the village. The average number of ponds cultivated by the
household is 2.1 (Table 1). While almost half of the farmers only cultivate makhana in one pond,
13% of the households reported to cultivate more than 3 ponds. The average pond area cultivated
per household is 4.8 acres and the average production per household in 2009 was 3.1 tons.
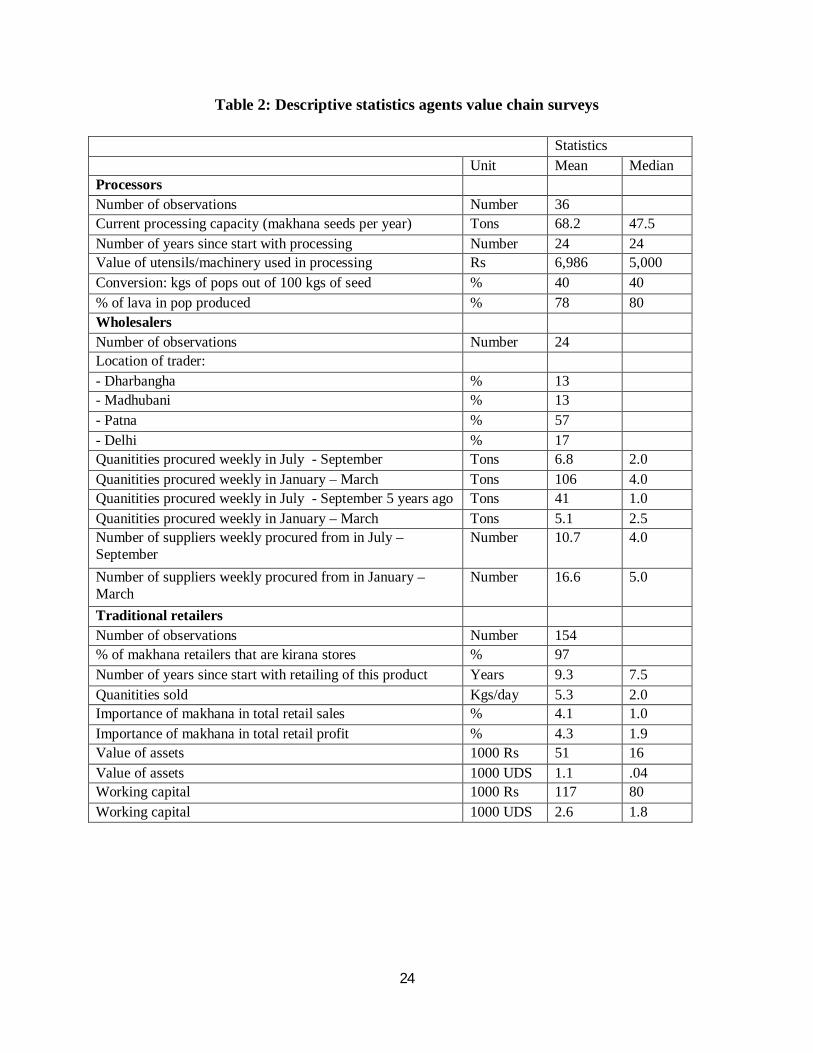
Table 2 shows descriptive statistics on characteristics of the different value chain agents on top
of the farmers that were interviewed in the value chain study. First, we interviewed 36
processors. The average processing capacity of these processors is about 68 tons of makhana
seeds per year. Most of the processors have been doing this job for a long period, i.e. 24 years.
As the job requires very specific and hard to master skills in the popping technique, processors
have to go through years of apprentice often with family members before they effectively master
the skill and are able to achieve high popping rates and good quality pop.8 The required
monetary investments for processing are limited and investment costs are as high as 6,986 Rs
(i.e. 155$). An average processor reports that they are able to achieve a conversion rate of 40 kgs
8 The Research Centre for Makhana has developed a first proto type machine to allow for mechanical processing. However, the rates of popping that are achieved are significantly lower than those of manual processing.

10
of pop out of 100 kgs of seed. The share of lava, the best quality pop, in total production is
estimated at 78%.
Second, 24 wholesalers were interviewed in different markets, i.e. 57% in Patna, 26% in the
production areas (Darbhanga and Madhubani), and 17% in Delhi. Wholesalers declare to procure
on average about 7 tons per week in the beginning of the harvest period, i.e. July to September.
This increases then to an average of about 11 tons per week in the period of January to March.
Compared to the procurement numbers five years ago, we see a doubling of the procurement
quantities by these wholesalers, possibly indicating the fast growth of the commercial makhana
sector (as indicated by several key informants). The number of suppliers that they procure
produce from also shows significantly seasonal movements, in line with the increased quantities.
While the average number of suppliers is as high as 11 in the period of July-September, this
increases to 17 in the period January-March.
Third, 154 retailers were interviewed in the city of Patna. Only some retailers are street hawkers
and most of the makahana is sold by kirana stores, i.e. mom-and-pop stores (97% of those
interviewed). The quantities that are sold of makhana are low and amount only to 5 kgs per day
per store and retailers declare that this product makes up just over 4% of their sales and profits. It
is thus clearly a minor product in the sales portfolio for most of these stores. Values on asset
values and working capital are shown at the bottom of the Table 5. They show that most retail
stores are rather small operations, i.e. the average value of assets and working capital are
evaluated at 1,100 USD and 2,600 USD respectively.
5. The prevalence of branding and packing
While seemingly little has changed over time on the production and processing side, we note
however important changes upstream in the value chain, especially related to packing and
branding practices. Table 3 shows the importance and emergence of packed and branded
produce, as reported by wholesalers. 96% of the interviewed wholesalers report that they are
currently selling packed and branded products and these products now account for almost half of
their total sales. This compares to only 23% five years ago. The rather recent take-off of branded
products is further illustrated by the year that these wholesalers started selling branded produce.9
9 This statistic was only calculated for those wholesalers that had been in business for a long enough period.

11
While almost all wholesalers are selling branded products now, only 27% was doing so before
2004. A large number of wholesalers (45%) started selling branded products in the years 2004-
2005, the apparent year of major take-off. The data thus indicate that there is a fast emergence of
these branded products in this sector. This then begs the question on how this branding process
works in practice. Wholesalers were asked on the importance of branded products in their sales
as well as in their procurement. The numbers show that branded products are twice as important
in sales as in procurement, indicating that a large part of the branding is done by these
interviewed wholesalers themselves. However, it also indicates that at least some wholesalers
buy branded products and then re-sell them.
Wholesalers were further detailed questions on each branded product that they were selling at the
time of the survey (Table 4). Despite the rather small market and the recent start of brands, the
results show that there are already a large number of brands out there. 33 brand names were
identified in total. There are no clear market leaders and the most frequent observed brand,
Swagat, accounted for only 13% of all the brands found.10 Moreover, of all the brands on sale,
31% were packed by the wholesalers themselves and a quarter of the branded bags were sold
exclusively by that wholesaler.
The bags contain in general 250 mgs of popped makhana (97% of the brands). The type of
makhana found in the bag is usually a mix of qualities and in only a few cases, it is indicated that
only the best quality (‘lava’) is in the bag (9% of the bags). Quality assurance is often done at the
level of the wholesaler himself (35%). There is not clear homogeneity in the quality per bag.
While 48% of the same brands are reported to show no difference in quality, 38% and 13% show
‘a bit’ and ‘a lot’ of difference in quality respectively. Further questions were then asked on the
information given on the bag. In 80% of the brands, the exact weights were printed on the bags.
However, most other information that typically goes with food branding was not available. Only
16% of the bags provided an expiry date. In none of the cases, the exact address of the
manufacturer or the maximum retail price was printed and in only 5% of the cases, the telephone
number of the manufacturer was given. If a customer was thus not satisfied with the product, it
would be hard for him to trace the product back to the company where the product was
packaged.
10 Ramaswami et al. (2009) found similar results in the proliferation of brands in cotton seed markets in India.

12
6. Market structure
In traditional makhana markets, four quality types of pop are distinguished, i.e. lava, murha, turi,
and mix. The differences in quality are almost exclusively linked with the size of the pop.
Makhana transactions in these traditional markets are done in gunny bags. These gunny bags are
standardized in size and the weight of such a gunny bag is indicative of the quality of makhana.
If makhana is processed well, makhana pops are larger and weigh less and a low weight of a bag
is thus an indication of good quality. The general rule of thumb is that a bag of 8 kgs is an
indication of high-quality lava makhana and a bag that weighs more than 10 kgs contains mostly
lower quality makhana (murha and turi).
The previous section has shown how the branded products graded and packaged by wholesalers
themselves have taken off in recent years. This is called the low-price brands from here onwards.
Table 5 documents some of the costs and benefits from this branding process for the wholesalers
that do so. Two activities are needed to do the packing and branding process, i.e. the purchase of
designed bags and the bagging. Half of the wholesalers buy empty branded bags. While some of
these bags are made in the production area of Darbhanga itself, the majority (94% of the bags)
however are ordered from specialized manufacturers in the cities of Kanpur or Delhi. In 18% of
the cases, the design of the bag was done by the wholesaler himself. If so, the costs of the design
amount to a one-off investment of 22,000 Rs. The average cost per empty bag is 2.1 Rs. Almost
half of the wholesalers (47%) report to own a packaging machine. The investment costs for such
a machine are minimal as the reported price is 1,862 Rs (or 41 USD). The labor costs involved in
filling up and the sealing of the bags amounts to 0.4 Rs.
Wholesalers were asked at their level to evaluate the benefits from the packing and branding
process. They estimated that if the products that were in the bags were sold loose, they would be
able to obtain a price that is on average 15 Rs lower than when bagged and branded.11 Based on
the numbers above, this compares to total variable costs for bagging of 2.5 Rs per bag or 10 Rs
11 Wholesalers indicated that they use a differential price scheme where higher prices were asked from direct consumers that bought from them compared to purchases by retailers. The average price difference was about 8 Rs/bag or 32 Rs per kg. However, direct sales to consumers are limited.
13
per kg (as bags are mostly 0.25 kg). However, some wholesalers indicated that these products
were not comparable as the quality of products that go in the branded bags is low and could not
be sold loose.
In the opinion of the wholesalers, branded bags do often not contain quality that is better than
those products that are sold loose (Table 6). 19% of the wholesalers indicate that the quality of
makhana in the branded bags is better, 38% evaluates the quality to be the same, and 38% thinks
it is worse. Most of the wholesalers also indicate that the quality of the makhana that is used for
inclusion in the bags can come from all types of suppliers (58%) and inclusion in the bag does
not depend on specific characteristics of suppliers. There are thus seemingly little exclusion
effects from branding, that sometimes has been found in other modernizing markets (e.g.
Reardon et al., 2009). None of the wholesalers that produce the branded bags employ salesmen
to sell their brand and none pay for ads on television, on the radio or in the newspaper.
Wholesalers were further asked questions on why they do not sell more branded products. The
major reason is seemingly that a large number of customers like to check the quality of the
product and they cannot do this with the packed product. The lack of demand for branded
product does not seem related to the higher prices that are asked for branded products (5% of
wholesalers), the longer time required to sell branded products (11% of wholesalers), and the
lack of availability of sufficient quality to be included in branded bags (6% of wholesalers).
A different packing and branding system has been put in place by Sudha Shakti Industries which
has received significant positive reports.12 This is called the high-price brand hence forward.
This firm which started in 2004 implemented a new business model opening up new market
opportunities for the makhana product. While the best quality of makhana (lava) is branded and
sold in export markets or in big cities, the lower qualities are processed into new products, such
as roasted snack foods, flakes, or powder for pudding. These latter products did not exist in the
market place before. To sell the branded products, they employs 24 sales persons in the country
and they spend monthly on average 1 million Rs (22,000 USD) for ads on TV, on the radio and 12 Business Outlook, a leading Indian business magazine, has chosen it one of the 14 best agricultural innovations in the country (http://business.outlookindia.com/inner.aspx?articleid=2165&editionid=58&catgid=2&subcatgid=973).
14
in newspapers. The reported quantities of popped makhana sold by the company have increased
from 124 tons in 2005 to 3,000 tons in 2009. In 2009, 40% was sold in export markets (mostly to
Pakistan, Nepal, Bangladesh, and the Middle East; no processed products were exported) while
the rest was being sold in local markets all over India (30% sold as processed products and 70%
in natural form). Little is sold to the local markets in Bihar as they feel there is no quality
demand and quality rewards in these local markets.
Shakti Sudha Industries implemented a procurement system that supposedly benefits the farmers
in four ways.13 First, they assure a fixed floor price at 100 Rs/kg for makhana pop for all farmers
that own the membership card khet se bazaar tak of the company. A different price is
implemented every month in line with market prices but offered farm prices are assured to never
drop lower than this floor price. The prices offered are further also guaranteed to at least raise
steadily over the season (5 Rs/kg rise per month), protecting farmers from potential downward
price volatility. Farmers are paid within 3 days of delivery in their account. Second, farmers are
linked to the banking system as they are required by the company to set up a banking account.
They will help farmers then get access to the Kisan Credit Card scheme, a successful
government intervention that allows farmers access to (cheap) credit. Third, farmers do not have
to bear the cost of transportation as this is re-imbursed by the firm for all produce that is
transported from farmers’ fields to collection centers. Fourth, Sudha Shakti Industries facilitate
the leasing arrangements between cultivators and owners of ponds (mostly by linking the owners
of ponds to potential cultivators as well as by the writing of contracts). However, despite a large
number of interactions with Sudha Shakti Industries as well as with key informants in several of
their supposed production areas, only a handful of people could be identified that had direct
linkages with them and it seems that their direct procurement model has (mostly) fallen apart in
recent years (and they might procure part of their products from traders) and their impact on
farmers is lower than claimed.
To evaluate the quality that is sold by the branding companies, bags of the high-price brand
(Sudha Shakti Industries) and of a prominent low-price brand were bought and opened. Produce
was taken out and shown to the wholesalers without them knowing where the product came
from. In an open-format question, wholesalers were asked to state what the maximum price was
13 See http://www.shaktisudha.com/about.html

15
that they were willing to pay for that makhana quality.14 The results shown at the bottom of
Table 8 indicates that the wholesalers valued the makhana quality that was contained in the high-
price brand at a higher price than the low-price brand. The difference between the two qualities
was 16 Rs/kg indicating the higher quality in the high-price brand. In a one-sided t-test, this
difference is significant at the 10% level.
7. The benefits of packing and branding
To understand the rewards of packing and branding in retail markets, price data were collected
for all makhana products (loose, packaged, and branded) that were being sold by makhana
retailers in Patna. Information was also collected on the size of the pop and the location of the
sale (kirana stores as well as the specific ward and colony). The results of a hedonic price
regression including these variables are reported in Table 7. The logarithm of the price of
makhana in Rs per kg is used as the dependent variable. Ward and colony dummies are included
in all specifications as to control for possible location-wise unobserved heterogeneity. Two
models are estimated, i.e. a model where brand and packaged are included together, and a
specification where the brand and packed dummy are interacted.
The results show that the lava quality (the default value in the regression) is rewarded with a
premium, compared to a mixed quality, of between 7% and 11% in the retail market. The
coefficients come out significant in both specifications. The rewards of the lava quality
compared to the murha variety are not significant at conventional statistical levels. However,
there were only a few murha observations in our dataset and comparison might be a bit difficult
because of this. Makhana products sold in kirana shops are on average, controlling for
confounding factors, not cheaper than those sold by street hawkers. The regression results further
show significant rewards to branding and packing in retail markets, in both specifications.
Packaged products are sold at prices that are 10% higher and branding adds another 9% on top of
this (model 1). A dummy that includes only packaged and branded products show that,
controlling for location and quality, prices for such branded/packed products are about 15%
higher than the price of any other makhana products (model 2).
14 For a review of the advantages and drawbacks of revealed versus stated preferences, see Murphy et al. (2005).

16
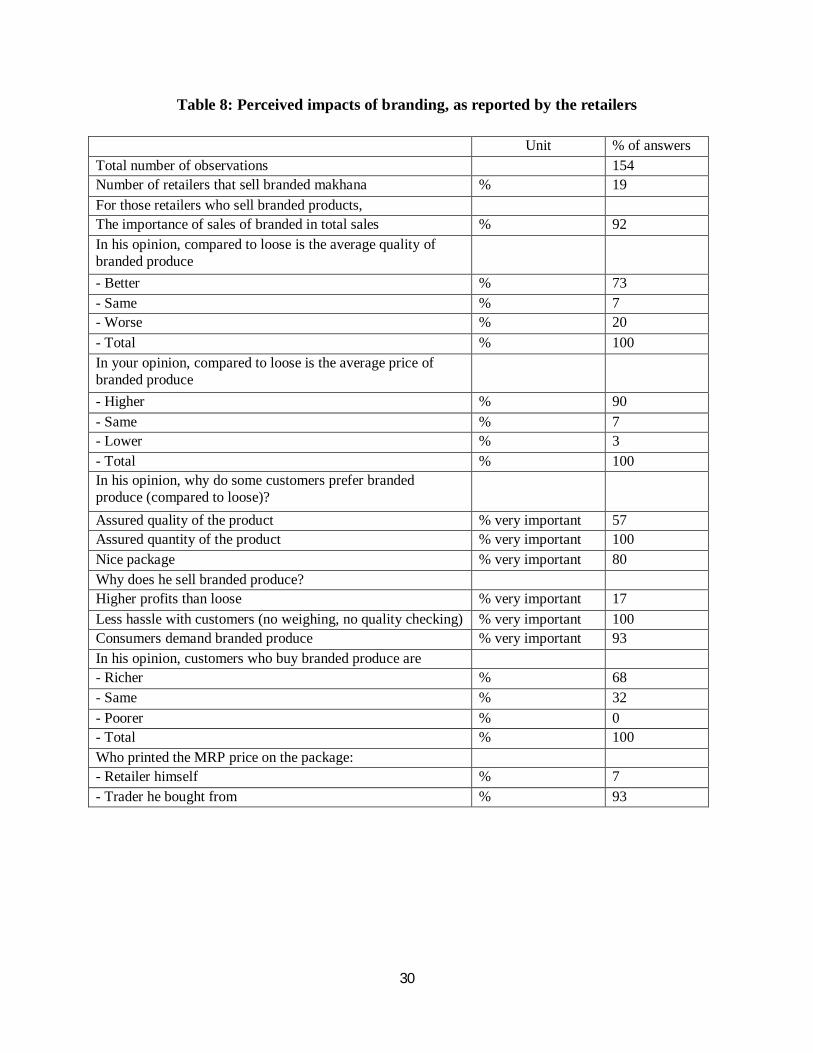
As expected, we thus find significant price effects of branding in the retail market. It is still not
clear how the branding effects works in practice and a number of questions were asked on this to
the retailers (Table 8). While almost all wholesalers sell branded products, their importance is
much less in retail market of Patna as only 19% of retailers sell branded products, indicating that
a large number of the branded bags handled by wholesalers in the city are sold outside Patna
(and mostly in bigger cities outside the state). For those retailers that sell branded products, they
almost exclusively sell branded products as they account for an important percentage in total
sales for these retailers (92%). In contrast with wholesalers (who better know what actually goes
into the bags), the majority of makhana retailers that sell branded products believe that the
quality of these branded products is higher (73%). 90% of the retailers also report that prices are
higher than for loose products, confirming our quantitative results.
Retailers were then asked to evaluate why they think consumers are interested in branded
products. All retailers believe that because of the branding, customers are assured of receiving
the right quantity of the product. Only just over half of the retailers believe that customers would
buy brands because of better quality. Retailers that were selling branded products were also
asked to state why they were selling these branded products. Only a small number indicated that
this was done because of higher profits but they prefer the branded products because of a
reduction in hassle and transaction costs (as no weighing and quality checking by customers was
required) and because of the increase in demand for these branded products by customers. When
asked on the type of customers that would buy these branded products, the majority of retailers
believed that these were richer customers (68%) than those buying loose products.
8. Do producers benefit from branding?
To understand the importance of different agents in each supply chain (loose versus branded),
detailed marketing and price questions were collected at each level. Farmers were asked to give
specifics on the marketing of their makhana and for all transactions done in the last year, they
were asked details on relevant marketing information. The results of these are reported in Table
9. An average transaction at the farm level concerns 1.2 tons of makhana sold for a total value of
62,458 Rs (about 1,400 USD). Most of the makhana sold by farmers is marketed as makhana
seeds (55% of the transactions). 44% is sold in the form of mixed popped makhana and in only
1% of transactions is it sold as makhana lava. This indicates that the grading in different qualities

17
is thus seemingly happening at a later stage than the farmer level. In our interviews with farmers,
they indicated that they preferred to sell mixed qualities as it is reportedly hard to grade and sell
the lower popped quality makhana in the market place.
Most of the sales of makhana happen in a short-time period and it seems that few farmers store
makhana as to benefit from the (potentially) higher prices that might be offered in the off-season.
56% of all transactions happened in the months of August and September and only 3% of the
transactions were done during the off-season of January until April. More than half of the
transactions (51%) are with collectors in the village and 20% with wholesalers from the district
itself while in 13% of the cases, products are sold to processors, indicating their importance as an
important marketing outlet for some farmers. Major reported reasons for the choice for a specific
buyer are related to immediate payments (52% of the transactions) and proximity of the buyer
(20% of the transactions). Surprisingly, ‘high prices’ came only third (18% of the transactions).
In contrast with conventional wisdom, input advances are not very important as in only 3% of
the transactions, they were reported to have been given by the buyer of the produce. Despite our
efforts to field our surveys in areas where the Shakti Sudha Industries were active, only 0.3% of
the transactions were reported to have been done with this high-priced brand company.
Using multi-variate regression analysis, Table 10 shows the importance of different determinants
in price setting at the farm level.15 They show the rewards, as could be expected, from the sales
of processed makhana compared to makhana seeds. The results also show that makhana lava at
the farm level is sold at a premium over mixed quality of 17 Rs/kg on average during the year of
the survey. There are few other determinants that show a significant effect on the price. Prices go
up when farmers are able to offer a higher quantity. A doubling of the quantity sold leads to a
price offered that is about 1 Rs/kg higher. Unexpectedly, makhana sold to wholesalers from the
district itself fetch a lower price than products sold in the village itself. Most importantly, the
results show that the high-price brand in the case that they were directly procuring from the
farmer, were able to offer a price to the farmer that was significantly higher than any other
procurement outlet. So, at least some farmers benefited from their procurement model. However,
15 Standard errors of the regression coefficients are estimated after accounting for within cluster (village) correlations.

18
as shown in the previous section, the procurement by them has been limited in the year of the
survey.
Based on price data collected in the different surveys with all makhana value chain agents, we
are able to calculate the relative contribution of each actor in the final retail price. We present
this graph for loose as well as branded products during the period July-August 2009. To make
prices comparable, the reported makhana seed prices (the most common form under which
farmer market makhana) were converted to pop equivalents by using a conversion ratio of 40%
(coming out the of the survey). As margins were not collected at the same period for wholesalers
and retailers, margin rates from the period asked for were imposed to the other period. The
results are shown in Figure 1.
The results show that the farmers receive 55% of the final retail price in Patna, in the case that
makhana is sold loose. As there are no benefits to the farmer of the branding process, this share
declines to 50% in the case of the final price for the low-price branded products. In both cases,
farmers are thus the agent in the value chain that gets most of the rewards, reflecting also most of
his effort for the product. As is usual the case in these markets, the retail margin is the second
most important component in the final price, accounting for 19% and 22% in the final retail price
of loose and low-price branded products respectively. Processors and urban wholesalers count
for equal shares in the final retail price.
9. Conclusions
In response to growing incomes, developing countries see increasing differentiation and choice
in their food retail markets. However, it is not well understood what these choices entail in these
transitional markets. In a detailed case study of makhana in Bihar, we see the fast emergence of
more expensive packaged and branded products. Two types of brands can be distinguished, i.e.
low-price and high-price brands. Low-costs brands focus exclusively on attractive glossy
packing with little consideration for quality. Investments, but profits as well, are small. The high-
price brands pay attention to quality beyond packing, invest in advertisements and promotion,
explore options for value-addition, and employ specialized salesmen. We find that there are little
direct benefits to the farmers from the emergence of these brands. However, farmers might
benefit indirectly because of the expanding product demand.

19
The research indicates to several policy implications. First, an important question remains how
poor farmers can be directly connected to major branding companies and potentially capture
some of the benefits of branding in the retail markets. In food markets, we see that some of these
modern companies in developing countries - be in processing or retail - do invest in these
backward linkages as to ensure timeliness, quality, food safety, and traceability characteristics of
their supplies (e.g. Reardon et al, 2009). The role of the government is then to assure that the
appropriate conditions for investments by the private sector are there. This can be done by
assuring among others sure property rights, law and order, road and communication
infrastructure, and education of rural households, all things that the state of Bihar has be lacking
for a while and that only improved recently. It is thus important that Bihar continues further on
this road.
Second, the results indicate the importance of independent certification mechanisms for
consumer protection. Several claims done by some of the low-price as well as high-price brands
in Bihar are clearly false, i.e. claims are made about export quality while no export quality
grades exist; claims are made about approval by research organizations while no such approvals
exist; claims are made by the largest branding company on backward linkages while few of such
backward linkages exist in practice. The lack of an effective consumer protection body leads thus
to mis-information of consumers.
Third, there are major differences with branding practices in other sectors and countries.16 No
information on the manufacturers is available on the packing of the branding companies
implying that companies are not accountable for their products given consumers can not trace
back deficient products in the case of defaults. We also find that the quality of branded products,
especially for the low-price brands, is often lower than loose products in these transitional
markets. In contrast with regular branding practices, a significant number of brands thus try to
hide bad quality inside. Brands in this setting in India thus seemingly have little function except
the packing function and signal little credible information to the consumer on the characteristics
of the product. While there is little role for the public sector on this, it seems likely that most of
these branding practices are unsustainable as consumers become more demanding and informed
16 E.g. Berges-Sennou et al., 2004; Carriquiry and Babcock, 2007; Jekanowski et al., 2007; Marsden and Smith, 2005; Ménard and Klein, 2004; Papadopoulos, 2004; Ponte, 2002; Ward et al., 1985; Wohlgenant, 1993.
20
over time and as they do not lead to a loyal consumer base, the requirement for success of a
brand.
Given the lack of empirical evidence on the effects of brands in food markets in Asia, and in
developing countries more general, this should be fertile ground for future research. The obvious
research questions that should be further pursued relate most importantly to the conditions
needed to ensure direct benefits to poorer farmers from the emergence of food brands and a
better understanding of the evolution of branding practices over time in developing countries and
the appropriate public policy responses as to ensure quality and safe food at prices that are
affordable for consumers and at the same time rewarding for producers.
References
Anholt, S. (2005), Brand new justice: How branding places and products can help the developing world, Elsevier Butterworth-Heinemann, Oxford Barron, M.A., Rello, F. (2000), The impact of the tomato agroindustry on the rural poor in Mexico. Agricultural Economics 23:289–297. Bennett, M.K. (1941), International contrasts in food consumption. Geographical Review 31:365–374. Berges-Sennou, F., Bontems, P., Réquillart, V. (2004), Economics of Private Labels: A Survey of Literature, Journal of Agricultural and Food Industrial Organization, 2 (3):1-23 Carriquiry, M., Babcock, B.A. (2007), Reputations, market structure, and the choice of quality assurance in the food industry, American Journal of Agricultural Economics, 89(1): 12-23 Delgado, C.L., Narrod, C.A., Tiongco, M. (2008), Determinants and implications of the growing scale of livestock farms in four fast-growing developing countries, Research Report 157. Washington, D.C. International Food Policy Research Institute (IFPRI)
Gulati, A., Minot, N., Delgado, C., Bora, S. (2007), Growth in High-Value Agriculture in Asia and the Emergence of Vertical Links with Farmers, In: Swinnen, J.F.M. (ed). Global Supply Chains, Standards and the Poor. CABI Publishing, Oxford. Hernández, R., Reardon, T., Berdegué, J.A. (2007), Supermarkets, wholesalers, and tomato growers in Guatemala. Agricultural Economics 36(3): 281–290. Jarvis, L.S., Vera-Toscano, E. (2004), The impact of Chilean fruit sector development on female employment and household income. Working Paper No. 04-002. Davis, CA: Department of Agricultural and Resource Economics, University of California, Davis.
Jekanowski, M.D., Williams, D.R., Scheik, W.A. (2000), Consumers’ Willingness to Purchase Locally Produced Agricultural Products: An Analysis of an Indiana Survey, Agricultural and Resource Economics Review, 29(8): 43-53

21
Kimenye, L. (2002), Promoting farm/non-farm linkages: A case study of French bean processing in Kenya. In Promoting farm/non-farm linkages for rural development: Case studies from Africa and Latin America, ed. B. Davis, T. Reardon, K. Stamoulis, and P. Winter. Rome: Food and Agriculture Organization of the United Nations.
Maertens, M., Swinnen, J.F.M. (2009), Trade, standards and poverty: Evidence from Senegal. World Development 37(1): 161–178.
Marsden, T., Smith, E. (2005), Ecological entrepreneurship: Sustainable development in local communities through quality food production and local branding, Geoforum, 36(4): 440-451
McCulloh, N., Ota, M. (2002), Export horticulture and poverty in Kenya. IDS Working Paper 174. Sussex, UK: Institute for Development Studies.
Ménard, C., Klein, P.G. (2004), Organizational issues in the Agri-food Sector: Towards a comparative approach, American Journal of Agricultural Economics, 86(3): 770-775
Minot, N., Roy, D. (2007), Impact of high-value agriculture and modern marketing channels on poverty: An analytical framework. Mimeo, International Food Policy Research Institute, Washington, DC
Minten, B., Reardon, T., Sutradhar, R. (2010), Food prices and modern retail: The case of Delhi, World Development, 38(12): 1775-1787
Minten, B., Reardon, T., Chen, K. (2010), The quiet revolution in “traditional” agricultural value chains: Evidence from staple food supply to four megacities, mimeo
Mishra, R.K., Jha, V., Dehadrai, P.V. (2003), Makhana, Indian Council of Agricultural Research, New Delhi
Murphy, J.J., Allen, P.G., Stevens, T.H., Weatherhead, D. (2005), A Meta-Analysis of hypothetical bias in stated preference valuation, Environmental and Resource Economics, 30, 313-325. Natawidjaja, R., T. Reardon, and S. Shetty, with T.I. Noor, T. Perdana, E. Rasmikayati, S. Bachri, and R. Hernandez (2007), Horticultural producers and supermarket development in Indonesia. UNPAD/MSU Report No. 38543. Jakarta: World Bank/Indonesia. Papadopoulos, N. (2004), Place branding: Evolution, meaning and implications, Place branding, 1(1): 36-49 Pingali, P. (2007), Westernization of Asian diets and the transformation of food systems: Implications for research and policy, Food Policy, 32(3): 281-298 Ponte, S. (2002), The ‘Latte Revolution’? Regulation, markets and consumption in the global coffee chain, World Development, 30(7): 1099-1122 Ramaswami, Bharat; Murugkar, Milind; and Shelar, Mahesh (2009) "Product Proliferation in India's Cotton Seed Market: Are There Too Many Varieties?," Journal of Agricultural & Food Industrial Organization: Vol. 7 : Iss. 1, Article 2.
Reardon, T., Codron, J.-M., Busch, L., Bingen, J., Harris, C. (1999), Global change in agrifood grades and standards: Agribusiness strategic responses in developing countries. International Food and Agribusiness Management Review 2(3/4): 421–435.

22
Reardon, T., Timmer, C.P. (2007). Transformation of Markets for Agricultural Output in Developing Countries Since 1950: How Has Thinking Changed? In R.E. Evenson, & P. Pingali (Eds). Handbook of Agricultural Economics, 3: Agricultural Development: Farmers, Farm Production and Farm Markets (pp. 2808-2855). Amsterdam: Elsevier Press.
Reardon T, Timmer CP, Barrett CB, Berdegue JA (2003), The Rise of Supermarkets in Africa, Asia, and Latin America, American Journal of Agricultural Economics, 85 (5): 1140-1146.
Reardon, T., Barrett, C., Berdegué, J., Swinnen, J.F.M. (2009). "Agrifood Industry Transformation and Small Farmers in Developing Countries," World Development, 37(11):1717-1727. Reardon, T., Stamoulis, K., Pingali, P. (2007), Rural nonfarm employment in developing countries in an era of globalization. Agricultural Economics 37(s1): 173–183. Reardon, T., Timmer, C.P., Minten, B. (2010), Supermarket revolution in Asia and emerging development strategies to include small farmers, Proceedings of the National Academy of Sciences (PNAS), As published ahead of print December 6, 2010, doi:10.1073/pnas.1003160108, http://www.pnas.org/citmgr?gca=pnas;1003160108v1 Singh, K.M., Singh, P.P., Rai, J.N. and Singh, M.P. (1994). Cultivation of Gorgan Fruit is Remunerative in Kosi Region. Indian Horticulture, 39 (1): 35-36. Swinnen, J. (2007), Global supply chains, standards and the poor. Wallingford, UK: CABI Publishing. Swinnen, J., Rozelle, S., Xiang, T., Vandemoortele, T. (2008), A theory of standards-driven rural development. LICOS Discussion Paper 199/2008. Leuven, Belgium: KULeuven. Swinnen, J.F.M., Vandeplas, A. (2010), Market power and rents in global supply chains, Agricultural Economics, 41(s1): 109-120. von Braun, J., Kennedy, E. (1994), Agricultural commercialization, economic development and nutrition. Baltimore: Johns Hopkins University Press. Ward, R.W., Chang, J., Thompson, S. (1985), Commodity advertising: Theoretical issues relating to generic and brand promotions, Agribusiness, 1(4): 269-276 Wohlgenant, M.K. (1993), Distributions of gains from research and promotion in multi-stage production systems: The case of the US beef and pork industries, American Journal of Agricultural and Resource Economics, 75(4): 642-651
World Bank (2007), Bihar agriculture: Building on emerging models of “success”, Agriculture and Rural Development Sector Unit, South Asian Region, Discussion Paper Series, Report No.4, Washington DC World Bank (2005), Bihar: Towards a Development Strategy, Washington DC

23
Table 1: Characteristics of makhana farmers
Statistics Unit Mean Median Number of observations Number 217 Background information household Age head of household Year 49 45 Household size Number 7.3 6.0 Gender of head of households % male 100 Illiterate heads of household % 48 Holder of a Below the Poverty Line (BPL) card % 63 Holder of a Above the Poverty Line (APL) card % 28 Holder of an Antyodaya card % 5 Belong to the Mallah caste % 93 Perceived wealth :"Compared to other households in the village, would you decribe yourself as… ... among the richest in the village % 5 ... richer than most households % 5 ... about average % 29 ... a little poorer than most households % 32 … among the poorest in the village % 25 ... the poorest in the village % 3 Member of a fisherman cooperative society % 65 Member of any other farmers' organization (self-help group) % 5
Distance to closest wholesale market Minutes 34 30 Makhana cultivation and production Number of ponds cultivated Number 2.15 2.00 Number of households that cultivate only one pond % 47 Number of households that cultivate more than three ponds % 13
Area of ponds cultivated for makhana Acres 4.83 2.00 Total production of makhana seeds in 2009 kgs 3,177 1,280
24
Table 2: Descriptive statistics agents value chain surveys
Statistics Unit Mean Median Processors Number of observations Number 36 Current processing capacity (makhana seeds per year) Tons 68.2 47.5 Number of years since start with processing Number 24 24 Value of utensils/machinery used in processing Rs 6,986 5,000 Conversion: kgs of pops out of 100 kgs of seed % 40 40 % of lava in pop produced % 78 80 Wholesalers Number of observations Number 24 Location of trader: - Dharbangha % 13 - Madhubani % 13 - Patna % 57 - Delhi % 17 Quanitities procured weekly in July - September Tons 6.8 2.0 Quanitities procured weekly in January – March Tons 106 4.0 Quanitities procured weekly in July - September 5 years ago Tons 41 1.0 Quanitities procured weekly in January – March Tons 5.1 2.5 Number of suppliers weekly procured from in July – September
Number 10.7 4.0
Number of suppliers weekly procured from in January – March
Number 16.6 5.0
Traditional retailers Number of observations Number 154 % of makhana retailers that are kirana stores % 97 Number of years since start with retailing of this product Years 9.3 7.5 Quanitities sold Kgs/day 5.3 2.0 Importance of makhana in total retail sales % 4.1 1.0 Importance of makhana in total retail profit % 4.3 1.9 Value of assets 1000 Rs 51 16 Value of assets 1000 UDS 1.1 .04 Working capital 1000 Rs 117 80 Working capital 1000 UDS 2.6 1.8

25
Table 3: Importance and emergence of branding as reported by wholesalers
Statistics Unit Mean Median Number of wholesalers that sell branded produce % 96 50 Importance of branded produce in total sales now % 47 10 Importance of branded produce in total sales five years ago % 23
Year that wholesaler started selling branded products* - 2009 – 2008 % 9 - 2007 – 2006 % 18 - 2005 – 2004 % 45 - Before 2004 % 27 Importance of branded produce by season July – September - In supply % 25 30 - In sales % 41 45 January - March - In supply % 24 30 - In sales % 49 50 * only calculated for those wholesalers that have been in business for a long period

26
Table 4: Description branding practices
Unit Mean Number of observations % 61 Brand name: - Swagat % 13 - Gopi % 11 - Gopi % 11 - Laxmi % 6 - Lavkush % 3 - Muskan % 3 - Rajbhog % 3 - Rangeela % 3 - Rest* % 47 Branding and wholesalers Packaged by wholesaler himself % 31 Size of bag: % - 250 mg % 97 - 500 mg % 3 Type of makhana: - Lava % 9 - Mix % 91 Quality assurance by wholesaler himself % 35 Differences in quality by bag: - A lot % 13 - A bit % 38 - None % 48 Designed bags exclusively used by wholesaler %Yes 25 Information on bag Exact weight printed %Yes 80 Expiry date printe %Yes 16 Exact contact address manufacturer printed %Yes 0 Telephone number manufacturer printed %Yes 5 Maximum Retail Price (MRP) printed (versus blanc) %Yes 0 * include Amrit Bhog, Anmol, Balaji, Bigboss, Bunti&Babli, Dollar, Five Star,
Jain Bhog, Kohinoor, Krishna, Krishnabhog, MPS SSS, Maha Laxmi, Manpasand,
Panghat

27
Table 5: Cost and profit analysis of branding, traditional wholesalers
Unit Mean Median Branding and bagging costs Buy empty branded bags % 50 Own a packaging machine % 47 Price of packing machine Rs 1,862 1,900 City where bags are made: - Darbhanga % 6 - Delhi % 41 - Kanpur % 53 Design organized by: - wholesaler himself % 18 - other % 82 Costs design Rs 22000 25,000 Price of empty bag Rs/bag 2.1 2.0 Price of labor Rs/bag 0.4 0.4 Benefits Sales price to retailer Rs/bag 40.0 38.8 Sales price to consumer Rs/bag 47.6 47.5 Sales price to retailer Rs/kg 157 150 Reported sales price to retailer, if same quality sold loose Rs/kg 142 138 Willingness to pay for branded quality Willingness to pay for the high-cost brand quality Rs/kg 179 160 Willingness to pay for the low-cost brand quality Rs/kg 163 T-test t-value -1.43 Pr(T<t) 0.08 Pr (ITI >
t) 0.16

28
Table 6: Branding and packing, as reported by wholesalers
Unit % of answers
The quality of the branded bag is on average better than loose products you sell
- Significantly better % 5 - Better % 14 - The same % 38 - Worse % 38 - No choice % 5 The produce that you buy for inclusion in branded bags: - is only produce from specific buyers to be used for branded bags
% 42
- can come from all types of suppliers % 58 If only specific suppliers, what type of suppliers: - only farmers % 29 - only processors % 29 - only traders % 29 - other % 14 Employ salesmen to sell your brand % 0 Pay for ads on television, on the radio or in the newspaper % 0 Reasons that wholesaler does not sell more branded produce: "There is limited demand for branded produce" % very important 26 "Some customers like to check the quality of products themselves"
% very important 68
"The price of branded produce is too high for some consumers" % very important 5
"Once packed, it takes too long to sell branded produce" % very important 11 "I have to get rid of lower quality, which can not be branded" % very important 6

29
Table 7: Price effects of branding in the retail market
Dep. variable = log(Rs/kg) Model 1
Model 2
Unit Coeff. t-value Coeff. t-value Loose (default) Branded*packed yes=1 0.09 1.79 0.15 3.58 Packed yes=1 0.10 1.73 Size lava (default) Size murha yes=1 -0.13 -1.63 -0.10 -1.28 Size mixed yes=1 -0.11 -2.68 -0.07 -2.04 Sold by kirana shop yes=1 -0.05 -0.98 -0.05 -0.95 Intercept 5.69 70.84 5.68 70.37 Colony and ward dummies included but not reported Number of observations 157 157 F 2.59 2.53 Prob > F 0.00 0.00 R-squared 0.48 0.47 Adj R-squared 0.29 0.28 Root MSE 0.12 0.12
30
Table 8: Perceived impacts of branding, as reported by the retailers
Unit % of answers Total number of observations 154 Number of retailers that sell branded makhana % 19 For those retailers who sell branded products, The importance of sales of branded in total sales % 92 In his opinion, compared to loose is the average quality of branded produce
- Better % 73 - Same % 7 - Worse % 20 - Total % 100 In your opinion, compared to loose is the average price of branded produce
- Higher % 90 - Same % 7 - Lower % 3 - Total % 100 In his opinion, why do some customers prefer branded produce (compared to loose)?
Assured quality of the product % very important 57 Assured quantity of the product % very important 100 Nice package % very important 80 Why does he sell branded produce? Higher profits than loose % very important 17 Less hassle with customers (no weighing, no quality checking) % very important 100 Consumers demand branded produce % very important 93 In his opinion, customers who buy branded produce are - Richer % 68 - Same % 32 - Poorer % 0 - Total % 100 Who printed the MRP price on the package: - Retailer himself % 7 - Trader he bought from % 93

31
Table 9: Marketing by makhana farmers (% of transactions)
Statistics Unit Mean Median Quantity sold Kgs 1,240 400 Total amount received per transaction Rs 62,458 25,600 Price - Makhana seeds Rs/kg 36 35 - Makhana pop lava Rs/kg 126 133 - Makhana pop mix Rs/kg 108 105 Form of sales: - Makhana seeds % 55 - Makhana pop lava % 1 - Makhana pop mix % 44 Month of sales - January – April % 3 - July % 19 - August % 31 - September % 25 - October % 13 - November % 6 - December % 3 Buyer - Trader collector in village (outside wholesale market) % 51 - Wholesaler from this district % 20 - Wholesaler from outside this district % 9 - Processor % 13 -Shakti Sudha Industries/Ket Se Bazar Tak % 0.3 Farmer co-op % 1 - Retailer % 5 Major reason for the choice of buyer - He gives high prices % 18 - He accepts large quantities % 4 - He accepts small quantities % 2 - He gives advances when needed % 3 - He pays immediately % 52 - He is close by % 20 - No other option % 1 Input advances given % yes 3.0

32
Table 10: Price determinants farm prices
Dependent variable = Rs/kg* Coefficient
t-value
Form of sales: - Makhana seeds (default) yes=1
- Makhana pop lava yes=1 92.05 6.21
- Makhana pop mix yes=1 75.70 20.54 Quantity sold in kgs Log() 1014 1.97 Immediate payment yes=1 0.44 0.15
No input advances received yes=1 2.35 0.66
Not sold on farmers' fields or village yes=1 -2.58 -0.77
Timing of sales - January - April (default) yes=1
- July yes=1 -1.67 -0.24
- August yes=1 -3.70 -0.68
- September yes=1 -4.72 -0.77
- October yes=1 -4.13 -0.82
- November yes=1 -6.20 -1.19
- December yes=1 -8.40 -0.97
Type of buyer - Trader collector in village (outside wholesale market) (default) yes=1
- Wholesaler from this district yes=1 -10.12 -3.21 - Wholesaler from outside this district yes=1 -2.97 -0.43
- Processor yes=1 -2.13 -0.69
- Shakti Sudha Industries/Ket Se Bazar Tak or farmer co-op yes=1 15.28 4.45
- Retailer yes=1 3.48 0.91
Intercept 31.50 4.16 Number of observations 386 R-squared 0.77 Root MSE 20.12

33