Embed Size (px)
Citation preview
Multivariate Data Analysis for Biotechnology and Bio-processingPowerful Multivariate Data Analysis and Design of Experiments methods are giving biotechnology companies greater insights into their complex data and driving efficiency and innovation across the entire product lifecycle.
Makers of
Bring data to life

CAMO 02 MVA for Biotechnology and Bioprocessing
> Bring data to life > camo.com
CONTENTS
ExEcutivE summary........................................................................................................................................................................................................... 03
about camo softwarE................................................................................................................................................................................................... 03
iNtroDuctioN......................................................................................................................................................................................................................... 04
multivariatE aNalysis iN thE complEtE proDuct lifEcyclE................................................................................................................. 05
Figure 1: The application of MVA and DoE in the biotech product lifecycle ........................................................................................... 06
DEvElopmENt aND DiscovEry.................................................................................................................................................................................. 07
Figure 2: Scores and Loadings plots for a candidate selection study......................................................................................................... 07
formulation of suitable products.................................................................................................................................................................................. 08
Figure 3: Using Response Surfaces to optimize formulations....................................................................................................................... 08
cliNical trials................................................................................................................................................................................................................ 09
Figure 4: The L-PLS model and its potential for clinical trial data analysis .............................................................................................. 09
maNufacturE aND coNtrol................................................................................................................................................................................... 10
mva for fermentation batch monitoring..................................................................................................................................................................... 10
Figure 5: Relative Time Mapping (RTM) for batch monitoring...................................................................................................................... 11
Figure 6: Comparing multivariate and univariate views of a process.......................................................................................................... 12
Quality coNtrol applicatioNs............................................................................................................................................................................... 13
mva for the assessment of lyophilised product quality............................................................................................................................................ 13
applications of mva in Quality control......................................................................................................................................................................... 13
applyiNg aDvaNcED aNalytics across thE proDuct lifEcyclE: puttiNg it all togEthEr................................................. 14
Figure 7. Overview of how MVA and DoE software can be used across different operational areas................................................. 14
coNclusioN................................................................................................................................................................................................................................. 15
camo software products and services ......................................................................................................................................................................... 16
MVA for Biotechnology and Bioprocessing 03 CAMO
> Bring data to life > camo.com
EXECUTIVE SUMMARYMultivariate data analysis (MVA) and Design of Experiments (DoE) are
advanced analysis techniques which enable biotech organizations to
improve their data analysis and optimize operations across the product
lifecycle. MVA and DoE are used in applications such as raw material
assessment, analysis of clinical trial results, understanding and controlling
fermentation processes, and improving quality control.
Given the large number and complexity of variables in biological systems,
multivariate analysis has significant advantages over traditional
statistical analysis tools. The powerful data mining capabilities allow
researchers, scientists and engineers to cut through complex data sets to
discover underlying patterns, while advanced regression methods can be
used to make more robust predictions about a system’s behaviour.
Today’s biotech companies are increasingly looking to accelerate
development, reduce process related costs and improve time to market.
Unlocking the value in their data with tools such as multivariate analysis
and Design of Experiments is a major source of potential gains in these
areas.
This white paper covers applications of MVA and DoE across the product
lifecycle, including examples of data analyzed for candidate therapy
discovery, product formulation, clinical trials and fermentation batch
process monitoring. It illustrates how these powerful analytical tools can
be integrated with different systems throughout a biotechnology
operation.
ABOUT CAMO SOFTWAREFounded in 1984, CAMO Software is a recognized leader in Multivariate Data Analysis and
Design of Experiments software. Today, we have offices in Norway, USA, Japan, India and
Australia. Multivariate analysis is a powerful set of data mining techniques that help
identify patterns and understand the relationships between variables in large and
complex data sets.
Our software is used by many of the world’s leading companies, universities and research
institutes in the life sciences, food & beverage, agriculture, energy, oil & gas, mining &
metals, industrial manufacturing, pulp & paper, automotive, aerospace and technology
sectors.
The Unscrambler® X software range is used by engineers, scientists and data analysts
because of its ease of use, world-leading analytical tools and data visualization. Our
solutions are used by more than 25,000 people in 3,000 organizations to analyze data,
monitor process or equipment performance and build better predictive models. This gives
them valuable insights to make more informed decisions, improve market segmentation,
research & development, manufacturing processes and product quality.
CAMO 04 MVA for Biotechnology and Bioprocessing
INTRODUCTIONThe modern biopharmaceutical/biotechnology manufacturing facility contains many
sophisticated control, data logging and data archiving systems. Massive amounts of data
are collected from sources such as raw materials analysis, process outputs and final
quality assessments, which are stored in data warehouses.
The sheer volume of data contained in these warehouses makes it a near impossible
task to extract the information using simple charting and univariate methods of analysis.
Such complex data requires methods of analysis that can cope with multiple variables
simultaneously that not only reveal influential variables, but also reveal the relationship
such variables have with each other. This is where Multivariate Analysis (MVA) is finding a
much greater role in the analysis of complex bioprocess data.
With much more effort being put into the discovery and development of biotherapies
and personalised medicines, biopharmaceutical and biotechnology companies are
looking for ways to accelerate drug discovery, and through initiatives such as Quality
by Design (QbD) and Data Driven Knowledge Discovery, reduce the regulatory approval
time and be first to market. This means that data collected throughout the entire product
lifecycle must be analysed and interpreted in order to gain extensive product and process
understanding. This, in turn, leads to improved quality, greater confidence in the market
for a company’s products and ultimately market capitalisation.
It is estimated that it takes approximately 12 years to bring a new drug or therapy to
market. This usually involves three phases:
Discovery
Clinical Trials
Registration
Coupled with these phases is the development of a suitable manufacturing process that
can consistently produce the highest quality product. This includes the development of a
formulation that is robust under processing conditions, scale up considerations and
technology transfer from facility to facility or even between different types of
manufacturing equipment. Each of these phases can be improved and accelerated
through the use of MVA and Design of Experiments (DoE).
Even before data is analysed, one of the biggest challenges facing the industry is getting
this data into a format that is amenable to MVA. Many data collection and agglomeration
systems are commercially available for compiling various forms of data and these can be
seamlessly integrated into MVA packages such as The Unscrambler® X so that the vast
array of graphical and analytical approaches can be applied to reveal the information it
contains.
MVAMultivariate (Data)Analysis
DoEDesign of Experiments
QbDQuality by Design
> Bring data to life > camo.com
MVA for Biotechnology and Bioprocessing 05 CAMO
MUlTIVARIATE ANAlYSIS IN ThE COMplETE pRODUCT lIFECYClEUnlike small molecule drug product development, biotherapies are fundamentally more
complex in terms of structure and application and suffer greatly from natural biological
variability. For example, isolating and selecting cell cultures or bacterial strains to further
develop into future products is aided greatly by the tools of MVA, including the
monitoring of the processes (e.g. fermentation reactions) used to produce them. From
there, the tools of DoE can be used to devise formulations that stabilise the active
component(s) during manufacture and are also useful in product scale up studies.
Once the candidate therapy (cell cultures, antibody, virus strain etc.) has been formulated
into a stable matrix, MVA can be used to assist in the interpretation of clinical trial data
and can even lead to accelerating the lengthy process through a much more
comprehensive and holistic approach to data analysis, especially when combined with
the principles of adaptive designs and the Critical Path Initiative endorsed by the US
Food and Drug Administration (USFDA).
When the candidate therapy has been approved for market release, the tools of MVA are
useful for assessing the success of technology transfer from R&D to production, or from
one manufacturing facility to another. In the production environment, MVA is useful for
assessing incoming or internally produced raw material quality and characteristics.
Combined with rapid spectroscopic or other characterisation methods, control strategies
for the real time monitoring and adjustment of processes within the so-called ‘design
space’ can be devised so that proactive quality control can be realised. DoE and MVA are
then used in developing robust analytical methods for stability studies and other post
production analyses.
Multivariate analysisMultivariate data analysis (MVA) is the analysis of more than one statistical variable at a time. Essentially, it is a tool to find patterns and relationships between several variables simultaneously. It lets us predict the effect a change in one variable will have on other variables. Multivariate analysis methods include exploratory data analysis (data mining), classification (e.g. cluster analysis), regression analysis and predictive modelling.
Design of ExperimentsDesign of Experiments is a systematic approach involving a series of structured tests in which planned changes are made to a process or system, with the effect of the changes on a pre-defined output measured. It enables researchers to maximize product and process understanding with the least number of experiments and is widely used in R&D, process optimization and quality control applications.
Benefits of MVA and DoE in biotechnologyReduced development timeframes and costsReduced manufacturing costsImproved process understandingImproved product qualityFaster time to market
> Bring data to life > camo.com
CAMO 06 MVA for Biotechnology and Bioprocessing
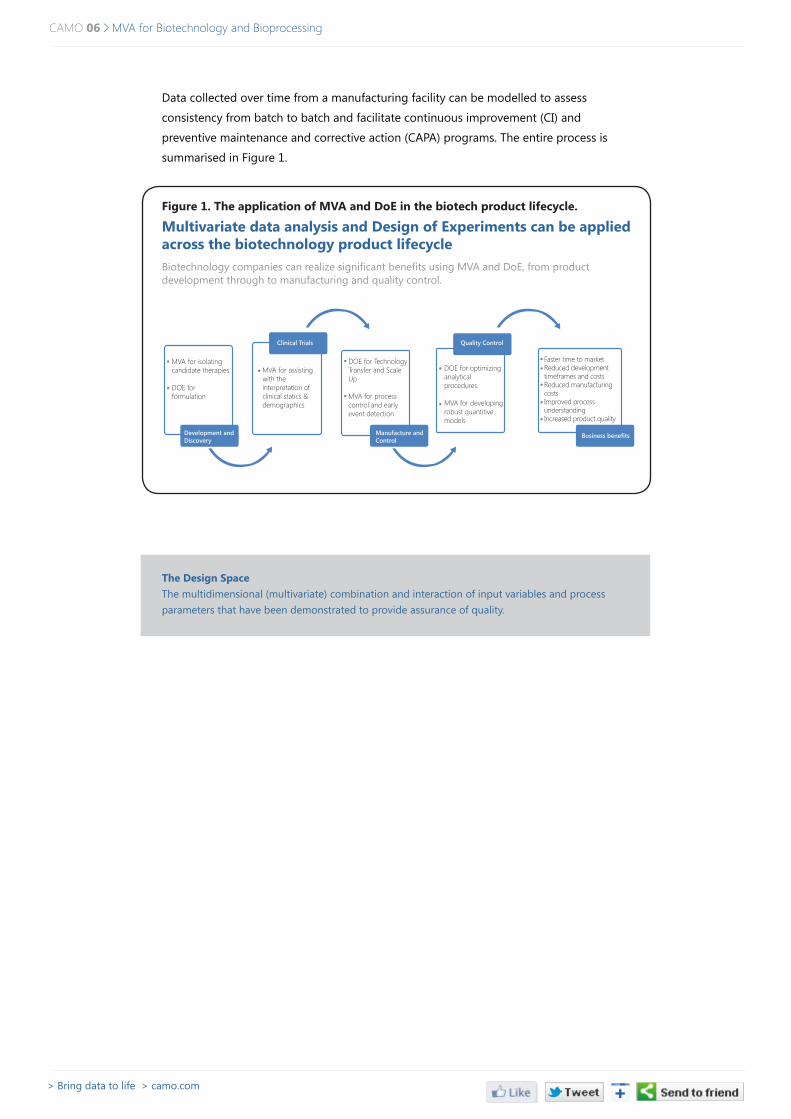
Data collected over time from a manufacturing facility can be modelled to assess
consistency from batch to batch and facilitate continuous improvement (CI) and
preventive maintenance and corrective action (CAPA) programs. The entire process is
summarised in Figure 1.
Figure 1. The application of MVA and DoE in the biotech product lifecycle.
Multivariate data analysis and Design of Experiments can be applied across the biotechnology product lifecycleBiotechnology companies can realize significant benefits using MVA and DoE, from product development through to manufacturing and quality control.
The Design SpaceThe multidimensional (multivariate) combination and interaction of input variables and process parameters that have been demonstrated to provide assurance of quality.
MVA for isolating candidate therapies
DOE for formulation
Development and Discovery
Manufacture and Control
Business benefits
Clinical Trials Quality Control
MVA for assisting with the interpretation of clinical statics & demographics
DOE for Technology Transfer and Scale Up
MVA for process control and early event detection
DOE for optimizing analytical procedures.
MVA for developing robust quantitive models
Faster time to marketReduced development timeframes and costsReduced manufacturing costsImproved process understandingIncreased product quality
> Bring data to life > camo.com
MVA for Biotechnology and Bioprocessing 07 CAMO
DEVElOpMENT AND DISCOVERYCandidate Therapy Discovery
During the initial development of new therapies, there is usually much information
available on candidate cultures, antibodies etc. in respect to their chemical, biological
and toxicological properties. Combined with information from origin and other
background information, the method of Principal Component Analysis (PCA) provides
a key data mining tool for the development scientist to not only classify candidates of
similar properties and characteristics, but also discover unique classes that may be better
suited to the treatment of specific conditions.
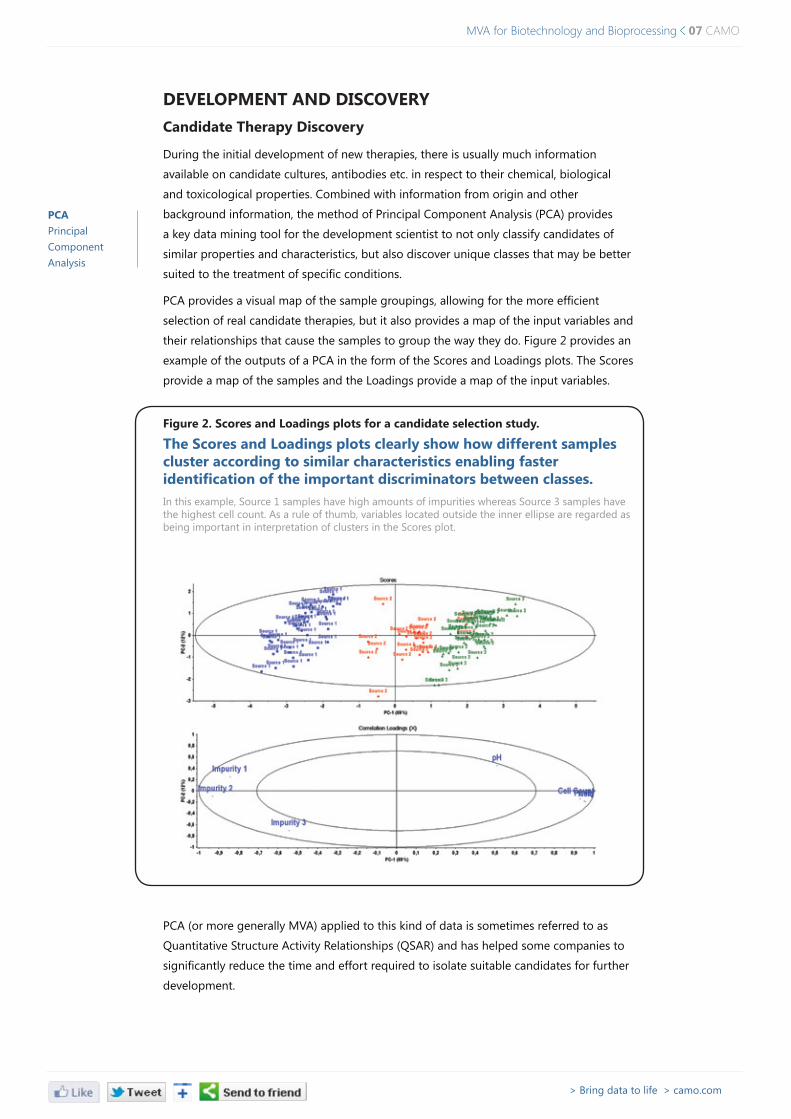
PCA provides a visual map of the sample groupings, allowing for the more efficient
selection of real candidate therapies, but it also provides a map of the input variables and
their relationships that cause the samples to group the way they do. Figure 2 provides an
example of the outputs of a PCA in the form of the Scores and Loadings plots. The Scores
provide a map of the samples and the Loadings provide a map of the input variables.
Figure 2. Scores and loadings plots for a candidate selection study.
The Scores and loadings plots clearly show how different samples cluster according to similar characteristics enabling faster identification of the important discriminators between classes. In this example, Source 1 samples have high amounts of impurities whereas Source 3 samples have the highest cell count. As a rule of thumb, variables located outside the inner ellipse are regarded as being important in interpretation of clusters in the Scores plot.
PCA (or more generally MVA) applied to this kind of data is sometimes referred to as
Quantitative Structure Activity Relationships (QSAR) and has helped some companies to
significantly reduce the time and effort required to isolate suitable candidates for further
development.
pCAPrincipal Component Analysis
> Bring data to life > camo.com
CAMO 08 MVA for Biotechnology and Bioprocessing
principal Component Analysis (pCA)PCA is a method for analyzing variability in data. It does this by separating the data into Principal Components (PCs). Each PC contributes to explaining the total variability, with the first PC describing the greatest source of variability. The goal is to describe as much of the information in the system as possible in the fewest number of PCs and whatever is left can be attributed to noise (i.e. no information).
Formulation of suitable products
Stabilising the candidate into a suitable matrix for manufacturing and delivery is best
approached using DoE, and in particular, excipient screening and mixture designs.
Excipient screening designs allow the formulation scientist to select the best
components that will preserve the nature of the candidate, while mixture designs allow
for the development of the best combination that will not only stabilise the candidate,
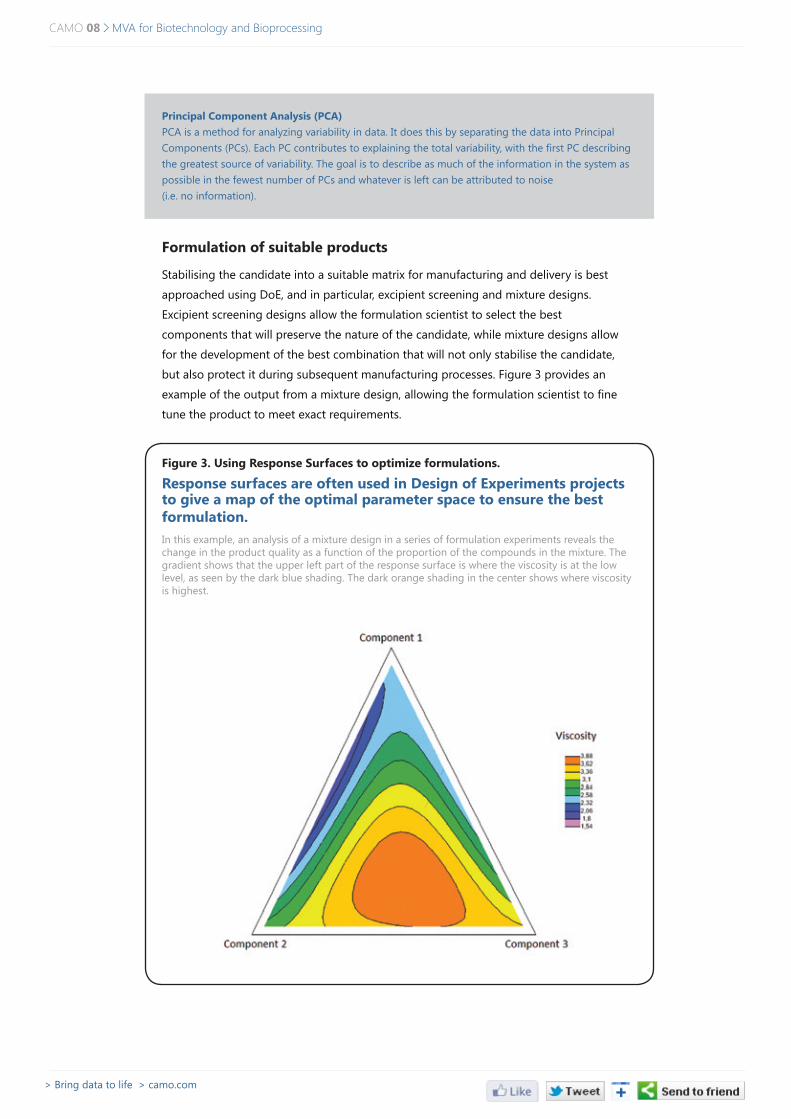
but also protect it during subsequent manufacturing processes. Figure 3 provides an
example of the output from a mixture design, allowing the formulation scientist to fine
tune the product to meet exact requirements.
Figure 3. Using Response Surfaces to optimize formulations.
Response surfaces are often used in Design of Experiments projects to give a map of the optimal parameter space to ensure the best formulation.In this example, an analysis of a mixture design in a series of formulation experiments reveals the change in the product quality as a function of the proportion of the compounds in the mixture. The gradient shows that the upper left part of the response surface is where the viscosity is at the lowlevel, as seen by the dark blue shading. The dark orange shading in the center shows where viscosity is highest.
> Bring data to life > camo.com

MVA for Biotechnology and Bioprocessing 09 CAMO
ClINICAl TRIAlSClinical trials have traditionally been the domain of univariate statistical approaches (in
particular clinical statistics) where statistical significance is assessed for parameters such
as efficacy and major side effects. The tools of MVA can be used to complement the
findings generated by clinical trial statistics to further confirm and accelerate key findings
through this phase of product development.
The ability to incorporate demographic, age, sex and patient history into predictive or
exploratory models is a unique feature of the MVA method, and approaches such as the
L-PLS model can provide an overall picture of the patient groups, disease markers and
the candidate properties to better assess the effect of the therapy on specific patient
groups. Figure 4 provides an example of the L-PLS model structure and an example
output.
l-plSThe ‘L’ shaped PLS (Partial Least Squares) model is an extension of the PLS method which allows three data tables to be analysed simultaneously. It is a highly investigative tool for analysing population data. L-PLS first finds the correlation between the Y-reference data with some external data collected on the system e.g. demographics in sensory data or chemical band assignments in spectroscopic data, so that important information is captured from Y-reference that may better model with X.
Figure 4. The l-plS model and its potential for clinical trial data analysis.
The l-plS model provides an insightful ‘map’ of how different variables and characteristics relate to each other.In this example, the variables in green describe the background information of the patients, the variables in blue are the side effects of the formulations (the actual formulations in light blue) and the red dots indicate patient groups. This combined plot is the most informative way of displaying the relationship between the three data tables depicted in the frame above.
Test Population
Test Population Satisfaction with Effects
Dem
ogra
phic
Info
rmat
ion
Test
Dru
gs
Test
Dru
gs
Z
X(Drug Effect)
Y
> Bring data to life > camo.com

CAMO 10 MVA for Biotechnology and Bioprocessing
MANUFACTURE AND CONTROlMVA tools for monitoring and controlling bioprocesses have helped manufacturers
worldwide make significant cost savings through proactive quality control. During the
scale up and technology transfer of a process from R&D to full scale manufacturing, the
use of DoE is a critical strategy for assessing the effect of changing process and equip-
ment variables. This allows the definition of the Design Space, which defines the most
effective control strategy for the process.
Multivariate Statistical Process Control (MSPC) uses multivariate exploratory and
predictive models and integrates them into the entire data collection and process control
system. This allows manufacturers to be more innovative in their approach to quality,
combining in-line process analytics into single or holistic process models that better
assess the quality of production than single measurements in isolation. Two particular
processes that are commonly used in biotherapy manufacture are fermentation and
lyophilisation. Some applications of MVA to these are discussed in the following sections.
Univariate analysis Univariate analysis is the simplest form of quantitative (statistical) analysis. The analysis is carried out with the description of a single variable and its attributes of the applicable unit of analysis. Univariate analysis is also used primarily for descriptive purposes, while multivariate analysis is geared more towards explanatory purposes. Source: Wikipedia
Advantages of Multivariate Analysis over Univariate analysisThe complex natural processes in biotechnology often have many interrelated variables, making it necessary to sample, observe, study or measure more than one variable simultaneously to understand a process or set of samples. Univariate statistics are limited by only looking at one variable at a time. Crucially, they often fail to detect the relationships that exist between variables because they treat all variables as independent of each other. For more information please see Figure 6.
MVA for fermentation batch monitoring
For many years manufacturers have been challenged with the development of suitable
models for monitoring the progress of batch processes, fermentation being one such
process. Batch models aim to establish a process trajectory and associated limits around
the trajectory that define the bounds of acceptable product quality.
Methods exist that unfold batch data and use so-called ‘maturity indices’ to model the
process. However, the major drawback of these methods is that they assume linear
relationships in the processes, which is fundamentally incorrect and has only partially
solved the batch problem.
Other approaches use time warping to distort the time scale and align batch trajectories.
Again, these approaches also suffer fundamentally as they distort the chemistry or
biology of the system and hence do not describe the true state of the process.
Relative Time Mapping (RTM) addresses the shortcomings of the previously defined
methods by keeping the chemistry/biology of the system intact, while at the same time,
providing the usual batch trajectory plots and associated diagnostics that have become
synonymous with batch analysis. Figure 5 overleaf provides some typical outputs from a
RTM Batch Modelling process.
RTMRelative Time Mapping: An innovative batch process monitoring approach
> Bring data to life > camo.com
MVA for Biotechnology and Bioprocessing 11 CAMO
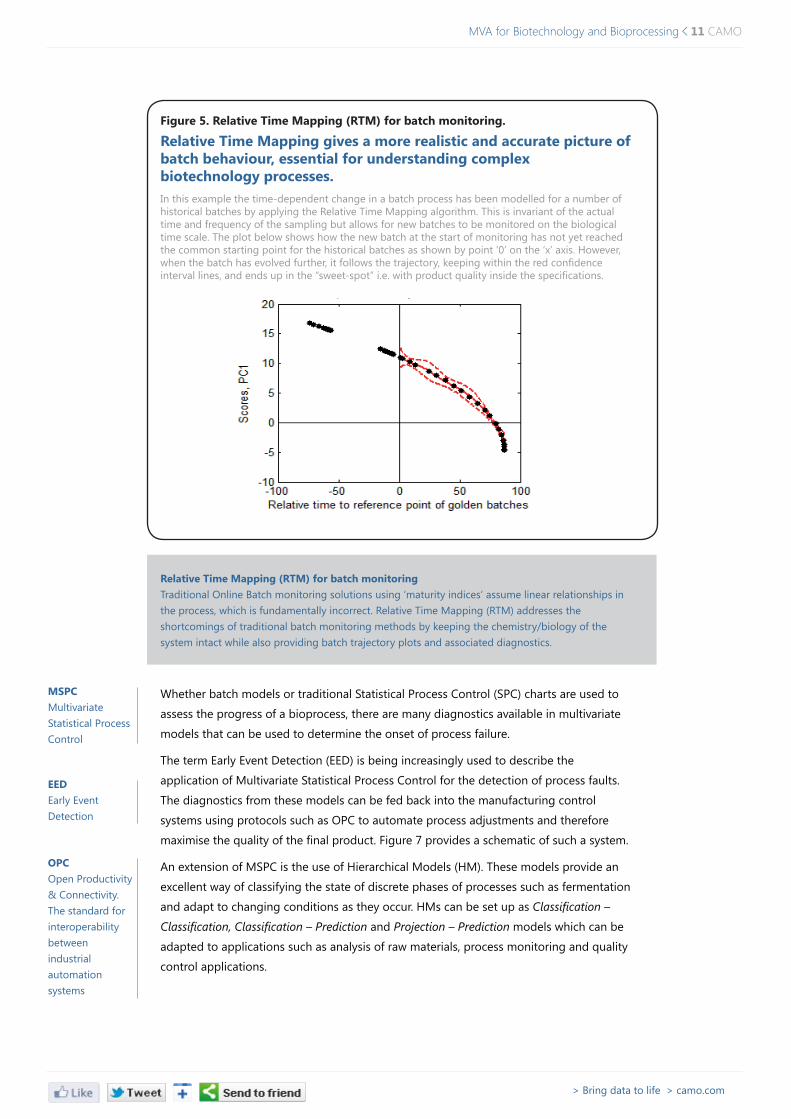
Figure 5. Relative Time Mapping (RTM) for batch monitoring.
Relative Time Mapping gives a more realistic and accurate picture of batch behaviour, essential for understanding complex biotechnology processes. In this example the time-dependent change in a batch process has been modelled for a number of historical batches by applying the Relative Time Mapping algorithm. This is invariant of the actual time and frequency of the sampling but allows for new batches to be monitored on the biological time scale. The plot below shows how the new batch at the start of monitoring has not yet reached the common starting point for the historical batches as shown by point ‘0’ on the ‘x’ axis. However, when the batch has evolved further, it follows the trajectory, keeping within the red confidence interval lines, and ends up in the “sweet-spot” i.e. with product quality inside the specifications.
Relative Time Mapping (RTM) for batch monitoringTraditional Online Batch monitoring solutions using ‘maturity indices’ assume linear relationships in the process, which is fundamentally incorrect. Relative Time Mapping (RTM) addresses the shortcomings of traditional batch monitoring methods by keeping the chemistry/biology of the system intact while also providing batch trajectory plots and associated diagnostics.
Whether batch models or traditional Statistical Process Control (SPC) charts are used to
assess the progress of a bioprocess, there are many diagnostics available in multivariate
models that can be used to determine the onset of process failure.
The term Early Event Detection (EED) is being increasingly used to describe the
application of Multivariate Statistical Process Control for the detection of process faults.
The diagnostics from these models can be fed back into the manufacturing control
systems using protocols such as OPC to automate process adjustments and therefore
maximise the quality of the final product. Figure 7 provides a schematic of such a system.
An extension of MSPC is the use of Hierarchical Models (HM). These models provide an
excellent way of classifying the state of discrete phases of processes such as fermentation
and adapt to changing conditions as they occur. HMs can be set up as Classification –
Classification, Classification – Prediction and Projection – Prediction models which can be
adapted to applications such as analysis of raw materials, process monitoring and quality
control applications.
MSpCMultivariate Statistical Process Control
EEDEarly Event Detection
OpCOpen Productivity & Connectivity. The standard for interoperability between industrial automation systems
> Bring data to life > camo.com

CAMO 12 MVA for Biotechnology and Bioprocessing
Multivariate Statistical process Control (MSpC)MSPC is fundamentally similar to traditional SPC, with the advantage of using powerful multivariate statistics which give a more holistic view of the process. As most processes involve several variables, MSPC is often more suited than basic SPC approaches. Additionally, multivariate process control can visualize all variables on 1 or 2 control charts, rather than many charts, simplifying the job for process operators and engineers.
hierarchical ModelsHierarchical models use logical sequences to refine the classification or prediction process that leads to a more precise result. They can be used with spectroscopy in the analysis of raw materials, where sub-models can be applied to resolve ambiguities, or can be used as a guided locally weighted regression tool for overcoming non-linear responses in process applications. They provide an excellent way of classifying the state of discrete phases in processes such as fermentation, and adapt to changing conditions as they occur.
Figure 6.
In many processes, the variables have important interactions affecting the outcome (e.g. final product quality) which cannot be detected by traditional univariate statistical process control charts. Comparing Univariate and Multivariate views of a simple process involving only two variables, Temperature and pH. In this case, the sample appears to be in specification when seen with two separate univariate control charts (Temperature Control Chart and pH Control Chart) but is actually out of specification when seen with the Multivariate view.
> Bring data to life > camo.com
4.623
23 25 27 29 31 33 35 37
16
1116
2126
3136
4146
51
25 27 29 31 33 35 37
4.8
5
5.2
5.4
5.6
5.8
6
4.61 6 11 16 21 26 31
Time(min)
pH
Temperature (c)
Tim
e(m
in)
36 41 46 51
4.8
5
5.2
5.4
5.6
5.8
6Multivariate view pH Control Chart
Only with multivariate analysis can the fault be detected
The univariate limits are too wide to detect a multivariate fault
The two variables under consideration are not independent
The "sweet spot" is defined by the ellipse
Tem
pera
ture
Con
trol
Cha
rt

MVA for Biotechnology and Bioprocessing 13 CAMO
QUAlITY CONTROl ApplICATIONS Although initiatives such as Process Analytical Technology (PAT) have been used by
many manufacturers globally to assess product and process quality at the point of
manufacture, not every process measurement can be replaced at the point of
manufacture. Quality Control (QC) operations are still vital in the final release stage of
some, if not all, products.
Due to the high variability in many biological assays, DoE and MVA can be used to
design and refine the analytical methods used in the QC laboratory and have been
successfully applied to the optimisation of chromatographic methods, the refinement of
sampling procedures and the analysis of complex data produced by mass spectrometers.
Another advantage of combining spectroscopic analysis with MVA methods is in
stability studies. Since the NIR method is non-destructive and is sensitive to changes in
the product and its matrix, the same sample can be assessed over the entire timeframe
of the study. Where applicable, this avoids the destruction of product and the results are
completely representative as the same sample is being assessed each time.
MVA for the assessment of lyophilised product quality
Near Infrared (NIR) spectroscopy has been used for many years with multivariate
predictive and exploratory models for the rapid, non-destructive assessment of
product quality. One common application of the NIR method is the quantitative analysis
of residual moisture in lyophilised products.
Lyophilisation is a common method used in the manufacture of biopharmaceutical
products as it uses low temperatures to remove residual moisture, thus preserving the
structure of the active components and allowing their storage at room temperature. The
traditional method of analysis for residual moisture in lyophilised product is Karl Fischer
(KF) titration, which is a destructive test and can only be applied to a small number of
samples.
Replacement of the KF method with NIR not only results in non-destructive testing, but
also allows for 100% inspection systems to be put in place. These systems use MVA
predictive models to transform the NIR spectrum into a single value for residual moisture
(or other properties) and are used to accept and reject product as it is being
manufactured.
In one case, a biopharmaceutical manufacturer saved approximately $1 million USD by
using the NIR method combined with PCA to validate the performance of a new freeze
dryer. They also developed a quantitative Partial Least Squares Regression (PLSR) model
to replace the KF method in the laboratory. This method saves them $1,000 USD per
sample and provides more confidence when releasing the batch to market.
Applications of MVA in Quality Control
Non-destructive quality checks
More representative sampling
100% real-time spectroscopic inspection
NIRNear Infrared
plSRPartial Least Squares Regression
pATProcess Analytical Technology
> Bring data to life > camo.com
CAMO 14 MVA for Biotechnology and Bioprocessing
ApplYINg ADVANCED ANAlYTICS ACROSS ThE pRODUCT lIFECYClE: pUTTINg IT All TOgEThER MVA and DoE are fast becoming essential tools for all process development and
monitoring applications. Bioprocesses provide an excellent, but challenging application
area. Modern manufacturing execution systems and control platforms produce a massive
amount of data that requires the tools of MVA to fully ‘data mine’ the most important
information and make real-time quality decisions.
From raw material analysis to final product release, MVA models can be integrated into
the total Quality Management System (QMS) allowing manufacturers to realise the
benefits of the Quality by Design (QbD) initiative.
Figure 6 provides an overall schematic on how MVA can be applied within an existing
manufacturing plant. By implementing such procedures the full economic and cost
saving benefits can be achieved from the discovery and development phase, to scale up,
manufacturing and final release.
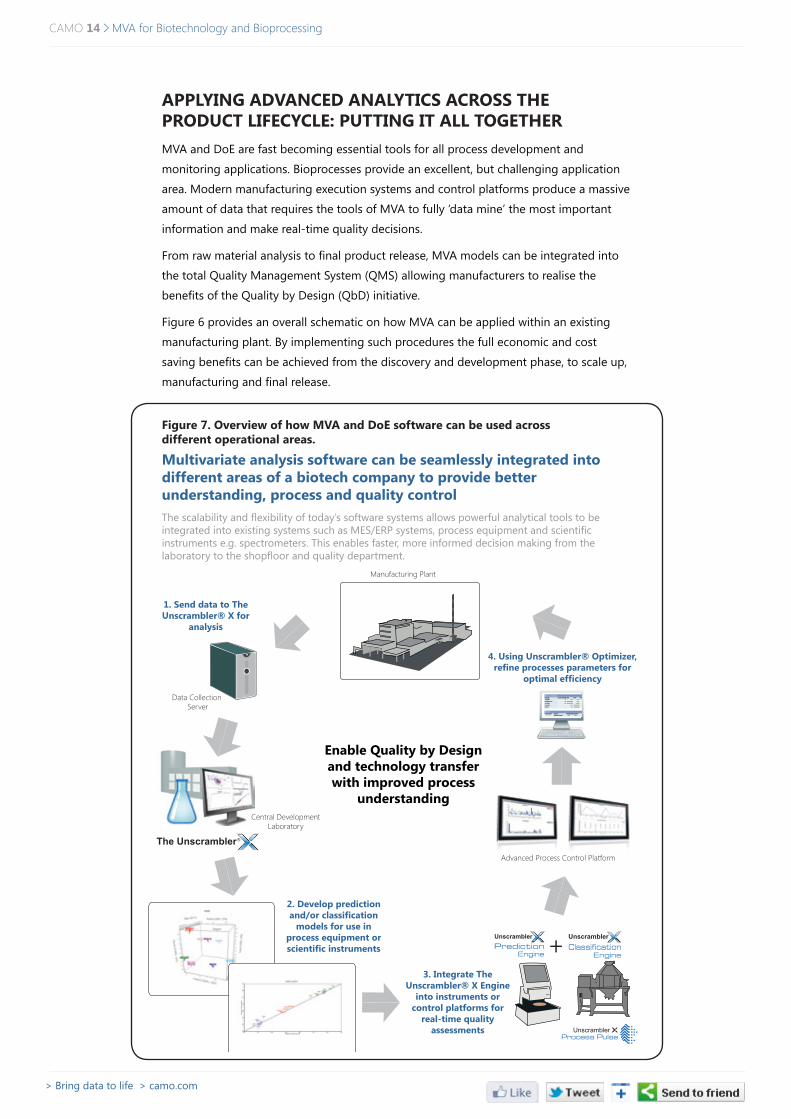
Figure 7. Overview of how MVA and DoE software can be used across different operational areas.
Multivariate analysis software can be seamlessly integrated into different areas of a biotech company to provide better understanding, process and quality controlThe scalability and flexibility of today’s software systems allows powerful analytical tools to be integrated into existing systems such as MES/ERP systems, process equipment and scientific instruments e.g. spectrometers. This enables faster, more informed decision making from the laboratory to the shopfloor and quality department.
> Bring data to life > camo.com
Advanced Process Control Platform
Manufacturing Plant
Data Collection Server
Central Development Laboratory
3. Integrate The Unscrambler® X Engine
into instruments or control platforms for
real-time quality assessments
4. Using Unscrambler® Optimizer, refine processes parameters for
optimal efficiency
Enable Quality by Design and technology transfer with improved process
understanding
2. Develop prediction and/or classification
models for use in process equipment or scientific instruments
1. Send data to The Unscrambler® X for
analysis
+
MVA for Biotechnology and Bioprocessing 15 CAMO
CONClUSION
Multivariate data analysis and Design of Experiments are powerful tools ideally suited for
understanding the complex behaviour and relationships in biological systems.
These methods can be used across the full biotech product lifecycle, from discovery and
development, to scale up, production and quality control. Today’s leading MVA and DoE
solutions can be seamlessly integrated with other systems including process equipment,
laboratory and spectroscopy instruments, enabling faster and more informed decision
making.
Leading biotechnology companies which implement and exploit the power of MVA and
DoE can realize substantial benefits including lower development and production costs,
improved product quality, technology transfer, faster time to market and ultimately
increased business value.
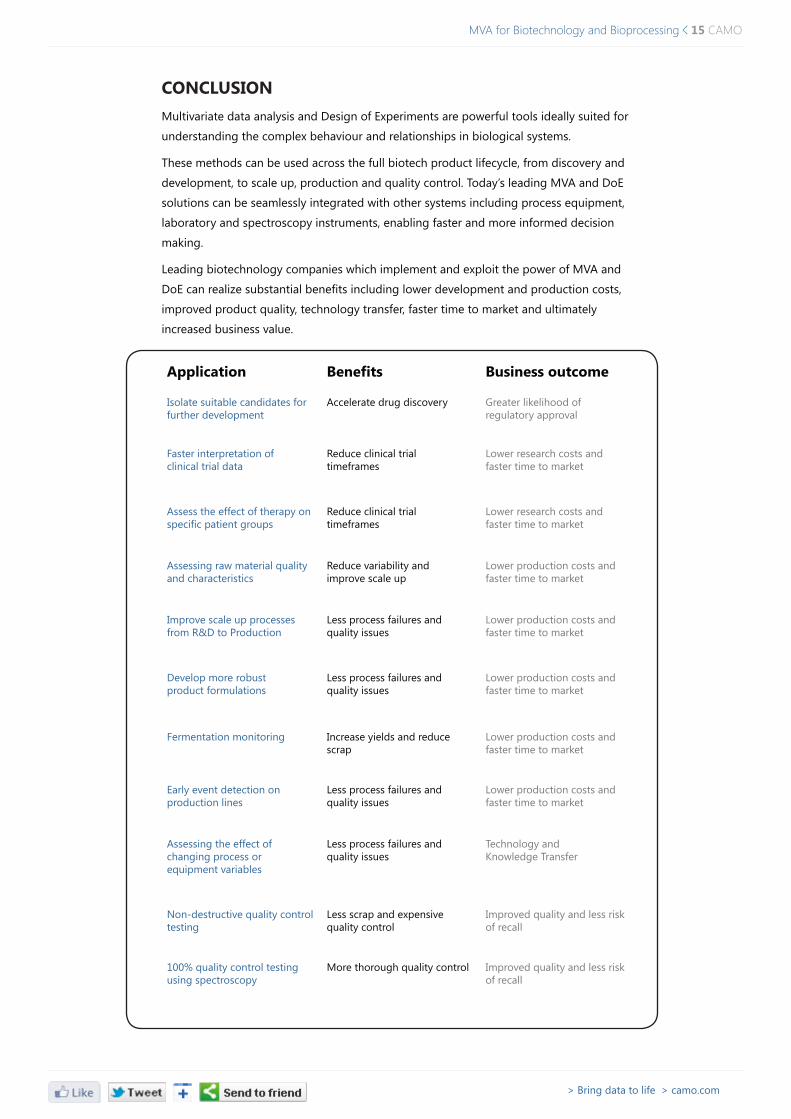
Application Benefits Business outcome
Isolate suitable candidates for further development
Accelerate drug discovery Greater likelihood of regulatory approval
Faster interpretation of clinical trial data
Reduce clinical trial timeframes
Lower research costs and faster time to market
Assess the effect of therapy on specific patient groups
Reduce clinical trial timeframes
Lower research costs and faster time to market
Assessing raw material quality and characteristics
Reduce variability and improve scale up
Lower production costs and faster time to market
Improve scale up processes from R&D to Production
Less process failures and quality issues
Lower production costs and faster time to market
Develop more robust product formulations
Less process failures and quality issues
Lower production costs and faster time to market
Fermentation monitoring Increase yields and reduce scrap
Lower production costs and faster time to market
Early event detection on production lines
Less process failures and quality issues
Lower production costs and faster time to market
Assessing the effect of changing process or equipment variables
Less process failures and quality issues
Technology and Knowledge Transfer
Non-destructive quality control testing
Less scrap and expensive quality control
Improved quality and less risk of recall
100% quality control testing using spectroscopy
More thorough quality control Improved quality and less risk of recall
> Bring data to life > camo.com

CAMO SOFTWARE pRODUCTS & SERVICESOur powerful yet easy to use and affordable solutions are applied around the world in awide range of industries
The Unscrambler® XLeading multivariate analysis software used by thousands of data analysts around the world every day. Includes powerful regression, classification and exploratory data analysis tools. trial vErsioN rEaD morE
Unscrambler® X prediction Engine & Classification EngineSoftware integrated directly into analytical or scientific instruments for real-time predictions and classifications directly from the instruments using multivariate models. trial vErsioN rEaD morE
Unscrambler® X process pulseReal-time process monitoring software that lets you predict, identify and correct deviations in a process before they become problems. Affordable, easy to set up and use. trial vErsioN rEaD morE
Consultancy and Data Analysis ServicesDo you have a lot of data and information but don’t have resources in house or time to analyze it? Our consultants offer world-leading data analysis combined with hands-on industry expertise. rEaD morE coNtact us
TrainingOur experienced, professional trainers can help your team use multivariate analysis to get more value from your data. Classroom, online or tailored in-house training courses from beginner to expert levels available. rEaD morE coNtact us
Our partnersCAMO Software works with a wide range of instrument and system vendors. For more information please contact your regional CAMO Software office or visit www.camo.com/partners
www.camo.com
NORWAYNedre Vollgate 8,N-0158OsloTel: (+47) 223 963 00Fax: (+47) 223 963 22
USAOne Woodbridge CenterSuite 319, WoodbridgeNJ 07095Tel: (+1) 732 726 9200Fax: (+1) 973 556 1229
INDIA14 & 15, Krishna ReddyColony, Domlur LayoutBangalore - 560 071Tel: (+91) 80 4125 4242Fax: (+91) 80 4125 4181
JApANShibuya 3-chome Square Bldg 2F3-5-16 Shibuya Shibuya-kuTokyo, 150-0002Tel: (+81) 3 6868 7669Fax: (+81) 3 6730 9539
AUSTRAlIAPO Box 97St PetersNSW, 2044Tel: (+61) 4 0888 2007
© 2012 CAMO Software AS
Find out moreFor more information please contact your regional CAMO office or email [email protected]
Did you find this useful? Send it to a friend or share it in your network.