Embed Size (px)
Citation preview

Multiuser interference analysis of
MC-CDMA system using various spreading
sequences
Ki-Chun Cho
The Graduate School
Yonsei University
Department of Electrical and Electronic
Engineering

Multiuser interference analysis ofMC-CDMA system using various
spreading sequences
Ki-Chun Cho
A Thesis Submitted to the
Graduate School of Yonsei University
in Partial Fulfillment of the
Requirements for the Degree of
Master of Science
Supervised by
Professor Hong-Yeop Song, Ph.D.
Department of Electrical and Electronic EngineeringThe Graduate School
YONSEI University
December 2005

This certifies that the thesis ofKi-Chun Cho is approved.
Thesis Supervisor: Hong-Yeop Song
Jong-Moon Chung
Soo-Yong Choi
The Graduate SchoolYonsei UniversityDecember 2005

ÇÔ+ ;³
<ÆëH_ ÀDK¦ îߦ @/<Æ"é¶\ 9<Æ ~ M: \OÕª]j °ú ÉrX< ZO+ a%¦\O 7HëH_
t¦ 1pu> ÷&%3ܼm, [jZ4s Ļúü< °ú 6£§¦ Dh zy½+Ëm. ]j Òqt\
e#Q"f ×æ¹כôÇ rl\¦ ©dôÇ @/<Æ"é¶ $3 ÒqtÖ¦ y "f, Õª 1lxîß_ 2[
\¦ [tÐ /'¹¡§õ Êêr ú§s z_þvm. tëß ·ú¡\ Z~ 7HëH¦ Ð
9, ÍÒ1pw<Êõ <Êa, \"f #QÐ ¹¡§¦ ÅÒ ú§Ér ìr[þt\ @/ôÇ ¦¹¡§¦ Ö¼
z"f, s o\¦ yn=#Q y_ 6£§¦ /åJÐ @/ ¦ ½+Ëm.
$$\¦<ÆëH_UÐKÅÒr¦<ÆëH\@/ôÇ\P&ñ¦Gn|9 r"ft
KÅÒ 5Åx<ª\P §Ãº_a y×¼wnm. ¢ôÇ #QÐ ÂÒ7á¤ôÇ ]j 7HëH¦ Ð
KÅÒr¦ 8 Ér 7HëHs ÷&2¤ ,\OH õ 9\¦ ÅÒ &ñ7áxëH §Ãº_õ
þjú6 x §Ãº_a y×¼wnm. Õªµ1Ú\ <ÆëH H [j\ e#Q"f #3¦ Ð#
ÅÒr¦ 9\¦ ÅÒ ú§Ér §Ãº_[þta y×¼wnm.
@/<Æ"é¶ÒqtÖ¦K "f,°ú Ér<ÆëH_U\3lu 21lxîß1lx¦1lx|ÃÌÙþ¡~
½z ÊêC[þtõ 1lxl[þt $\> H j˵s ÷&%3_þvm. ½z +þA %i½+ɦ ú
KÅÒ îr³ð +þA, FbH ú¦ ú§s KÅÒ lô ¥ +þA, ½ ~½Ó¾Ó¦ ú 9Qïr @/
+þA, ëH$íõ Fu\¦ Ð#ïr ïr$í +þA, ½Ó© b6£§fôÇ %òïr +þA, ½z¦ ú§s
z~ $36 x C, Õþeyõ Ä» Q\¦ q # ½z ìr0Al\¦ ú s=åJ%3~ ÅÒ%ò
+þA, Õªo¦ \P\"f <ÆëH¦ q2© # #Qt\¦ ú@pu¦ ÅÒ $3ô ¥ +þA\> U·Ér
y\¦ ×¼wnm. ¢, \P&ñ&h $í , úFçßeH ©³, 1pufôÇ I_, ÃÌôÇ &³%ò,
Õªo¦$ízôÇ7áx $\> ú§Érj˵s÷&%3ܼm¦¹¡§¦½+Ëm.©ôÇ
$3 +þA, |9×æ§4 y©ôÇ $íïrs, Õªo¦ >á¤>ᤠ¦ ú§Ér¦כ ü<ïr qÖæ\> ¦
¹¡§¦ ½+Ëm. ¢ôÇ sp r y ìr\"f Ö1lx r"f lr e¦M:
a%~Ér ú@pu¦ [þt9ÅÒ$4~ a%¦\O C_[þt\> y\¦ ³ð½+Ëm.
a%¦\O¦ >÷<, ÒqtÖ H 1lxîß \"f _t ÷&¦ ú§Ér ¹¡§¦ ïr
l/BN<Æõ ÊêC[þtõ 1lxl[þt\> y\¦ ½+Ëm. :£¤y 11lxîß s

ÒqtÖ 9 #Qt\¦ ü<ïr 5px +þAõ &³Äº, Õªo¦ <ÆëH&hܼРú§Ér ¦כ
ØÔ5gÅÒ¦ ü<ïr âo= +þAõ â\> ¦¹¡§¦ ½+Ëm. ¢, ½ [jZ41lxîß Äº
&ñ¦ Ä»t 9 ½Ó© $\¦ 6£x"é¶Kïr ú§Ér 2;½[þtõ C_[þt\> y×¼wnm.
Õªo¦ f #Q2; $\¦ b#QÅÒ¦ 9KÅÒ 9ü< 2;'[þta Õª1lxîß_ 'adõ
жúi\ @/K y_ ú@pu¦ ½+Ëm.
_ 9¦ ú K"f ú§Ér 'ad¦ ïr ¾º úõ \Pdy ÒqtÖ ¦ e
H 1lxÒqt F+þAs\> Õª 1lxîß_ b6£§õ 9 ¦Ö¦ 2£§9m. =åQܼР]j
H 9¦ b6£§Ü¼Ð t&ú<ÅÒr¦ ,\OH |½Ó¦ ÅÒr 9, ]j Òqt_ Uú
s ÷&#QÅÒ ÂÒ_a ÁºôÇôÇ y\¦ ×¼o 9, Õª 1lxîß_ zs | s 7HëH
¦ 9m.
2005 12Z4
¿ e § > ×¼aË>

Contents
List of Figures iv
List of Tables v
Abstract vi
1 Introduction 1
1.1 Motivation . . . . . . . . . . . . . . . . . . . . . . . . . . . . . . . . . 1
1.2 Overview . . . . . . . . . . . . . . . . . . . . . . . . . . . . . . . . . 3
2 MC-CDMA system model 5
2.1 Transmitter . . . . . . . . . . . . . . . . . . . . . . . . . . . . . . . . 5
2.2 L-multipath channel model . . . . . . . . . . . . . . . . . . . . . . . . 6
2.3 Receiver . . . . . . . . . . . . . . . . . . . . . . . . . . . . . . . . . . 7
3 Multiuser interference and spectral correlation 9
3.1 The Detection model . . . . . . . . . . . . . . . . . . . . . . . . . . . 9
3.2 Interference analysis according to combining methods .. . . . . . . . . 11
3.2.1 Maximal Ratio Combining (MRC) . . . . . . . . . . . . . . . . 11
i

3.2.2 Equal Gain Combining (EGC) . . . . . . . . . . . . . . . . . . 14
3.2.3 Orthogonality Restoring Combining (ORC) . . . . . . . . . .. 17
3.2.4 Minimum Mean Square Error Combining (MMSEC) . . . . . . 17
3.3 Spectral correlation according to interleaver . . . . . . .. . . . . . . . 19
3.4 Simulation results . . . . . . . . . . . . . . . . . . . . . . . . . . . . . 21
3.4.1 Channel model (1) . . . . . . . . . . . . . . . . . . . . . . . . 21
3.4.2 Channel model (2) . . . . . . . . . . . . . . . . . . . . . . . . 28
4 Requirements of frequency spreading sequences 37
5 Spectral correlation profile 39
6 Concluding Remarks 46
Bibliography 49
Abstract (in Korean) 53
ii

List of Figures
2.1 MC-CDMA transmitter model . . . . . . . . . . . . . . . . . . . . . . 6
2.2 MC-CDMA receiver model . . . . . . . . . . . . . . . . . . . . . . . . 8
3.1 Spectral correlation: |X(8,1)WH8
(l)| for Q = 1 . . . . . . . . . . . . . . . 20
3.2 Spectral correlation: |X(8,1)WH8
(l)| for Q = 4 . . . . . . . . . . . . . . . 20
3.3 BER performance using MRC, EGC (Users:4, Paths:2) . . . . .. . . . 23
3.4 BER performance using MMSEC, ORC (Users:4, Paths:2) . . .. . . . 23
3.5 Spectral correlation: X(6,5)WH8
(l) . . . . . . . . . . . . . . . . . . . . . . 24
3.6 Spectral correlation: X(7,5)WH8
(l) . . . . . . . . . . . . . . . . . . . . . . 24
3.7 Spectral correlation: X(8,5)WH8
(l) . . . . . . . . . . . . . . . . . . . . . . 24
3.8 Spectral correlation: X(3,2)WH8
(l) . . . . . . . . . . . . . . . . . . . . . . 25
3.9 Spectral correlation: X(5,2)WH8
(l) . . . . . . . . . . . . . . . . . . . . . . 25
3.10 Spectral correlation: X(8,2)WH8
(l) . . . . . . . . . . . . . . . . . . . . . . 25
3.11 BER performance using MRC, EGC (Users:4, Paths:4) . . . .. . . . . 26
3.12 BER performance using MMSEC, ORC (Users:4, Paths:4) . .. . . . . 26
3.13 BER performance for Walsh-Hadamard using MRC (Users:2) . . . . . 29
3.14 BER performance form-sequence Hadamard using MRC (Users:2) . . 29
iii
3.15 BER performance form-sequence Hadamard using MRC (Users:2) . . 30
3.16 BER performance for Walsh-Hadamard andm-sequence Hadamard us-
ing MMSEC (Users:4) . . . . . . . . . . . . . . . . . . . . . . . . . . 32
3.17 Spectral correlation:∑
u=2,3,4 X(u,1)WH8
(l) . . . . . . . . . . . . . . . . . 32
3.18 Spectral correlation:∑
u=3,5,8 X(u,2)WH8
(l) . . . . . . . . . . . . . . . . . 33
3.19 Spectral correlation:∑
u=3,7,8 X(u,1)MH8
(l) . . . . . . . . . . . . . . . . . 33
3.20 Spectral correlation:∑
u=2,3,5 X(u,1)MH8
(l) . . . . . . . . . . . . . . . . . 33
3.21 BER performance for Walsh-Hadamard andm-sequence Hadamard us-
ing MMSEC (Users:8) . . . . . . . . . . . . . . . . . . . . . . . . . . 34
3.22 Spectral correlation:∑
u 6=1 X(u,1)WH8
(l) . . . . . . . . . . . . . . . . . . 35
3.23 Spectral correlation:∑
u 6=1 X(u,1)MH8
(l) . . . . . . . . . . . . . . . . . . 35
5.1 BER performance of Zadoff-Chu and other sequence (Users:8, Paths:8) 43
5.2 Spectral correlation: X(3,1)Chu8
(l) . . . . . . . . . . . . . . . . . . . . . . 43
5.3 Spectral correlation: X(2,1)MH8
(l) . . . . . . . . . . . . . . . . . . . . . . 44
5.4 Spectral correlation: X(2,1)OG8
(l) . . . . . . . . . . . . . . . . . . . . . . 44
5.5 Spectral correlation: X(2,1)QH8
(l) . . . . . . . . . . . . . . . . . . . . . . 44
iv

List of Tables
3.1 Simulation parameters(1) . . . . . . . . . . . . . . . . . . . . . . . . .22
3.2 Simulation parameters(2) . . . . . . . . . . . . . . . . . . . . . . . . .27
3.3 ReqiredEb/No according to combining methods . . . . . . . . . . . . 27
3.4 Simulation parameters(3) . . . . . . . . . . . . . . . . . . . . . . . . .30
3.5 Maximum absolute value and requiredEb/No for target BER10−5 . . . 30
5.1 Simulation parameters(4) . . . . . . . . . . . . . . . . . . . . . . . . .43
v

ABSTRACT
Multiuser interference analysis of MC-CDMA systemusing various spreading sequences
Ki-Chun ChoDepartment of Electricaland Electronic Eng.The Graduate SchoolYonsei University
For effective communication over frequency selective fading channels, multicarrier
systems have been proposed as a scheme to enable high data rate transmission. Based on
this perspective, MC-CDMA systems, which is a combination of multicarrier systems
and CDMA, have been widely studied to achieve high user capacity. Applying frequency
diversity techniques based on spreading and combining datain the frequency domain can
results in a gain. When MC-CDMA technology is applied, frequency selectivity distorts
the amplitude and phase of the subcarriers, which breaks theorthogonality of the users
and as a result the multiuser interference increases. Therefore, effective control of the
interference could lead to a performance improvement.
MC-CDMA systems use frequency spreading sequences to separate multiusers. As
time spreading sequence characteristics affect the user capacity and system performance
of DS-CDMA, frequency spreading sequence characteristicsmay affect those of MC-
vi

CDMA systems. Spectral correlation is introduced as one of the methods to analyze
MUI with spreading sequences. This can be derived from a received signal expression,
and it differs from the conventional correlation properties which focus on time domain.
In multipath channels, the received signal can be expressedas a sum of many signals
multiplied by distinct channel coefficients. And this kind of distinct power and time de-
lay of multipath results in amplitude and phase variation ofspreading sequences, which
brings distortion of orthogonality among users. Spectral correlation shows features of
frequency spreading sequences including multipath time delay.
In this paper, we define the spectral correlation more clearly than conventional one to
be suited to downlink MC-CDMA system. And we can observe the expression of MUI
and control MUI with spreading sequence properties by usingthe spectral correlation.
L-multipath Rayleigh fading channels and multicarrier system are considered. MRC,
EGC, ORC, MMSEC are applied for combining methods. In this system, we observe
the relation between MUI and spectral correlation and derive the expression of MUI
based on sequence properties. And confirmation by simulation follows to investigate
system performance related to those properties. As a result, for MRC, it was shown that
MUI could be expressed as product of 3 terms: data symbol, channel elements, spectral
correlation, and it was observed that spectral correlationdirectly affected MUI. Here,
it was examined that the maximum absolute value of spectral correlation played a ma-
jor role to determine system performance, and good randomness of sequence made the
maximum absolute value small. Therefore, if spectral correlation atl′ was 0, correspond-
ing interference component became 0. And the system performances for 2 users using
Walsh-Hadamard andm-sequence Hadamard to reach target BER10−5 are examined.
vii

As a result, the best case using Walsh-Hadarard has 25.7dB and performance deviation
of 4.3dB, but the worst case usingm-sequence Hadamard has 25.7dB and performance
deviation of 0.9dB. For EGC, a similar conclusion could be obtained by approximation,
and performance differences relevant to spectral correlation were shown. For MMSEC,
the performance difference was also given. From the above spectral correlation proper-
ties, it can be known that the requirements of frequency spreading sequences are as fol-
lows: orthogonality of spreading sequences, small spectral correlation value, and good
randomness. And spectral correlation profile informs us of how the amplitude and phase
of the received signal are changed and how it affects the system performance. As a
result, the system using Zadoff-Chu sequence and BPSK modulation gained 3dB as op-
posed to using other sequences. Therefor, the MUI of MC-CDMAcan be estimated by
using spectral correlation, and sequences which is constructed based on the above fact
and allocation of selected sequences to some users can lead better system performance
and reduced deviation of system performances.
Key words : MC-CDMA, spectral correlation, multiuser interference, rayleigh fad-ing channel, frequency spreading sequences, combining,
viii

Chapter 1
Introduction
1.1 Motivation
CDMA (Code Division Multiple Access) is multiple access system which can transmit
many user’s signal simultaneously using code or sequence, and a multiple access sys-
tem based on direct sequence CDMA has achieved great importance for mobile radio
applications [1] [2]. Recently, CDMA technique has been considered to be a candi-
date to support multimedia services in mobile radio communications [3], because it has
its own capabilities to cope with asynchronous nature of multimedia data traffic, to pro-
vide higher capacity over conventional access techniques such as TDMA (Time-Division
Multiple Access) and FDMA (Frequency-Division Multiple Access).
On the other hand, an interesting approach to combat the distortions due to multipath
propagation in mobile communications based on multicarrier (MC) systems is consid-
ered. That system often called OFDM (Orthogonal frequency division multiplexing) is
applied to combat the frequency selectivity of the channel using a simple one tap equal-
izer. Furthermore OFDM prevents ISI (Inter Symbol Interference) and ICI (Inter Carrier
Interference) by inserting a guard interval between adjacent OFDM symbols [4] [5] [6].
1

The efficient combination of multicarrier modulation technique, i.e., OFDM with
CDMA, known as MC-CDMA has gained considerable attention both from academia
and industry as a promising technique for high datarate wireless communications sys-
tems [7] [8] [9]. MC-CDMA possesses the ability to mitigate severe multipath inter-
ference and the possibility to exploit the frequency diversity by spreading across sub-
carriers. Moreover, thanks to the guard interval between consecutive OFDM symbols,
MC-CDMA is an ISI free system as long as the delay spread of thechannel is shorter
than the guard interval. In addition to these properties, MC-CDMA possesses other ad-
vantages like efficient utilization of bandwidth, flexible resource management and ability
to generate different data rates within a fixed bandwidth [10]. However, through a fre-
quency selective fading channel, all the subcarriers have different amplitude levels and
different phase shifts (although they have high correlation among subcarriers), which
breaks the orthogonality among theses sequences, and resulting multiuser interference
(MUI) drastically reduces the system performance[8] [11] [12].
MC-CDMA system seriously suffers from performance degradation resulted from
MUI. Consequently, an effective scheme to manage MUI from analyzing it is required.
As time-domain autocorrelation and crosscorrelation function have been efficiently used
as criteria for measuring MUI for DS-CDMA systems, spreading sequences may affect
MC-CDMA system. Especially, selected sequence allocationin a sequence family may
cause performance difference [13]. But time-domain correlation functions are not proper
ways to look into MUI of MC-CDMA systems. Hence, it is essential to observe the
characteristic of spreading sequences including the effect of multipath delay.
There is a method to analyze the performance of MC-CDMA system, named as
2

spectral correlation function [14]. This can be evaluated from the expression of the
received signal in MC-CDMA system, which differs from the conventional time-domain
correlation function which has been applied for observing the correlation characteristic
among codes in DS-CDMA. In multipath channels, the receivedsignal is the sum of
transmitted signals passing through different paths. And that results in distortion of
codes. Spectral correlation function, a method of observing characteristics of codes
including multipath delay, reflects features of codes and time delay. Therefore, spectral
correlation could be a criterion measuring MUI in MC-CDMA system.
It is a goal of this paper to study a method suppressing MUI using spreading se-
quences from analyzing the relation between MUI and spreading sequences for MC-
CDMA. In this study, we consider L-multipath channel and MC-CDMA system, and
MRC, EGC, MMSEC, ORC which are well-known detection techniques for a single
user. In the above system, we analyze the relation between MUI and spreading sequence
using spectral correlation and how the characteristic of the sequence affects MUI. Also,
the requirements of spreading sequences to improve system performance are derived,
and what characteristic MUI has according to spreading sequence is observed.
1.2 Overview
Chapter 2 gives the description of MC-CDMA system model which covers a transmitter,
a receiver and L-multipath channel model. In Chapter 3, MUI analysis according to
4 combining methods and how to explain MUI using spectral correlation are carried
out. And spectral correlation is derived based on the general system model with serial-
to-parallel (S/P) and interleaver, and its physical meaning is investigated. And related
3

simulation results are shown. In Chapter 4, a summary of the requirements of codes to
mitigate MUI is given. In Chapter 5, we introduce a spectral correlation profile which
gives us knowledge of form of MUI. Finally, Chapter 6 draws conclusions and future
work.
4

Chapter 2
MC-CDMA system model
2.1 Transmitter
Figure 2.1 is MC-CDMA transmitter model. Input bit stream ismapped onto modulated
data symbols through modulation and pass a serial-to-parallel (S/P) block. TheQ num-
ber of data symbols are arranged in parallel and passQ number of copiers to be copiedN
number of chips respectively. The copiedN chips are multiplied by chips of frequency
spreading sequence of lengthN , c(u)n N−1
n=0 , where(u) represents a user. At this time,
total number of subcarriers isQN . Chip-interleaver takesN number of spreaded chips
of q-th data symbol on(q +Qn)-th subcarrier, wheren = 0, 1, 2, ..., N −1. Inverse Fast
Fourier Transform (IFFT) is applied to theseQN subcarriers and transmitted signal of
time durationT is generated. The complex baseband representation of the transmitted
signal on a(q + Qn)-th subcarrier,sq+Qn(t), in a signaling interval,T , can be written
as:
sq+Qn(t) =
√
Es
N
U−1∑
u=0
b(u)q c(u)
n ej2π(q+Qn)t/T , (2.1)
5

)(
0
uc
)(
1
u
Nc
)(
0
uc
)(
1
u
Nc
Q
Figure 2.1: MC-CDMA transmitter model
and total representation of the transmitted signal can be written as:
s(t) =
√
Es
N
U−1∑
u=0
Q−1∑
q=0
N−1∑
n=0
b(u)q c(u)
n ej2π(q+Qn)t/T , (2.2)
whereEs andb(u)q are the energy per data symbol and theq-th data symbol of(u)-th
user respectively.N is the length of frequency spreading sequence, andU is the number
of users.
2.2 L-multipath channel model
A wideband fading channel can be modelled as a sum of several differently delayed,
independent Rayleigh fading processes. The correspondingchannel impulse response
(CIR) is described as:
h(t, τ) =
L−1∑
l=0
al · hl(t)δ(τ − τl), (2.3)
whereal is the normalized amplitude such that∑L=1
l=0 a2l = 1.0, hl(t) is the Rayleigh
fading process withE[
|hl|2]
= 1.0, andδ(·) is the Dirac function.τlL−1l=0 is the delay
6
of the l-th path, andl is tap index of channel impulse response model [15].
For a multipath Rayleigh fading channel, the fading processcan be represented by
hl = αlejφl , whereαlL−1
l=0 , φlL−1l=0 are the random CIR tap amplitudes, phases,
respectively. We assume thatαlL−1l=0 , φlL−1
l=0 , τlL−1l=0 are mutually independent.
Fading amplitudesαlL−1l=0 are assumed to be statistically independent random variables
having a probability density function (PDF) expressed as:
f(αl) =2αl
Ωexp
(
−α2l
Ω
)
, (2.4)
whereΩ = E[α2l ]. The phasesφlL−1
l=0 of the different paths and of different subcarriers
are assumed to be uniformly distributed random variables in[0, 2π) [16], while the path
delay ofτlL−1l=0 are uniformly distributed in[0, Tmax], whereTmax is maximum delay
spread.
2.3 Receiver
A block diagram of the baseband model of the MC-CDMA receiverfor user(0) is rep-
resented on Figure 2.2. The signal received by user(0) during the symbol interval is
first OFDM-demodulated by applying an Fast Fourier Transform (FFT) of sizeQN and
despreaded with the(0)-th user’s spreading sequence.wnQN−1n=0 is a frequency do-
main equalization gain factor, which is dependent upon the employed diversity combin-
ing scheme. Combined data symbols are inserted into parallel-to-serial (P/S) block and
demapped to binary bit stream.
7

NQw
1
*)0(
0c
*)0(
1Nc
*)0(
0c
*)0(
1Nc
0w
1Nw
1QNw
Figure 2.2: MC-CDMA receiver model
8

Chapter 3
Multiuser interference and spectralcorrelation
In this chapter we investigate the received signal according to combining methods and
analyze the multiuser interference using spectral correlation. In section 3.1, we look into
the expression of the received signal. In section 3.2, multiuser interference according
to combining methods is derived and spectral correlation isdefined. And how spectral
correlation affects the multiuser interference and what meaning it has are derived. In
section 3.3, spectral correlation is applied to more general system with chip interleaver.
Simulation results supporting derived conclusion are showed in section 3.4.
3.1 The Detection model
From Figure 2.2, guard interval is removed from received signal and FFT is applied to
the signal. The FFT demodulated received symbolrq+QnN−1n=0
Q−1q=0 of the(q + Qn)-
th subcarrier can be expressed as:
rq+Qn =
√
Es
N
U−1∑
u=0
b(u)c(u)n Hq+Qn + Nq+Qn, (3.1)
9

whereHq+Qn is the(q + Qn)-th subcarrier’s frequency domain channel transfer factor,
andNq+Qn is a AWGN process having zero mean and a one-sided power spectral density
of No. In restoring arbitrary fixedq′-th data symbol amongQ number of parallel data
symbols, the decision variable of the(0)-th user’sq′-th data symbol,d(0)q′ , is given for a
single user detector as:
d(0)q′ =
N−1∑
n=0
wq′+Qn · c(0)∗n rq′+Qn, (3.2)
where(∗) represents the complex conjugation for the complex number.We assume
that there is no inter-subcarrier interference and frequency and timing synchronization
is accurate. The decision variabled(0)q′ can be expanded with the aid of Equation 3.1 and
3.2 as:
d(0)q′ =
N−1∑
n=0
wq′+Qn · c(0)∗n
(
√
Es
N
U−1∑
u=0
b(u)q′ c(u)
n Hq′+Qn + Nq′+Qn
)
= β + ζ + η, (3.3)
whereβ is the desired signal component given by
β =
√
Es
Nb(0)q′
N−1∑
n=0
Hq′+Qn · wq′+Qn, (3.4)
ζ is the MUI given by
ζ =
√
Es
N
U−1∑
u=1
b(u)q′
N−1∑
n=0
c(u)n c(0)∗
n Hq′+Qn · wq′+Qn, (3.5)
andη is the noise component given by
η =
N−1∑
n=0
c(0)∗n Nq′+Qn · wq′+Qn. (3.6)
These three signal components predetermine the performance of the single user detector
considered[15].
10

3.2 Interference analysis according to combining methods
3.2.1 Maximal Ratio Combining (MRC)
Channel estimation technique makes it possible to obtain the frequency domain channel
transfer factor from which the frequency domain equalization gain factor can be derived.
The frequency domain channel transfer factor comes from FFTof the time domain chan-
nel impulse response and can be written as:
Hq+Qn =
QN−1∑
l=0
alhle−j2π(q+Qn)l/(QN)
=
QN−1∑
l=0
alhle−j2πql/(QN)e−j2πnl/N . (3.7)
WhenHq+QnN−1n=0
Q−1q=0 is frequency domain channel transfer factor, the equalization
gain factor,wq+Qn, for the MRC is given as:
wq+Qn = H∗q+Qn. (3.8)
We assume the perfect channel estimation, then the equalization gain factor, from Equa-
tion 3.7 and Equation 3.8, is given by:
wq+Qn =
QN−1∑
l=0
alhlej2πql/(QN)ej2πnl/N . (3.9)
11

Using above Equations,wq+QnHq+Qn can be rewritten as:
wq+QnHq+Qn = H∗q+QnHq+Qn
= a20h
20 + a2
1h21 + ... + a2
L−1h2L−1
+(
a0a1h0h∗1 + a1a2h1h
∗2 + ... + aL−2aL−1hL−2h
∗L−1
)
ej2πq1/QNej2πm1/N
+(
a0a1h∗0h1 + a1a2h
∗1h2 + ... + aL−2aL−1h
∗L−2hL−1
)
e−j2πq1/QNe−j2πm1/N
+(
a0a2h0h∗2 + a1a3h1h
∗3 + ... + aL−3aL−1hL−3h
∗L−1
)
ej2πq2/QNej2πm2/N
+(
a0a2h∗0h2 + a1a3h
∗1h3 + ... + aL−3aL−1h
∗L−3hL−1
)
e−j2πq2/QNe−j2πm2/N
...
+(
a0aL−1h0h∗L−1
)
ej2πq(L−1)/QNej2πm(L−1)/N
+ (a0aL−1h∗0hL−1) e−j2πq(L−1)/QNe−j2πm(L−1)/N
=L−1∑
l=−(L−1)
R(l) · ej2πnl/N , (3.10)
where
R(l) = ej2πql/(QN)L−1−l∑
k=0
akak+lhkh∗k+l, l = 0, 1, ..., L − 1, (3.11)
R(l) = ej2πql/(QN)L−1−l∑
k=0
akak−lh∗khk−l, l = −1, ...,−(L − 1). (3.12)
12

The corresponding user’s received signal component forq′-th data symbol,β, is given
by:
β =
√
Es
Nb(0)q′
N−1∑
n=0
|Hq′+Qn|2
=
√
Es
Nb(0)q′
N−1∑
n=0
L−1∑
l=−(L−1)
R(l)ej2πnl/N
=
√
Es
Nb(0)q′
L−1∑
l=−(L−1)
R(l)N−1∑
n=0
ej2πnl/N
=
√
Es
NR(0)b
(0)q′
N−1∑
n=0
1
=√
NEsb(0)q′ R(0). (3.13)
The MUI associated with MRC is given by:
ζ =
√
Es
N
U−1∑
u=1
b(u)q′
N−1∑
n=0
|Hq′+Qn|2c(u)n c(0)∗
n
=
√
Es
N
U−1∑
u=1
b(u)q′
L−1∑
l=−(L−)
R(l)
N−1∑
n=0
c(u)n c(0)∗
n ej2πnl/N . (3.14)
Now we define spectral correlation[14] between arbitrary different users(r) and(s)
which is given by:
X(r,s)(l) =N−1∑
n=0
c(r)n c(s)∗
n ej2πnl/N , (3.15)
and from the Equation 3.14 and 3.15,ζ can be expressed in the form
ζ =
√
Es
N
U−1∑
u=1
b(u)q′
N−1∑
n=0
|Hn|2c(u)n c(0)∗
n
=
√
Es
N
U−1∑
u=1
b(u)q′
L−1∑
l=−(L−1)
R(l)
N−1∑
n=0
c(u)n c(0)∗
n ej2πnl/N
=
√
Es
N
U−1∑
u=1
b(u)q′
L−1∑
l=−(L−1)
R(l)X(u,0)(l). (3.16)
13

As we can see in the Equation 3.16, MUI consists of 3 terms.
1) Different user’s data symbol,b(u)q′ ,
2) Channel element,R(l),
3) Spectral correlation,X(r,s)(l).
Because different user’s data symbol is not related to multipath fading, we exclude it
from considering MUI. Then MUI is regarded as product of the channel elements and
the spectral correlations. As we know from Equation 3.11 and3.12, channel element is
a sum of multipaths multiplied by other multipaths spacedTQN l time apart. Therefore,
spectral correlation,X(r,s)(l), can be regarded as a weight affecting to correlation value
between multipaths and other multipaths spacedTQN l time apart. In other word, spectral
correlation can influence characteristics of MUI and ifX(r,s)(l) is zero or small value,
then the corresponding interference can become zero or small value.
3.2.2 Equal Gain Combining (EGC)
The equalization gain factor,wq+Qn, for the EGC is given as:
wq+Qn =H∗
q+Qn
|Hq+Qn|. (3.17)
From Equation 3.17, the desired signal component of and MUI of q′-th data symbol are
given by:
β =
√
Es
Nb(0)q′
N−1∑
n=0
H∗q′+QnHq′+Qn
|Hq′+Qn|
=
√
Es
Nb(0)q′
N−1∑
n=0
√
H∗q′+QnHq′+Qn, (3.18)
14
ζ =
√
Es
N
U−1∑
u=1
b(u)q′
N−1∑
n=0
c(u)n c(0)∗
n
H∗q′+QnHq′+Qn
|Hq′+Qn|
=
√
Es
N
U−1∑
u=1
b(u)q′
N−1∑
n=0
c(u)n c(0)∗
n
√
H∗q′+QnHq′+Qn. (3.19)
We consider mean value and variance to analyze MUI. The mean value is given as:
E[H∗q+QnHq+Qn] = E
L−1∑
l=−(L−1)
R(l)ej2πnl/N
= E [R(0)] + E
L−1∑
l=−(L−1)l6=0
R(l)ej2πnl/N
= 1, (3.20)
and the variance is given as:
V ar[H∗q+QnHq+Qn] = V ar
L−1∑
l=−(L−1)
R(l)ej2πnl/N
= V ar [R(0)] + V ar
L−1∑
l=−(L−1)l6=0
R(l)ej2πnl/N
= V ar
[
L−1∑
k=0
a2kh
2k
]
+
L−1∑
l=−(L−1)l6=0
V ar
[
L−1−l∑
k=0
akak+lhkh∗k+l
]
= 2σ4L−1∑
k=0
a4k +
L−1∑
l=−(L−1)l6=0
σ4L−1−l∑
k=0
a2ka
2k+l
≤ 2a40σ
4L + 2a40σ
4 L(L − 1)
2
= a40σ
4L(L + 1). (3.21)
From the Taylor series, an expansion of√
x about 1 is given by:
√x ≈ 1 +
1
2(x − 1) − 1
8(x − 1)2 +
1
16(x − 1)3 − · · · . (3.22)
15

And the desired signal component and MUI approximated usingEquation 3.22 are given
as:
β ≈√
Es
Nb(0)q′
N−1∑
mn=0
(
1 +1
2(H∗
q′+QnHq′+Qn − 1)
)
=1
2
√
Es
Nb(0)q′ +
1
2
√
Es
Nb(0)q′
N−1∑
n=0
H∗q′+QnHq′+Qn
=1
2
√
Es
Nb(0)q +
1
2
√
NEsb(0)q R(0), (3.23)
ζ ≈√
Es
N
U−1∑
u=1
b(u)q′
N−1∑
n=0
c(u)n c(0)∗
n
(
1 +1
2(H∗
q′+QnHq′+Qn − 1)
)
=1
2
√
Es
N
U−1∑
u=1
b(u)q′
N−1∑
n=0
c(u)n c(0)∗
n +1
2
√
Es
N
U−1∑
u=1
b(u)q′
N−1∑
n=0
c(u)n c(0)∗
n H∗q′+QnHq′+Qn
=1
2
√
Es
N
U−1∑
u=1
b(u)q′
N−1∑
n=0
c(u)n c(0)∗
n +1
2
√
Es
N
U−1∑
u=1
b(u)q′
L−1∑
l=−(L−1)
R(l)Xu,0(l). (3.24)
In the Equation 3.24, the first term is independent on the channel so that it can be consid-
ered as constant, especially zero when spreading sequencesare orthogonal. The second
term is dependent on the channel and similar to the expression of MRC, Equation 3.16.
Therefore, in the case of EGC, MUI can be expressed with spectral correlation like the
case of MRC and MUI characteristic is analogous to that of thecase of MRC, but smaller
than it by1/2. The energy of the desired signal is as large as that of MRC, however the
interference is smaller than that of MRC by1/2. Hence performance of EGC is better
than that of MRC.
16

3.2.3 Orthogonality Restoring Combining (ORC)
The equalization gain ,wq+Qn, for the ORC is given as:
wq+Qn =H∗
q+Qn
|Hq+Qn|2. (3.25)
From this Equation 3.25, the desired signal component and MUI of q′-th data symbol
are given by:
β =
√
Es
Nb(0)q′
N−1∑
n=0
H∗q′+QnHq′+Qn
|Hq′+Qn|2
=√
NEsb(0)q′ , (3.26)
ζ =
√
Es
N
U−1∑
u=1
b(u)q′
N−1∑
n=0
c(u)n c(0)∗
n
H∗q′+QnHq′+Qn
|Hq′+Qn|2
=
√
Es
N
U−1∑
u=1
b(u)q′
N−1∑
n=0
c(u)n c(0)∗
n . (3.27)
As shown in above equation, ORC cancels the effect of the channel so that spectral
correlation is not represented in the expression. Besides,if sequences are orthogonal,
MUI is equal to zero. But multipath diversity gain could not be acquired.
3.2.4 Minimum Mean Square Error Combining (MMSEC)
The equalization gain ,wq+Qn, for the MMSEC is given as:
wq+Qn =H∗
q+Qn
|Hq+Qn|2 + 2σ2
UNEs
. (3.28)
From this Equation 3.28, the desired signal component and MUI of q′-th data symbol
are given by:
β =
√
Es
Nb(0)q′
N−1∑
n=0
H∗q′+QnHq′+Qn
|Hq′+Qn|2 + 2σ2
UNEs
, (3.29)
17

ζ =
√
Es
N
U−1∑
u=1
b(u)q′
N−1∑
n=0
c(u)n c(0)∗
n
H∗q′+QmHq′+Qm
|Hq′+Qn|2 + 2σ2
UNEs
. (3.30)
From the Taylor series, an expansion ofxx+a about 1 is given by:
x
x + a≈ 1
1 + a+
a
(1 + a)2(x−1)+
−2a
(1 + a)3(x−1)2+
6a
(1 + a)4(x−1)3+· · · , (3.31)
and the desired signal component and MUI approximated usingEquation 3.31 are given
as:
β ≈√
Es
Nb(0)q′
N−1∑
n=0
(
1
1 + 2σ2
UNEs
+2σ2
UNEs
(1 + 2σ2
UNEs
)2(H∗
q′+QnHq′+Qn − 1)
)
=
√
Es
Nb(0)q′
(
2σ2
UNEs
(1 + 2σ2
UNEs
)2
N−1∑
n=0
H∗q′+QnHq′+Qn +
N
(1 + 2σ2
UNEs
)2
)
=√
EsNb(0)q′
(
2σ2
UNEs
(1 + 2σ2
UNEs
)2R(0) +
1
(1 + 2σ2
UNEs
)2
)
, (3.32)
ζ ≈√
Es
N
U−1∑
u=1
b(u)q′
N−1∑
n=0
c(u)n c(0)∗
n
(
1
1 + 2σ2
UNEs
+2σ2
UNEs
(1 + 2σ2
UNEs
)2(H∗
q′+QnHq′+Qn − 1)
)
=
√
Es
N
U−1∑
u=1
b(u)q′
N−1∑
n=0
c(u)n c(0)∗
n
(
2σ2
UNEs
(1 + 2σ2
UNEs
)2H∗
q′+QnHq′+Qn +1
(1 + 2σ2
UNEs
)2
)
=
√
Es
N
(
1
(1 + 2σ2
UNEs
)2
)
U−1∑
u=1
b(u)q′
N−1∑
n=0
c(u)n c(0)∗
n
+
√
Es
N
(
2σ2
UNEs
(1 + 2σ2
UNEs
)2
)
U−1∑
u=1
b(u)q′
N−1∑
n=0
c(u)n c(0)∗
n H∗q′+QnHq′+Qn
=
√
Es
N
(
1
(1 + 2σ2
UNEs
)2
)
U−1∑
u=1
b(u)q′
N−1∑
n=0
c(u)n c(0)∗
n
+
√
Es
N
(
2σ2
UNEs
(1 + 2σ2
UNEs
)2
)
U−1∑
u=1
b(u)q′
L−1∑
l=−(L−1)
R(l)X(u,0)(l). (3.33)
In the Equation 3.33, the first term is independent on the channel so that it can be consid-
ered as constant, especially zero when spreading sequencesare orthogonal. The second
18

term is dependent on the channel and similar to the expression of MRC, Equation 3.16.
Therefore, in the case of MMSEC, MUI can be expressed with spectral correlation like
the case of MRC and MUI characteristic is analogous to that ofthe case of MRC. But
variance of the channel affects the MUI expression. Hence, the feature of MMSEC is
similar to that of ORC in high SNR, and to that of MRC in low SNR.Therefore, MUI is
slightly affected by spectral correlation.
3.3 Spectral correlation according to interleaver
In Equation 3.16, spectral correlation is a sum of products of reference user’s sequence,
c(0)∗n , and another user’s sequence,c
(u)n , andej2πnl/N , wherem = 0, 1, ..., N − 1. That
is the result which IFFT is applied to the product of two sequences andej2πnl/NN−1n=0 .
In that equation,Q, the size of S/P, is not shown. But back to the derivation, we can see
the spectral correlation includingQ which is given by:
X(r,s)(l′) =
N−1∑
n=0
c(r)n c(s)∗
n ej2πQnl′/QN . (3.34)
In other words, spectral correlation, Equation 3.15, is defined forQ = 1, and when
Q > 1, IFFT of sizeQN is applied to the product of sequences whose chip and another
chip are spacedQ-chip apart. Therefore, a spectral correlation forQ > 1 has a form of
repetition of the spectral correlation forQ = 1. Using above fact, the spectral correlation
for arbitraryQ > 1 andl′ ≥ N is given by:
X(r,s)(l′) = X(r,s)(l), l′ ≡ l(modN), l′ ≥ N > l. (3.35)
Figure 3.1 is a spectral correlation of Walsh-Hadamard of size 8 forQ = 1, and Figure
19

-6 -4 -2 0 2 4 6-8
-6
-4
-2
0
2
4
6
8
l
|X(l)|
Absolute Value
Figure 3.1: Spectral correlation: |X(8,1)WH8
(l)| for Q = 1
-31 -24 -16 -8 0 8 16 24 31-8
-6
-4
-2
0
2
4
6
8
l
|X(l)|
Absolute Value
Figure 3.2: Spectral correlation: |X(8,1)WH8
(l)| for Q = 4
20

3.2 is forQ = 4. For Q = 4, the spectral correlation forQ = 1 is repeated 4 times
sequentially. Therefore, regardless of S/P size,Q, we can estimate the feature of MUI
from only knowing the path delay interval index,l, and the spectral correlation,X(r,s)(l).
3.4 Simulation results
In this section, we investigate how BER performance of MC-CDMA system is affected
by spectral correlations. The channel is assumed to keep constant in one OFDM-CDMA
symbol and change from symbol to symbol independently. We assume perfect channel
estimation and accurate timing and frequency synchronization. And maximum delay
spread is within guard interval. We consider two channel model. First, CIR tap coef-
ficients are placed every sample point within guard intervaland exponentially decayed.
Second, CIR tap coefficients are placed arbitrary sample points within guard interval and
exponentially decayed.
3.4.1 Channel model (1)
Multipaths delay by one sample, and exponentially decay. 2 multipaths lie within[
0, TQN 1
]
or within guard interval. Figure 3.3 and Figure 3.4 show somesimulation results with
21

Walsh-Hadamard matrix of size 8 which is given by:
WH8 =
+ + + + + + + +
+ − + − + − + −+ + − − + + − −+ − − + + − − +
+ + + + − − − −+ − + − − + − +
+ + − − − − + +
+ − − + − + + −
(3.36)
and simulation parameters are shown on Table 3.1. In those figures, WH(5,6,7,8) means
that 5,6,7,8-th sequences of above Walsh-Hadamard matrix are allocated to different 4
users, respectively. Figure 3.3 is for MRC and EGC. BER performances of WH(5,6,7,8)
for MRC and EGC approach single user performances for MRC andEGC, which acquire
best performances. But BER performances of WH(2,3,5,8) forMRC and EGC are worse
than those of WH(5,6,7,8). Figure 3.4 is for MMSEC and ORC. BER performance
of WH(5,6,7,8) for MMSEC also approaches a single user performance for MMSEC,
which acquires best performance. But BER performance of WH(2,3,5,8) is worse than
that of WH(5,6,7,8). Because ORC cancels effect of the channel, there is no difference
according to spectral correlations.
Spectral correlations of Walsh-Hadamard of size 8 are shownon from Figure 3.5 to
Table 3.1: Simulation parameters(1)
FFT/IFFTPoints
Number ofsubcarriers
OFDM symbol Modulation QPSK
8 88+1 samples
(Guard interval=T/8)QPSK 8
22

0 5 10 15 20 25 3010
-6
10-5
10-4
10-3
10-2
10-1
100
Eb/N
o[dB]
BE
R
MRC single user
MRC (5.6.7.8) best
MRC (2.3.5.8) worse
EGC single user
EGC (5.6.7.8) best
EGC (2.3.5.8) worse
Figure 3.3: BER performance using MRC, EGC (Users:4, Paths:2)
0 5 10 15 20 25 3010
-6
10-5
10-4
10-3
10-2
10-1
100
Eb/N
o[dB]
BE
R
MMSEC single user
MMSEC (5.6.7.8) better
MMSEC (2.3.5.8) worse
ORC (5.6.7.8)
ORC (2.3.5.8)
Figure 3.4: BER performance using MMSEC, ORC (Users:4, Paths:2)
23

-5 0 5-8
-6
-4
-2
0
2
4
6
8
l
ReX
(l)
Real
-5 0 5-8
-6
-4
-2
0
2
4
6
8
l
ImX
(l)
Imaginary
-5 0 5-5
0
5
l
|X(l)|
Absolute Value
Figure 3.5: Spectral correlation: X(6,5)WH8
(l)
-5 0 5-8
-6
-4
-2
0
2
4
6
8
l
ReX
(l)
Real
-5 0 5-8
-6
-4
-2
0
2
4
6
8
l
ImX
(l)
Imaginary
-5 0 5-8
-6
-4
-2
0
2
4
6
8
l
|X(l)|
Absolute Value
Figure 3.6: Spectral correlation: X(7,5)WH8
(l)
-5 0 5-8
-6
-4
-2
0
2
4
6
8
l
ReX
(l)
Real
-5 0 5-8
-6
-4
-2
0
2
4
6
8
l
ImX
(l)
Imaginary
-5 0 5-8
-6
-4
-2
0
2
4
6
8
l
|X(l)|
Absolute Value
Figure 3.7: Spectral correlation: X(8,5)WH8
(l)
24

-5 0 5-8
-6
-4
-2
0
2
4
6
8
l
ReX
(l)
Real
-5 0 5-8
-6
-4
-2
0
2
4
6
8
l
ImX
(l)
Imaginary
-5 0 5-8
-6
-4
-2
0
2
4
6
8
l
|X(l)|
Absolute Value
Figure 3.8: Spectral correlation: X(3,2)WH8
(l)
-5 0 5-8
-6
-4
-2
0
2
4
6
8
l
ReX
(l)
Real
-5 0 5-8
-6
-4
-2
0
2
4
6
8
l
ImX
(l)
Imaginary
-5 0 5-8
-6
-4
-2
0
2
4
6
8
l
|X(l)|
Absolute Value
Figure 3.9: Spectral correlation: X(5,2)WH8
(l)
-5 0 5-8
-6
-4
-2
0
2
4
6
8
l
ReX
(l)
Real
-5 0 5-8
-6
-4
-2
0
2
4
6
8
l
ImX
(l)
Imaginary
-5 0 5-8
-6
-4
-2
0
2
4
6
8
l
|X(l)|
Absolute Value
Figure 3.10: Spectral correlation: X(8,2)WH8
(l)
25

0 5 10 15 20 25 3010
-6
10-5
10-4
10-3
10-2
10-1
100
Eb/N
o[dB]
BE
R
MRC single user
MRC (5.6.7.8) better
MRC (2.3.5.8) worse
EGC single user
EGC (5.6.7.8) better
EGC (2.3.5.8) worse
Figure 3.11: BER performance using MRC, EGC (Users:4, Paths:4)
0 5 10 15 20 25 3010
-6
10-5
10-4
10-3
10-2
10-1
100
Eb/N
o[dB]
BE
R
MMSEC single user
MMSEC (5.6.7.8) better
MMSEC (2.3.5.8) worse
ORC single user
ORC better
ORC worse
Figure 3.12: BER performance using MMSEC, ORC (Users:4, Paths:4)
26

Table 3.2: Simulation parameters(2)
FFT/IFFTPoints
Number ofsubcarriers
OFDM symbol Modulation QPSK
32 3232+4 samples
(Guard interval=T/8)QPSK 8
Table 3.3: ReqiredEb/No according to combining methods
Number of paths:2 Number of path:4
10−5 singlebest
(no MUI)worst single best worst
MRC 24.9 24.9 36.1 16.5 41.0 x
EGC 25.3 25.7 32.5 17.5 23.8 x
MMSEC 25.0 25.7 27.1 16.7 21.0 21.8
Figure 3.10.X(r,s)WH8
(l) means spectral correlation of Walsh-Hadamard of size 8. From
Figure 3.5 to Figure 3.7,X(6,5)WH8
(±1) = X(7,5)WH8
(±1)= X(8,5)WH8
(±1) = 0. Those re-
sults mean that correlation between multipaths and other multipaths spacedTQN l time
apart becomes zero. In other words, MUI becomes zero so that the BER performances
approach single user performances. But from Figure 3.8 to Figure 3.10, because of
X(5,2)WH8
(±1) 6= 0 andX(8,2)WH8
(±1) 6= 0, MUI exist and BER performances of WH(2,3,5,8)
for MRC, EGC, MMSEC are degraded.
Figure 3.11 and Figure 3.12 show BER performances for 4 multipaths and sim-
ulation parameters are shown on Table 3.2. 4 multipaths delayed by one sample lie
within[
0, TQN 3
]
or within guard interval and are exponentially decayed. Forthese
cases, BER performances of WH(5,6,7,8) for MRC, EGC, MMSEC are better than
those of WH(2,3,5,8), too. BecauseX(6,5)WH8
(±l) = 0 for l = 0,±1,±2,±3 and oth-
ers have some values, not zero. Therefore, MUI for WH(5,6,7,8) get smaller than those
for WH(2,3,5,8), and the system using WH(5,6,7,8) acquiresbetter performance. Table
27
3.3 summarizes requiredEb/No[dB] for MC-CDMA systems that shown in this section
to attain BER10−5.
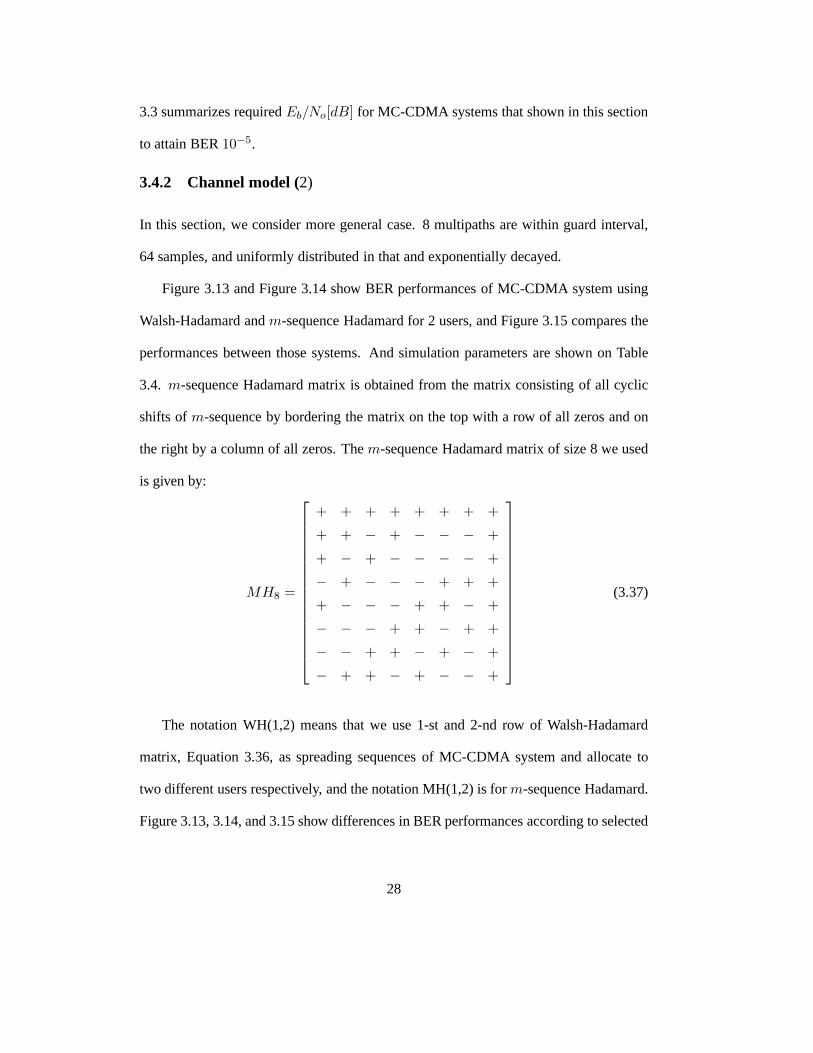
3.4.2 Channel model (2)
In this section, we consider more general case. 8 multipathsare within guard interval,
64 samples, and uniformly distributed in that and exponentially decayed.
Figure 3.13 and Figure 3.14 show BER performances of MC-CDMAsystem using
Walsh-Hadamard andm-sequence Hadamard for 2 users, and Figure 3.15 compares the
performances between those systems. And simulation parameters are shown on Table
3.4. m-sequence Hadamard matrix is obtained from the matrix consisting of all cyclic
shifts ofm-sequence by bordering the matrix on the top with a row of all zeros and on
the right by a column of all zeros. Them-sequence Hadamard matrix of size 8 we used
is given by:
MH8 =
+ + + + + + + +
+ + − + − − − +
+ − + − − − − +
− + − − − + + +
+ − − − + + − +
− − − + + − + +
− − + + − + − +
− + + − + − − +
(3.37)
The notation WH(1,2) means that we use 1-st and 2-nd row of Walsh-Hadamard
matrix, Equation 3.36, as spreading sequences of MC-CDMA system and allocate to
two different users respectively, and the notation MH(1,2)is for m-sequence Hadamard.
Figure 3.13, 3.14, and 3.15 show differences in BER performances according to selected
28

20 21 22 23 24 25 26 27 28 29 3010
-6
10-5
10-4
10-3
Eb/N
o[dB]
BE
R
WH(1,2).worst
WH(1,3).worse
WH(1,4).worse
WH(1,5).good
WH(1,6).good
Figure 3.13: BER performance for Walsh-Hadamard using MRC (Users:2)
20 21 22 23 24 25 26 27 28 29 3010
-6
10-5
10-4
10-3
Eb/N
o[dB]
BE
R
MH(1,8).worst
MH(1,2).good
MH(1,5).good
MH(1,7).good
Figure 3.14: BER performance form-sequence Hadamard using MRC (Users:2)
29

20 21 22 23 24 25 26 27 28 29 3010
-6
10-5
10-4
10-3
Eb/N
o[dB]
BE
R
WH(1,2).worst
WH(1,5).good
MH(1,8).worst
MH(1,2).good
Figure 3.15: BER performance form-sequence Hadamard using MRC (Users:2)
Table 3.4: Simulation parameters(3)
FFT/IFFTPoints
Number ofsubcarriers
OFDM symbol Modulation QPSK
512 512512+64 samples
(Guard interval=T/8)QPSK 8
Table 3.5: Maximum absolute value and requiredEb/No for target BER10−5
Pair ofsequences
WH(1,2)WH(1,3)WH(1,4)
WH(1,5)WH(1,8)
deviation MH(1,8)MH(1,2)MH(1,7)
deviation
Masimumabsolute value
8 5.6569 5.2263 2.7737 5.2263 4 1.2263
Largest/Smallestof MAV
largest smallest largest smallest
dB 30.0 27.2 25.7 4.3 25.7 24.8 0.9
30

sequences. Maximum of absolute value of spectral correlation can explain that. We de-
fine the value as maximum absolute value. Maximum absolute value is the largest value
among absolute values over−N < l < N in a spectral correlation, max−N<l<N
|X(r,s)(l)|
.
And in a sequence set, largest and smallest are exist among pairs of sequences. We call
the difference maximum absolute value deviation. Table 3.5shows maximum absolute
values and its maximum, and minimum values for Walsh-Hadamard andm-sequence
Hadamard. From Figure 3.13 and Table 3.5, we can observe thatgreater the maximum
absolute value, worse the BER performance. Same explanation can be applied tom-
sequence Hadamard.
Figure 3.15 compares both systems. From Figure 3.15, as WH(1,2) has largest max-
imum absolute value, it has worst BER performance, and as MH(1,2) has smallest max-
imum absolute value, it has best BER performance. And as WH(1,5) and MH(1,8) have
same maximum absolute value, we can observe that they have nearly same BER perfor-
mances. Judging from that, BER performance of MC-CDMA system for 2 users using
binary sequence depends on maximum absolute value of spectral correlation. Moreover,
for Walsh-Hadamard, largest maximum absolute value and smallest maximum absolute
value are 8 and 5.2263, respectively, and the difference between two values is 2.7737.
And for m-sequence Hadamard, largest and smallest value are 5.2263 and 4, respec-
tively, and the difference between two values is 1.2263 which is smaller than that for
Walsh-Hadamard. This influence BER performances shown in Figure 3.13, 3.14, and
3.15 and BER performance deviation. Therefore, because a sequence set having ran-
dom characteristic has small deviation of maximum absolutevalues, BER performance
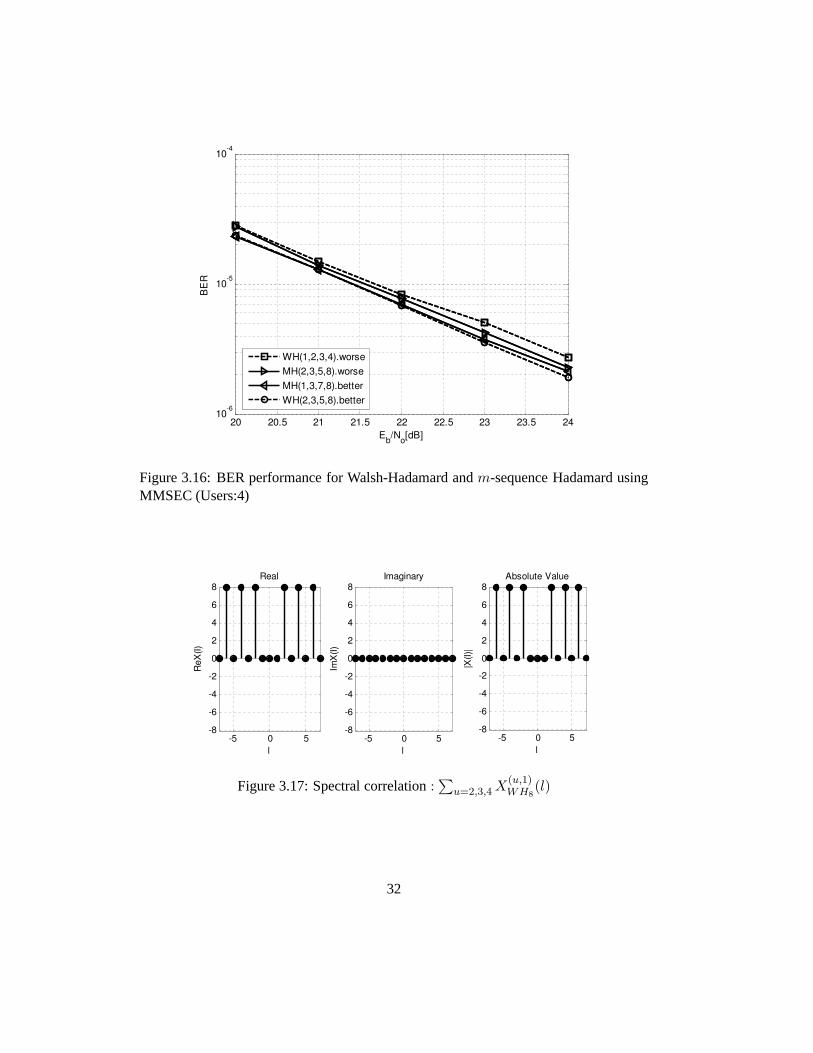
deviation can be small. In Figure 3.16, BER performances of MC-CDMA system us-
31
20 20.5 21 21.5 22 22.5 23 23.5 2410
-6
10-5
10-4
Eb/N
o[dB]
BE
R
WH(1,2,3,4).worse
MH(2,3,5,8).worse
MH(1,3,7,8).better
WH(2,3,5,8).better
Figure 3.16: BER performance for Walsh-Hadamard andm-sequence Hadamard usingMMSEC (Users:4)
-5 0 5-8
-6
-4
-2
0
2
4
6
8
l
ReX
(l)
Real
-5 0 5-8
-6
-4
-2
0
2
4
6
8
l
ImX
(l)
Imaginary
-5 0 5-8
-6
-4
-2
0
2
4
6
8
l
|X(l)|
Absolute Value
Figure 3.17: Spectral correlation:∑
u=2,3,4 X(u,1)WH8
(l)
32

-5 0 5-8
-6
-4
-2
0
2
4
6
8
l
ReX
(l)
Real
-5 0 5-8
-6
-4
-2
0
2
4
6
8
l
ImX
(l)
Imaginary
-5 0 5-8
-6
-4
-2
0
2
4
6
8
l
|X(l)|
Absolute Value
Figure 3.18: Spectral correlation:∑
u=3,5,8 X(u,2)WH8
(l)
-5 0 5-8
-6
-4
-2
0
2
4
6
8
l
ReX
(l)
Real
-5 0 5-8
-6
-4
-2
0
2
4
6
8
l
ImX
(l)
Imaginary
-5 0 5-8
-6
-4
-2
0
2
4
6
8
l
|X(l)|
Absolute Value
Figure 3.19: Spectral correlation:∑
u=3,7,8 X(u,1)MH8
(l)
-5 0 5-8
-6
-4
-2
0
2
4
6
8
l
ReX
(l)
Real
-5 0 5-8
-6
-4
-2
0
2
4
6
8
l
ImX
(l)
Imaginary
-5 0 5-8
-6
-4
-2
0
2
4
6
8
l
|X(l)|
Absolute Value
Figure 3.20: Spectral correlation:∑
u=2,3,5 X(u,1)MH8
(l)
33

0 5 10 15 20 25 3010
-6
10-5
10-4
10-3
10-2
10-1
100
Eb/N
o[dB]
BE
R
WH
MH
Figure 3.21: BER performance for Walsh-Hadamard andm-sequence Hadamard usingMMSEC (Users:8)
ing Walsh-Hadamard andm-sequence Hadamard for 4 users are shown and simulation
parameters are shown on Table 3.4. WH(1,2,3,4) means that 1,2,3,4-th row of Walsh-
Hadamard, Equation 3.36, are allocated to each user. From Figure 3.17 to Figure 3.20
show spectral correlations for 4 users. Spectral correlation for many users is expressed
as a sum of spectral correlation for 2 users and defined as:
∑
r 6=s
X(r,s)(l) =∑
r 6=s
N−1∑
n=0
c(r)n c(s)∗
n ej2πnl/N . (3.38)
From Figure 3.16, WH(1,2,3,4), MH(1,2,3,5), MH(1,3,7,8),WH(2,3,5,8) are in or-
der of bad performance. And WH(1,2,3,4) only has maximum absolute value 8, and
the others have 7.3910. Therefore WH(1,2,3,4) has the worstperformance, and the
34

-5 0 5-8
-6
-4
-2
0
2
4
6
8
l
ReX
(l)
Real
-5 0 5-8
-6
-4
-2
0
2
4
6
8
l
ImX
(l)
Imaginary
-5 0 5-8
-6
-4
-2
0
2
4
6
8
l
|X(l)|
Absolute Value
Figure 3.22: Spectral correlation:∑
u 6=1 X(u,1)WH8
(l)
-5 0 5-8
-6
-4
-2
0
2
4
6
8
l
ReX
(l)
Real
-5 0 5-8
-6
-4
-2
0
2
4
6
8
l
ImX
(l)
Imaginary
-5 0 5-8
-6
-4
-2
0
2
4
6
8
l
|X(l)|
Absolute Value
Figure 3.23: Spectral correlation:∑
u 6=1 X(u,1)MH8
(l)
35

others are better than WH(1,2,3,4) and have little performance differences. Therefore
maximum absolute value of spectral correlation is major factor to decide BER perfor-
mance. Figure 3.21 shows BER performances using Walsh-Hadamard andm-sequence
Hadamard for 8 users, and simulation parameters are shown onTable 3.4. BER perfor-
mances of both systems are same for 8 users. This is due to samemaximum absolute
values of 8 for two sequences as shown in Figure 3.22 and Figure 3.23.
36

Chapter 4
Requirements of frequencyspreading sequences
From Equation 3.16, MUI is consists of channel elements and spectral correlation. First,
only to investigate effect of channel, we calculate mean andvariance of channel cross
product,R(l). Mean value is given by:
E [R(l)] =
1, for l = 0,
0, for l 6= 0.(4.1)
From the channel model, we assume that normalized amplitudes, alL−1l=0 , have ampli-
tudes ofa0 ≥ a1 ≥ · · · ≥ aL−1. Hence, variance is given by:
V ar [R(l)] = σ4L−1−l∑
k=0
a2ka
2k+l ≤ σ4a2
0a2l (L − 1). (4.2)
From Equation 4.1 and Equation 4.2, channel element forl = 0 has mean value 1
and larger variance than any other elements. Other elementshave mean value 0 and
smaller variance than 1 asl is larger. Therefore, spectral correlation atl = 0 should
be 0,X(r,s)(0) =∑N−1
m=0 c(r)m c
(s)∗m = 0, and this means that spreading sequences are
orthogonal. In Equation 3.24, first term of the expression can be 0, and in Equation 3.27,
37

interference can be 0, when spreading sequences are orthogonal. Hence, orthogonality
is most essential factor for frequency spreading sequences.
The first term of the MUI can be removed by using orthogonal sequences but the
other terms still remained. But those terms are consist of the channel elements and
spectral correlations so that each term can be controlled byspectral correlation value,
i.e., if a spectral correlation is zero or small, the term containing it is also zero or small.
If two multipaths are apaced by1T/QN , MUI can be 0 by using spreading sequence
whose spectral correlation at±1 is 0, Xr,s(±1) = 0. As we see simulation results at
secton 3.4, considering channel model and setting corresponding spectral correlation 0
or very small, MUI can be 0 or very small.
But if CIR tap coefficients are lied uniformly within guard interval larger thanN
samples, it is not enough to consider particular spectral correlation being 0 or small.
In this case, we consider not only spectral correlation at particular l, but also at all
−N < l < N . At that time, maximum absolute value of spectral correlation is regarded
as a major factor to system performance, and smaller it is, less MUI is, and better BER
performance. Random characteristic of spreading sequenceinfluence BER performance
difference according to user combinations. More random sequence is, smaller perfor-
mance deviation is.
38

Chapter 5
Spectral correlation profile
In this section, we investigate MUI more deeply and introduce spectral correlation pro-
file. Spectral correlation basically has complex value. Therefore, real part, imaginary
part, and absolute value of spectral correlation has various figures according to spreading
sequence. In this case,X(r,s)(l) andX(r,s)(−l) for l = 0, 1, ..., N − 1 can be complex
conjugate pair or not. We define spectral correlation profileas figure of spectral correla-
tion on complex plane.
From Equation 3.16 of MUI expression,R(l) and R(−l) are complex conjugate
pair. And MUI has form ofR(l)X(r,s)(l) +R(−l)X(r,s)(−l). Therefore, figure of MUI
can be changed by figures of spectral correlations,X(r,s)(l) andX(r,s)(−l). Now, we
consider two cases.
1) X(r,s)(−l) = X(r,s)∗(l),
2) EitherX(r,s)(l) or X(r,s)(−l) is zero.
For the case1), we useX(r,s)(−l) = X(r,s)∗(l) to express Equation 3.16, then MUI
39

is given by:
ζ1 =
√
ES
N
U−1∑
u=1
b(u)q′
L−1∑
l=1
2R
R(l)X(u,0)(l)
, (5.1)
whereR· is a function which results real value. In this case,R
R(l)X(u,0)(l)
has
only influence on real part of channel elements but imaginarypart. Therefore, magnitude
of MUI becomes twice of real part ofR(l)X(u,0)(l), and phase of MUI is distorted by
only data symbol.
For the case2), we useX(r,s)(−l) = 0 to express Equation 3.16, then MUI is given
by:
ζ1 =
√
ES
N
U−1∑
u=1
b(u)q′
L−1∑
l=1
R(l)X(u,0)(l). (5.2)
In this case,R(l)X(u,0)(l) has complex form, which has influence on both real and
imaginary part of channel elements. Therefore, magnitude of MUI becomes that of
R(l)X(u,0)(l), and phases of MUI is distorted by both data symbol andR(l)X(u,0)(l).
To investigate above phenomenon, some simulations using some sequences are per-
formed. We use Zadoff-Chu sequence, Walsh-Hadamard,m-sequence Hadamard, Or-
thogonal Gold sequence, Quadri-phase Hadamard, and introduce about those first.
Zadoff-Chu sequence [17] has optimum correlation properties. From that, orthog-
onal sequence set can be constructed. Zadoff-Chu orthogonal sequences of size 8 and
length 8 is given by:
ej2π
“
k2
2+qk
”
/2N, k = 0, 1, ..., N − 1, q = 0, 1, ..., N − 1, (5.3)
40

and for the simulation, we set the exponent as matrix(
k2
2 + qk)
, which is given by:
(
k2
2+ qk
)
=
0 3 12 11 0 11 12 3
0 9 8 13 8 9 0 13
0 15 4 15 0 7 4 7
0 5 0 1 8 5 8 1
0 11 12 3 0 3 12 11
0 1 8 5 8 1 0 5
0 7 4 7 0 15 4 15
0 13 0 9 8 13 8 9
. (5.4)
Orthogonal Gold sequence [18] is constructed usingm-sequence and its preferred
pair by using optimum autocorrelation property, and it is constructively similar tom-
sequence Hadamard. For the simulation, we use Orthogonal Gold sequence of size 8
given by:
OG8 =
+ + − + − − − +
+ + + − + − + +
+ − + − − + − +
− − + + + − − +
− − − − − − + +
− + + + − + + +
+ − − + + + + +
− + − − + + − +
. (5.5)
Quadri-phase Hadamard [19] of size 8 is 4-ary complex sequence having 4 symbols,
41

1,−1, j,−j. For the simulation, we use Quadri-phase Hadamard of size 8 given by:
QH8 =
+1 +j +1 +1 +j +j −j −1
+1 −j +1 +1 −j −j +j −1
+1 +j −1 +1 +j −j +j +1
+1 −j −1 +1 −j +j −j +1
+1 +j +1 −1 −j −j −j +1
+1 −j +1 −1 +j +j +j +1
+1 +j −1 −1 −j +j +j −1
+1 −j −1 −1 +j −j −j −1
. (5.6)
Figure 5.1 shows BER performances whose modulation methodsare BPSK, and Table5.1
shows simulation parameters of the systems. We can observe that the system using
Zadoff-Chu sequence gains 3dB at target BER10−5. This comes from the fact that
spectral correlation profiles of binary sequence and Quadri-phase Hadamard belong to
the case1) previous mentioned, but that of Zadoff-Chu sequence belongs to the case
2). While using BPSK modulation which has data symbol as+1,−1, we decide
the sign of data symbol only on real part. For the case1), MUI is under influence
of 2R
R(l)X(u,0)(l)
, while for the case2),R
R(l)X(u,0)(l)
. In other words, for
the system which use Zadoff-Chu sequence and decide the signof data symbol on 1-
dimension like BPSK, MUI reduced by half.
Figure 5.2, 5.3, 5.4, and 5.5 are spectral correlation of Zadoff-Chu sequence,m-
sequence Hadamard, Orthogonal Gold, and Quadri-phase Hadamard. As we can see
the figures,X(r,s)Chu8
(−2) = 8, X(r,s)Chu8
(2) = 0, thus Zadoff-Chu belongs to the case2).
Others areX(r,s)(−l) =(
X(r,s)(l))∗
and belong to the case1). In fact, all binary
42

Table 5.1: Simulation parameters(4)
FFT/IFFTPoints
Number ofsubcarriers
OFDM symbol Modulation QPSK
64 6464+8 samples
(Guard interval=T/8)BPSK 8
0 5 10 15 20 25 3010
-6
10-5
10-4
10-3
10-2
10-1
100
Eb/N
o[dB]
BE
R
Zadoff-Chu
Walsh-Hadamard
m-sequence Hadamard
Orthogonal Gold
Quadi-phase Hadamard
Figure 5.1: BER performance of Zadoff-Chu and other sequence (Users:8, Paths:8)
-5 0 5-8
-6
-4
-2
0
2
4
6
8
l
ReX
(l)
Real
-5 0 5-8
-6
-4
-2
0
2
4
6
8
l
ImX
(l)
Imaginary
-5 0 5-8
-6
-4
-2
0
2
4
6
8
l
|X(l)|
Absolute Value
Figure 5.2: Spectral correlation: X(3,1)Chu8
(l)
43

-5 0 5-8
-6
-4
-2
0
2
4
6
8
l
ReX
(l)
Real
-5 0 5-8
-6
-4
-2
0
2
4
6
8
l
ImX
(l)
Imaginary
-5 0 5-8
-6
-4
-2
0
2
4
6
8
l
|X(l)|
Absolute Value
Figure 5.3: Spectral correlation: X(2,1)MH8
(l)
-5 0 5-8
-6
-4
-2
0
2
4
6
8
l
ReX
(l)
Real
-5 0 5-8
-6
-4
-2
0
2
4
6
8
l
ImX
(l)
Imaginary
-5 0 5-8
-6
-4
-2
0
2
4
6
8
l
|X(l)|
Absolute Value
Figure 5.4: Spectral correlation: X(2,1)OG8
(l)
-5 0 5-8
-6
-4
-2
0
2
4
6
8
l
ReX
(l)
Real
-5 0 5-8
-6
-4
-2
0
2
4
6
8
l
ImX
(l)
Imaginary
-5 0 5-8
-6
-4
-2
0
2
4
6
8
l
|X(l)|
Absolute Value
Figure 5.5: Spectral correlation: X(2,1)QH8
(l)
44
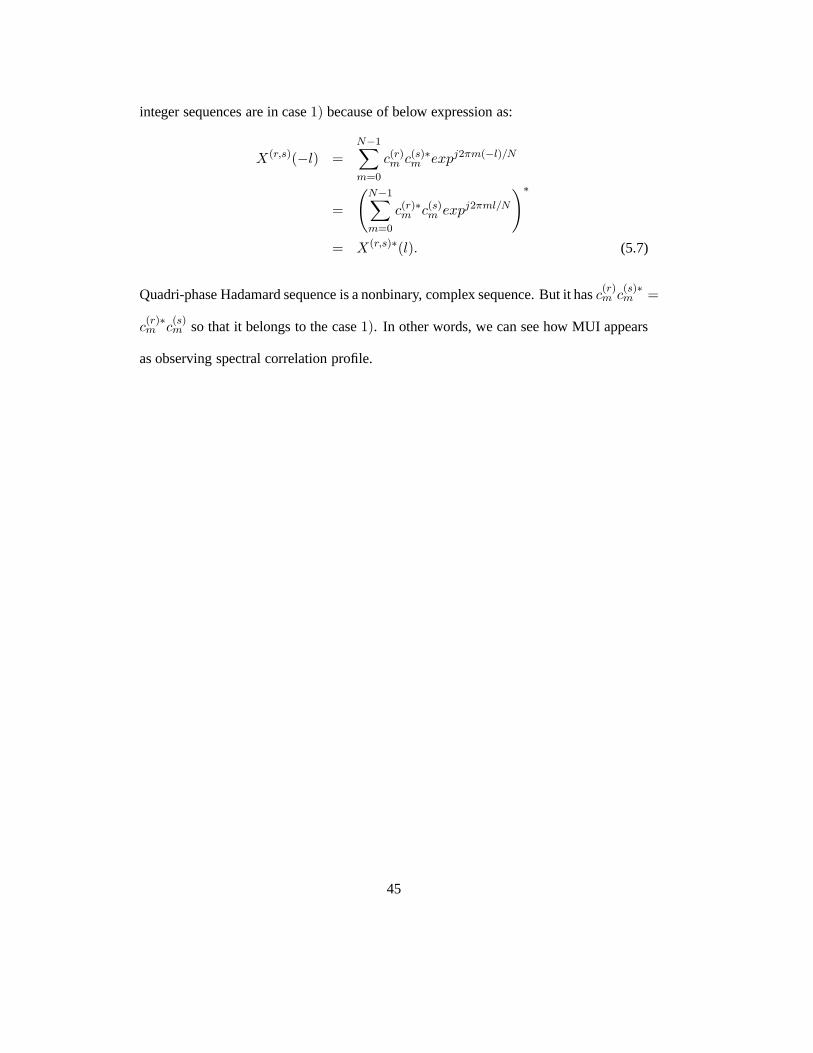
integer sequences are in case1) because of below expression as:
X(r,s)(−l) =
N−1∑
m=0
c(r)m c(s)∗
m expj2πm(−l)/N
=
(
N−1∑
m=0
c(r)∗m c(s)
m expj2πml/N
)∗
= X(r,s)∗(l). (5.7)
Quadri-phase Hadamard sequence is a nonbinary, complex sequence. But it hasc(r)m c
(s)∗m =
c(r)∗m c
(s)m so that it belongs to the case1). In other words, we can see how MUI appears
as observing spectral correlation profile.
45

Chapter 6
Concluding Remarks
In this paper, we have analyzed the relation between a multiuser interference and fre-
quency spreading sequences in a MC-CDMA system by using a spectral correlation.
Based on this, we investigated requirements of frequency spreading sequence and what
figure MUI takes on according to the spectral correlation profile. MRC, EGC, ORC,
and MMSEC were considered as combining methods of the MC-CDMA system for sin-
gle user detection as well as an L-multipath Rayleigh fadingchannel. As a result of
examining MUI using 4 methods, MUI of the system using MRC wasdrawn as prod-
uct of 3 terms: data symbol, channel elements, and spectral correlation. And we veri-
fied that MUI of the system using EGC and MMSEC had a similar form to that using
MRC through approximation and simulation. In the system with S/P and interleaver, we
showed that MUI is also derived from spectral correlation.
Spectral correlation is weight which has an effect on interference so thatX(r,s)(±l)
directly affects products of multipaths spacedτl apart. Thus, we verified that if spectral
correlation at somel is 0, the corresponding interference could be 0 by derivation and
simulation. In order to confirm this, we have observed the requiredEb/No[dB] for target
46

BER 10−5 in the channel which has 2 multipaths spacedTQN apart by using 4 different
Walsh-Hadamard sequences, which haveX(r,s)(±1) = 0. As a result, the system for a
single user using MRC, EGC, and MMSEC needed 24.9, 25.3, and 25 dB, respectively,
and for 4 users, about 24.9, 25.7, and 25.7 dB, respectively.These show that there are
nearly no interferences.
The maximum absolute value of spectral correlation is a major factor affecting an
interference. Smaller the maximum absolute value is, the better the system performance,
and smaller the deviation of maximum absolute values is, thesmaller the deviation of
system performances according to user allocation is. This relates to the randomness of
sequences so that sequences which have good randomness havesmall maximum absolute
values and small deviation of maximum absolute values. A typical binary sequence
which has good randomness ism-sequence Hadamard.m-sequence Hadamard of size
8 and length 8 has smallest the maximum absolute value of 4, which is smaller than
that of Walsh-Hadamard of 5.2263, and it has the largest maximum absolute value of
5.2263, which is smaller than that of Walsh-Hadamard of 8, and it has a smaller deviation
of maximum absolute values. Thus, when the sequences are allocated to some users,
the system usingm-sequence Hadamard is better than that of Walsh-Hadamard, and
has a smaller deviation of performances. In order to confirm this, we have observed
the requiredEb/No[dB] for target BER10−5 in the channel which has 8 multipaths
spaced arbitrary apart within the guard interval. A system using MRC andm-sequence
Hadamard for 2 users needed 24.8 and 25.7dB with respect to the maximum absolute
values of 4 and 5.2263, respectively, and the one using Walsh-Hadamard needed 25.7
and 30.3dB with respect to the maximum absolute values of 5.2263 and 8, respectively.
47

A system using MMSEC andm-sequence Hadamard for 4 users needed about 21.4dB
with respect to both the largest and the smallest maximum absolute values and the one
using Walsh-Hadamard needed 21.6 and 21.7 dB with respect tothe largest and the
smallest maximum absolute values.
As a consequence of the above results, we mention the requirements of frequency
spreading sequences. First, the orthogonality of sequences to distinguish multiusers
is essential. From the derived MUI expression, the largest interference factor can be
removed by using the orthogonal sequence. Second, spectralcorrelation should be 0 or
small. From the expression, spectral correlation directlyaffects channel elements, which
also affects the interference. Third, good randomness of a sequence is required. The
more random a sequence is, the smaller the spectral correlation value and the deviation
of system performance and the better the system performanceare in case of allocation
of selected sequences to some users is carried out.
On the other hand, spectral correlation profile offers us what form MUI takes and
how it affects the system. All binary sequences and Quadri-phase Hadamard used in
this paper have same spectral correlation profile, but Zadoff-Chu sequence has a differ-
ent spectral correlation profile. Therefore, in a system which performs 1-dimensional
decision like BPSK, the interference affecting the decision is reduced. In order to con-
firm this, we have observed the requiredEb/No[dB] for target BER10−6 using BPSK
modulation. In that simulation, the system using Zadoff-Chu sequence gained 3dB as
opposed to using other sequences.
MC-CDMA which would use advantages of OFDM and CDMA is widelystudied
for high data rate multimedia communication. But MUI greatly degrades system perfor-
48

mance. In this paper, spectral correlation and spectral correlation profile are introduced
as a method to manage and analyze MUI. And we verified it by derivation and simula-
tion. The MUI of MC-CDMA can be estimated by using spectral correlation. Therefore,
sequences which is constructed based on the above fact and allocation of selected se-
quences to some users can lead better system performance andreduced deviation of
system performances.
Binary sequences are mainly dealt in this study; complex sequences, however, have
more various appearances which affect spectral correlation and system performance than
binary sequences do. Therefore, examining the relation between spectral correlation of
complex sequences and system performance would contributeto development of system
performance.
49

Bibliography
[1] D. L. Schiling. et al., “Spread sprectrum for commercialcommunications,”IEEE
Commun. Mag., pp. 66–79, April 1991.
[2] P. Jung, P. W. Baier, and A. Steil, “Advantages of CDMA andspread spectrum
techniques over fdma and tdma in cellular mobile radio applications,”IEEE Trans.
Veh. Technol., pp. 357–364, August 1993.
[3] R. Prasad, “CDMA for wireless personal communications,” Artech House Publish-
ers, 1996.
[4] S.Kaiser, “On the performance of Different detection techniques for
OFDM-CDMA in fading channels,”Global Telecommunications Conference,
1995. GLOBECOM ’95, IEEE, pp. 2059–2063, Nov 1995.
[5] S. Weinstein and P. M. Ebert, “Data transmission by frequency division multi-
plexing using the discrete fourier transform,”IEEE Trans. Commun., pp. 628–634,
October 1971.
[6] J. A. Bingham, “Multicarrier modulation for data transmission:an idea whose time
has come,”IEEE Commun. Mag., pp. 5–14, May 1990.
50

[7] N.Yee, J.-P. Linnartz, and G. Fettweis, “Multi-carrierCDMA in indoor wireless
radio networks,”in Proc. of IEEE International Symposium on Personal, Indoor
and Mobile Radio Communications(PIMRC’93), September 1993.
[8] S. Hara and R. Prasad, “Overview of multicarrier CDMA,”Communications Mag-
azine, IEEE Volume 35, Issue 12, Dec 1997.
[9] S. Abeta, H. Atarashi, M. Sawahashi and F. Adachi, “Performance of coherent
multi-carrier/DS-CDMA and MC-CDMA for broadband packet wireless access,”
IEICE Trans. Commun., pp. 406–414, 2001.
[10] Z.Li and M. Latva-aho, “MMSE based receiver design for MC-CDMA systems,”
Personal, Indoor and Mobile Radio Communications, 2003. PIMRC 2003. 14th
IEEE Proceedings on Volume 3, September 2003.
[11] Z. Li and M. Latva-aho, “Performance comparison of frequency domain equalizer
for MC-CDMA systems,”in Proc. of IEEE MWCN’01, pp. 85–59, 2001.
[12] Z.Li and M. Latva-aho, “Multicarrier CDMA system with parallel interference can-
cellation in fading channel,”in Multi-Carrier Spread Spectrum and Related Topics.
edited by K. Fazel and S. Kaiser, pp. 273–280, 2002.
[13] D. Mottier and D. Castelain, “A spreading sequence allocation procedure for
MC-CDMA transmission systems,”Vehicular Technology Conference, 2000. IEEE
VTS-Fall VTC 2000. 52nd Volume 3, 24-28, September 2000.
[14] B. M. Popovic, “Spreading sequences for multicarrier CDMA systems,”Commu-
nications, IEEE Transactions on Volume 47, Issue 6, June 1999.
51
[15] L. Hanzo, M. Munster, B. J. Choi, T. Keller,OFDM and MC-CDMA. IEEE Press,
Wiley, 2003.
[16] L. Hanzo, L-L. Yang, E-L. Kuan, and K. Yen,Single and Multi-Carrier DS-CDMA.
IEEE Press, Wiley, 2003.
[17] B. M. Popovic, “Generalized chirp-like polyphase sequences with optimum corre-
lation properties,”Information Theory, IEEE Transactions on Volume 38, Issue 4,
July 1992.
[18] B. M. Popovic, “Efficient despreaders for multi-code CDMA systems,”Univer-
sal Personal Communications Record, 1997. Conference Record., 1997 IEEE 6th
International Conference, pp. 516–520, October 1997.
[19] B. M. Popovic, N. Suehiro, P. Z. Fan,“Orthogonal sets ofquadriphase sequences
with good correlation properties,”Information Theory, IEEE Transactions on Vol-
ume 48, Issue 4, April 2002.
52

²DGëH¹כ
ªôÇSXíßú\P¦s6 xôÇMC-CDMA rÛ¼%7_×æ6 xçß[Oìr$3
ÅÒú×þ&h sçGV,\"f¦5ÅqX<s'5Åx¦0AôÇ _~½ÓZOܼÐ
×æHo#Q\¦s6 xôÇ~½ÓZOs]jîß÷&%3¦,ZÉr6 x6 x|¾Ó¦%3l0AK CDMAü<
½+ËôÇ MC-CDMA ú§s½÷&¦e. MC-CDMAHf§Ãº\P¦s6 x #ÅÒ
ú%ò%iܼÐX<s'\¦SXíß %i½+Ë<ÊܼÐ+s1pq¦%3¦ÃºeH©&h
s etëß,ÅÒú ×þ&h sç GV,\"f ÂÒìøÍ5Åx[þt_ ß¼lü< 0A©s ²út
>÷&¦,sH 6 xçß_ f§$í¦ =/BGr& ×æ 6 x çß[Os 7£xôÇH éß
&hs e."f çß[O¦ òõ&hܼР]j#Q½+É Ãº e $í0px ¾Ó©¦ u½+É Ãº e
.
MC-CDMA rÛ¼%7ÉrÅÒúSXíßú\PÐ6 x\¦ ½ìrôÇ. DS-CDMA\"f
SXíß Ãº\P_ :£¤$ís 6 x 6 x|¾Óõ rÛ¼%7 $í0px\ %ò¾Ó¦ p'¬I1pws, MC-CDMA
\"f #Q" SXíßú\P¦ 6 x Ö¼ $í0px\%ò¾Ó¦ p9 ú e¦sÒqtyכ
½+Éúe.SXíßú\PÐçß[O¦ìr$3 H _~½ÓZOܼÐ+Û¼&7àÔ!3©'a¦[þt
úe.sH×æHo#QrÛ¼%7\"fú ñ_dܼÐÂÒ'Ä»½+Éúeܼ 9,
rçß%ò%iܼÐú\P_©'a:£¤$í¦'a¹1Ï Hl>r_~½ÓZOõHÉr>h¥Æs.
×æâÐ>rF HGV,\"fú ñH"fÐÉrâÐ\¦:xõôÇ ñ[þts8
K +þAIÐ ³ð&³½+É Ãº e.Õªo¦ sQôÇ ×æ âÐ_ "fÐ Ér ß¼lü< rçß
53

tÉr 4¤"é¶rSXíß Ãº\P_ ß¼lü< 0A©_o\¦ 4Rü< SXíß Ãº\P_f§$í¦
=/BGr.Û¼&7àÔ!3©'aÉr×æâÐ\_ôÇrçßt¦í<Ê #ÅÒúSX
íßú\P_:£¤$í¦'a¹1Ï HܼÐ+ú\P_:£¤$íכõrçßt_:£¤$í¦<ÊaìøÍ
%òôÇ.
:r½\"fHÛ¼&7àÔ!3©'a¦ ¾ÓaAß¼MC-CDMA\ ú2¤l>r_>h¥ÆÐ
8"îSXy&ñ_ôÇ.Õªs6 x<ÊܼÐ+MUI¦כ d¦'a¹1Ͻ+Éúe¦,SXíßú\P
:£¤fçsìøÍ%ò)a MUI\¦]j#Q½+Éúe.rÛ¼%7 8âܼÐ+H L>h_×æâÐYU
9osçGV,õ×æHo#QrÛ¼%7¦¦9ôÇ.½+Ë~½ÓZOܼÐHMRC, EGC,
ORC, MMSEC\¦ &h6 xôÇ.sQôÇ rÛ¼%7\"f ×æ 6 x çß[Oõ Û¼&7àÔ!3 ©
'aõ_'a>\¦¶ú(RЦú\P_:£¤$ís#QbG>ìøÍ%ò÷&Ht\¦Ãºd¦:xKSXôÇ
.Õªo¦sQôÇ:£¤$ísrÛ¼%7$í0px\#Q*ôÇ%ò¾Ó¦puHt _z+«>¦:x
#7£xôÇ.ÕªõMRC_âĺçß[O¦GV,¹כèü<Û¼&7àÔ!3©'a_YLܼÐ
³ð&³½+É Ãº e%3ܼ 9Û¼&7àÔ!3 ©'as çß[O\f]X&hܼР%ò¾Ó¦ zuH¦כ SX
½+Éúe%3.sM:Û¼&7àÔ!3©'a_þj@/]X@/°úכs$í0px&ñ_ÅÒ¹כôÇ%i½+ɦ
9,ú\P_½ ü$ísy©½+Éú2¤þj@/]X@/°úכsÉrSX½+Éúe%3.ÕªA¦כ
"fÛ¼&7àÔ!3©'a_°úכs 0sÕª\K© Hçß[O$íìr 0s÷&%3.Õªo¦¿º
"î_6 x\@/K Walsh-Hadamard\¦ s6 xôÇrÛ¼%7õ m-sequence Hadamard\¦
s6 xôÇrÛ¼%7s3lq³ð BER10−5 ¦%3l0AôÇ Eb/No[dB]\¦¶ú(RФ.Õªõ
Walsh-Hadamard_ âĺH©a%~Érâĺ 25.7dB%i¦,$í0px¼#H 4.3dB%i.
ìøÍ\ m-sequence Hadamard_ âĺH © Ér âĺ 25.7dB%i¦,$í0px ¼#
H 0.9dBµ1Ú\t·ú§¤. EGC_âĺHo\¦:xKq5pwôÇd¦%3¦Ãºe
%3¦,Û¼&7àÔ!3©'a\Ér$í0pxsSX½+Éúe%3. MMSEC_âĺ
_z+«>¦:xK%ir$í0pxs\¦SX½+Éúe%3.0Aü<°ú ÉrÛ¼&7àÔ!3©'a:£¤fç
54

ܼÐÂÒ'ÅÒúSXíßú\Ps°úÆÒ#Q½+ɹכ½½ÓÉrf§$í,ÉrÛ¼&7àÔ!3©
'a°úכ,½ ü:£¤$ís¦ ú½+Éúe. ¢ôÇÛ¼&7àÔ!3©'aîrFY¦¶ú(R4§Ü¼Ð+G
V,¦ :xõôÇ Ãº ñ_ß¼lü< 0A©s #QbG> 9 rÛ¼%7 $í0px\#QbG>
6 x Ht\¦·úúe.ìr$3ôÇõ Zadoff-Chuú\P¦6 xôÇ BPSKlìøÍrÛ¼%7
sÉrú\P[þt¦6 xôÇâĺ\qK3lq³ð BER 10−6 ¦%3l0AôÇ Eb/No[dB]s
3dBÉr SX½+Éúe%3."fÛ¼&7àÔ!3©'a¦s6 x¦כ#MC-CDMA_
çß[O¦ÆÒ&ñ½+Éúe¦,s\¦½ÓܼÐú\P¦[O> #õ&hܼÐrÛ¼%7$í0px
¾Ó©¦ ½+Éúe¦.sכ
Ùþd÷&H ú: MC-CDMA,Û¼&7àÔ!3©'a,×æ6 xçß[O,ÅÒúSXíßú\P,YU9o sçGV,,½+Ë
55