Embed Size (px)
Citation preview
Multistate Demography with R?
Samir K.C.
World Population Program - IIASA
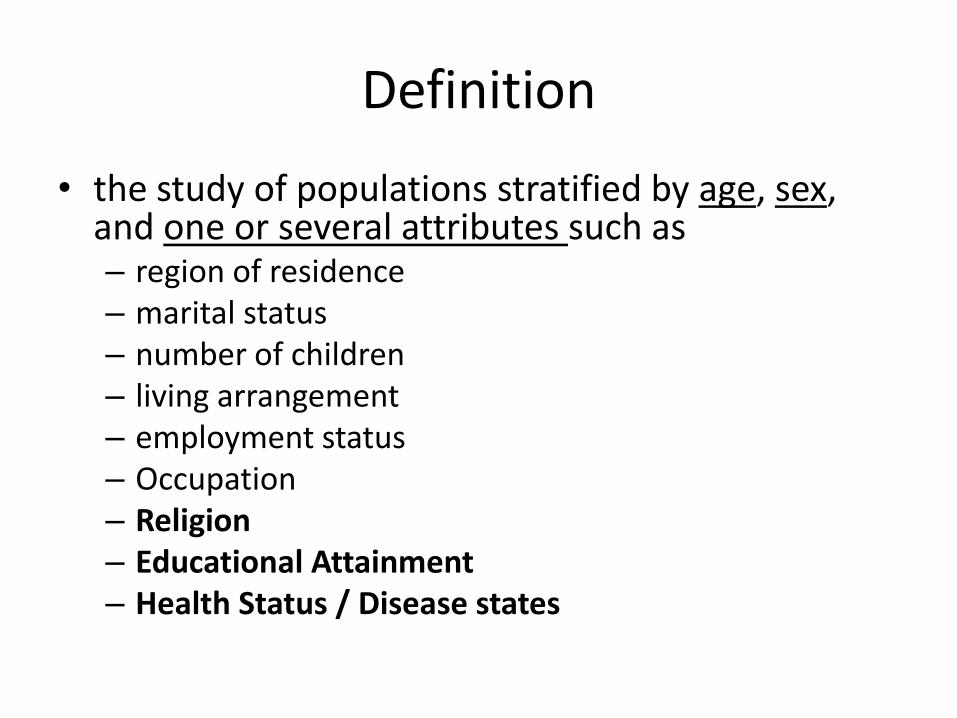
Definition
• the study of populations stratified by age, sex, and one or several attributes such as – region of residence– marital status– number of children– living arrangement– employment status– Occupation– Religion– Educational Attainment– Health Status / Disease states
Definition
• A population that is stratified is a multistate population,
• and people who occupy the same state constitute a subpopulation
• the dynamics of multistate populations are governed by– differential fertility and mortality (and migration)
– the transfer of individuals between subpopulations.
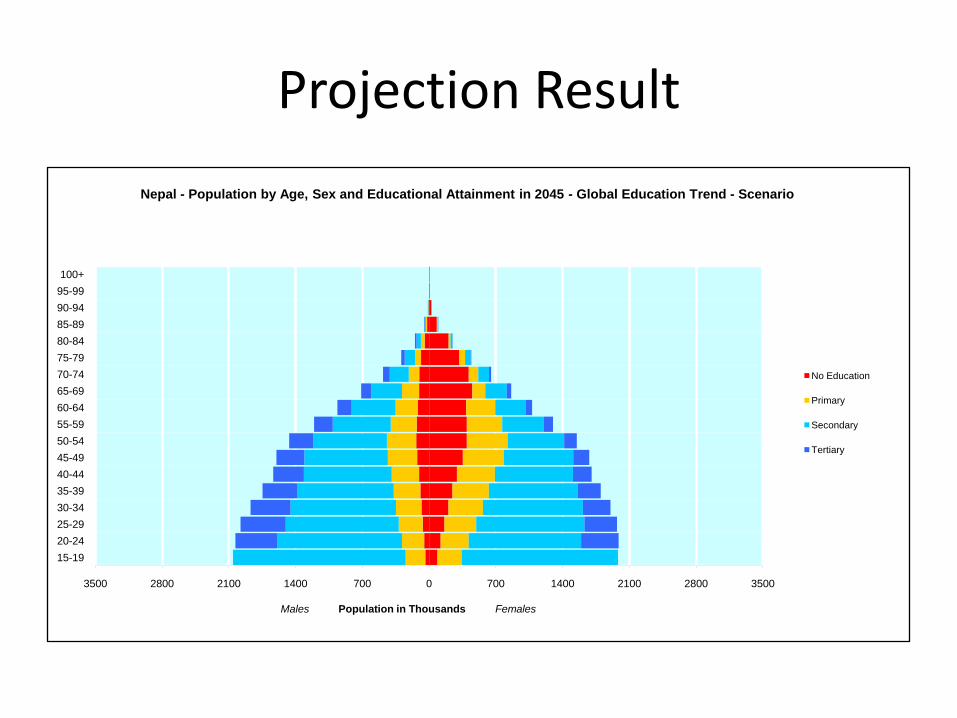
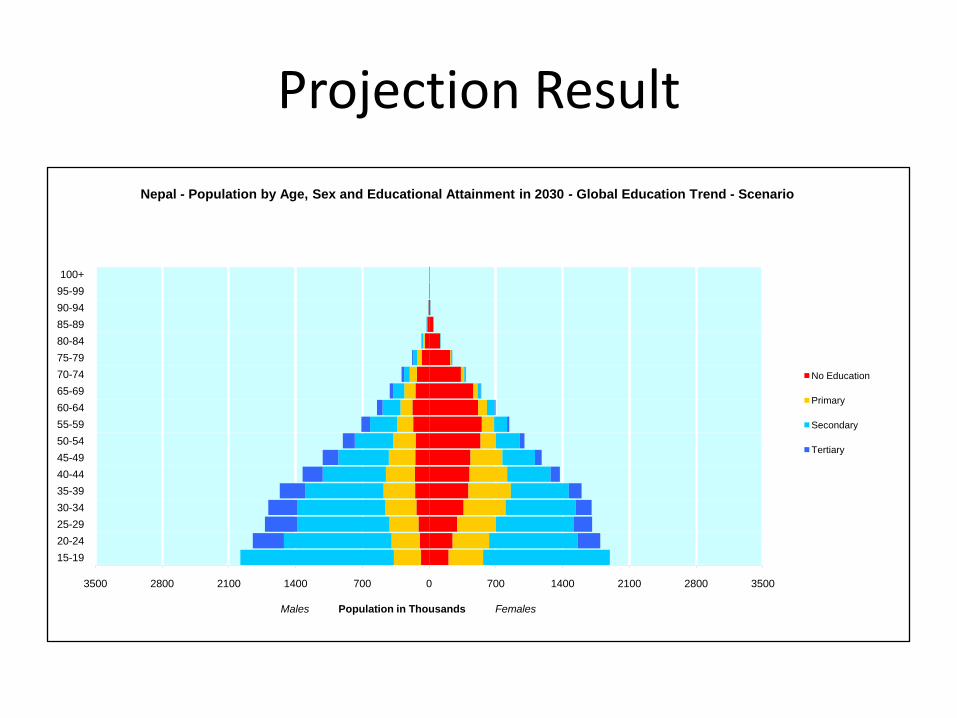
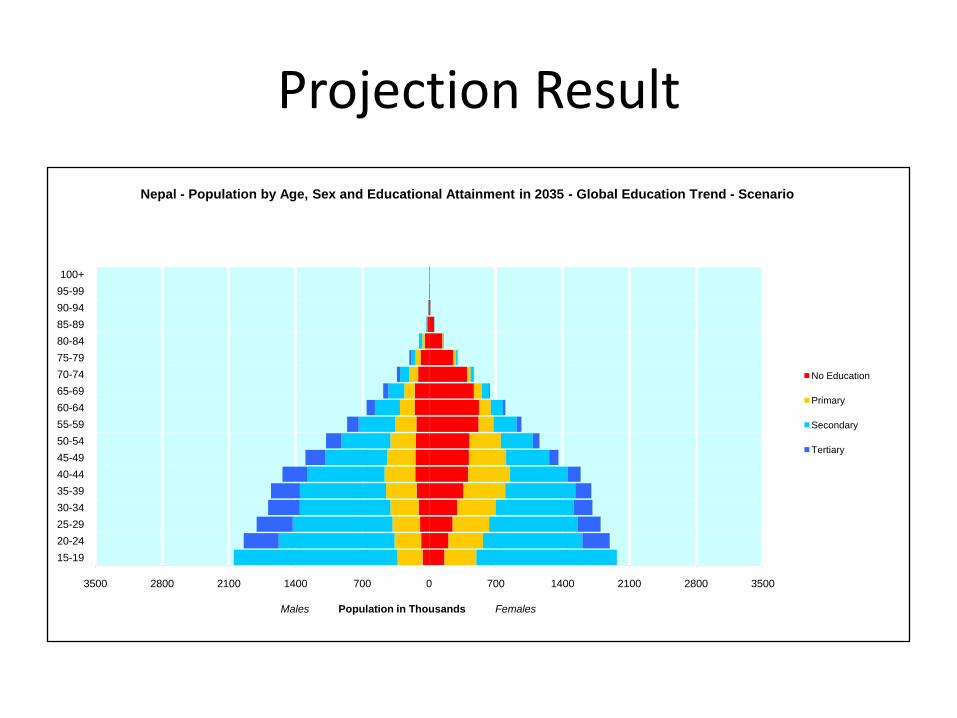
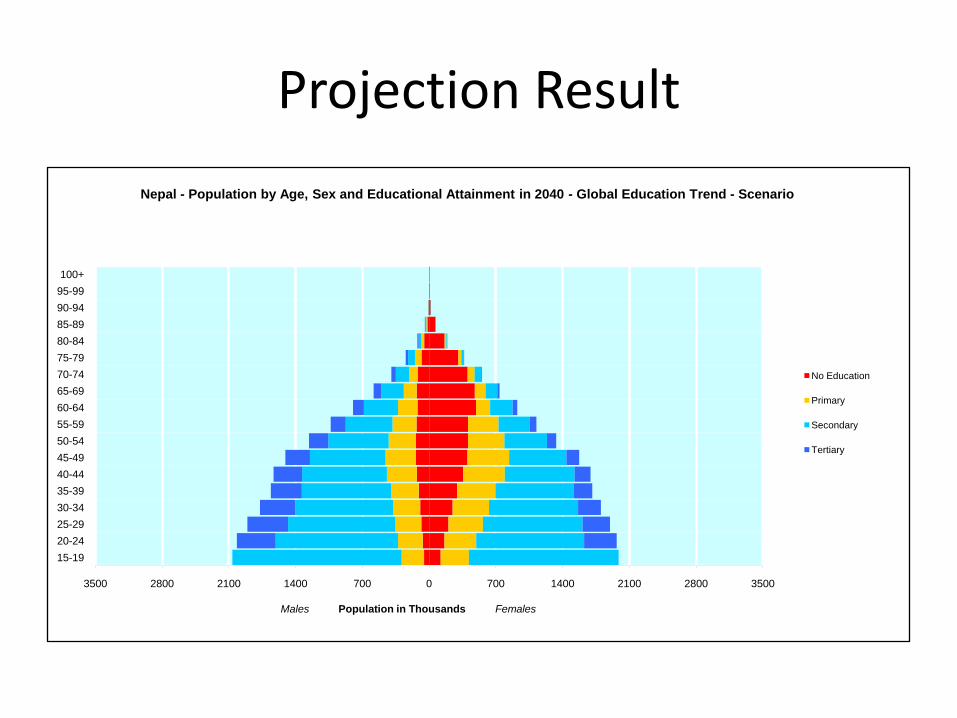
Projection Result
3500 2800 2100 1400 700 0 700 1400 2100 2800 3500
15-19
20-24
25-29
30-34
35-39
40-44
45-49
50-54
55-59
60-64
65-69
70-74
75-79
80-84
85-89
90-94
95-99
100+
Males Population in Thousands Females
Nepal - Population by Age, Sex and Educational Attainment in 2045 - Global Education Trend - Scenario
No Education
Primary
Secondary
Tertiary
History
• pioneered by Andrei Rogers in the 1960s and 1970s (at IIASA)– a multiregional system (Demography in 1966) and in
book form in 1975.
– systems of simultaneous linear equations, conveniently represented in matrix notation.
• broadening of multiregional demography into multistate demography was triggered by Robert Schoen's – by marital status (Schoen 1975).
History
• Philip Rees developed an accounting system for multiregional populations, pursuing some ideas from Rogers and having been influenced by earlier work of the economist Richard Stone (1913–1991), who initiated economic and social accounting in the early 1960s (Rees and Wilson, 1977).
• Accounts–in this case comprising population stocks and flows–have a great advantage: They must balance. Differences in data type, inconsistencies, and other data problems are easily identified. From their beginning, multistate models followed the accounting tradition prevailing in demography and the actuarial sciences.
History
• Multistate models, and in particular the multistate life table, however, could also be viewed as applications of mathematical statistics, based in probability theory. Supporters of this perspective–Jan M. Hoem, Michael T. Hannan, and others–identified common features of the questions demographers try to answer using the life table and those addressed in the fields of survival analysis and event-history analysis with their focus on models of duration dependence. Age is viewed as a duration variable. The two distinct traditions persist (see Bogue et al. 1993, Chapters 21-22 for an accessible introduction).
Multistate Model
• At any point in time, an individual occupies a state, and
• the distribution of people over the various states determines the population structure.
• State occupancies change over time as a result of – interstate transitions people experience and
– differential entries from and exits to the rest of the world.
Life Table and Projection Model
• The multistate life table describes how the size and composition of a (synthetic) cohort change over time.
• Multistate projection models describe how the population structure (stock) at a given time depends on the initial population and the transitions people make (flows).
Transition Rates and Probabilities
• The dynamics of a multistate population–a cohort or an age-graded population–are based on transition rates and transition probabilities.
• Rates relate the number of transitions people make to the duration at risk of a transition.
• Probabilities relate transitions to the population at risk at the beginning of an interval.
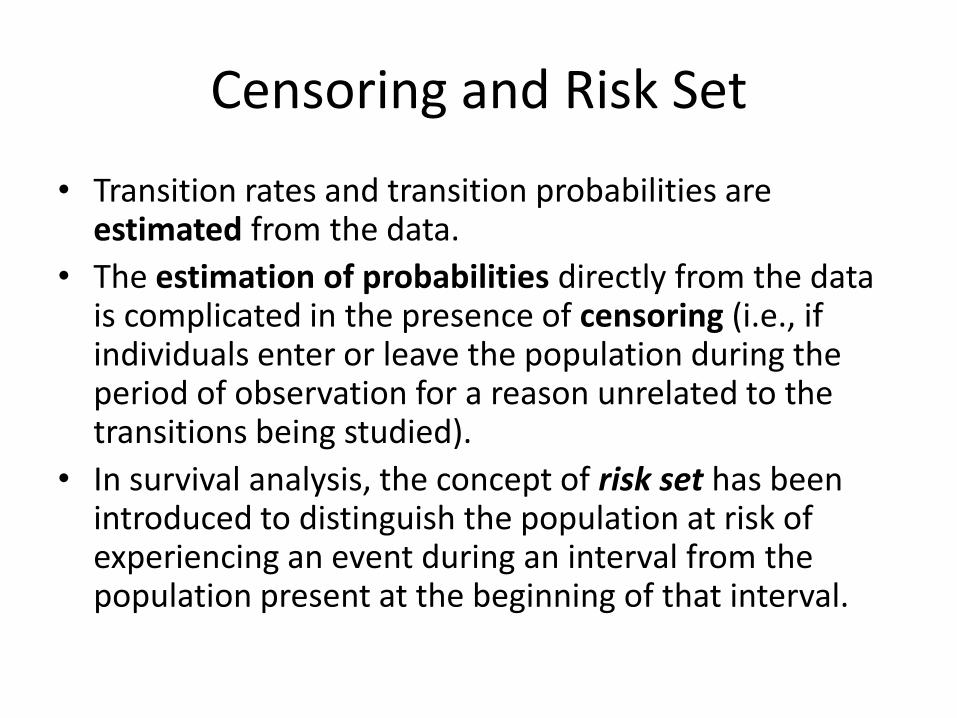
Censoring and Risk Set
• Transition rates and transition probabilities are estimated from the data.
• The estimation of probabilities directly from the data is complicated in the presence of censoring (i.e., if individuals enter or leave the population during the period of observation for a reason unrelated to the transitions being studied).
• In survival analysis, the concept of risk set has been introduced to distinguish the population at risk of experiencing an event during an interval from the population present at the beginning of that interval.
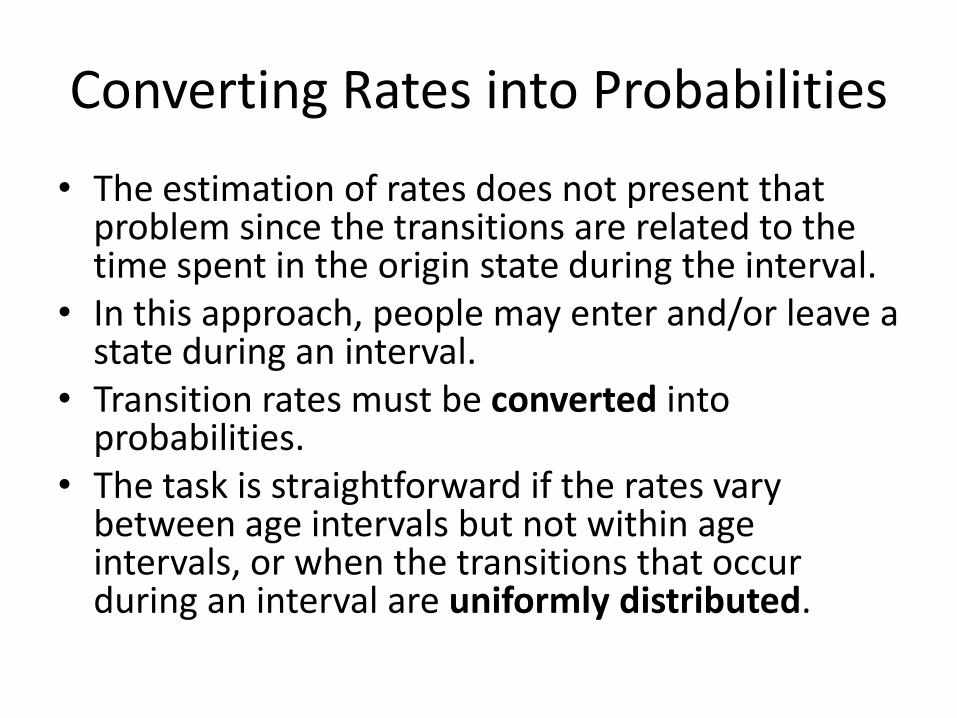
Converting Rates into Probabilities
• The estimation of rates does not present that problem since the transitions are related to the time spent in the origin state during the interval.
• In this approach, people may enter and/or leave a state during an interval.
• Transition rates must be converted into probabilities.
• The task is straightforward if the rates vary between age intervals but not within age intervals, or when the transitions that occur during an interval are uniformly distributed.
Examples:
• Multistate cohort component projection
• By Age, Sex and Education
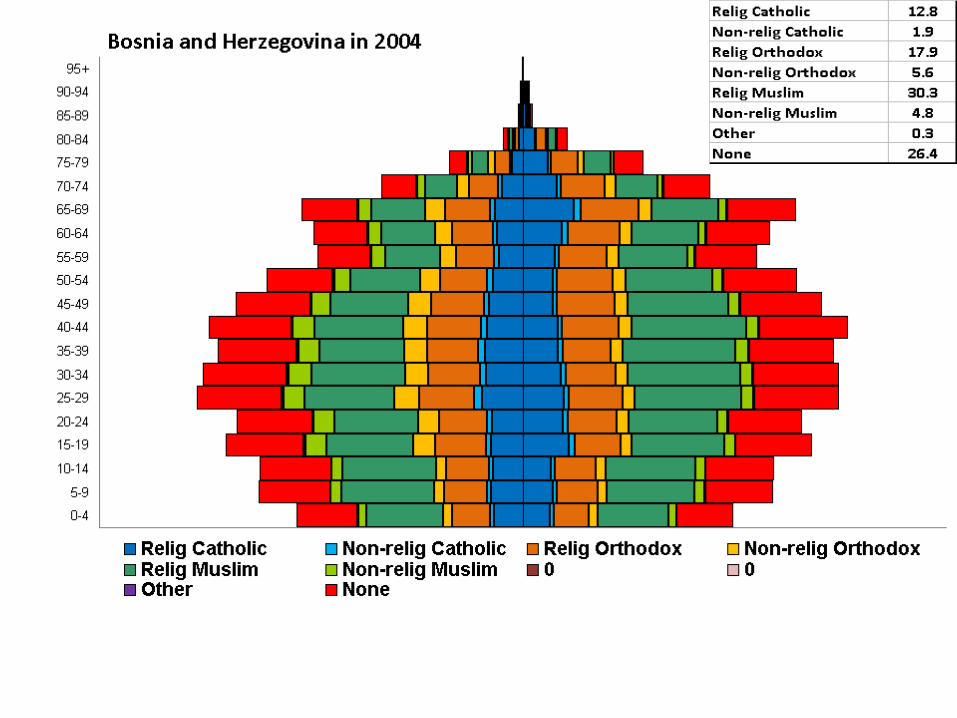
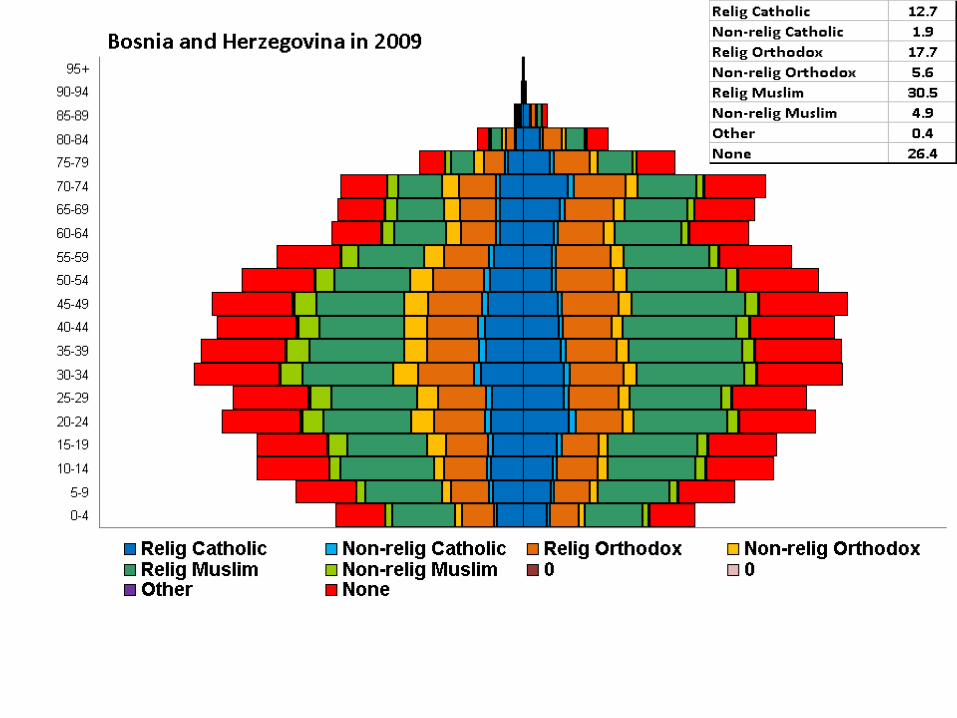
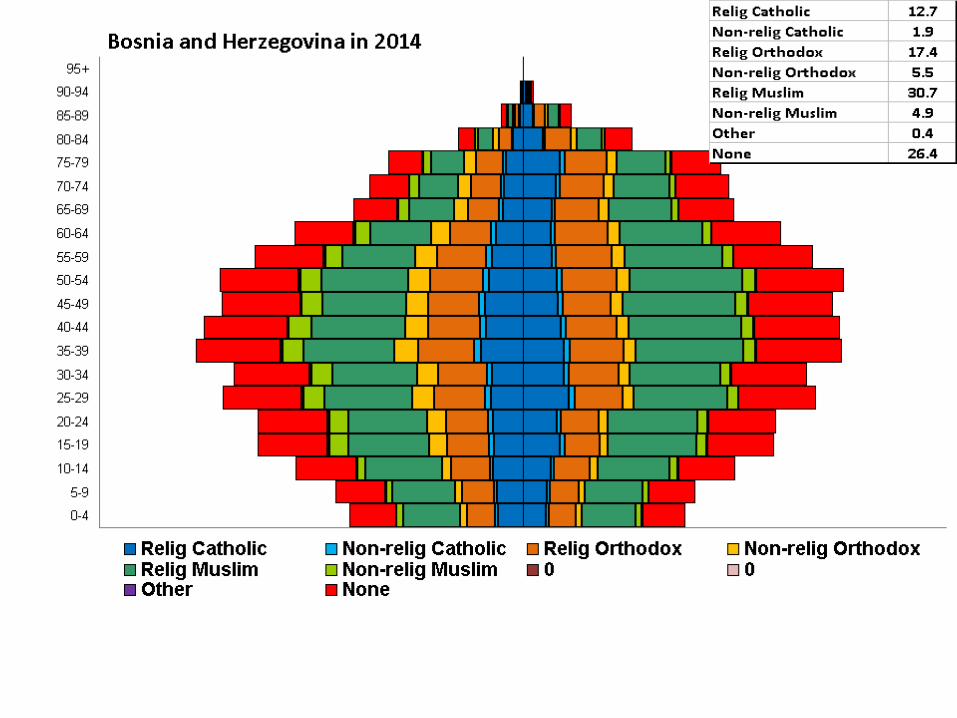
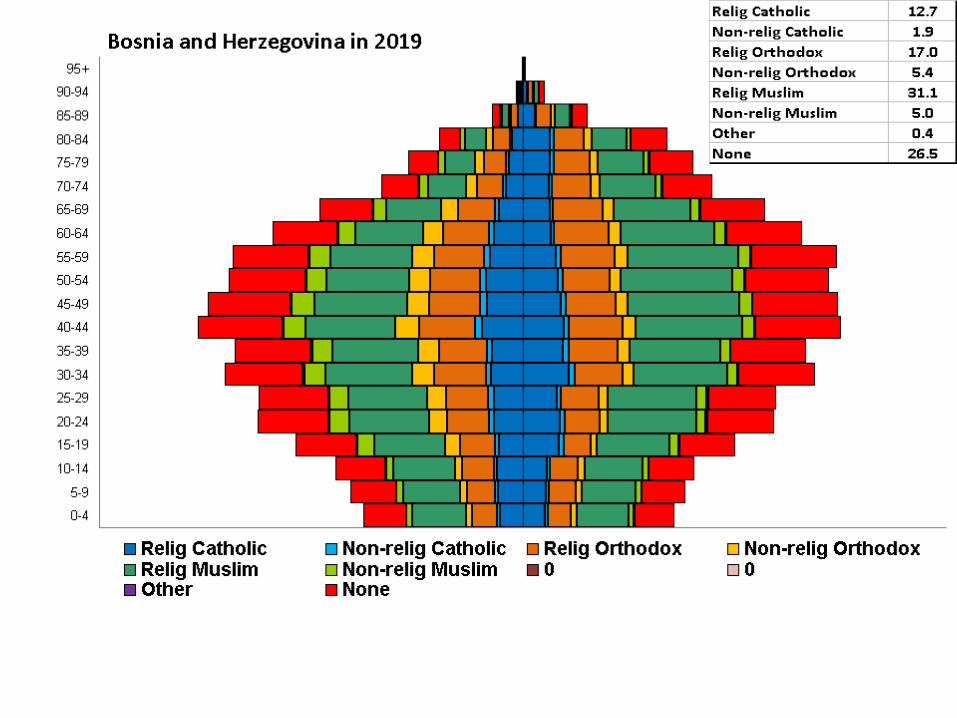
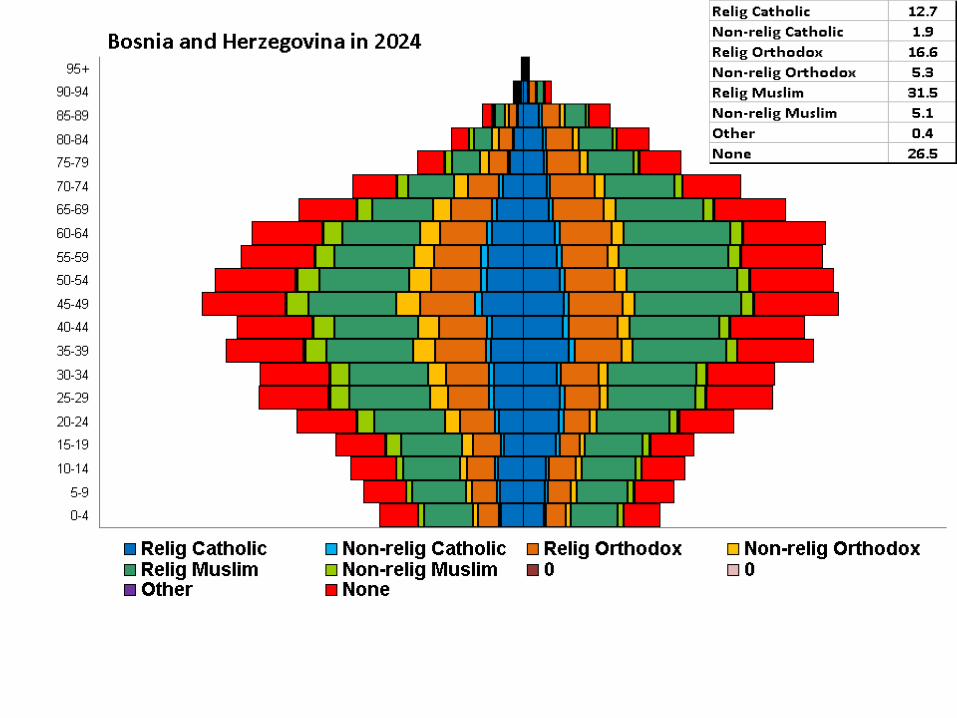
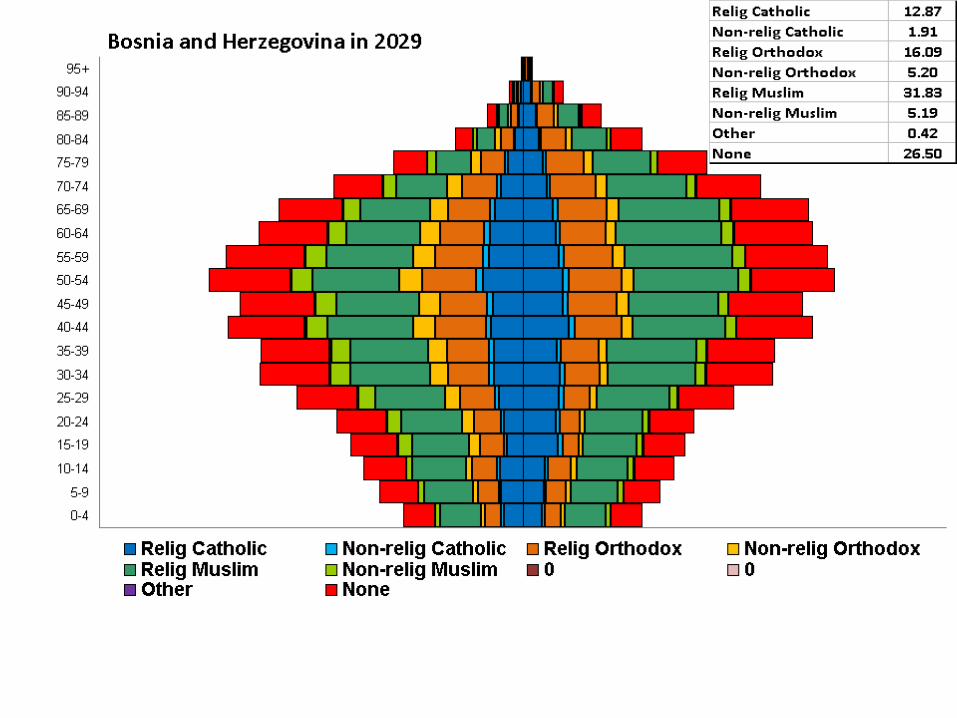
• By Age, Sex and Religion
• By Age, Sex, Education, Health Status (ongoing)
Projection Result
3500 2800 2100 1400 700 0 700 1400 2100 2800 3500
15-19
20-24
25-29
30-34
35-39
40-44
45-49
50-54
55-59
60-64
65-69
70-74
75-79
80-84
85-89
90-94
95-99
100+
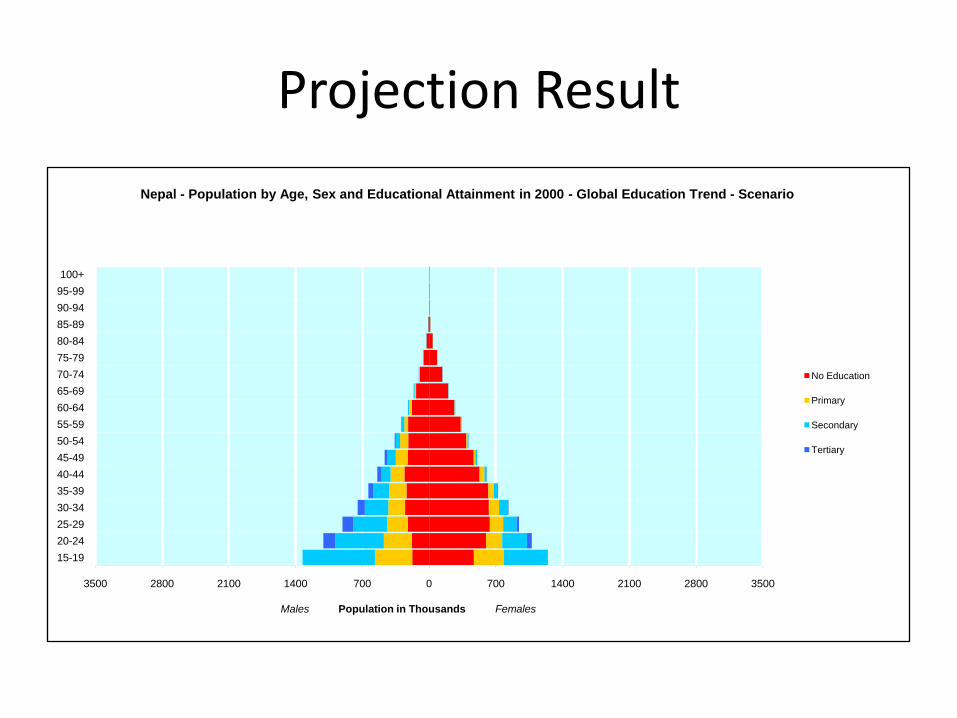
Males Population in Thousands Females
Nepal - Population by Age, Sex and Educational Attainment in 2000 - Global Education Trend - Scenario
No Education
Primary
Secondary
Tertiary

Projection Result
3500 2800 2100 1400 700 0 700 1400 2100 2800 3500
15-19
20-24
25-29
30-34
35-39
40-44
45-49
50-54
55-59
60-64
65-69
70-74
75-79
80-84
85-89
90-94
95-99
100+
Males Population in Thousands Females
Nepal - Population by Age, Sex and Educational Attainment in 2005 - Global Education Trend - Scenario
No Education
Primary
Secondary
Tertiary
Projection Result
3500 2800 2100 1400 700 0 700 1400 2100 2800 3500
15-19
20-24
25-29
30-34
35-39
40-44
45-49
50-54
55-59
60-64
65-69
70-74
75-79
80-84
85-89
90-94
95-99
100+
Males Population in Thousands Females
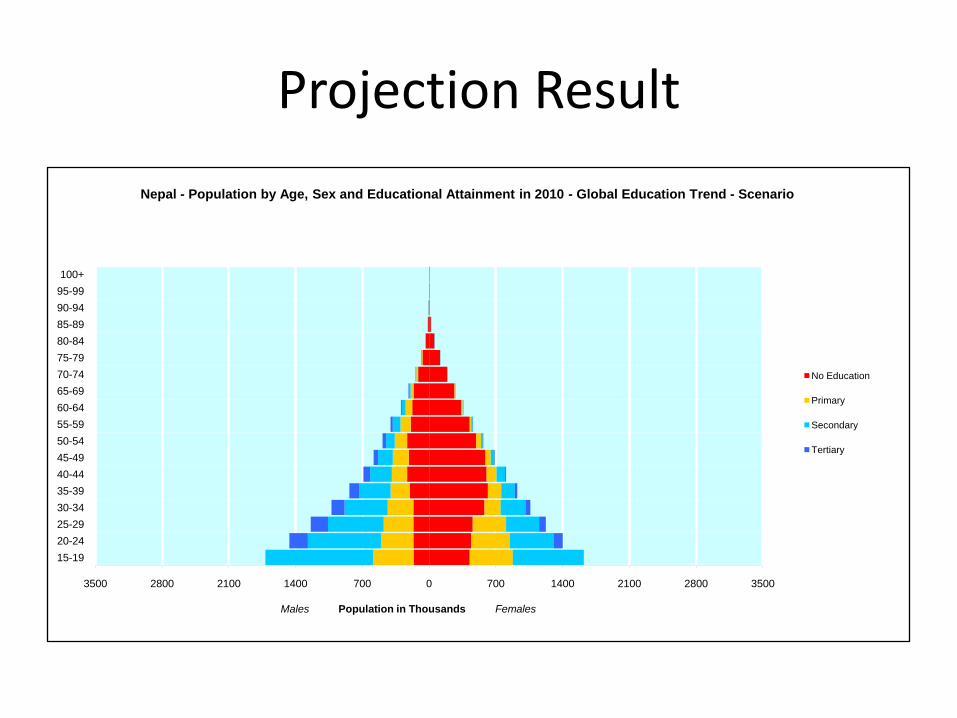
Nepal - Population by Age, Sex and Educational Attainment in 2010 - Global Education Trend - Scenario
No Education
Primary
Secondary
Tertiary
Projection Result
3500 2800 2100 1400 700 0 700 1400 2100 2800 3500
15-19
20-24
25-29
30-34
35-39
40-44
45-49
50-54
55-59
60-64
65-69
70-74
75-79
80-84
85-89
90-94
95-99
100+
Males Population in Thousands Females
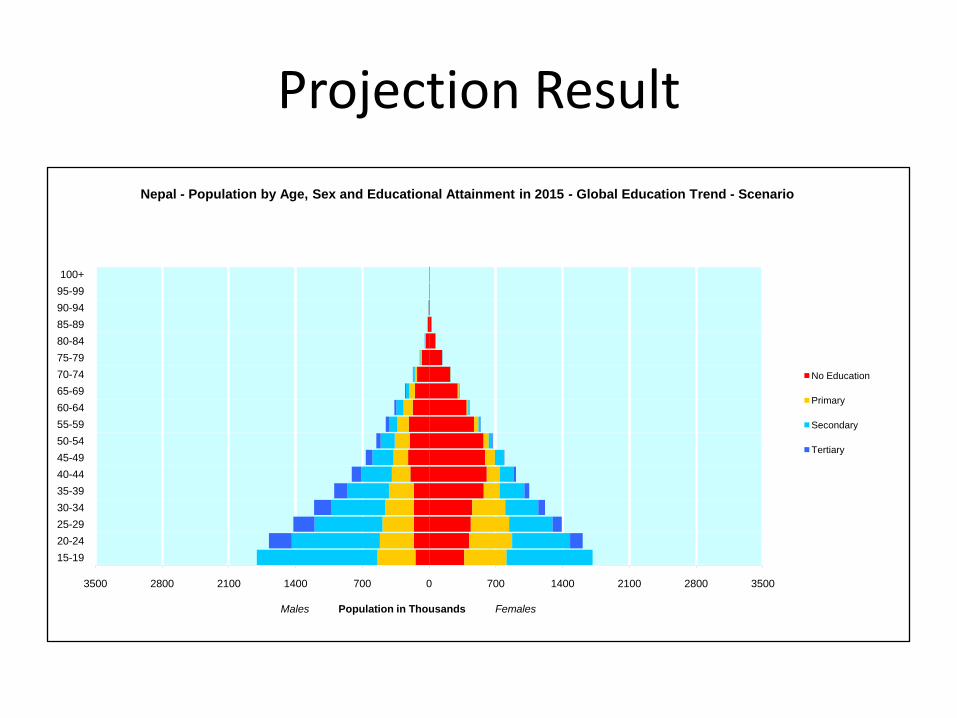
Nepal - Population by Age, Sex and Educational Attainment in 2015 - Global Education Trend - Scenario
No Education
Primary
Secondary
Tertiary
Projection Result
3500 2800 2100 1400 700 0 700 1400 2100 2800 3500
15-19
20-24
25-29
30-34
35-39
40-44
45-49
50-54
55-59
60-64
65-69
70-74
75-79
80-84
85-89
90-94
95-99
100+
Males Population in Thousands Females
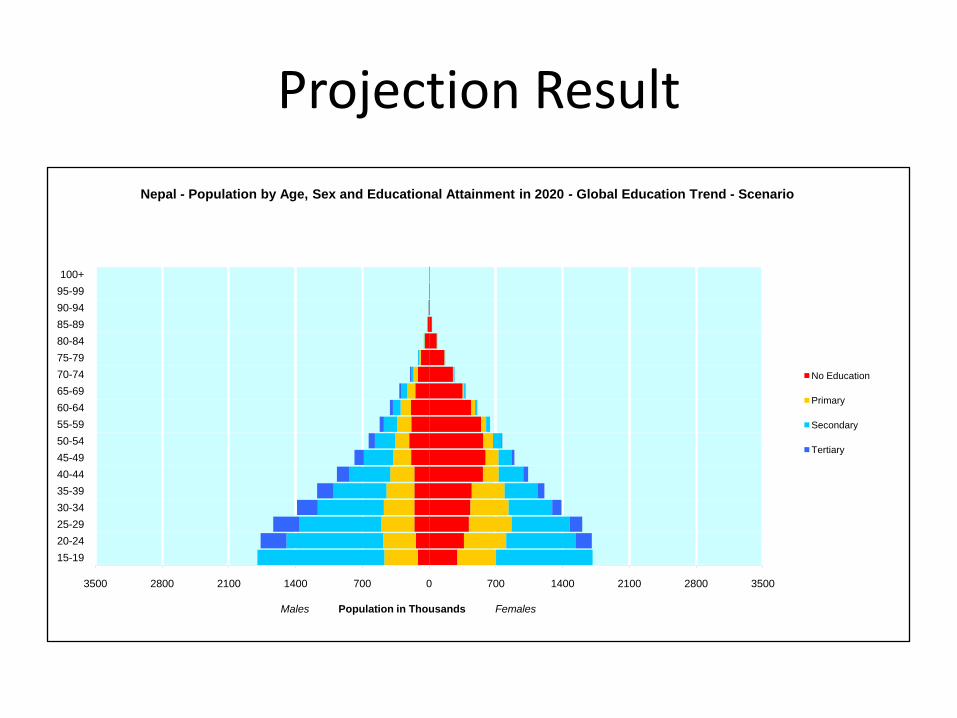
Nepal - Population by Age, Sex and Educational Attainment in 2020 - Global Education Trend - Scenario
No Education
Primary
Secondary
Tertiary
Projection Result
3500 2800 2100 1400 700 0 700 1400 2100 2800 3500
15-19
20-24
25-29
30-34
35-39
40-44
45-49
50-54
55-59
60-64
65-69
70-74
75-79
80-84
85-89
90-94
95-99
100+
Males Population in Thousands Females
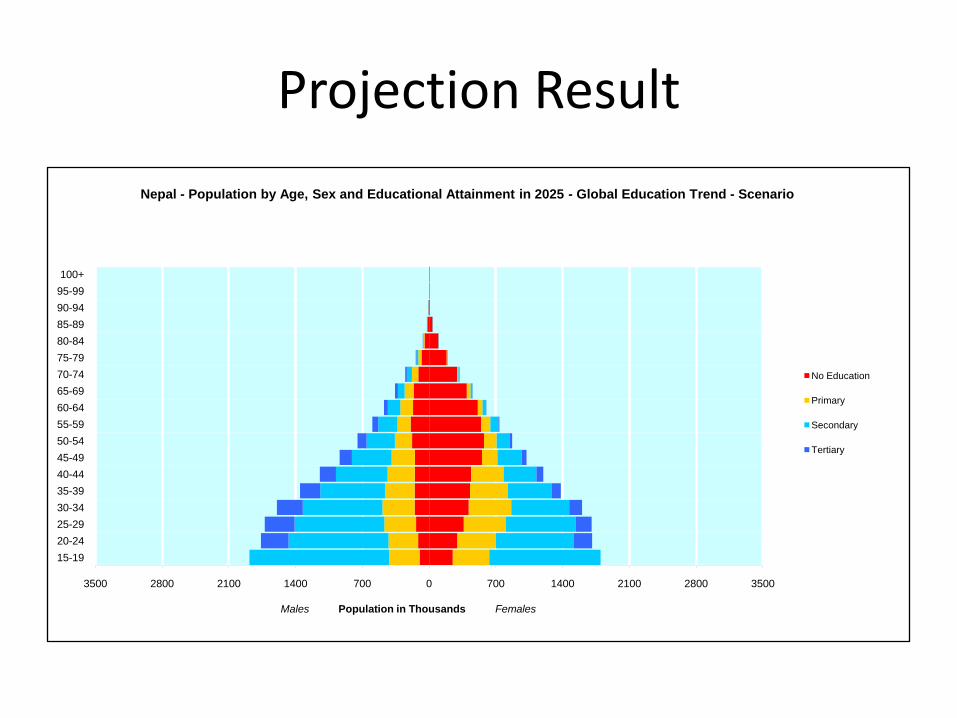
Nepal - Population by Age, Sex and Educational Attainment in 2025 - Global Education Trend - Scenario
No Education
Primary
Secondary
Tertiary
Projection Result
3500 2800 2100 1400 700 0 700 1400 2100 2800 3500
15-19
20-24
25-29
30-34
35-39
40-44
45-49
50-54
55-59
60-64
65-69
70-74
75-79
80-84
85-89
90-94
95-99
100+
Males Population in Thousands Females
Nepal - Population by Age, Sex and Educational Attainment in 2030 - Global Education Trend - Scenario
No Education
Primary
Secondary
Tertiary
Projection Result
3500 2800 2100 1400 700 0 700 1400 2100 2800 3500
15-19
20-24
25-29
30-34
35-39
40-44
45-49
50-54
55-59
60-64
65-69
70-74
75-79
80-84
85-89
90-94
95-99
100+
Males Population in Thousands Females
Nepal - Population by Age, Sex and Educational Attainment in 2035 - Global Education Trend - Scenario
No Education
Primary
Secondary
Tertiary
Projection Result
3500 2800 2100 1400 700 0 700 1400 2100 2800 3500
15-19
20-24
25-29
30-34
35-39
40-44
45-49
50-54
55-59
60-64
65-69
70-74
75-79
80-84
85-89
90-94
95-99
100+
Males Population in Thousands Females
Nepal - Population by Age, Sex and Educational Attainment in 2040 - Global Education Trend - Scenario
No Education
Primary
Secondary
Tertiary

Projection Result
3500 2800 2100 1400 700 0 700 1400 2100 2800 3500
15-19
20-24
25-29
30-34
35-39
40-44
45-49
50-54
55-59
60-64
65-69
70-74
75-79
80-84
85-89
90-94
95-99
100+
Males Population in Thousands Females
Nepal - Population by Age, Sex and Educational Attainment in 2045 - Global Education Trend - Scenario
No Education
Primary
Secondary
Tertiary
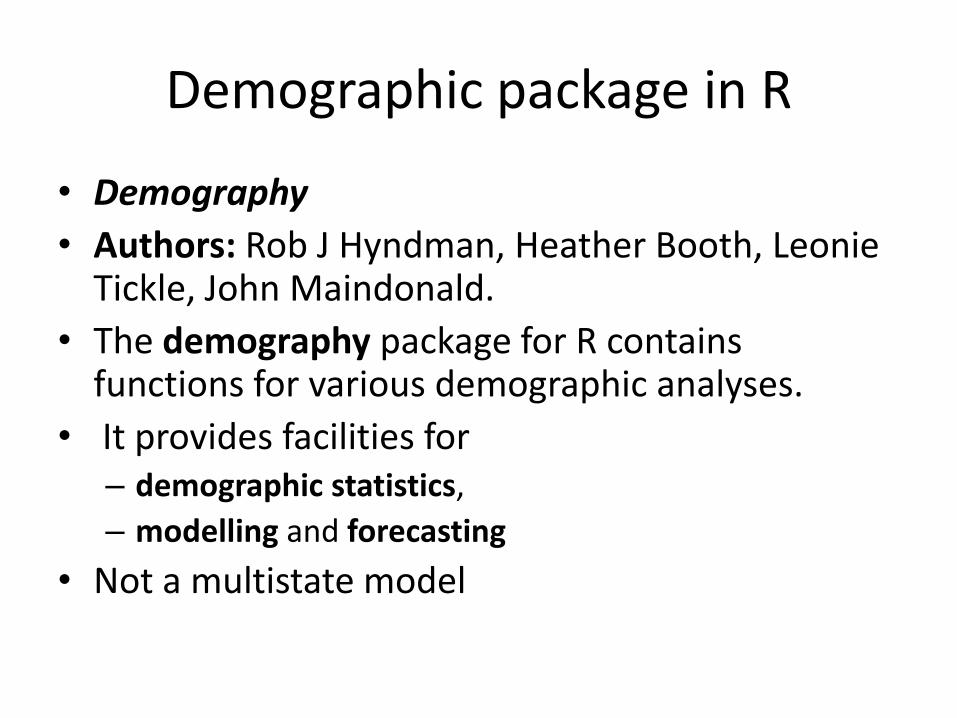
Demographic package in R
• Demography
• Authors: Rob J Hyndman, Heather Booth, Leonie Tickle, John Maindonald.
• The demography package for R contains functions for various demographic analyses.
• It provides facilities for– demographic statistics,
– modelling and forecasting
• Not a multistate model
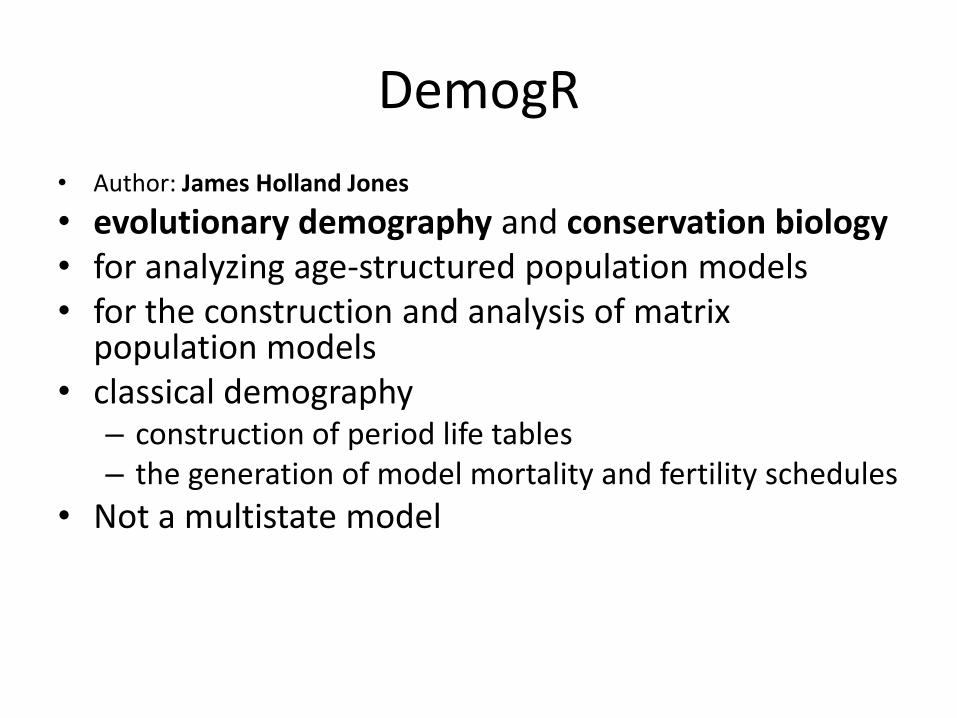
DemogR
• Author: James Holland Jones
• evolutionary demography and conservation biology• for analyzing age-structured population models• for the construction and analysis of matrix
population models• classical demography
– construction of period life tables– the generation of model mortality and fertility schedules
• Not a multistate model
Popbio
• Projection matrix models
• Plant demography studies
• Stubben and Milligan, 2007
• Not a multi-state model
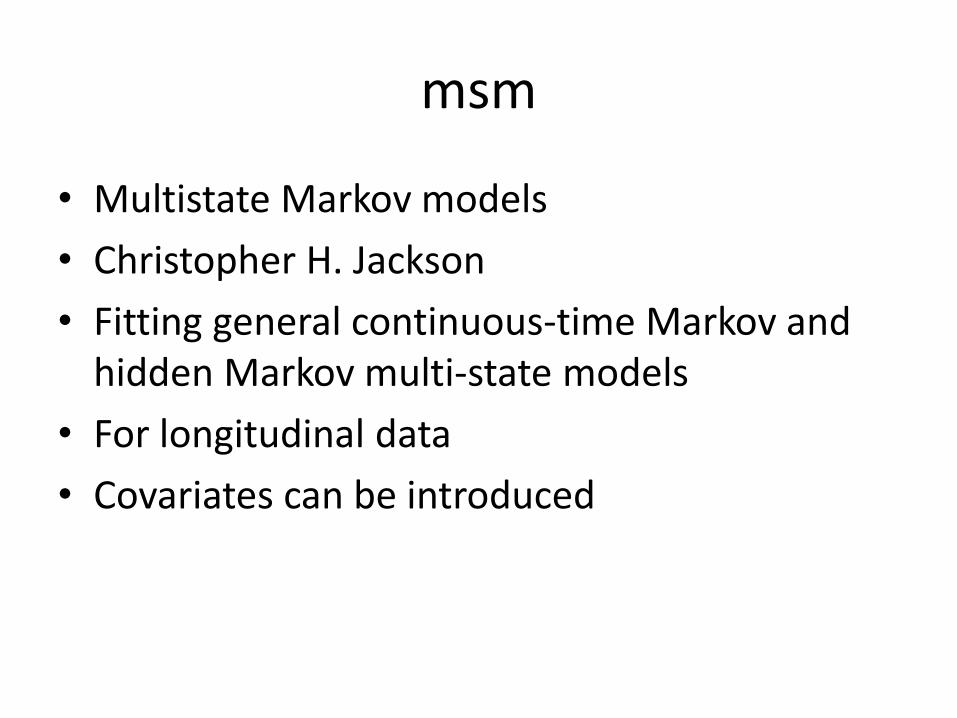
msm
• Multistate Markov models
• Christopher H. Jackson
• Fitting general continuous-time Markov and hidden Markov multi-state models
• For longitudinal data
• Covariates can be introduced
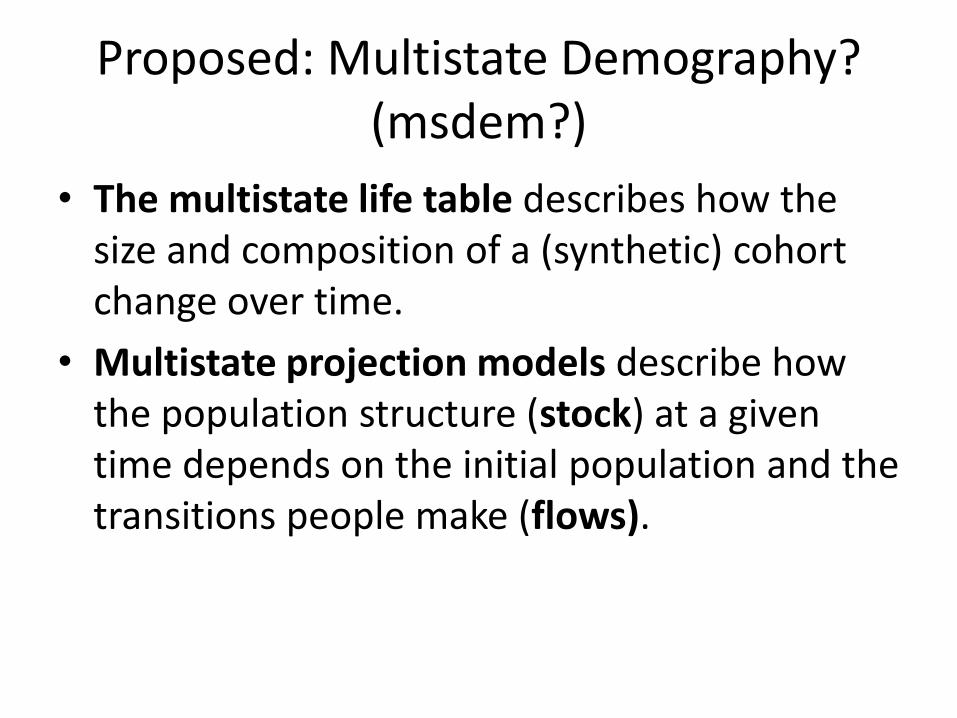
Proposed: Multistate Demography? (msdem?)
• The multistate life table describes how the size and composition of a (synthetic) cohort change over time.
• Multistate projection models describe how the population structure (stock) at a given time depends on the initial population and the transitions people make (flows).
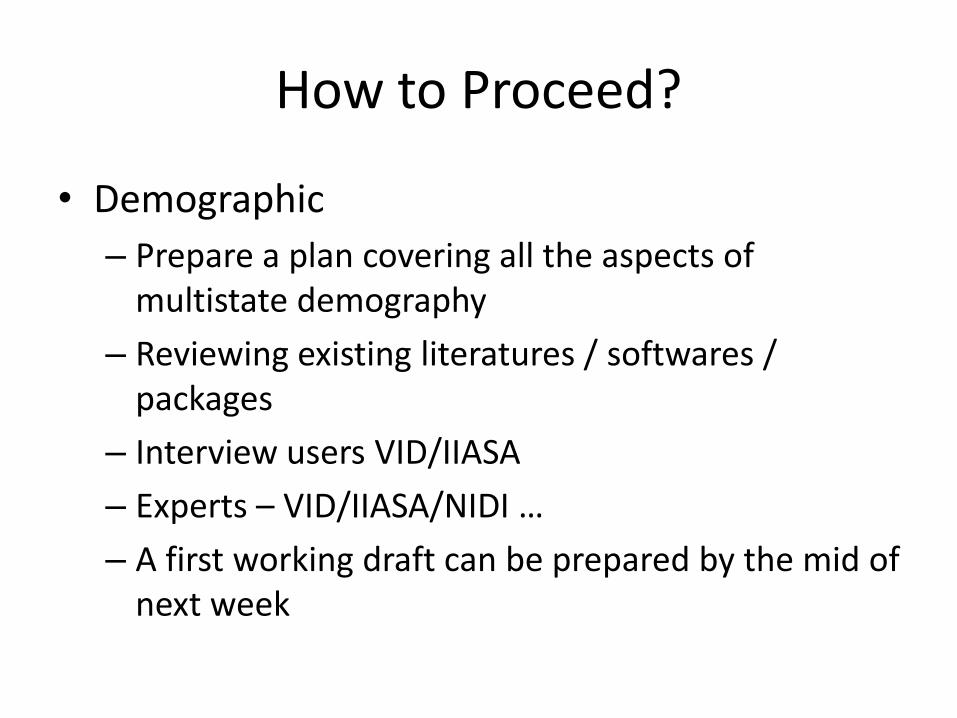
How to Proceed?
• Demographic
– Prepare a plan covering all the aspects of multistate demography
– Reviewing existing literatures / softwares / packages
– Interview users VID/IIASA
– Experts – VID/IIASA/NIDI …
– A first working draft can be prepared by the mid of next week
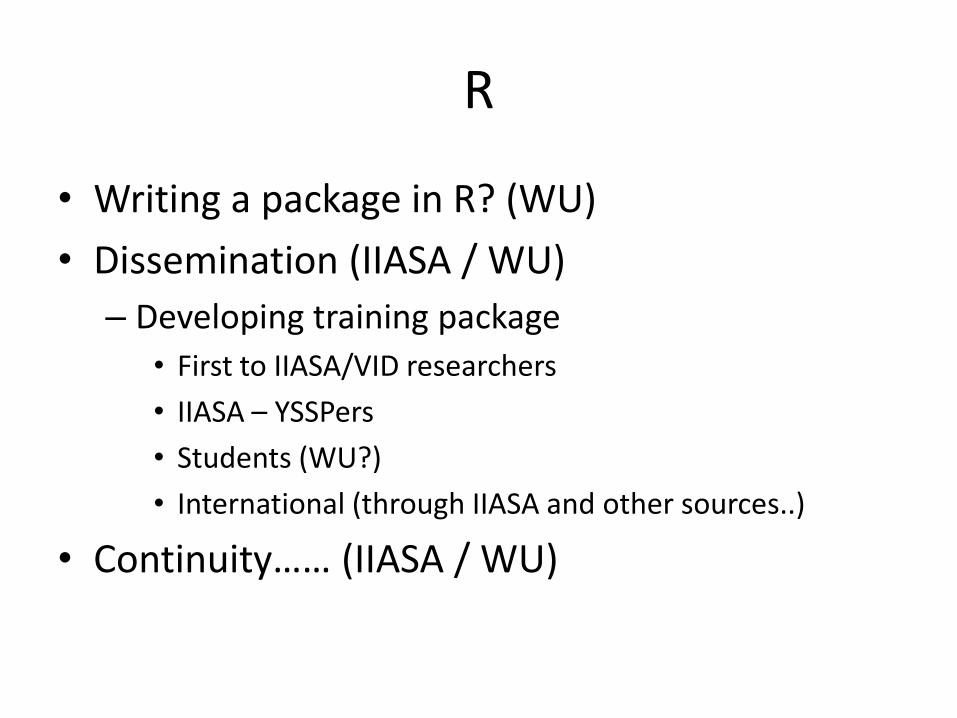
R
• Writing a package in R? (WU)
• Dissemination (IIASA / WU)
– Developing training package
• First to IIASA/VID researchers
• IIASA – YSSPers
• Students (WU?)
• International (through IIASA and other sources..)
• Continuity…… (IIASA / WU)