Embed Size (px)
Citation preview

MAY 1999 901G A R R E A U D
q 1999 American Meteorological Society
Multiscale Analysis of the Summertime Precipitation over the Central Andes
RENE D. GARREAUD*
Department of Atmospheric Sciences, University of Washington, Seattle, Washington
(Manuscript received 8 February 1998, in final form 28 May 1998)
ABSTRACT
Precipitation over the central Andes in South America exhibits a marked annual march, with most of therainfall concentrated during the austral summer season (December–February), when the atmospheric circulationfavors the uplifting of moist air from the lowlands to the east of the mountain range. Within its rainy season,the central Andes experiences week-long rainy and dry episodes. The large-scale and local conditions duringthese episodes are investigated using satellite imagery, reanalyzed atmospheric fields, and in situ data. Despitethe deep layer of conditional instability prevalent during most summertime afternoons, deep convection canoccur only on those days in which the mixing ratio within the local boundary layer exceeds some threshold(;7 g kg21), yielding saturation of near-surface air parcels rising more than 600 m above ground. Convectivecloudiness anomalies over the central Andes extend southeastward and tend to be concurrent with anomalies ofopposite sign over the eastern part of the continent. Rainy (dry) episodes are also associated with anticyclonic(cyclonic) anomalies centered over subtropical South America that extend through the depth of the troposphere,accompanied by easterly (westerly) wind anomalies over the central Andes. These anomalies are presumablyforced by planetary waves originating in the Southern Hemisphere extratropics.
To gain insight into the regional processes linking the large-scale and local conditions, The PennsylvaniaState University–National Center for Atmospheric Research Mesoscale Model Version 5.2 was used to simulatecontrasting rainy and dry episodes. The most marked and relevant differences are the strength and extent ofdiurnally varying flow over the eastern slope of the Andes. During the rainy simulation, strong easterly windsreach the upper part of the slope by midmorning, initiating an intrusion of warm and moist air (high ue airoriginating in the eastern lowlands) into the central Andes. In the dry case, the moisture transport from the eastis restricted to the eastern slope of the Andes, and the central Andes is flooded by low ue air from the westernfoothills that cannot support deep convection even in the presence of localized updrafts. The momentum balancebased on the model output indicates that turbulent momentum mixing from aloft (determined by the large-scaleanomalies of the upper-level flow) into the convective boundary layer is the leading term causing the differencesin the daytime upslope flow (and hence moisture transport) over the upper part of the eastern side of the Andesbetween rainy and dry simulations.
1. Introduction
The influence of mountains upon the intensity, po-sition, and timing of convective rainfall is widely rec-ognized (e.g., Banta 1991; Houze 1993). From a con-tinental-scale perspective there is a clear enhancementof convective rainfall over or near large mountain rang-es, particularly during the warm season. For instance,during the boreal summer, convection over CentralAmerica is enhanced over the western slopes of theSierra Madre Occidental, extending northwestwardalong the continental divide as far as the southwestern
* Current affiliation: Department of Geophysics, University ofChile, Santiago, Chile.
Corresponding author address: Dr. Rene D. Garreaud, Departmentof Geophysics, University of Chile, Casilla 2777, Santiago, Chile.E-mail: [email protected]
United States (Negri et al. 1993). Summertime convec-tion over the Colorado Rockies propagates eastward ina significant number of cases, becoming mesoscale con-vective systems over the Great Plains states (e.g., Tripoliand Cotton 1989). Heavy summertime rainfall also char-acterizes the eastern edge of the Tibetan Plateau (Tangand Reiter 1984). During the austral summer (Decem-ber–January–February, DJF), a distinctive band of deepconvection is found along the central Andes in SouthAmerica (Fig. 1), separate from a more extensive areaof convective cloudiness over the central part of thecontinent (e.g., Garreaud and Wallace 1997).
The Andes range is one of the most important to-pographic features of South America, extending fromnorth of the equator to the southern tip of the continent.Along its central portion (158–228S) it splits into tworanges surrounding an intermountain basin, known asthe Altiplano, about 250 km wide and at an averageelevation of 3800 m (;620 hPa) (Fig. 2). To the westof the central Andes, the South Pacific subtropical an-ticyclone produces dry and stable conditions, with moist

902 VOLUME 127M O N T H L Y W E A T H E R R E V I E W
FIG. 1. (a) Austral summer (DJF) climatological mean OLR and200-hPa winds. Light, medium, and dark shading indicate OLR valuesless than 230, 220, and 210 W m22, respectively. The thin dashedline represents the Andes mountains. (b) As in (a) but for 850-hPawinds. The open box in (b) indicates the outer domain used in themodel simulation.
FIG. 2. Topographic map of the central Andes. Elevation scale inmeters MSL. The small open circle indicates the location of Visviri.The open box indicates the inner domain used in the model simulation.
air confined below the base of the subsidence inversionaround 900 hPa, whereas over the lowlands to the eastof the Andes the low-level circulation is controlled bya heat low (e.g., Zhou and Lau 1998) and high humid-ities prevail in the lower and middle troposphere. Thismarked difference in moisture on the two sides of thecentral Andes is illustrated in Fig. 3, which shows theclimatological profiles of water vapor mixing ratio. Sit-uated in between these contrasting atmospheric condi-tions, the Altiplano exhibits distinctive climatic featuresdescribed in Aceituno (1997) and summarized later inthis paper.
Early studies have documented the episodic and con-vective nature of the rainfall over the Altiplano asso-ciated with uplifting of moist air from the lowlands tothe east of the Andes (Schwerdtfeger 1976; Fuenzalidaand Rutllant 1987; Aceituno and Montecinos 1993). Ina study of the mean summertime precipitation over
South America using a general circulation model, Len-ters and Cook (1995) also found that vertical moistureflux convergence due to the local orography is the lead-ing mechanism governing the precipitation over the Al-tiplano. Rao and Erdogan (1989) computed the meanatmospheric heat balance over the Altiplano using con-ventional surface and satellite radiation data for January1979. Their results indicate the existence of an atmo-spheric heat source over most of the Altiplano, with anaverage heating rate of 1 K day21 for the 700–100-hPalayer dominated by the contribution of the latent heat(;500 W m22). More recent works have emphasizedthe continental-scale anomalies of convective cloudi-ness and the upper-level circulation during the week-long rainy and dry episodes over the Altiplano. Duringthese episodes, a coherent band of outgoing longwaveradiation (OLR) anomalies extends southeastward fromthe Altiplano, whereas anomalies of the opposite signprevail over the east coast of the continent (Aceitunoand Montecinos 1997a; Lenters and Cook 1999). A re-inforcement and southward displacement of the clima-tological Bolivian high is also observed during rainyepisodes (Aceituno and Montecinos 1993; Lenters andCook 1999). In addition to these prevalent features, Len-ters and Cook (1999) and Vuille et al. (1998) have doc-umented distinctive types of circulation anomalies tothe east of the Andes associated with rainy periods overthe central Andes. The precipitation over the Altiplano

MAY 1999 903G A R R E A U D
FIG. 3. Austral summer (DJF) mean profiles of mixing ratio at208S, 728W (eastern Pacific, EP), and 208S, 608W (Amazon Basin,AM). The horizontal lines indicate 61 std dev of the respective profileat the corresponding level. Data are from the NCEP–NCAR reanal-ysis. The gray bar indicates range of variability of mixing ratio ob-served over Visviri and the small dot is its seasonal mean (data fromVisviri I and II).
also exhibits substantial year-to-year variability, with atendency to dry conditions during the warm phase ofthe El Nino–Southern Oscillation phenomenon (Thomp-son et al. 1984; Aceituno and Garreaud 1995). On theother side of the spectrum, our knowledge of local con-ditions is based mainly on two field experiments carriedout on the Chilean side of the Altiplano during Januaryof 1994 and 1995 (Aceituno et al. 1995; Aceituno andMontecinos 1997b). During both rainy and dry periods,the moisture transport is strongest during afternoon andevening and peaks near the 500-hPa level. Relativelyhigh levels of moisture throughout the tropospheric col-umn and a weaker-than-normal local low-level south-westerly flow capped by easterly winds in the middletroposphere tend to prevail during the rainy episodes(Aceituno and Montecinos 1997b).
The studies cited above have revealed many large-scale features and local conditions associated with thevariability of the summertime rainfall over the centralAndes. Yet there is a significant gap in our knowledge,especially with regard to the regional processes linkinglarge-scale anomalies with local conditions, the latterbeing ultimately responsible for the occurrence of con-vectively active or inactive episodes. In the presentstudy we aim to improve our understanding of the actualmechanisms responsible for the occurrence of rainy anddry episodes over the Altiplano, with emphasis on theinteraction between continental-, regional-, and local-scale phenomena. First, we investigate the large-scale
patterns and local conditions during the rainy and dryepisodes using gridded fields of the relevant meteoro-logical variables, satellite observations of convectivecloudiness, and surface data. Second, we analyze theregional processes using a mesoscale numerical modelto simulate a pair of dry and rainy episodes with thehope that the model output would provide a physicallyconsistent, high-resolution dataset. Here regional scaleconnotes meso-a scale—that is, horizontal distancesrange from 200 to 2000 km (Orlanski 1975). The paperis structured as follows. A description of the datasets isgiven in section 2. Section 3 discusses the climatologicalbackground, with emphasis on the annual and diurnalcycles over the central Andes. Analyses of the local andlarge-scale conditions during rainy and dry episodes arepresented in section 4. Section 5 describes the mesoscalenumerical model and simulation strategy, followed bythe relevant model results. Finally, in the conclusionswe merge our local and large-scale observations withthe regional model results to form a conceptual modelof the functioning of rainy and dry episodes over thecentral Andes.
2. Datasets
Four datasets have been used in the observational partof this study. The National Centers for EnvironmentalPrediction–National Center for Atmospheric Research(NCEP–NCAR) reanalyzed meteorological fields de-scribed in detail in Kalnay et al. (1996) are used tocharacterize the large-scale tropospheric circulation andthermodynamic structure.1 The original fields have 6-hresolution on a 2.58 latitude–longitude grid and includeall mandatory levels from 1000 to 100 hPa (300 hPafor humidity). The 1200 and 2400 UTC data (0800 and2000 LST at 608W) were merged to produce daily fieldsduring the austral summer months (DJF) from 1979 to1995. The second dataset consists of daytime and night-time fields of outgoing longwave radiation with a 2.58latitude 3 2.58 longitude resolution, measured by polar-orbiting satellites and produced by National Oceanic andAtmospheric Administration (NOAA)–NCEP (Gruberand Krueger 1984). For the same period of record weaveraged the twice-daily OLR observations and defineda convective index (CI) as 230 OLR if OLR , 230 Wm22 or 0 otherwise. The threshold 230 W m22, which
1 An important caveat in the use of the NCEP–NCAR reanalysisover the Southern Hemisphere is the use of incorrectly assimilated(shifted by 1808 longitude) Australian surface pressure bogus data(PAOBs) between 1979 and 1992. The impact of the PAOBs’ mis-location in the present analyses should be small since the area ofinterest is mainly over subtropical and tropical South America, wherein situ data strongly damp any error propagating from the southernPacific Ocean. Any remaining errors should be random relative tothe timing of the wet and dry episodes over the Altiplano and thereforeit is difficult to see how they could be responsible for the dynamicallycoherent structures revealed by the analysis in section 4.

904 VOLUME 127M O N T H L Y W E A T H E R R E V I E W
corresponds to a cloud-top temperature of about 250 K,is low enough to filter out variations in ground tem-perature and low-level cloudiness.
For a more detailed analysis of the convective cloud-iness over the central Andes, we have used 11 years(1983–93) of reduced resolution radiance images [theB3 International Satellite Cloud Climatology Project(ISCCP) product] from geostationary satellites GOES-5,-6, and -7. The B3 dataset is a compressed version ofthe original GOES images to a nominal resolution of30 km every 3 h (eight images per day beginning at0000 UTC). Further details of this dataset are given inRossow and Schiffer (1991). In this study we convertedthe 3-hourly pixel maps of infrared radiance (11.6 mm)to a regular 0.58 latitude 3 0.58 longitude grid of bright-ness temperature (Tb), following the procedure de-scribed in Garreaud and Wallace (1997).
In situ meteorological observations over the Altiplanowere obtained from two field experiments conducted inthe small town of Visviri [17.58S, 69.58W, 4070 m abovemean sea level (MSL), see Fig. 2] and described inAceituno et al. (1995) and Aceituno and Montecinos(1997b). The field experiments Visviri I and II werecarried out during 19–29 January 1994 and 11–22 Jan-uary 1995. They included four daily rawinsoundings(20-hPa vertical resolution) and near-surface hourly ob-servations of solar radiation, air temperature, humidity,wind, and precipitation (Aceituno and Montecinos1997b). In addition to the field experiments, near-sur-face meteorological data were continuously collected byan automatic weather station maintained at Visviri fromOctober 1993 to November 1995 (Aceituno and Mon-tecinos 1997b). Comparison between daily mean mixingratio at Visviri and its corresponding daily reanalysisvalue at 17.58S, 708W, interpolated at 620 hPa, revealsa reasonable correlation between local and reanalysisdata (r 5 0.55) and similar ranges of day-to-day vari-ability (2–8 g kg21) of both measurements during thetwo austral summers with available local data.
3. Background: Annual and diurnal cycles
Precipitation over the Altiplano exhibits a pro-nounced annual cycle, with more than 70% of the rainconcentrated in the austral summer (Aceituno and Mon-tecinos 1993), associated with the development of con-vective cloudiness over the central Andes and the south-western part of the Amazon Basin (Horel et al. 1989,see also Fig. 1). Area-average rainfall is about 220 mmper year (Legates and Willmont 1990), although thereis a significant gradient, with higher rainfall in the north-eastern part of the Altiplano, characterized by the pres-ence of the basin of Lake Titicaca, and substantiallydrier conditions in the southwestern part of the plateau,manifest in the existence of extensive dry lakes (Ac-eituno 1997).
The specific humidity and zonal wind over the Al-tiplano also exhibit a marked annual march, with the
highest humidity in January in association with weakeasterly flow in the middle and upper troposphere andthe minimum OLR. In contrast, the annual marches ofsolar radiation and surface maximum air temperature(not shown) are relatively small, both experiencing aweak maximum in November, just before the onset ofthe rainy season (Aceituno 1997). The large-scale meansummertime flow at upper levels exhibits a broad an-ticyclone centered just to the east of the central Andes(the so-called Bolivian High, Fig. 1a) first identified byGutman and Schwerdtfeger (1965) and Virji (1981) andlinked to the strong diabatic heating over the Amazoniain subsequent modeling studies (e.g., Figueroa et al.1995; Lenters and Cook 1997). At lower levels (Fig.1b), the barrier effect of the Andes is clear, separatingthe northwesterly flow over the western half of the Am-azon Basin and the subtropical plains of the continentfrom the southeasterly flow over the eastern Pacific.
Consistent with its latitude and elevation, near-surfaceconditions over the Altiplano are strongly coupled toinsolation and exhibit a pronounced diurnal cycle. Dur-ing summer, maximum surface air temperature of about128C typically occurs shortly after midday, whereas be-low freezing temperatures prevail between midnight anddawn. Strong fluxes of sensible heat during morningand afternoon [Qh ; 600 W m22 at midday (H. Fuen-zalida 1997, personal communication)] build up a deep,well-mixed boundary layer that reaches a maximum ver-tical extent of about 1800 m around 1600 LST, whereaslongwave cooling and weak winds favor the formationof very stable nocturnal stratification. Coupled to thedaytime destabilization of the (local) lower troposphere,convective cloudiness over the central Andes reaches alate afternoon maximum, characterized by deep elon-gated cells (Tb , 205 K) embedded in a more extensiveshield of moderately cold cloudiness. The late afternoonmaximum of convective cloudiness (defined by Tb ,235 K) is preceded by a rapid buildup phase between1200 and 1600 LST, a more gentle decay during night-time, and an early morning minimum (Garreaud andWallace 1997). The rainfall over the Altiplano exhibitsa similar diurnal cycle, with most of the precipitationproduced by thundershowers between 1700 and 2200LST (Aceituno 1998).
4. Rainy and dry episodes over the Altiplano
Within its rainy season, the Altiplano experiencesrainy and dry episodes with durations ranging between5 and 10 days (Fuenzalida and Rutllant 1987; Aceitunoand Montecinos 1993). Indirect evidence of this epi-sodic character is given in Fig. 4, which shows the frac-tion of Altiplano area covered by convective cloudiness(ACC) during the evening (1800 LST) for two summers.In this estimation the Altiplano is defined as the regionwith terrain elevation in excess of 3400 m MSL between168 and 228S. In spite of the day-to-day variability, thereis evidence of alternating, week-long periods of high

MAY 1999 905G A R R E A U D
FIG. 4. (a) Daily time series of zonal wind anomalies (upper panel,negative values indicated by dashed lines) and specific humidity at600 hPa (middle panel) over the central Andes (158–218S, 718–668W),and fraction of the Altiplanic area cover by convective cloudiness(Tb , 235 K) (lower panel) from 1 December 1983 to 28 February1984. (b) As in (a) but for the austral summer of 1991–92. Zonalwind and specific humidity from NCEP–NCAR reanalysis. Convec-tive cloudiness calculated from the B3 ISCCP dataset (0.58 lat 3 0.58long resolution).
and low convective cloudiness coverage, indicative ofrelatively wet and dry conditions, respectively. For ex-ample, the summer of 1983–84 was characterized bythree ‘‘rainy’’ periods (ACC . 30%) from the end ofDecember to mid-January, early and late February, sep-arated by extended periods when ACC was consistentlyless than 10%. In the summer of 1991–92 the outstand-ing rainy periods encompass late December, most ofJanuary, and late February. Figure 4 also includes re-analyzed daily values of the mixing ratio at 600 hPaand zonal wind anomalies averaged over the Altiplanoregion. These diagrams suggest the simultaneous oc-currence of rainy periods, high water vapor content, andeasterly wind anomalies in the middle and upper tro-
posphere, and vice versa, in concurrence with previousfindings of Fuenzalida and Rutllant (1987) and Aceitunoand Montecinos (1993).
a. Large-scale patterns
Summertime episodes of active and suppressed con-vection over the Altiplano were objectively selected be-tween 1979 and 1995, on the basis of the average CIover a 2.58 3 2.58 box centered at 188S, 698W. Usinga smoother2 version (CI*) rainy (dry) episodes weredefined as continuous sequences of at least four days inwhich CI* was equal to or larger (less) than the seasonalmean plus (minus) 0.6 standard deviations. The factor0.6 is arbitrary and was chosen so as to select at leasttwo rainy periods per summer. With this criterion, 36rainy and 43 dry episodes were selected out of the 15austral summers, with average durations of 6.8 and 10.3days, respectively. Although in each summer only halfof the days are classified as belonging to one of twocategories, rainy and dry episodes are still of practicalrelevance owing to the long-lasting anomalies that theyrepresent. Based on this pool of episodes we made acompositing analysis of CI, several meteorologicalfields, and brightness temperature with the aim of char-acterizing the large-scale conditions during the rainy anddry episodes over the Altiplano. Composite anomalieswere calculated as the difference between the compositemaps and their respective seasonal mean.
Figures 5a and 6a show the CI anomalies during rainyand dry composites. Consistent with the definition ofthe composite, the largest anomalies are centered alongthe central Andes, between 158 and 258S, and encompassthe westernmost part of Amazonia. In both composites,significant anomalies of opposite sign to the Andeanones are found over southeast Brazil, forming a dipolar,continental-scale pattern of convective anomalies in thesouthern half of the area of intense convection over thecontinent (Fig. 1a). The tendency for out-of-phaseanomalies of convective cloudiness and precipitationbetween the east coast–South Atlantic convergence zonedomain and the subtropical plains–central Andes onweekly or longer timescales has also been reported byNogues-Paegle and Mo (1997), Aceituno and Monte-cinos (1997a), and Lenters and Cook (1999). Differ-ences in convective cloudiness over the Altiplano duringrainy and dry episodes are further illustrated in Fig. 7by means of the diurnal march of the fractional areacovered by convective cloudiness derived from the B3ISCCP data (in this case the composites are calculatedusing previously selected episodes between 1983 and1993). About 50% of the Altiplano is covered by coldclouds (Tb , 235 K) during the afternoons of rainy
2 For each grid point, CI* at day j is calculated as CI*( j) 5[CI(j 2 1) 1 2 CI(j) 1 CI(j 1 1)]/4.

906 VOLUME 127M O N T H L Y W E A T H E R R E V I E W
FIG. 5. (a) Convective index anomalies for the wet composite (W m22). The 2000- and 4000-m topographiccontours are indicated by solid lines. (b) 200-hPa wind anomaly (m s21 and 300-hPa specific humidityanomalies (g kg21) for the wet composite. Anomalies are calculated as the composite mean minus theclimatological mean. Only wind anomalies locally statistically significant at the 95% confidence level areshown. The 2000-m topographic contour is indicated by a solid line. (c) As in (b) but at 600 hPa. Mixingratio anomalies in excess of 60.6 g kg21 are statistically significant at 95% confidence level. (d) As in (b)but at 925 hPa. Mixing ratio anomalies in excess of 60.9 g kg21 are statistically significant at the 95%confidence level. The shaded/black area indicates terrain elevations in excess of 2000 m. Analysis basedon data from 1979 to 1995. Confidence levels based on a two-sided Student’s t-test, assuming a decorrelationtime of five days for estimating number of degrees of freedom.
episodes, while convective cloudiness is almost non-existent during dry episodes. Rainy episodes also arecharacterized by a significant amount of cold cloudsover the Altiplano during the first half of the nighttimeperiod. Figures 5 and 6 also show the horizontal windand specific humidity anomalies at 200, 600, and 900hPa. In the rainy composite, a broad anticyclonicanomaly at upper levels (200 hPa, Fig. 5b) is centeredat 258S, 608W, strengthening and shifting southwardthe climatological Bolivian high and reinforcing thewesterly flow south of 358S (Fig. 1a). The geopotentialanomalies exhibit an equivalent barotropic structure (awarm core anticyclone), and therefore easterly windanomalies (weak easterly flow) prevail at and abovethe crest of the central Andes (600 hPa, Fig. 5c). Thestronger-than-normal upper-level easterly flow is acommon ingredient in the different patterns associatedwith summertime precipitation over the Altiplano re-ported by Lenters and Cook (1999) and Vuille et al.(1998). In the upper and middle troposphere the spe-
cific humidity exhibits small positive departures overthe central Andes and the eastern Pacific, which isconsistent with the easterly zonal flow anomalies. Atlower levels, the anticyclonic anomalies are distortedby the Andes, but the anomalous easterly flow overmuch of the central part of the continent is still evident.Roughly the opposite situation prevails in the dry com-posite (Fig. 6), with continental-scale circulationanomalies dominated by a cold core cyclone centeredat 258S, 608W, and the central Andes exposed to west-erly wind anomalies (weak westerly flow) (Figs. 6b,c).Weak westerly wind anomalies are observed over thelowlands near the eastern slope of the Andes in thiscase (Fig. 6d). Also note that for both composites, mix-ing ratio anomalies (reanalysis data) in the lower tro-posphere (925 hPa) to the east of the central Andesare too small (60.5 g kg21) to account for the moisturevariability over the Altiplano (61.5 g kg21) (Figs. 5c,dand 6c,d).
The large-scale upper- and midlevel circulation pat-

MAY 1999 907G A R R E A U D
FIG. 6. As in Fig. 5 but for the dry composite.
FIG. 7. Diurnal cycle of the fraction (percent) of the central Andes area (158–218S, 718–668W) covered by convective cloudiness (Tb , 235 K) for the wet composite (solid line) anddry composite (dashed line). The diurnal cycle is repeated twice. Gray bars at the top indicatenighttime. Data are from B3 ISCCP (1983–93).
terns that emerge from the compositing analysis are sta-tistically robust, consistent with previous findings re-ferred to in the introduction, and also captured by asingular value decomposition analysis between 300 hPawinds and CI (not shown). Their equivalent barotropicstructure and position to the east of the central Andessuggest that large-scale circulation anomalies are notdirectly forced by the anomalous heat source, but ratherthat they lead to the convective anomalies over the Al-
tiplano. A likely source of these subtropical height de-partures on weekly timescales is Rossby wave disper-sion from the Southern Hemisphere extratropics in theupper-level westerly ducts that extend into the Tropics(e.g., Kiladis and Weickmann 1997). In support of thishypothesis, Fig. 8 shows the correlation coefficient be-tween the 200-hPa geopotential height at 278S, 608W(i.e., the center point of the anomalies in the composite)and geopotential height at every grid point at 200, 500,

908 VOLUME 127M O N T H L Y W E A T H E R R E V I E W
FIG. 8. Correlation coefficient between low-pass filtered 200-hPa geopotential height over a grid box centeredat 258S, 57.58W (indicated by an open square over subtropical South America) and (a) low-pass filtered 200-hPa geopotential height at every grid point, (b) low-pass filtered 500-hPa geopotential height at every gridpoint, and (c) low-pass filtered 850-hPa geopotential height at every grid point. Contour interval is 0.1, negativevalues are indicated by dashed lines, and the zero contour is omitted. Light shading indicates the 95% significancelevel (based on a two-sided Student’s t test, assuming a decorrelation time of 5 days for estimating number ofdegrees of freedom).
and 850 hPa. The time series were low-pass filtered toretain fluctuations with periods longer than five days only.Connected with the local equivalent barotropic anomaliesthere is a signature of a wave train with a wavelength of708 longitude that extends from the South Pacific, am-plifies downstream over subtropical South America, andagrees with a similar analysis reported by Jones (1990).Although this pattern may be forced by random, longi-tude-independent planetary waves, its similarity to theleading modes of the Southern Hemisphere circulationanomalies (e.g., Mo and Higgins 1997), referred to asthe Pacific South American mode and linked to intra-seasonal fluctuations in convection over the western Pa-cific–Indian Ocean region, is noteworthy.
b. Local conditions
Insights into the local thermodynamic conditions dur-ing rainy and dry episodes are obtained from the upper-air observations during Visviri I and II. Our previousselection of episodes based on CI* (section 4a) wascomplemented with local weather observations and rain-fall records to define rainy (active convection) and dry(suppressed convection) days over the western Altipla-no. For the two experiments, Fig. 9 shows time-pressuresections of the difference (due) between near-surfaceequivalent potential temperature, ue(600 hPa), and theambient saturated equivalent potential temperature,
(p). At any given time, due . 0 at level p* indicatesu*e

MAY 1999 909G A R R E A U D
FIG. 9. Time–pressure sections of the difference between the equivalent potential temperature at600 hPa and the saturated equivalent potential temperature throughout the tropospheric column( 2 ue|600 hPa). Contours begin at 12 K, the contour interval is 2 K, and values in excess of 6 Ku*eare shaded. The diagrams were constructed using the four times daily soundings taken during (a)Visviri I and (b) Visviri II. Days with active convection are indicated by a black bar at the bottom.
that an air parcel lifted from the surface to p* has be-come saturated and positively buoyant (Holton 1992);the lower and upper limits of the region with due . 0are the level of free convection (LFC) and level of neu-tral buoyancy (LNB), respectively; and the integral ofdue between LFC and LNB (if such a layer exists) isproportional to the convective available potential energy(CAPE). Active convection over Visviri (highlighted inFig. 9) occurred almost exclusively on those days withnonzero CAPE afternoon soundings: the first half ofVisviri I and the final days of Visviri II. Also evidentis the diurnal cycle of the local troposphere thermo-dynamic destabilization, with conditionally unstableconditions (due . 0) mainly confined between afternoonand early night.
Composite afternoon (1500 LST) soundings for rainy(active convection) and dry (inactive convection) daysduring Visviri I and II are shown in Fig. 10. Both sound-ings exhibit a conditionally unstable layer ( /]z , 0)]u*efrom the surface to 400 hPa. However, the release ofconditional instability (near-surface ue equal to atu*esome level) may happen only in the active case whenLFC ; 550 hPa, LNB ; 200 hPa, and CAPE ; 500
J kg21. The key factor in producing a nonzero CAPEis the higher ue near the surface during the active days,although the observed midtropospheric cooling alsocontributes to increase the available potential energy.Consistent with a slightly cooler troposphere and re-duced surface insolation under active convection con-ditions, the air temperature within the mixed layer is 2–3 K lower during active days. Therefore, the higher ue
near the surface is entirely produced by a higher (;4g kg21) mixing ratio near the surface (qLL) during activedays. Furthermore, the mean values of qLL (using theobservations taken at Visviri) for dry and rainy episodes(selected on the basis of CI*) during the summers 1993–94 and 1994–95 are 3.5 6 0.7 and 6.8 6 0.9 g kg21,respectively. These values indicate a marked differencein the near-surface moisture content at Visviri betweenrainy and dry episodes over the Altiplano.
5. Regional processes
a. Model description and simulation strategy
In this section we describe results obtained using ThePennsylvania State University–NCAR Mesoscale Mod-

910 VOLUME 127M O N T H L Y W E A T H E R R E V I E W
FIG. 10. Mean soundings at 1500 LST for (a) active convectionand (b) inactive convection over Visviri. Mean profiles of u, ue, and
calculated from rainy and dry composite profiles of air temperatureu*eand RH during Visviri I and II.
TABLE 1. Physical parameterization used in MM5 for the regionalnumerical simulations.
Processes Scheme References
Cumulus convection
Boundary layer
MoistureRadiation
Ground temperature
Kain–Fritsch
High-resolutionBlackadar
Simple iceCloud–radiation
Force–restore
Kain and Fritsch(1993)
Blackadar (1976)
Dudhia (1989)Benjamin and Carl-
son (1986)Blackadar (1976)
el Version 5.2 (MM5) to simulate and diagnose the re-gional processes linking the large-scale and local con-ditions documented in the previous section. The MM5is a fully compressible, nonhydrostatic version of a me-soscale numerical model developed by Anthes andWarner (1978). A thorough description of MM5 can befound in Dudhia (1993) and Grell et al. (1994). TheMM5 solves the prognostic equations for 3D wind, pres-sure, temperature, specific humidity, and microphysicalvariables, using a terrain-following vertical coordinate(s) and perturbations from a constant reference state ofthe basic variables (p9, T9, and r9). Some of the param-eterizations used in this set of simulations are listed inTable 1. Of particular relevance is the inclusion of cloudwater, rainwater, and cloud ice in the explicit moisturescheme (Hsie et al. 1984; Dudhia 1989) and the use ofthe Kain and Fritsch cumulus parameterization scheme(Kain and Fritsch 1993). In the latter scheme, convec-tion is determined by CAPE at the grid point, and onceconvection is triggered, CAPE is removed in a gridcolumn within an advective time period (Kain andFritsch 1993). We chose this scheme based on our pre-vious findings of the CAPE–convection relationship
over the Altiplano (see Fig. 9) and its good performancein a variety of precipitation scenarios documented inWang and Seaman (1997).
The model domain consists of a coarse mesh (Dx 5Dy 5 72 km) that covers most of tropical and subtropicalSouth America, and a nested (one-way interaction), finemesh (Dx 5 Dy 5 24 km) centered over the centralAndes. (The coarse domain is indicated in Fig. 1. Theinner domain is shown in Fig. 2.) All the followingresults, except those relating to the upper-level circu-lation, are based on the inner domain. Thirty-seven full-sigma levels were used, with the highest resolution inthe boundary layer [the lowest half-sigma level (s 50.995) corresponding roughly to 30 m above ground].Initial and lateral boundary conditions for the modelwere obtained by interpolating global National Mete-orological Center (now known as NCEP) surface andupper-level analysis every 12 h and enhanced by syn-optic observations assimilated using the Cressmanscheme. Given the current computational limitations, wedecided to integrate the model for 60 h during a pair ofrainy and dry episodes selected on the basis of the indexof convection (CI*), where highly contrasting signaturesof convective cloudiness over the Altiplano are readilyevident in the B3 ISCCP infrared images3 shown in Fig.11. The rainy simulation begins at 2100 LST 15 January1993, and the dry simulation begins at 2100 LST 5February 1993. In both cases, the first 9 h or so aretaken as the model’s spinup period, yielding simulationsof two full diurnal cycles. Within each simulation, thediurnal marches of the atmospheric conditions are sim-ilar, and we merged some of the model outputs at thesame time of day 1 and 2 into rainy or dry event means.For instance, fields at 1100 LST of the rainy event arethe simple average of the 1100 LST output of day 1 (16January) and day 2 (17 January) of the rainy simulation.
3 Despite local observations in Visviri during parts of January of1994 and 1995, we chose to simulate two episodes during the summerof 1993 given the availability of ISCCP B3 images and the morecomplete set of synoptic observations during the summer of 1993used in the model initialization.

MAY 1999 911G A R R E A U D
FIG. 11. GOES-7 infrared temperature at 1800 LST for (a) 16 Jan 1993, (b) 17 Jan 1993, (c)6 Feb 1993, and (d) 7 Feb 1993. The 2000- and 4000-m topographic contours are indicated bysolid lines.
b. Model results
Figure 12 shows the model winds at 200 hPa, 36 hafter initialization, for both rainy and dry simulations,together with the corresponding NCEP–NCAR reanal-yses. The evolution of the upper-level conditions duringthe 60-h simulation is rather slow, and hence the patternsin Fig. 12 are representative of the whole period. Com-parison between model output and observations (re-analyses) reveals that the model realistically simulatesthe large-scale upper-level flow in both cases. Consistentwith our previous discussion, the upper-level flow dur-ing the rainy event is characterized by a well-definedanticyclone centered at 258S, 658W. At 500 hPa (notshown) the anticyclone is still evident, although its cen-ter has shifted westward over the subtropical Andes,and easterly flow of about 5 m s21 crosses the centralAndes between 148 and 218S. In contrast, during thedry period the subtropical circulation is dominated bya midlatitude trough, whose axis coincides with the An-
dean ridge south of 208S, and a strong subtropical jetcrossing the central Andes, with westerly winds in ex-cess of 10 m s21 at the 500-hPa level.
A qualitative, yet particularly relevant, measure ofthe overall model performance is given in Fig. 13,which shows the simulated cloud-top temperature at1800 LST for rainy and dry simulations. Comparisonwith brightness temperature images from GOES-7 (Fig.11) reveals good agreement between the observed andsimulated cold cloud coverage, with most of the centralAndes covered with convective cloudiness during theafternoons of the rainy period and cloud free duringthe dry period. The model tends to predict too manycold clouds around sunrise, but the simulated contrastbetween rainy and dry conditions is similar to the ob-served (not shown). Besides the general correspon-dence, the model seems to realistically simulate thelocation, shape, and intensity of cloud clusters over thesouthern Altiplano, the eastern slope of the Andes, and

912 VOLUME 127M O N T H L Y W E A T H E R R E V I E W
FIG. 12. (a) Model (outer domain) 200-hPa winds at 1200 UTC 17 Jan 1993 (36 h after initializationof the rainy simulation) interpolated to 2.58 lat 3 2.58 long grid. (b) NCEP–NCAR reanalysis 200-hPa winds at 1200 UTC 17 Jan 1993. (c) As in (a) but for 1200 UTC 7 Feb 1993 (36 h after initializationof the dry simulation). (d) As in (b) but for 1200 UTC 7 Feb 1993.
the eastern lowlands. In the rainy case, roughly 70%of the model daytime (0600–2100 LST) rainfall is con-vective (nonexplicit) with a spatial average of about 7mm per 12 h (local maxima in excess of 12 mm per12 h) over the Altiplano.
The topography and horizontal wind field at the low-est half-sigma level (hereafter referred to as surfacewinds) for the afternoon (1500–1700 LST) of the rainyand dry simulations are displayed in Fig. 14. In the drycase, a northwesterly low-level jet is found over thelowlands to the east of the central Andes between 108and 208S, with surface winds in excess of 10 m s21.The jet, forced by a deepened thermal low over north-western Argentina (;258S), tends to decelerate the day-time upslope flow over the lower part of the eastern sideof the Andes due to the Coriolis force. In the rainycomposite, the surface flow east of the Andes is muchweaker and distorted, and the model consistently sim-
ulates a stronger terrain-normal daytime flow over theeastern foothills, particularly around 168S. Over mostof the Altiplano, surface winds are in the same directionas the flow aloft (easterly in the rainy case, westerly inthe dry case), producing an elongated region of stronglow-level convergence with the upslope flow from theopposite direction. The simulated patterns of the low-level wind are evident to some degree in the sparsesurface observations over and around the central Andesincluded in Fig. 14.
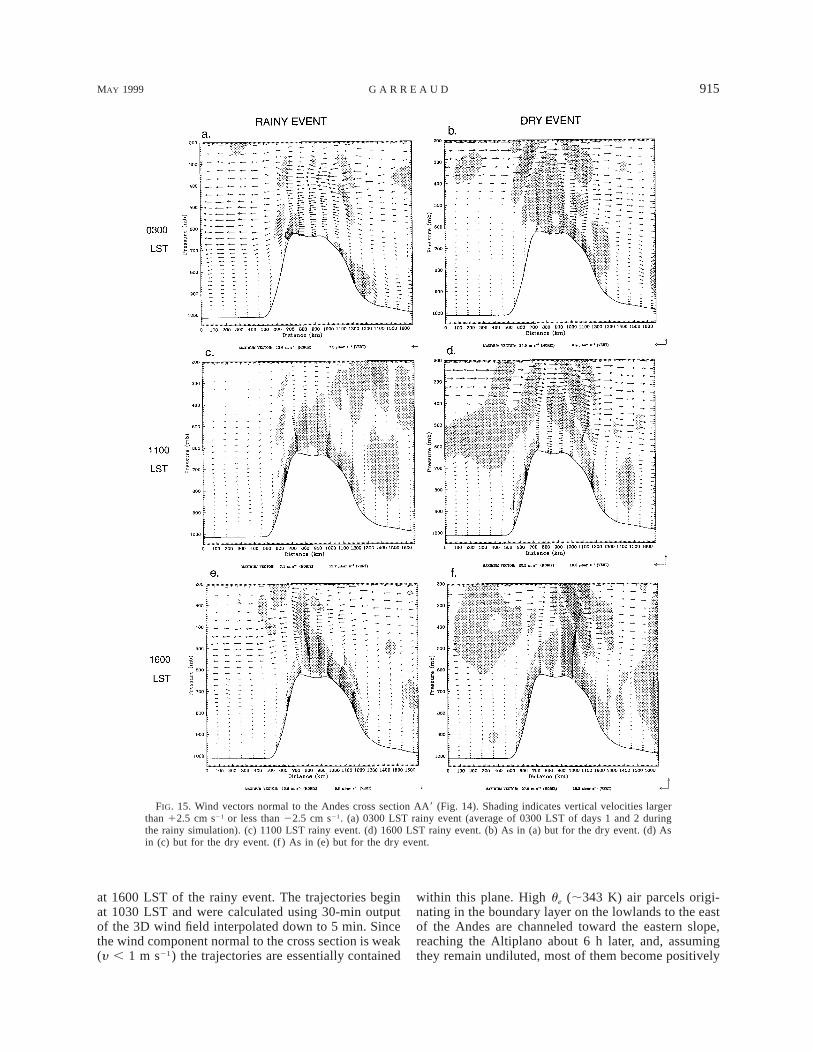
Further details of the diurnally varying regional floware displayed in section AA9 extending across the centralAndes (Fig. 15), which shows the wind normal to thebarrier at 0300, 1100, and 1600 LST for the rainy anddry events, and from the traces of wind speed at pointsH (3500 m, near the Altiplano) and L (700 m, near thefoothill) over the eastern slope of the Andes (Fig. 16).The results in Fig. 15 are fairly representative of other

MAY 1999 913G A R R E A U D
FIG. 13. Simulated cloud-top temperature (CTT) at 1800 LST for rainy and dry simulations. Light anddark shading indicate CTT below 220 and 205 K, respectively. (a) 16 Jan 1993 (21 h after initializationof the rainy simulation). (b) 17 Jan 1993 (45 h after initialization of the rainy simulation). (c) 6 Feb 1993(21 h after initialization of the dry simulation). (d) 7 Feb 1993 (45 h after initialization of the drysimulation). In all panels, the 2000-m topographic contour is indicated by a solid line.
sections taken across the central Andes (not shown).The nocturnal regime, characterized by downslope flowand statically stable stratification, begins around sunsetin both simulations. In the dry simulation, the down-slope flow over the eastern slope runs well into latemorning, reaching a maximum speed in excess of 5 ms21 around 0300 LST (Fig. 15b). In the rainy case, thewesterly downslope flow is weaker and shallower (Fig.15a), particularly along the upper half of the slope whereit is capped by easterly winds aloft, and it ends withinan hour of the sunrise (Fig. 16a). As the surface warms
up throughout the day, a convective boundary layer(CBL) develops over the sloping terrain and the Alti-plano (Fig. 17) and daytime upslope flow sets in. Overthe steeper western side, the upslope flow is shallowand strong (h ; 600 m, u ; 8 m s21) in both the rainyand dry simulations. Near the eastern foothills (pointL), the daytime flow in the rainy simulation is just slight-ly stronger than its dry counterpart, with maximumspeeds of about 4 m s21 during the midafternoon (Fig.16). However, the strength and extent of the upslopeflow over the middle and upper part of the eastern side

914 VOLUME 127M O N T H L Y W E A T H E R R E V I E W
FIG. 14. (a) Surface winds (s 5 0.995, ;30 m AGL) during afternoon of the rainy event. The event mean was calculated as the averageof the half-hourly model output between 1500 and 1700 LST of days 1 and 2 of the rainy simulation. Full barb: 10 kt. Shading representsterrain elevation. Cross section AA9 referred to in subsequent figures. Thick barb vectors are synoptic surface observations. (b) As in (a)but for the afternoon of the dry event.
of the Andes is significantly larger in the rainy case.During the two rainy afternoons, upslope flow appearsover point H before 1200 and accelerates until 1700LST to attain speeds in excess of 6 m s21 (Fig. 16a),nearly twice the maximum upslope flow speed duringthe dry afternoons (Fig. 16b).
Examination of the hourly output during the rainysimulation reveals that the strong easterly upslope flowwithin the CBL (h ; 1600 m, u ; 6 m s21) reachesthe Altiplano by 1200 LST (Fig. 15c), followed by awestward incursion of potentially colder air. Intenselow-level convergence between this flow and surfacewesterly winds, originating in the western side of theAndes, is found over the central part of the plateauduring afternoon and early evening (Fig. 15e, see alsoFig. 14a) and the resulting region of upward motionextends from the surface to 230 hPa. In contrast, theweaker easterly upslope flow (capped by westerly windsaloft) never reaches the Altiplano in the dry event, andits convergence with the lower branch of a mountain-wave circulation takes place over the eastern slope ofthe Andes (Fig. 15f, see also Fig. 14b) in the so-calledleeside convergence zone (Banta 1986). In this lattercase, the mesoscale upward motion grows up to only450 hPa, limited by upper-level subsidence within themountain wave aloft.
Consistent with the differences in the strength andextent of the upslope flow over the eastern side of theAndes, the water vapor distribution exhibits a markedcontrast between the rainy and dry simulations (Fig. 18).Notice that over the foothills and lowlands to the eastof the central Andes, the mixing ratio in the lower andmiddle troposphere is slightly higher (;1.0 g kg21) dur-ing the dry event. Early in the morning, the mixing ratio
profile along the eastern slope is fairly similar in thetwo events, decreasing upward to values less than 4 gkg21 over the Altiplano (Figs. 18a,b). During the latemorning and early afternoon of the rainy simulation, thesurface easterly flow transports significant amounts ofwater vapor within the CBL, increasing the mixing ratioover the Altiplano up to 8 g kg21, and a tall plume ofcloud and rainwater develops over the plateau (Fig. 18e)collocated with the mesoscale region of upward motion.In contrast, in the dry event the moisture transport fromthe lowlands to the east of the Andes is restricted to theupper half of the eastern slope, and the maximum af-ternoon low-level mixing ratio over the Altiplano doesnot exceed 5 g kg21 (Fig. 18f). The effect of the middle-level flow is also evident in Fig. 18: easterly windsadvect water vapor within the CBL, producing a plumeof moist air to the west of the Andes in the rainy sim-ulation, whereas entrainment of dry air from the westtends to dry out the otherwise moist CBL over the upperhalf of the eastern slope of the Andes.
Over the very dry western slope of the Andes, themodel simulates values of a water vapor mixing ratioof similar magnitude to the values simulated over themuch humid eastern slope, which is suggestive of anexcessive upslope moisture transport from the coastalareas of northern Chile and southern Peru. This problemmight arise from the absence of a coastal escarpmentin the model topography, which in reality laterally con-fines the moist air within the marine boundary layerover the eastern Pacific. Nevertheless, only air parcelsoriginating in the eastern foothills can become positivelybuoyant. A closer examination of this point is based onFig. 19a, which shows the equivalent potential temper-ature and air parcel trajectories along the AA9 transect
MAY 1999 915G A R R E A U D
FIG. 15. Wind vectors normal to the Andes cross section AA9 (Fig. 14). Shading indicates vertical velocities largerthan 12.5 cm s21 or less than 22.5 cm s21. (a) 0300 LST rainy event (average of 0300 LST of days 1 and 2 duringthe rainy simulation). (c) 1100 LST rainy event. (d) 1600 LST rainy event. (b) As in (a) but for the dry event. (d) Asin (c) but for the dry event. (f ) As in (e) but for the dry event.
at 1600 LST of the rainy event. The trajectories beginat 1030 LST and were calculated using 30-min outputof the 3D wind field interpolated down to 5 min. Sincethe wind component normal to the cross section is weak(y , 1 m s21) the trajectories are essentially contained
within this plane. High ue (;343 K) air parcels origi-nating in the boundary layer on the lowlands to the eastof the Andes are channeled toward the eastern slope,reaching the Altiplano about 6 h later, and, assumingthey remain undiluted, most of them become positively

916 VOLUME 127M O N T H L Y W E A T H E R R E V I E W
FIG. 16. (a) Wind speed along the eastern slope of the Andes atpoints L (near the foothill, dashed line) and H (near the Altiplano,solid line), indicated in Figs. 14 and 15, for days 1 and 2 of the rainysimulation. Gray bars at the top indicate nighttime. (b) As in (a) butfor days 1 and 2 of the dry simulation. The 30-min output was filteredusing a 7-point running mean filter in time.
FIG. 17. Potential temperature (contour every 2.5 K) across sectionAA9 (Fig. 17). (a) 1600 LST rainy event (average of 0300 LST ofdays 1 and 2 of the rainy simulation). (b) 1600 LST dry event. Thickline indicates the top of the CBL.
buoyant [ue(parcel) . (environment)] within the me-u*esoscale region of upward motion over the plateau. Incontrast, the highest ue over the western foothills (;333K) is well below that of the minimum midtropospheric
; 340 K, and therefore, even though the simulatedu*edaytime flow over the western slope of the Andes mayincrease the water vapor content over the Altiplano, itdoes not contribute to the buildup of potential instabilityrequired for the subsequent development of cumulusconvection. In the dry case, the air over the Altiplanohas low ue (;325 K; Fig. 19b), which is consistent withits origin in the western foothills and slopes, and, con-sequently, it cannot support convective activity, even inthe presence of localized updrafts over the Altiplano.
c. Model diagnosis
The wind direction in the middle troposphere overthe Altiplano seems to be a key element in controllingthe strength of the daytime flow over the eastern slopeof the Andes, especially in the upper portion of thesloping terrain where the top of the CBL reaches the500-hPa level. A tendency for surface winds over slop-ing terrain to be in the same direction of the winds aloft,and, more generally, the influence of the large-scale,ridge-top winds on the intensity and extent of the re-gional upslope flow, has also been documented in ob-servational studies (Banta 1984; Wolyn and McKee1994) and in numerical simulations (Banta 1986; Bos-
sert and Cotton 1994) over the eastern slope of the Rock-ies.
To quantify this effect, we made a diagnosis of themomentum balance of the winds within the CBL overpoint H (Fig. 15a) using the model output at noontimefor day 2 in the rainy and dry simulations. From a re-gional perspective, the eastern slope of the Andes israther gentle (tana ; 3.3 km per 250 km) and uniform.Assuming a 2D geometry in the plane where the slopeis contained (i.e., the cross section AA9 in Fig. 15 re-peats infinitely in the axis normal to AA9), integrationof the along-slope momentum equation over the depthof the CBL (H) yields (e.g., Barry 1992):
Du gu 1 u u 5 g sina 1 cosa [(Du)H ] 1 f y 1 FR,t x xu u0 0
(1)

MAY 1999 917G A R R E A U D
FIG. 18. Mixing ratio (contour each 2 g kg21) across section AA9 (Fig. 17). Light, medium, and dark shadingindicate cloud plus rainwater in excess of 0.25, 0.75, and 1.0 g kg21, respectively. (a) 0900 LST rainy event(average of 0900 LST of days 1 and 2 of the rainy simulation). (c) 1200 LST rainy event. (d) 1700 LST rainyevent. (b) As in (a) but for the dry event. (d) As in (c) but for the dry event. (f ) As in (e) but for the dry event.
where the subscripts refer to partial derivatives, x is thealong-slope coordinate, u is the mean (vertically aver-aged) along-slope wind component (upslope flow), y isthe mean wind component normal to the plane of theslope, Du is the potential temperature excess of the air
near the sloping terrain with respect to the air outsidethe CBL, and u0 is a basic-state reference potential tem-perature outside the CBL. The forcing terms on the rhsof Eq. (1) are the buoyancy force, the thermal wind, theCoriolis force, and friction, respectively. The frictional

918 VOLUME 127M O N T H L Y W E A T H E R R E V I E W
FIG. 19. Equivalent potential temperature (ue, contour every 3.5K) at 1600 LST and air parcel trajectories across section AA9 (Fig.17). See text for details of the trajectories calculation. Air parcelsare released at 1030 LST, and their subsequent positions are plottedeach 30 min by a filled circle (if the original ue of the air parcel isless than the ambient ) or open circle (otherwise). (a) Rainy event.u*e(b) Dry event.
TABLE 2. Along-slope momentum balance over point H (see Fig.17) at 1200 LST of day 2. See text for details. Plus and minus signsindicate upslope and downslope acceleration.
Term
Magnitude (104 3 m s22)
Wet case Dry case
Along-slope advectionBuoyancyThermal windCoriolis forceSurface frictionVertical entrainmentObserved rate of change
20.412.211.310.120.310.813.7
20.512.311.310.120.220.912.1
Calculated rate of change 13.3 11.7
term was parameterized as the divergence throughoutthe CBL of the surface friction and the vertical entrain-ment from aloft:
FR 5 (weDui 2 CDu2)/H, (2)
where we is the entrainment velocity, Dui is the windshear across the top of the CBL, and CD is the surfacedrag coefficient. Both we and CD were estimated as a
function of the surface heat flux and local static stabilityusing the expressions given in Stull (1989, section 7).
The magnitude of each term in Eq. (1) is given inTable 2. As expected, the main driving forces for thedaytime upslope flow are the thermal contrast betweenthe heated sloping terrain and the colder air in the freeatmosphere (the buoyancy term) and the increase ofpotential temperature along the slope (the thermal windterm). The similar magnitude of these two terms in therainy and dry cases is consistent with the similar day-time thermal structure that develops over the Andes inboth simulations (Fig. 17). The along-slope advectionand the Coriolis force are an order of magnitude smallerand also comparable in the two cases. The decelerationdue to surface friction is slightly stronger in the rainycase, but the main difference in the momentum balanceis largely produced by the vertical entrainment term,which is of opposite sign in the rainy and dry simula-tions. In the rainy case, turbulent mixing across the topof the inversion entrains air with easterly momentum,accelerating the upslope flow over the eastern slope ofthe Andes. In contrast, westerly winds over the CBLduring the dry simulation tend to decelerate the easterlyupslope flow within the CBL by entraining air withmomentum of opposite sign (westerly). The net resultis that the local rate of change of the along-slope windin the dry case is about half of that calculated in therainy case, which is consistent with the subsequent weak(strong) easterly upslope flow observed in the dry(rainy) simulation.
6. Conclusions
Low-level conditional instability over the SouthAmerican Altiplano prevails on most summertime af-ternoons, a consequence of the intense solar heating ofthe surface and the moisture contrast between air withinthe local boundary layer and the air aloft (;500 hPa).Nevertheless, this instability can be released only ondays in which the near-surface specific humidity (qLL)reaches high values (;7 g kg21 or more), yielding sat-uration of near-surface air parcels by the time they reachabout 50 hPa above the ground. These days tend to

MAY 1999 919G A R R E A U D
cluster in ‘‘rainy’’ episodes that last between 4 and 10days and account for most of the summertime rainfallover the central Andes. Alternating dry episodes arecharacterized by low values of mixing ratio within theCBL (;4 g kg21 or less) and an absence of convectivecloudiness. These thresholds of qLL must be regarded assimple references, as they are deduced from rainfall andmixing ratio obervations at a single station over theAltiplano (Visviri) taken during two summers (section4b). Yet the variability of the near-surface mixing ratio(;3 g kg21) between rainy and dry episodes inferredfrom the local observation is in close agreement withthe difference of reanalyzed mixing ratio at 600 hPabetween composite rainy and dry episodes based on a17-summer record (cf. Figs. 5d and 6d).
Our compositing analysis has shown that rainy anddry episodes over the central Andes are associated withwell-defined continental-scale anomalies in convectionand upper- and middle-level circulation, confirming andextending previous results based on more limited da-tasets (e.g., Aceituno and Montecinos 1993; Lenters andCook 1999; Vuille et al. 1998). Rainy episodes over theAltiplano occur simultaneously with well-defined anti-cyclonic, equivalent barotropic anomalies over subtrop-ical South America (centered at 258S), leading to east-erly winds over the central Andes. The opposite situa-tion (cold core cyclone) prevails during dry episodes,with the central Andes exposed to westerly winds. Thesecirculation anomalies substantially reinforce or weakenthe climatological Bolivian High and seem primarilyforced by low frequency, planetary waves originatingin the Southern Hemisphere extratropics. The large-scale ‘‘signal’’ in the lower troposphere is much weakerand less distinctive. In particular, the reanalyzed low-level mixing ratio anomalies to the east of the Andes(the source region of high ue air) are not substantiallydifferent in the rainy and dry composites and are toosmall (;1 g kg21) to explain the moisture variabilityover the Altiplano (;3 g kg21) between rainy and dryepisodes. The reason for this could be the poor reso-lution of the reanalysis data in comparison with theAndean geography, or, alternatively, the existence ofseveral low-level patterns associated with rainfall de-partures over the Altiplano, as recently suggested byLenters and Cook (1999) and Vuille et al. (1998).
To gain insight into the regional processes linking thelarge and local conditions, we have used a numericalmesoscale model with a horizontal resolution of 24 km.Comparison of the model output with synoptic obser-vations, reanalysis fields, and satellite images of con-vective cloudiness indicates that the model realisticallysimulates two contrasting rainy and dry episodes. Themost marked and relevant differences between simu-lations are the intensity, timing, and extent of the di-urnally varying upslope flow over the eastern slope ofthe Andes. During the rainy simulation, strong easterlywinds within the CBL reach the upper part of the easternslope of the Andes by midmorning, followed by a west-
ward intrusion of high ue air (originating in the easternlowlands) into the Altiplano during the early afternoon.In this case, surface easterly winds prevail over the Al-tiplano, in the same direction as the flow aloft, and low-level convergence is found over the plateau collocatedwith the axis of maximum daytime precipitation. In con-trast, during dry periods the moisture transport from theeast is restricted somewhere over the eastern slope ofthe Andes, the surface of the Altiplano is dominated bywesterly winds, and the plateau is flooded by low ue airoriginating in the western foothills and slopes. Despitethe existence of a well-defined leeside convergencezone, deep convection is suppressed over the easternside of the Andes by the midlevel entrainment of dryair and subsidence forced by mountain-wave circulation.
A diagnosis of the momentum balance within theCBL over the upper half of the eastern slope of theAndes indicates that the contrast in the daytime upslopeflow between rainy and dry simulations are largely pro-duced by differences in the vertical entrainment of mo-mentum at the top of the CBL. In both cases, the upslopeflow is mainly driven by the upper-level heat source thatdevelops over the mountainous terrain. In the rainy case,the westward large-scale flow at the ridge level producesturbulent entrainment of easterly momentum across thetop of the inversion that tends to accelerate the easterlyupslope flow. In contrast, midtropospheric eastwardwinds during the dry simulation tend to decelerate theeasterly upslope flow within the CBL, by entraining airwith momentum of opposite sign.
It must be stressed that our conclusions regarding thelocal- and regional-scale processes over the central An-des are based on a short, single-site observational recordand a pair of short-term numerical simulations, andtherefore they might lack generality. Yet the model re-sults suggest a plausible, physically consistent linkagebetween the slowly varying large-scale anomalies in theupper- and middle-level circulation and the local ther-modynamic conditions over the Altiplano that supportor suppress deep convection through the diurnally vary-ing, regional-scale flow over the eastern slopes of theAndes. A more conclusive picture of the rainy and dryconditions over the central Andes will have to wait untilin situ enhanced observations over the Altiplano andthe slopes of the Andes yield a more thorough validationof numerical and conceptual models.
Acknowledgments. The author gratefully acknowl-edges many helpful comments and advice provided byDrs. John M. Wallace and Patricio Aceituno. Thanksare also due to Dr. John Lenters for a very thoroughand helpful review of the manuscript and to the otherreviewer who helped improve this work. Drs. Brian Col-le, Kerry Cook, and Brad Smull also offered many use-ful comments. Ken Westrick kindly helped in handlingthe mesoscale model. NCEP–NCAR reanalysis data wasprovided through the NOAA Climate Diagnostics Cen-ter. The B3 ISCCP data were obtained from NASA/

920 VOLUME 127M O N T H L Y W E A T H E R R E V I E W
Langley Research Center EOSDIS Distributed ActiveArchive Center. The field experiments Visviri I and IIwere part of a research project of the Department ofGeophysics of the University of Chile, supported byGrants Fondecyt (Chile) 1930789 and IPGH Geof 93.26.Dr. Patricio Aceituno and Aldo Montecinos kindly pro-vided the data from Visviri I and II. The author is par-tially supported by the National Science Foundation un-der Grant 9215512 and by the Department of Geo-physics of the University of Chile.
REFERENCES
Aceituno, P., 1997: Climate elements of the South American Alti-plano. Rev. Geofis., 44, 37–55., and A. Montecinos, 1993: Circulation anomalies associatedwith dry and wet periods in the South American Altiplano. Proc.Fourth Int. Conf. on Southern Hemisphere Meteorology, Hobart,Australia, Amer. Meteor. Soc., 330–331., and R. Garreaud, 1995: The impact of the ENSO phenomenonin the pluviometric regime over the Andes. Rev. Chil. Ing. Hi-draul., 2, 33–43., and A. Montecinos, 1997a: Patterns of convective cloudinessin South America during austral summer from OLR pentads.Preprints, Fifth Int. Conf. on Southern Hemisphere Meteorologyand Oceanography, Pretoria, South Africa, Amer. Meteor Soc.,328–329., and , 1997b: Meteorological field experiments in the SouthAmerican Altiplano. Preprints, Fifth Int. Conf. on SouthernHemisphere Meteorology and Oceanography, Pretoria, SouthAfrica, Amer. Meteor. Soc., 330–331., H. Fuenzalida, and J. Rutllant, 1995: Meteorological field ex-periment ‘‘Visviri I’’ in the South American Altiplano. Proc.19th Annual Climate Diagnostics Workshop, College Park, MD,Amer. Meteor. Soc., 19–21.
Anthes, R. A., and T. T. Warner, 1978: Development of hydrodynamicmodels suitable for air pollution and other mesometeorologicalstudies. Mon. Wea. Rev., 106, 270–286.
Banta, R. M., 1984: Daytime boundary-layer evolution over moun-tainous terrain. Part I: Observations of the dry circulations. Mon.Wea. Rev., 112, 340–356., 1986: Daytime boundary-layer evolution over mountainous ter-rain. Part II: Numerical studies of upslope flow duration. Mon.Wea. Rev., 114, 1112–1130., 1991: The role of the mountain flow making clouds. Atmo-spheric Processes over Complex Terrain, Meteor. Monogr., No.23, Amer. Meteor. Soc., 183–203.
Barry, R. G., 1992: Mountain Weather and Climate. 2d ed. Rutledge,402 pp.
Benjamin, S. G., and T. N. Carlson, 1986: Some effects of surfaceheating and topography on the regional severe storm environ-ment. Part I: Three-dimensional simulations. Mon. Wea. Rev.,114, 975–1001.
Blackadar, A. K., 1979: High resolution models of the planetaryboundary layer. Advances in Environmental Sciences and En-gineering, J. Pfafflin and E. Ziegler, Eds., Vol. I, Gordon andBreach Scientific, 50–85.
Bossert, J. E., and W. R. Cotton, 1994: Regional-scale flows in moun-tainous terrain. Part II: Simplified numerical experiments. Mon.Wea. Rev., 122, 1472–1489.
Dempsey, D., 1996: Spatial-differencing errors in MM5’s terrain-following coordinate. Proc. Sixth PSU/NCAR Mesoscale ModelUser’s Workshop, Boulder, CO, NCAR, 82–85.
Dudhia, J., 1989: Numerical study of convection observed during thewinter monsoon experiment using a mesoscale two-dimensionalmodel. J. Atmos. Sci., 46, 3077–3107., 1993: A nonhydrostatic version of the Penn State/NCAR me-
soscale model: Validation test and simulation of an Atlantic cy-clone and cold front. Mon. Wea. Rev., 121, 1493–1513.
Figueroa, S. N., P. Satyamurty, and P. L. Silva Dias, 1995: Simulationof the summer circulation over the South American region withan Eta coordinate model. J. Atmos. Sci., 52, 1573–1584.
Fuenzalida, H., and J. Rutllant, 1987: Origen del vapor de agua queprecipita sobre el Altiplano de Chile. Proc. II CongresoInterAmericano de Meteorologia, Buenos Aires, Argentina,6.3.1–6.3.4.
Garreaud, R. D., and J. M. Wallace, 1997: The diurnal march ofconvective cloudiness over the Americas. Mon. Wea. Rev., 125,3157–3171.
Grell, G. A., J. Dudhia, and D. R. Stauffer, 1994: A description ofthe fifth-generation Penn State/NCAR mesoscale model. NCARTech. Note NCAR/TN-3981IA, 107 pp. [Available from NCAR,P.O. Box 3000, Boulder, CO 80307.]
Gruber, A., and A. F. Krueger, 1984: The status of the NOAA outgoinglongwave radiation data set. Bull. Amer. Meteor. Soc., 65, 958–962.
Gutman, G., and W. S. Schwerdtferger, 1965: The role of latent andsensible heat for the development of a high pressure system overthe subtropical Andes, in summer. Meteor. Rundsch., 17, 1–7.
Holton, J. R., 1992: An Introduction to Dynamic Meteorology. 3d ed.Academic Press, 512 pp.
Horel, J., A. Nahmann, and J. Geisler, 1989: An investigation of theannual cycle of the convective activity over the tropical Amer-icas. J. Climate, 2, 1388–1403.
Houze, R. A., 1993: Cloud Dynamics. 1st ed. Academic Press, 573pp.
Hsie, E.-Y., R. A. Anthes, and D. Keyser, 1984: Numerical simulationof frontogenesis in a moist atmosphere. J. Atmos. Sci., 41, 2581–2594.
Jones, C., 1990: An investigation of low-frequency variability of thelarge-scale circulation over South America. M.S. thesis, Uni-versity of Utah, 103 pp. [Available from Meteorology Depart-ment, University of Utah, Salt Lake City, UT 84112-0110.]
Kain, J. S., and J. M. Fritsch, 1993: Convective parameterization formesoscale models: The Kain–Fritsch scheme. The Representa-tion of Cumulus Convection in Numerical Models, Meteor. Mon-ogr., No. 46, Amer. Meteor. Soc., 165–170.
Kalnay, E., and Coauthors, 1996: The NCEP/NCAR 40-Year Re-analysis Project. Bull. Amer. Meteor. Soc., 77, 437–472.
Kiladis, G. N., and K. M. Weickmann, 1997: Horizontal structureand seasonality of large-scale circulations associated with sub-monthly tropical convection. Mon. Wea. Rev., 125, 1997–2013.
Legates, P., and H. Willmont, 1990: A climatology of global precip-itation. Int. J. Climatol., 10, 111–127.
Lenters, J. D., and K. H. Cook, 1995: Simulation and diagnosis ofthe regional summertime precipitation climatology of SouthAmerica. J. Climate, 8, 2298–3005., and , 1997: On the origin of the Bolivian high and relatedcirculation features of the South American climate. J. Atmos.Sci., 54, 656–677., and , 1999: Summertime precipitation variability overSouth America: Role of the large-scale circulation. Mon. Wea.Rev., 127, 409–431.
Mo, K. C., and R. W. Higgins, 1997: The Pacific South Americanmodes and tropical convection during the Southern Hemispherewinter. Mon. Wea. Rev., 126, 1581–1596.
Negri, A., R. Adler, R. Maddox, K. Howard, and P. Keehn, 1993: Aregional rainfall climatology over Mexico and the southwestUnited States derived from passive microwave and geosynchro-nous infrared data. J. Climate, 6, 2144–2161.
Nogues-Paegle, J., and K. C. Mo, 1997: Alternating wet and dryconditions over South America during summer. Mon. Wea. Rev.,125, 279–291.
Orlanski, I., 1975: A rational subdivision of scale for atmosphericprocesses. Bull. Amer. Meteor. Soc., 56, 527–530.
Rao, G. V., and S. Erdogan, 1989: The atmospheric heat source over

MAY 1999 921G A R R E A U D
the Bolivian Plateau for a mean January. Bound.-Layer Meteor.,46, 13–33.
Rossow, W., and R. Schiffer, 1991: ISCCP cloud data products. Bull.Amer. Meteor. Soc., 72, 2–20.
Schwerdtfeger, W., 1976: High thunderstorm frequency over the sub-tropical Andes during the summer: Cause and effects. Climateof Central and South America, W. Schwerdtfeger, Ed., Elsevier,192–195.
Stull, R. B., 1989: An Introduction to Boundary Layer Meteorology.2d ed. Kluwer Academic Publishers, 665 pp.
Tang, M., and E. R. Reiter, 1984: Plateau monsoons of the NorthernHemisphere: A comparison between North America and Tibet.Mon. Wea. Rev., 112, 617–629.
Thompson, L. G., E. Mosley-Thompson, and B. Morales, 1984: ElNino–Southern Oscillation events recorded in stratigraphy of thetropical Quelccaya Ice Cap, Peru. Science, 226, 50–53.
Tripoli, G. J., and W. R. Cotton, 1989: Numerical study of an observed
orogenic mesoscale convective system. Part I: Simulated genesisand comparison with observations. Mon. Wea. Rev., 117, 273–304.
Virji, H., 1981: A preliminary study of summertime troposphericcirculation patterns over South America estimated from cloudwinds. Mon. Wea. Rev., 109, 599–612.
Vuille, M., D. R. Hardy, C. Braun, F. Keimig, and R. S. Bradley,1998: Atmospheric circulation anomalies associated with 1996/97 summer precipitation events on Sajama Ice Cap, Bolivia. J.Geophys. Res., 103, 11 191–11 204.
Wang, W., and N. L. Seaman, 1997: A comparison study of convectiveparameterization schemes in a mesoscale model. Mon. Wea.Rev., 125, 252–278.
Wolyn, P. G., and T. B. McKee, 1994: The mountain–plains circulationeast of a 2-km-high north–south barrier. Mon. Wea. Rev., 122,1490–1508.
Zhou, J., and K. M. Lau, 1998: Does a monsoon climate exist overSouth America? J. Climate, 11, 1020–1040.