Embed Size (px)
Citation preview
MULTIPROG-2016
Proceedings of the Ninth International Workshop on Programmability andArchitectures for Heterogeneous Multicores
Editors:
Miquel Pericàs, Chalmers University of Technology, Sweden
Vassilis Papaefstathiou, Chalmers University of Technology, Sweden
Ferad Zyulkyarov, Barcelona Supercomputing Center, Spain
Oscar Palomar, Barcelona Supercomputing Center, Spain
Prague, Czech Republic, January 18th, 2016

The ninth edition of the Workshop on Programmability and Architectures for Het-erogeneous Multicores (MULTIPROG-2016) took place in Prague, Czech Republic, onJanuary 18th, 2016. The workshop was co-located with the HiPEAC 2016 conference.MULTIPROG aims to bring together researchers interested in programming models,runtimes, and computer architecture. The workshop is intended for quick publication ofearly results, work-in-progress, etc., and is not intended to prevent later publication ofextended papers. This year we received a total of 15 submissions. The authors' originwas mainly from Europe (48 authors). We also had contributions from Asia (13 authors),Brazil (2 authors) and the U.S. (1 author). Each submission was reviewed by up to threemembers from our Program Committee. The organizing committee selected eight regularpapers and three position papers for presentation at the workshop.In addition to the selected papers, the workshop included a keynote and three invited
talks:
• Prof. David Kaeli from Northeastern University gave the MULTIPROG 2016keynote: "Accelerators as First-class Computing Devices"
• Prof. Per Stenström from Chalmers University of Technology gave an invited talk:"MECCA - Meeting the Challenges in Computer Architecture"
• Rainer Leupers, CTO of Silexica Software Solutions GmbH gave an invited talk:"Use Case Driven Embedded Multicore Software Development"
• Jeav-Francois Lavignon from the European Technology Platform for High Perfor-mance Computing (ETP4HPC) gave an invited talk: "The ETP4HPC StrategicResearch Agenda"
We have assembled the accepted papers into these informal proceedings. The 2016 editionof MULTIPROG was well attended and generated lively discussions among the partic-ipants. We hope these proceedings will encourage you to submit your research to thenext edition of the workshop!
Organizing Committee:
• Ferad Zyulkyarov, Barcelona Supercomputing Center, Spain
• Oscar Palomar, Barcelona Supercomputing Center, Spain
• Vassilis Papaefstathiou, Chalmers University of Technology, Sweden
• Miquel Pericàs, Chalmers University of Technology, Sweden
Steering Committee:
• Eduard Ayguade, UPC/BSC, Spain
• Benedict R. Gaster, University of the West of England, UK
• Lee Howes, Qualcomm, USA
• Per Stenström, Chalmers University of Technology, Sweden
• Osman Unsal, Barcelona Supercomputing Center, Sweden
Program Committee:
• Abdelhalim Amer, Argonne National Lab, USA
• Ali Jannesari, TU Darmstadt, Germany
• Avi Mendelson, Technion, Israel
• Christos Kotselidis, University of Manchester, UK
• Daniel Goodman, Oracle Labs, UK
• Dong Ping Zhang, AMD, USA
• Gilles Sassatelli, LIRMM, France
• Håkan Grahn, Blekinge Institute of Technology, Sweden
• Hans Vandierendonck, Queen's University of Belfast, UK
• Kenjiro Taura, University of Tokyo, Japan
• Luigi Nardi, Imperial College London, UK
• Naoya Maruyama, RIKEN AICS, Japan
• Oscar Plata, University of Malaga, Spain
• Pedro Trancoso, University of Cyprus, Cyprus
• Polyvios Pratikakis, FORTH-ICS, Greece
• Roberto Gioiosa, Paci�c Northwest National Laboratory, USA
• Ruben Titos, BSC, Spain
• Sasa Tomic, IBM Research, Switzerland
• Simon McIntosh-Smith, University of Bristol, UK
• Timothy G. Mattson, Intel, USA
• Trevor E. Carlson, Uppsala University, Sweden
External Reviewers:
• Julio Villalba, University of Malaga, Spain
Index of selected Papers:
Accelerating HPC Kernels with RHyMe - REDEFINE HyperCell Multicore.Saptarsi Das, Nalesh S., Kavitha Madhu, Soumitra Kumar Nandy andRanjani Narayan
5
Project Beehive: A Hardware/Software Co-designed Stack for Runtime andArchitectural Research. Christos Kotselidis, Andrey Rodchenko, ColinBarrett, Andy Nisbet, John Mawer, Will Toms, James Clarkson, CosminGorgovan, Amanieu d'Antras, Yaman Cakmakci, Thanos Stratikopoulos,Sebatian Werner, Jim Garside, Javier Navaridas, Antoniu Pop, JohnGoodacre and Mikel Lujan
18
Reaching intrinsic compute e�ciency requires adaptable micro-architectures.Mark Wijtvliet, Luc Waeijen, Michaël Adriaansen and Henk Corporaal
25
Toward Transparent Heterogeneous Systems. Baptiste Delporte, RobertoRigamonti and Alberto Dassatti
32
Exploring LLVM Infrastructure for Simpli�ed Multi-GPU Programming.Alexander Matz, Mark Hummel and Holger Fröning
45
E�cient scheduling policies for dynamic data�ow programs executed onmulti-core. Malgorzata Michalska, Nicolas Zu�erey, Jani Boutellier, EndriBezati and Marco Mattavelli
57
OpenMP scheduling on ARM big.LITTLE architecture. Anastasiia Butko,Louisa Bessad, David Novo, Florent Bruguier, Abdoulaye Gamatie, GillesSassatelli, Lionel Torres and Michel Robert
71
Collaborative design and optimization using Collective Knowledge. AntonLokhmotov and Grigori Fursin
78
Heterogeneous (CPU+GPU) Working-set Hash Tables. Ziaul Choudhury andSuresh Purini
91
A Safe and Tight Estimation of the Worst-Case Execution Time ofDynamically Scheduled Parallel Applications. Petros Voudouris, PerStenström and Risat Pathan
104
Accelerating HPC Kernels with RHyMe -REDEFINE HyperCell Multicore
Saptarsi Das1, Nalesh S.1, Kavitha T. Madhu1, S. K. Nandy1 andRanjani Narayan2
1 CAD Laboratory, Indian Institute of Science, BangaloreEmail: {sdas, nalesh, kavitha}@cadl.iisc.ernet.in,
[email protected] Morphing Machines Pvt. Ltd., Bangalore
Email: [email protected]
Abstract. In this paper, we present a coarse grained reconfigurable ar-ray (CGRA) designed to accelerate high performance computing (HPC)application kernels. The proposed CGRA named RHyMe, REDEFINEHyperCell Multicore, is based on the REDEFINE CGRA. It consistsof a set of reconfigurable data-paths called HyperCells interconnectedthrough a network-on-chip (NoC). The network of HyperCells serves asthe hardware data-path for realization of HyperOps which are the basicschedulable entities in REDEFINE. RHyMe is specialized to accelerateregular computations like loops and relies on the compiler to generate themeta-data which are used at runtime for orchestrating the kernel execu-tion. As a result, the compute hardware is simple and memory structurescan be managed explicitly rendering a simple as well as efficient archi-tecture.
1 Introduction
Modern high performance computing (HPC) applications demand heterogeneouscomputing platforms which consists of a variety of specialized hardware accel-erators alongside general purpose processing (GPP) cores to accelerate computeintensive functions. When compared to GPPs, although accelerators give dra-matically higher efficiency for their target applications they are not as flexibleand performs poorly on other applications. Graphic processing units (GPU) canbe used for accelerating a wide range of parallel applications. However GPUsare more suited for single instruction multiple data (SIMD) applications. Fieldprogrammable gate arrays (FPGA) may be used to generate accelerators ondemand. Although this mitigates the flexibility issue involved with specializedhardware accelerators, the finer granularity of the lookup tables (LUT) in FP-GAs leads to significantly high configuration time and low operating frequency.Coarse-grain reconfigurable architectures (CGRA) consisting of a pool of com-pute elements (CE) interconnected using some communication infrastructureovercomes the reconfiguration overheads of FPGAs while providing performanceclose to specialized hardware accelerators.
2
Examples of CGRAs include Molen Polymorphic Processor [13], ConveyHybrid-Core Computer [3], DRRA [12], REDEFINE [2], CRFU [10], Dyser [7],TRIPS [4]. REDEFINE as reported in [2] is a runtime reconfigurable polymor-phic applications specific integrated circuit (ASIC). Polymorphism in ASICs issynonymous with attributing different functionalities to fixed hardware in spaceand time. REDEFINE is a massively parallel distributed system, comprising aset of Compute Elements (CEs) communicating over a Network-on-Chip (NoC)[6] using messages. REDEFINE follows a macro data-flow execution model atthe level of macro operations (also called HyperOps). HyperOps are convex par-titions of the application kernels data-flow graph, and are composition of one ormore multiple-input-multiple-output (MIMO) operations. The ability of REDE-FINE to provision CEs to serve as composed data-paths for MIMO operationsover the NoC is a key differentiator that sets aside REDEFINE from otherCGRAs.
REDEFINE exploits temporal parallelism inside the CEs, while spatial par-allelism is exploited across CEs. The CE can be an instruction-set processoror a specialized custom function unit (CFU) or a reconfigurable data-path. Inthis paper, we present the REDEFINE CGRA with HyperCells [8], [5] as CEsso as to support parallelism of all granularities. HyperCell is a reconfigurabledata-path that can be configured on demand to accelerate frequently occurringcode segments. Custom data-paths, dynamically set up within HyperCells en-able exploitation of fine-grain parallelism. Coarse grained parallelism is exploitedacross various HyperCells. We refer to this architecture, ie, HyperCells as CEsin REDEFINE as REDEFINE HyperCell Multicore (RHyMe). In this paper wepresent the RHyMe hardware comprising both the resources for computationand runtime orchestration. The paper is structured as follows. The executionmodel and a brief overview of compilation flow employed are described in 2. Sec-tion 3 presents the hardware architecture of RHyMe. Sections 4 and 5 presentsome results and conclusions of the paper.
2 Execution Model & Compilation Framework
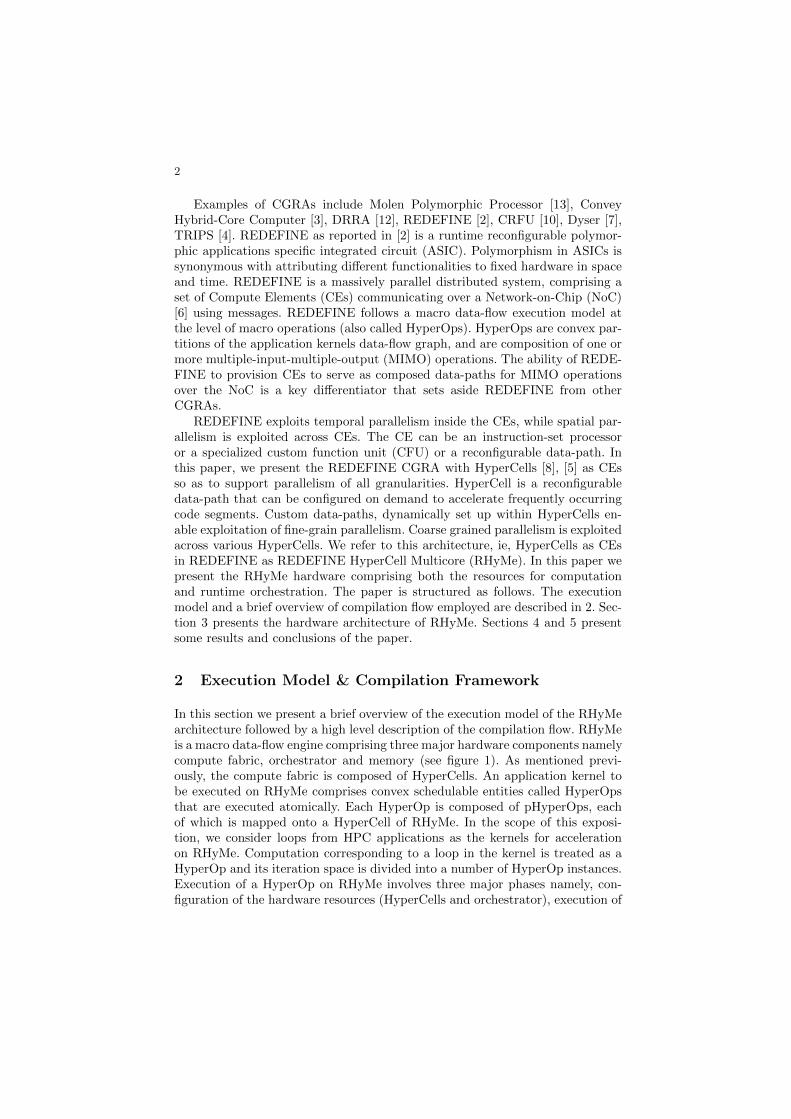
In this section we present a brief overview of the execution model of the RHyMearchitecture followed by a high level description of the compilation flow. RHyMeis a macro data-flow engine comprising three major hardware components namelycompute fabric, orchestrator and memory (see figure 1). As mentioned previ-ously, the compute fabric is composed of HyperCells. An application kernel tobe executed on RHyMe comprises convex schedulable entities called HyperOpsthat are executed atomically. Each HyperOp is composed of pHyperOps, eachof which is mapped onto a HyperCell of RHyMe. In the scope of this exposi-tion, we consider loops from HPC applications as the kernels for accelerationon RHyMe. Computation corresponding to a loop in the kernel is treated as aHyperOp and its iteration space is divided into a number of HyperOp instances.Execution of a HyperOp on RHyMe involves three major phases namely, con-figuration of the hardware resources (HyperCells and orchestrator), execution of
3
the instances of a HyperOp by binding runtime parameters and synchronizationamong HyperOp instances. HyperOp instances are scheduled for execution whenthe following conditions are met.
– HyperCells executing the HyperOp instance and the orchestrator are config-ured.
– Operands of the HyperOp instance is available in REDEFINE’s memory.– HyperCells to which the HyperOp is mapped are free to execute the Hy-
perOp.– Runtime parameters of HyperCells and orchestrator are bound.
A HyperOp requires the HyperCells and orchestrator to be configured whenlaunching the first instance for execution. Subsequent instances require only theruntime parameters to be sent to HyperCells and orchestrator as explained indetail in section 3.
In [9], the authors have presented a detailed description of the executionmodel and the compilation flow for RHyMe. In the following section we discussthe hardware architecture of RHyMe in greater detail.
3 REDEFINE HyperCell Multicore (RHyMe)Architecture
In this section we present the architectural details of RHyMe. As mentioned insection 2, RHyMe has three major components namely Compute Fabric, Mem-ory, Orchestrator.
H H
H H
H H
H H
H H
H H
H H
H H
H H
H H
H H
H H
H
Router
HyperCell
MemoryBank Set
MemoryBank Set
MemoryBank Set
MemoryBank Set
MemoryBank Set
MemoryBank Set
MemoryBank Set
MemoryBank Set
MemoryBank Set
MemoryBank Set
MemoryBank Set
MemoryBank Set
ComputeFabric
Dat
a M
ove
men
t U
nit
Exte
rnal
Mem
ory
Ru
nti
me
Para
met
er
Co
mp
uta
tio
n
Un
it
Hyp
erO
p
Sch
edu
ler
Un
itC
on
figu
rati
on
U
nitOrc
hes
trat
or
Ho
st E
nvi
ron
men
t
DataConfiguration MetadataControl
Orc
hes
trat
or-
Fab
ric
Inte
rfac
e
DistributedGlobal Memory
Fig. 1. REDEFINE HyperCell Multicore (RHyMe)

4
3.1 Compute Fabric
The Compute fabric of RHyMe consists of a set of HyperCells interconnectedvia an NoC.HyperCell: Micro-architectural details of HyperCell is presented in [5] and [8].The authors had presented HyperCell as a hardware platform for realizationof multiple input multiple output (MIMO) macro instructions. In this exposi-tion, we adopted the micro-architecture of HyperCell as the CEs in RHyMe. AHyperCell has a controller and a local storage along side a reconfigurable data-path (refer to figure 2). The reconfigurable data-path of HyperCell comprises aset of compute units (CU) connected by a circuit-switched interconnect (referfigure 2). The CUs and switches can be configured to realize various data-flowgraphs (DFG). The reconfigurable data-path of HyperCell is designed to sup-port pipelined execution of instances of such DFGs. Flow control of data in thiscircuit switched network is ensured by a light weight ready-valid synchroniz-ing mechanism ensuring that the data is not overwritten until it is consumed.This mechanism makes HyperCell tolerant to the non-deterministic latencies indata-delivery at CUs’ inputs. Local storage of a HyperCell consists of a set ofregister files, each with one read port and one write port. Each operand data ina register file is associated with a valid bit. An operand can only be read if itscorresponding valid bit is set. Likewise, an operand can be written to a registerlocation only if the corresponding valid bit is reset.
Controller is responsible for delivering both configuration and data inputsto the HyperCell’s data-path and transferring results to RHyMe’s memory. Itorchestrates four kinds of data transfers:
– Load data from RHyMe’s memory to HyperCell’s local data storage.– Load input from HyperCell’s local storage to HyperCell’s reconfigurable
data-path.– Store outputs from HyperCell’s reconfigurable data-path to RHyMe’s mem-
ory.– Store outputs from HyperCell’s reconfigurable data-path to local storage for
reuse in subsequent instances of the realized DFG.
These data transfers are specified in terms of a set of four control-sequences. Thecontrol-sequences are stored in dedicated storages inside the HyperCells. The Hy-perCell controller comprises four FSMs that process these control sequences. Theaforementioned control sequences together realize a modulo-schedule[11] of theDFG instantiated on the data-path. Each control sequence contains a prologueand epilogue, both of which are executed once and a steady state executed mul-tiple times. The sequences are generated in a parametric manner. The runtimeparameters are start and end pointers for prologue, steady state and epilogue,base addresses of the inputs and outputs, number of times steady state is executedand epilogue spill. At runtime, the reconfigurable data-path of HyperCell andits controller are configured for the first HyperOp instance. To facilitate execu-tion of different instances of a HyperOp, the runtime parameters are bound toHyperCell, once per instance.

5
A control sequence is realized as a set of control words interpreted at runtime.HyperCells’ control sequences are also responsible for communicating outputsbetween HyperCells. In order to facilitate inter-HyperCell communication, thelocal storage of a HyperCell is write-addressable from other HyperCells. An ac-knowledgement based synchronization scheme is realized to maintain flow controlduring communication among HyperCells. Further, control words are groupedtogether to send multiple operand data together to a remote HyperCell’s localstorage increasing the granularity of synchronization messages.
Peripheral Switch
Switch Buffer
Compute Unit
Corner Switch
To and from NoC Router
Local Storage
HyperCell
Reconfigurable Data-path
Transporter
Controller
Data
Control
Fig. 2. Reconfigurable data-path of HyperCell
Network on Chip: The NoC of RHyMe provides the necessary infrastruc-ture for inter-HyperCell communication (refer to figure 1), communication be-tween Memory and HyperCells and communication between Orchestrator andHyperCells. Authors have presented detail micro-architectural descriptions ofthe NoC in [6]. We adopted the same NoC for RHyMe. The NoC consists ofrouters arranged in a toroidal mesh topology. Each router is connected to fourneighbouring routers and a HyperCell. Packets are routed from a source routerto a destination router based on a deterministic routing algorithm namely thewest-first algorithm [6]. There are four types of packets handled by the NoCnamely load/store packets, configuration packets, synchronization packets andinter-HyperCell packets. The load/store packets carry data between the Hyper-Cells and memory. Configuration packets contain configuration meta-data orruntime parameters sent by the orchestrator to the HyperCells. Synchroniza-tion packets are sent from each HyperCell to the orchestrator to indicate end ofcomputation for the current pHyperOp being mapped to that HyperCell. Inter-
6
HyperCell packets consist of data transmission packets between the HyperCellsand the acknowledgement packets for maintaining flow control in inter-HyperCellcommunications. A transporter module acts as the interface between HyperCelland router and is responsible for packetizing data communicated across Hyper-Cells as well as load/store requests (refer to figure 2).
3.2 Memory
A distributed global memory storage is provisioned in RHyMe as shown in fig-ure 1. This memory serves as input and output storage to be used by successivecomputations. This memory can be viewed as overlay memory explicitly man-aged by the orchestrator. All inputs required by a particular computation isloaded into memory before execution starts. It is implemented as a set of mem-ory banks. Multiple logical partitions are created at compile time. One of thepartitions is used as operand data storage and the others act as prefetch buffersfor subsequent computations.
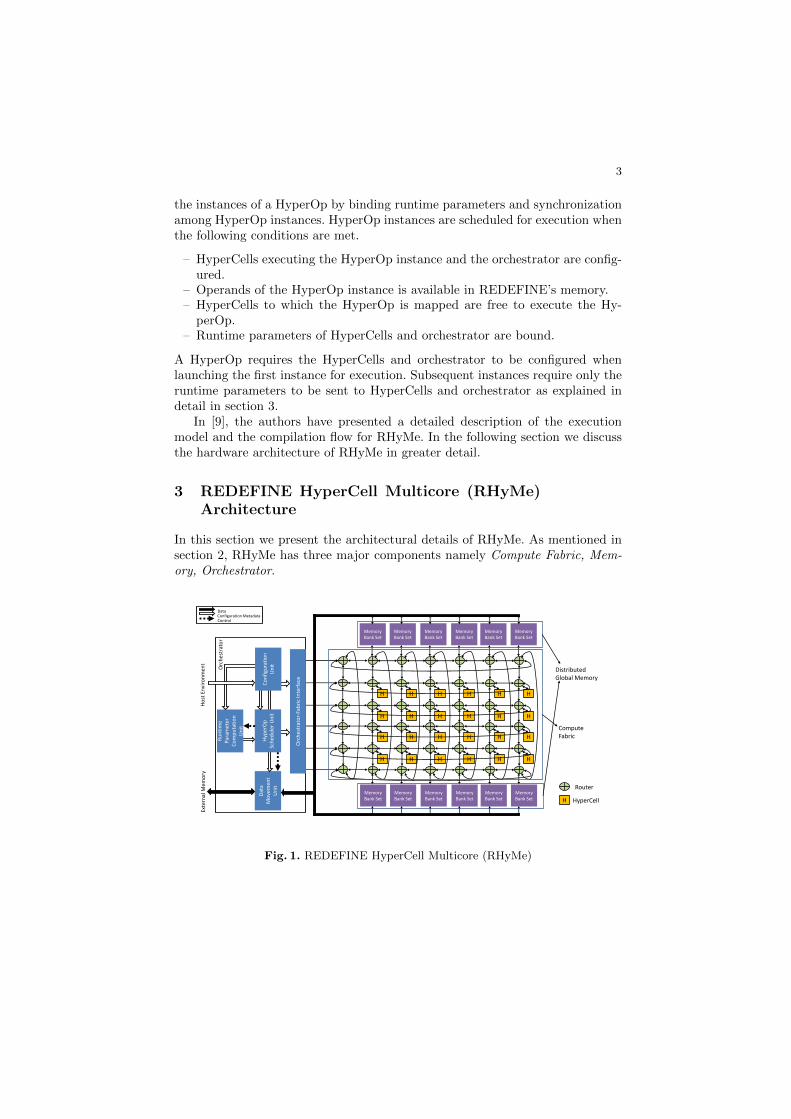
3.3 Orchestrator
Orchestrator is responsible for the following activities.
– Data movement between RHyMe’s memory and external memory interface
– Computation of runtime parameters
– Scheduling HyperOps and HyperOp instances and synchronization betweensuccessive instances or HyperOps
– Configuration of HyperCell and the other orchestrator modules
Data Movement Unit
External Memory
RHyMe Memory
Runtime Parameter
Computation Unit
HyperOp Scheduler Unit
Data
Configuration Metadata
Control
RHyMe Compute Fabric
Configuration Unit
Orchestrator
Host Environment
Fig. 3. Interactions between modules of the Orchestrator
7
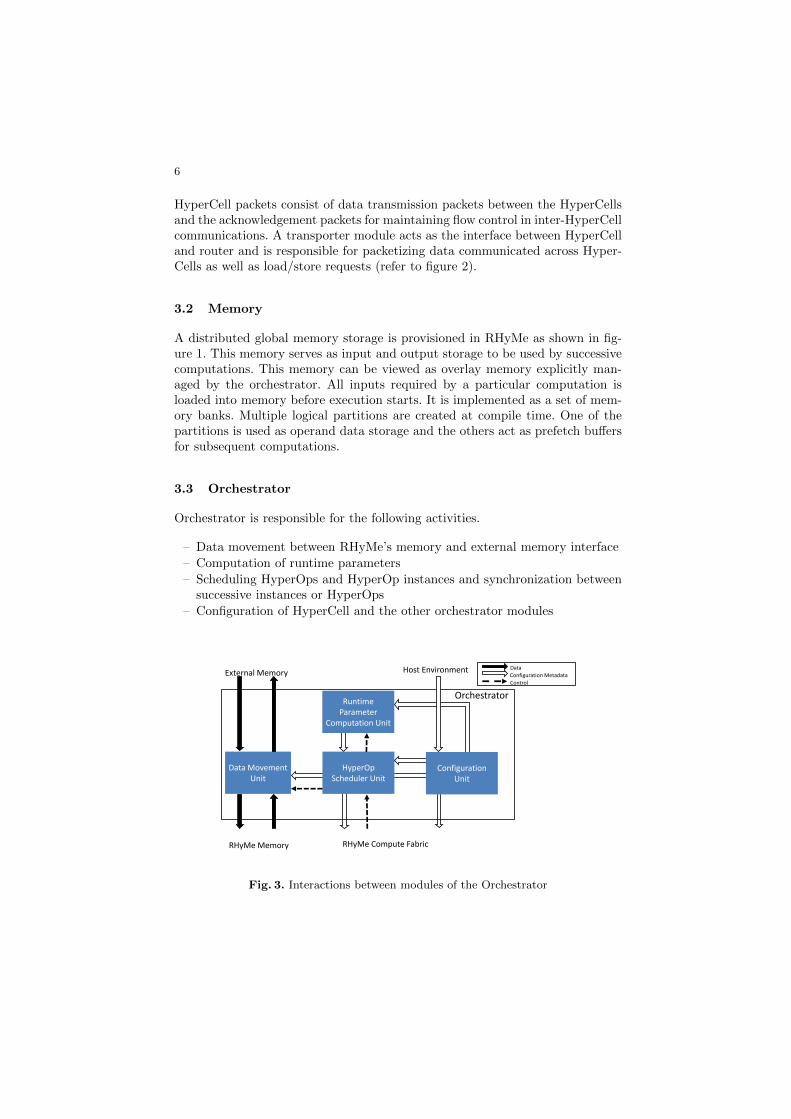
The aforementioned tasks are carried out by three modules of the orches-trator. Brief descriptions of the modules are given below. Figure 3 depicts theinteractions between these various modules.Configuration Unit: Configuration Unit is responsible for the initial config-uration of the HyperCells as well as the other units of the orchestrator listedbelow. The configuration metadata for the HyperCells is delivered through theNoC. Configuration metadata for the other modules of orchestrator is delivereddirectly to the recipient module. These metadata transactions are presented infigure 3.Data Movement Unit: As seen in figure 3, the Data Movement Unit (DMU)is responsible for managing data transactions between the external memory andRHyMe’s memory. It is configured by the configuration unit such that fetch-ing data for computations and write-back to the external memory overlaps withcomputation. DMU Configuration corresponds to a set of load and store instruc-tions. The overlap in fetching operand data with computation is accomplished bydividing the address space of RHyMe’s memory into partitions. As mentioned insection 3.2, during execution of one HyperOp on the compute fabric, one parti-tion of the address space acts as operand storage for the active HyperOp and therest act as a prefetch buffer for subsequent HyperOp instances. Each partitionof RHyMe’s memory is free to be written into when its previous contents havebeen consumed. This is achieved through partition-by-partition synchronizationat the HyperOp Scheduler unit. The compilation flow is responsible for creatingappropriate configuration meta-data to perform the aforementioned activities.Runtime Parameter Computation Unit: Runtime Parameter ComputationUnit (RPCU) is responsible for computation of HyperCell’s runtime parameterslisted in section 3.1. The RPCU computes the runtime parameters for a suc-cessive instance of a HyperOp while HyperCells are busy computing previousinstances, thus amortizing the overheads of parameter computation. The run-time parameter computation is expressed as a sequence of ALU and branchoperations. The RPCU comprises a data-path that processes these instructions.Similar to the DMU, the RPCU works in synchrony with the HyperOp schedulerunit. The runtime parameters computed are forwarded to the HyperOp schedulerunit which in turn binds them to the compute fabric (see figure 3).HyperOp Scheduler Unit: HyperOp Scheduler Unit (HSU) is responsible forscheduling instances of a HyperOp onto the compute fabric for execution. HSUwaits for conditions listed previously to be met to trigger the execution of a newHyperOp or its instance on HyperCells. When all the HyperCells are free toexecute a new HyperOp instance, the scheduler unit binds a new set of runtimeparameters to HyperCells to enable execution of the instance.
4 Results
In this section, we present experimental results to demonstrate the effectivenessof the RHyMe architecture. HPC kernels from the Polybench benchmark suite[1] were employed in this evaluation. The kernels are from the domains of linear
8
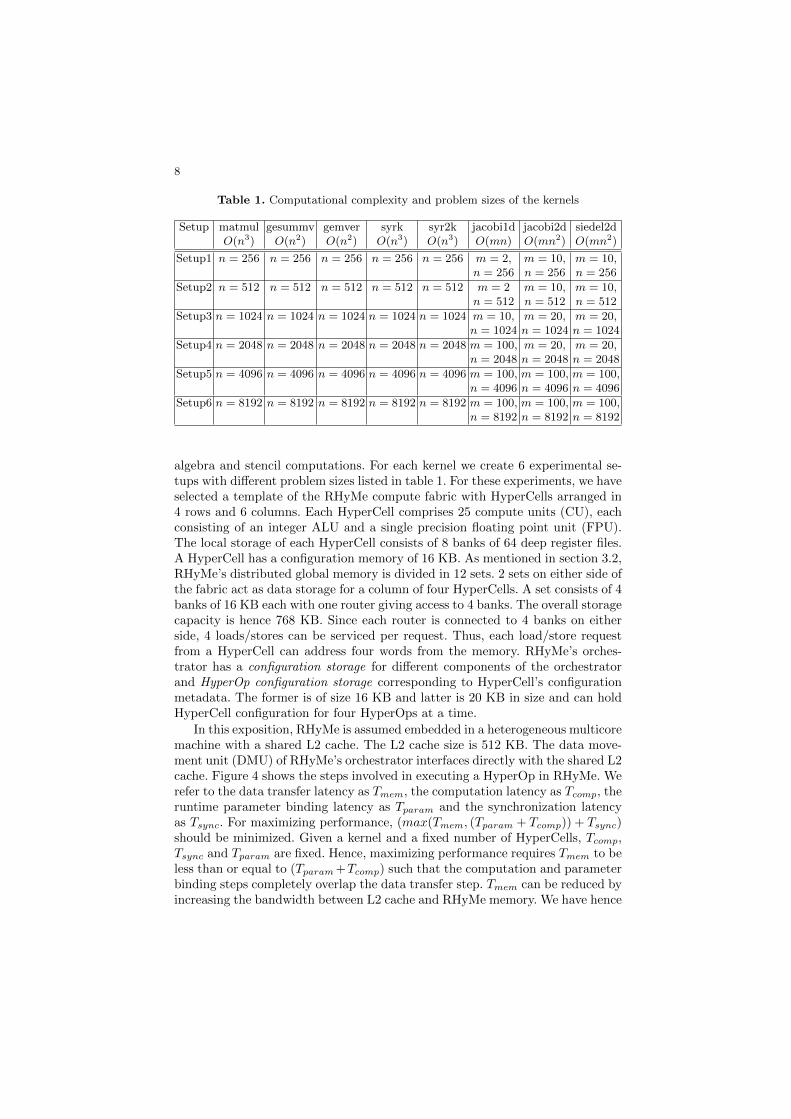
Table 1. Computational complexity and problem sizes of the kernels
Setup matmul gesummv gemver syrk syr2k jacobi1d jacobi2d siedel2dO(n3) O(n2) O(n2) O(n3) O(n3) O(mn) O(mn2) O(mn2)
Setup1 n = 256 n = 256 n = 256 n = 256 n = 256 m = 2, m = 10, m = 10,n = 256 n = 256 n = 256
Setup2 n = 512 n = 512 n = 512 n = 512 n = 512 m = 2 m = 10, m = 10,n = 512 n = 512 n = 512
Setup3 n = 1024 n = 1024 n = 1024 n = 1024 n = 1024 m = 10, m = 20, m = 20,n = 1024 n = 1024 n = 1024
Setup4 n = 2048 n = 2048 n = 2048 n = 2048 n = 2048 m = 100, m = 20, m = 20,n = 2048 n = 2048 n = 2048
Setup5 n = 4096 n = 4096 n = 4096 n = 4096 n = 4096 m = 100, m = 100, m = 100,n = 4096 n = 4096 n = 4096
Setup6 n = 8192 n = 8192 n = 8192 n = 8192 n = 8192 m = 100, m = 100, m = 100,n = 8192 n = 8192 n = 8192
algebra and stencil computations. For each kernel we create 6 experimental se-tups with different problem sizes listed in table 1. For these experiments, we haveselected a template of the RHyMe compute fabric with HyperCells arranged in4 rows and 6 columns. Each HyperCell comprises 25 compute units (CU), eachconsisting of an integer ALU and a single precision floating point unit (FPU).The local storage of each HyperCell consists of 8 banks of 64 deep register files.A HyperCell has a configuration memory of 16 KB. As mentioned in section 3.2,RHyMe’s distributed global memory is divided in 12 sets. 2 sets on either side ofthe fabric act as data storage for a column of four HyperCells. A set consists of 4banks of 16 KB each with one router giving access to 4 banks. The overall storagecapacity is hence 768 KB. Since each router is connected to 4 banks on eitherside, 4 loads/stores can be serviced per request. Thus, each load/store requestfrom a HyperCell can address four words from the memory. RHyMe’s orches-trator has a configuration storage for different components of the orchestratorand HyperOp configuration storage corresponding to HyperCell’s configurationmetadata. The former is of size 16 KB and latter is 20 KB in size and can holdHyperCell configuration for four HyperOps at a time.
In this exposition, RHyMe is assumed embedded in a heterogeneous multicoremachine with a shared L2 cache. The L2 cache size is 512 KB. The data move-ment unit (DMU) of RHyMe’s orchestrator interfaces directly with the shared L2cache. Figure 4 shows the steps involved in executing a HyperOp in RHyMe. Werefer to the data transfer latency as Tmem, the computation latency as Tcomp, theruntime parameter binding latency as Tparam and the synchronization latencyas Tsync. For maximizing performance, (max(Tmem, (Tparam + Tcomp)) + Tsync)should be minimized. Given a kernel and a fixed number of HyperCells, Tcomp,Tsync and Tparam are fixed. Hence, maximizing performance requires Tmem to beless than or equal to (Tparam +Tcomp) such that the computation and parameterbinding steps completely overlap the data transfer step. Tmem can be reduced byincreasing the bandwidth between L2 cache and RHyMe memory. We have hence
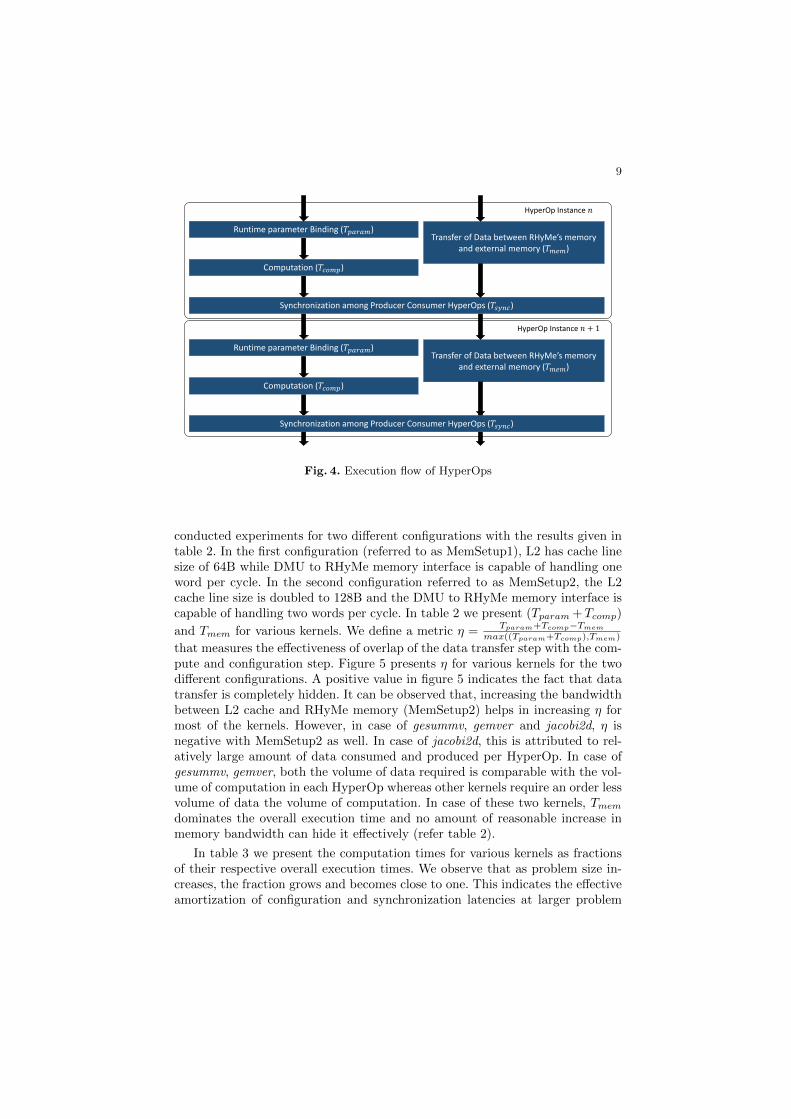
9
Runtime parameter Binding (𝑇𝑝𝑎𝑟𝑎𝑚)
Computation (𝑇𝑐𝑜𝑚𝑝)
Transfer of Data between RHyMe’s memory and external memory (𝑇𝑚𝑒𝑚)
Synchronization among Producer Consumer HyperOps (𝑇𝑠𝑦𝑛𝑐)
Runtime parameter Binding (𝑇𝑝𝑎𝑟𝑎𝑚)
Computation (𝑇𝑐𝑜𝑚𝑝)
Synchronization among Producer Consumer HyperOps (𝑇𝑠𝑦𝑛𝑐)
Transfer of Data between RHyMe’s memory and external memory (𝑇𝑚𝑒𝑚)
HyperOp Instance 𝑛
HyperOp Instance 𝑛 + 1
Fig. 4. Execution flow of HyperOps
conducted experiments for two different configurations with the results given intable 2. In the first configuration (referred to as MemSetup1), L2 has cache linesize of 64B while DMU to RHyMe memory interface is capable of handling oneword per cycle. In the second configuration referred to as MemSetup2, the L2cache line size is doubled to 128B and the DMU to RHyMe memory interface iscapable of handling two words per cycle. In table 2 we present (Tparam +Tcomp)
and Tmem for various kernels. We define a metric η =Tparam+Tcomp−Tmem
max((Tparam+Tcomp),Tmem)
that measures the effectiveness of overlap of the data transfer step with the com-pute and configuration step. Figure 5 presents η for various kernels for the twodifferent configurations. A positive value in figure 5 indicates the fact that datatransfer is completely hidden. It can be observed that, increasing the bandwidthbetween L2 cache and RHyMe memory (MemSetup2) helps in increasing η formost of the kernels. However, in case of gesummv, gemver and jacobi2d, η isnegative with MemSetup2 as well. In case of jacobi2d, this is attributed to rel-atively large amount of data consumed and produced per HyperOp. In case ofgesummv, gemver, both the volume of data required is comparable with the vol-ume of computation in each HyperOp whereas other kernels require an order lessvolume of data the volume of computation. In case of these two kernels, Tmem
dominates the overall execution time and no amount of reasonable increase inmemory bandwidth can hide it effectively (refer table 2).
In table 3 we present the computation times for various kernels as fractionsof their respective overall execution times. We observe that as problem size in-creases, the fraction grows and becomes close to one. This indicates the effectiveamortization of configuration and synchronization latencies at larger problem

10
Table 2. Comparison of computation vs memory transaction latencies (per HyperOp)for various kernels
Kernels Tcomp
Tmem Effectiveness of overlap ηMemSetup1 MemSetup2 MemSetup1 MemSetup2
matmul 5234 6447 3223 -0.188 0.384
gesummv 3990 92776 46388 -0.957 -0.914
gemver 5760 139137 69570 -0.959 -0.917
syrk 5234 5843 2935 -0.104 0.439
syr2k 2728 3710 1874 -0.265 0.313
jacobi1d 15402 164 84 0.989 0.994
jacobi2d 1596 4915 2497 -0.675 -0.361
siedel2d 15456 14745 7385 0.046 0.522
-1
-0.8
-0.6
-0.4
-0.2
0
0.2
0.4
0.6
0.8
1
MemSetup 1 MemSetup 2
Fig. 5. η for various kernels
Table 3. Computation time as fraction of overall execution time for different kernels
Problem matmul gesummv gemver syrk syr2k siedel jacobi jacobiSize 2d 1d 2d
MemSetup1
Setup1 0.86 0.798 0.798 0.853 0.919 0.799 0.489 0.667Setup2 0.971 0.888 0.856 0.969 0.981 0.895 0.735 0.75Setup3 0.993 0.969 0.96 0.992 0.993 0.984 0.575 0.909Setup4 0.996 0.989 0.985 0.996 0.994 0.995 0.436 0.973Setup5 0.997 0.997 0.996 0.997 0.995 0.999 0.436 0.998Setup6 0.997 0.999 0.999 0.997 0.995 0.999 0.436 0.999
MemSetup2
Setup1 0.907 0.799 0.798 0.916 0.948 0.806 0.324 0.667Setup2 0.982 0.887 0.856 0.982 0.985 0.944 0.581 0.75Setup3 0.994 0.969 0.959 0.994 0.992 0.991 0.575 0.927Setup4 0.996 0.989 0.985 0.996 0.993 0.997 0.599 0.979Setup5 0.996 0.997 0.996 0.996 0.993 0.999 0.605 0.999Setup6 0.996 0.999 0.999 0.996 0.993 0.999 0.605 0.999

11
MATMUL SYRK SYR2K SIEDEL-2D JACOBI-1D JACOBI-2D
0
0.2
0.4
0.6
0.8
1
GESUMMV GEMVER
0
0.002
0.004
0.006
0.008
MATMUL SYRK SYR2K SIEDEL-2D JACOBI-1D JACOBI-2D
0
0.2
0.4
0.6
0.8
1
Setup - 1 Setup - 2 Setup - 3 Setup - 4 Setup - 5 Setup - 6
GESUMMV GEMVER
0
0.002
0.004
0.006
0.008
MemSetup 1MemSetup 1
MemSetup 2 MemSetup 2
Fig. 6. Efficiency of execution for various kernels on RHyMe. gesummv and gemverplotted separately due to order of magnitude difference in efficiency
sizes. This can be attributed to improvement in temporal utilization of the re-sources in compute fabric of RHyMe with increase in problem size. An exceptionto this trend is jacobi1d. In case of jacobi1d, even for the larger problem sizes(setup 4, 5 and 6), the amount of computation involved is not large enough toeffectively amortize configuration overheads. Hence we observe a significant con-figuration overhead for jacobi1d. For any given kernel, efficiency is measured asthe ratio of actual performance of the kernel on RHyMe and theoretical peakperformance. Actual performance is affected by various architectural artifacts ofRHyMe such as NoC bandwidth, RHyMe memory bandwidth, HyperCell’s localstorage bandwidth. While measuring peak performance we simply consider theparallelism available in each kernel and the number of basic operations that canbe executed in parallel.
The efficiency for various kernels with the experimental setups in table 1 canbe seen in figure 6. With increasing problem sizes, efficiency increases since con-figuration and synchronization overheads are more effectively amortized (referto table 3). As mentioned previously, in case of gesummv and gemver, the over-whelming dominance of data transfer latency leads to less than 1% efficiency.For the other kernels, we achieve efficiencies ranging from 14% to 40% with largeproblem sizes.
Table 4 lists the performance for different kernels for largest problem sizes(Setup6) in terms of Giga Floating Point Operations per Second (GFLOPS)at 500MHz operating frequency. The table also presents the improvement inperformance achieved by increasing the bandwidth between external L2 andRHyMe’s memory. Against a theoretical peak performance of 300 GFLOPs, for

12
most kernels we achieve performance ranging from 42 to 136 GFLOPS. Due tothe reasons mentioned previously, gesummv and gemver show upto 2 GFLOPSperformance and are unsuitable for execution on RHyMe platform.
Table 4. Performance of various kernels on RHyMe measured at two different config-urations: MemSetup1 & MemSetup2
KernelsPerformance in GFLOPS
% IncreaseMemSetup1 MemSetup2
matmul 86.104 105.035 21.986
gesummv 0.941 1.882 99.957
gemver 1.141 2.281 99.968
syrk 122.522 136.259 11.212
syr2k 100.363 135.081 34.592
jacobi1d 42.125 42.126 0.0026
jacobi2d 111.790 155.152 38.788
siedel2d 61.901 61.918 0.028
5 Conclusion
In this paper we presented the architectural details of REDEFINE HyperCellMulticore (RHyMe). RHyMe is a data-driven coarse-grain reconfigurable archi-tecture designed for fast execution of loops in HPC applications. RHyMe fa-cilitates exploitation of spatial and temporal parallelism. The CEs of RHyMeaka HyperCells offer reconfigurable data-path for realizing MIMO operationsand alleviate the fetch-decode overheads of a fine-grain instruction processingmachine. HyperCell’s reconfigurable data-path offers the ability to exploit highdegree of fine-grain parallelism while the controller of HyperCell enables ex-ploiting pipeline parallelism. Multitude of HyperCells that can communicatewith each other directly enable creation of large computation pipelines. RHyMeemploys a lightweight configuration, scheduling and synchronization mechanismwith minimal runtime overheads as is evident from the results presented.
References
1. Polybench: Polyhedral benchmark. www.cs.ucla.edu/pouchet/software/polybench/
2. Alle, M., Varadarajan, K., Fell, A., Reddy, C.R., Nimmy, J., Das, S., Biswas,P., Chetia, J., Rao, A., Nandy, S.K., Narayan, R.: REDEFINE: Runtime recon-figurable polymorphic ASIC. ACM Trans. Embedded Comput. Syst 9(2) (2009),http://doi.acm.org/10.1145/1596543.1596545
3. Brewer, T.M.: Instruction set innovations for the convey HC-1 computer. IEEE Mi-cro 30(2), 70–79 (2010), http://doi.ieeecomputersociety.org/10.1109/MM.2010.36

13
4. Burger, D., Keckler, S., McKinley, K., Dahlin, M., John, L., Lin, C., Moore, C.,Burrill, J., McDonald, R., Yoder, W.: Scaling to the end of silicon with edge ar-chitectures. Computer 37(7), 44–55 (July 2004)
5. Das, S., Madhu, K., Krishna, M., Sivanandan, N., Merchant, F., Natarajan, S.,Biswas, I., Pulli, A., Nandy, S., Narayan, R.: A framework for post-silicon realiza-tion of arbitrary instruction extensions on reconfigurable data-paths. Journal ofSystems Architecture 60(7), 592–614 (2014)
6. Fell, A., Biswas, P., Chetia, J., Nandy, S.K., Narayan, R.: Generic routingrules and a scalable access enhancement for the network-on-chip RECON-NECT. In: Annual IEEE International SoC Conference, SoCC 2009, Septem-ber 9-11, 2009, Belfast, Northern Ireland, UK, Proceedings. pp. 251–254 (2009),http://dx.doi.org/10.1109/SOCCON.2009.5398048
7. Govindaraju, V., Ho, C.H., Sankaralingam, K.: Dynamically specialized datapathsfor energy efficient computing. In: HPCA. pp. 503–514. IEEE Computer Society(2011), http://dx.doi.org/10.1109/HPCA.2011.5749755
8. Madhu, K.T., Das, S., Krishna, M., Sivanandan, N., Nandy, S.K., Narayan, R.:Synthesis of instruction extensions on hypercell, a reconfigurable datapath. In:Embedded Computer Systems: Architectures, Modeling, and Simulation (SAMOSXIV), 2014 International Conference on. pp. 215–224. IEEE (2014)
9. Madhu, K.T., Das, S., Nalesh, S., Nandy, S.K., Narayan, R.: Compiling HPCkernels for the REDEFINE CGRA. In: 17th IEEE International Conferenceon High Performance Computing and Communications, HPCC 2015, 7th IEEEInternational Symposium on Cyberspace Safety and Security, CSS 2015, and12th IEEE International Conference on Embedded Software and Systems,ICESS 2015, New York, NY, USA, August 24-26, 2015. pp. 405–410 (2015),http://dx.doi.org/10.1109/HPCC-CSS-ICESS.2015.139
10. Noori, H., Mehdipour, F., Inoue, K., Murakami, K.: Improving performanceand energy efficiency of embedded processors via post-fabrication instruc-tion set customization. The Journal of Supercomputing 60(2), 196–222 (2012),http://dx.doi.org/10.1007/s11227-010-0505-0
11. Rau, B.R.: Compiling hpc kernels for the redefine cgra. In: Proceedings of the27th annual international symposium on Microarchitecture. pp. 63–74. MICRO 27,ACM, New York, NY, USA (1994), http://doi.acm.org/10.1145/192724.192731
12. Shami, M., Hemani, A.: Partially reconfigurable interconnection network for dy-namically reprogrammable resource array. In: ASIC, 2009. ASICON ’09. IEEE 8thInternational Conference on. pp. 122–125 (2009)
13. Vassiliadis, S., Wong, S., Gaydadjiev, G., Bertels, K., Kuzmanov, G., Panainte,E.M.: The MOLEN polymorphic processor. IEEE Trans. Computers 53(11), 1363–1375 (2004), http://doi.ieeecomputersociety.org/10.1109/TC.2004.104

Project Beehive: A Hardware/SoftwareCo-designed Stack for Runtime and
Architectural Research
Christos Kotselidis, Andrey Rodchenko, Colin Barrett, Andy Nisbet, JohnMawer, Will Toms, James Clarkson, Cosmin Gorgovan, Amanieu d’Antras,Yaman Cakmakci, Thanos Stratikopoulos, Sebastian Werner, Jim Garside,
Javier Navaridas, Antoniu Pop, John Goodacre, and Mikel Lujan
Advanced Processor Technologies GroupThe University of Manchester,[email protected]
Abstract. The end of Dennard scaling combined with stagnation in ar-chitectural and compiler optimizations makes it challenging to achievesignificant performance deltas. Solutions based solely in hardware or soft-ware are no longer sufficient to maintain the pace of improvements seenduring the past few decades. In hardware, the end of single-core scal-ing resulted in the proliferation of multi-core system architectures, how-ever this has forced complex parallel programming techniques into themainstream. To further exploit physical resources, systems are becom-ing increasingly heterogeneous with specialized computing elements andaccelerators. Programming across a range of disparate architectures re-quires a new level of abstraction that programming languages will haveto adapt to. In software, emerging complex applications, from domainssuch as Big Data and computer vision, run on multi-layered softwarestacks targeting hardware with a variety of constraints and resources.Hence, optimizing for the power-performance (and resiliency) space re-quires experimentation platforms that offer quick and easy prototypingof hardware/software co-designed techniques. To that end, we presentProject Beehive: A Hardware/Software co-designed stack for runtimeand architectural research. Project Beehive utilizes various state-of-the-art software and hardware components along with novel and extensi-ble co-design techniques. The objective of Project Beehive is to providea modern platform for experimentation on emerging applications, pro-gramming languages, compilers, runtimes, and low-power heterogeneousmany-core architectures in a full-system co-designed manner.
1 Introduction
Traditionally, software and hardware providers have been delivering significantperformance improvements on a yearly basis. Unfortunately, this is beginningto change. Predictions about “dark silicon” [2] and resiliency, especially in theforthcoming exascale era [1], suggest the traditional approaches to computing
2
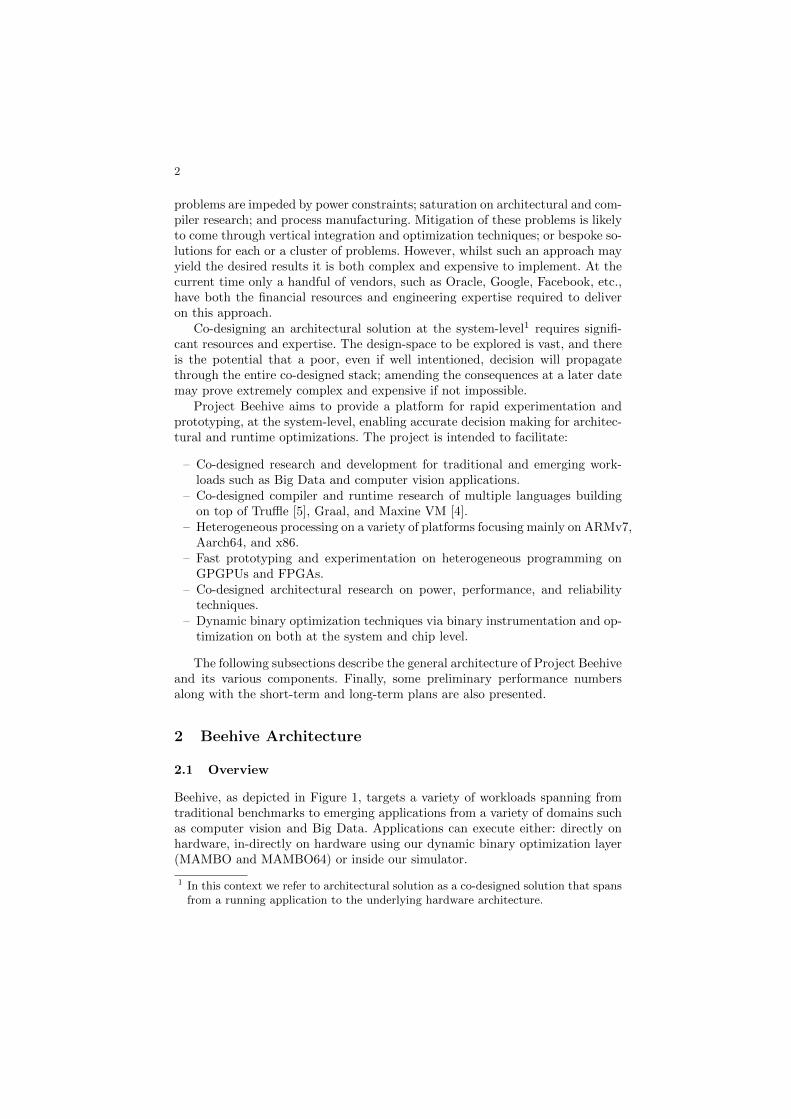
problems are impeded by power constraints; saturation on architectural and com-piler research; and process manufacturing. Mitigation of these problems is likelyto come through vertical integration and optimization techniques; or bespoke so-lutions for each or a cluster of problems. However, whilst such an approach mayyield the desired results it is both complex and expensive to implement. At thecurrent time only a handful of vendors, such as Oracle, Google, Facebook, etc.,have both the financial resources and engineering expertise required to deliveron this approach.
Co-designing an architectural solution at the system-level1 requires signifi-cant resources and expertise. The design-space to be explored is vast, and thereis the potential that a poor, even if well intentioned, decision will propagatethrough the entire co-designed stack; amending the consequences at a later datemay prove extremely complex and expensive if not impossible.
Project Beehive aims to provide a platform for rapid experimentation andprototyping, at the system-level, enabling accurate decision making for architec-tural and runtime optimizations. The project is intended to facilitate:
– Co-designed research and development for traditional and emerging work-loads such as Big Data and computer vision applications.
– Co-designed compiler and runtime research of multiple languages buildingon top of Truffle [5], Graal, and Maxine VM [4].
– Heterogeneous processing on a variety of platforms focusing mainly on ARMv7,Aarch64, and x86.
– Fast prototyping and experimentation on heterogeneous programming onGPGPUs and FPGAs.
– Co-designed architectural research on power, performance, and reliabilitytechniques.
– Dynamic binary optimization techniques via binary instrumentation and op-timization on both at the system and chip level.
The following subsections describe the general architecture of Project Beehiveand its various components. Finally, some preliminary performance numbersalong with the short-term and long-term plans are also presented.
2 Beehive Architecture
2.1 Overview
Beehive, as depicted in Figure 1, targets a variety of workloads spanning fromtraditional benchmarks to emerging applications from a variety of domains suchas computer vision and Big Data. Applications can execute either: directly onhardware, in-directly on hardware using our dynamic binary optimization layer(MAMBO and MAMBO64) or inside our simulator.
1 In this context we refer to architectural solution as a co-designed solution that spansfrom a running application to the underlying hardware architecture.
3
Heterogeneous Architectures
Aarch64
Maxine VM
Truffle
Graal
T1XMemory Manager
(GC)
JACCJava
Accelerator(PTX, OpenCL)
Operating System and Beehive Drivers (PIN, MAMBO PIN)
ARMv7
x86
GPUSFPGAs
VPUs ASICs
Traditional Benchmarking (SpecJVM, Dacapo, etc.)
Computer Vision SLAM Applications Big Data
Applications (Spark, Flink, Hadoop, etc.)
DSLs (LLVM IR, etc.)
Full System Co-design
Resiliency
Po
wer
Per
form
ance Native Applications
Simulators
McPAT Power Simulator
Hotspot Thermal Simulator
Cacti
NVSim
GEM5 Full System Simulator
Beehive Services (MAMBO Dynamic Binary Optimizer)
ISA extensions
Ap
plic
atio
ns
Ru
nti
me
Lay
er
Emulated Architectures
MAMBODynamic Binary
Translator
Compute Platform
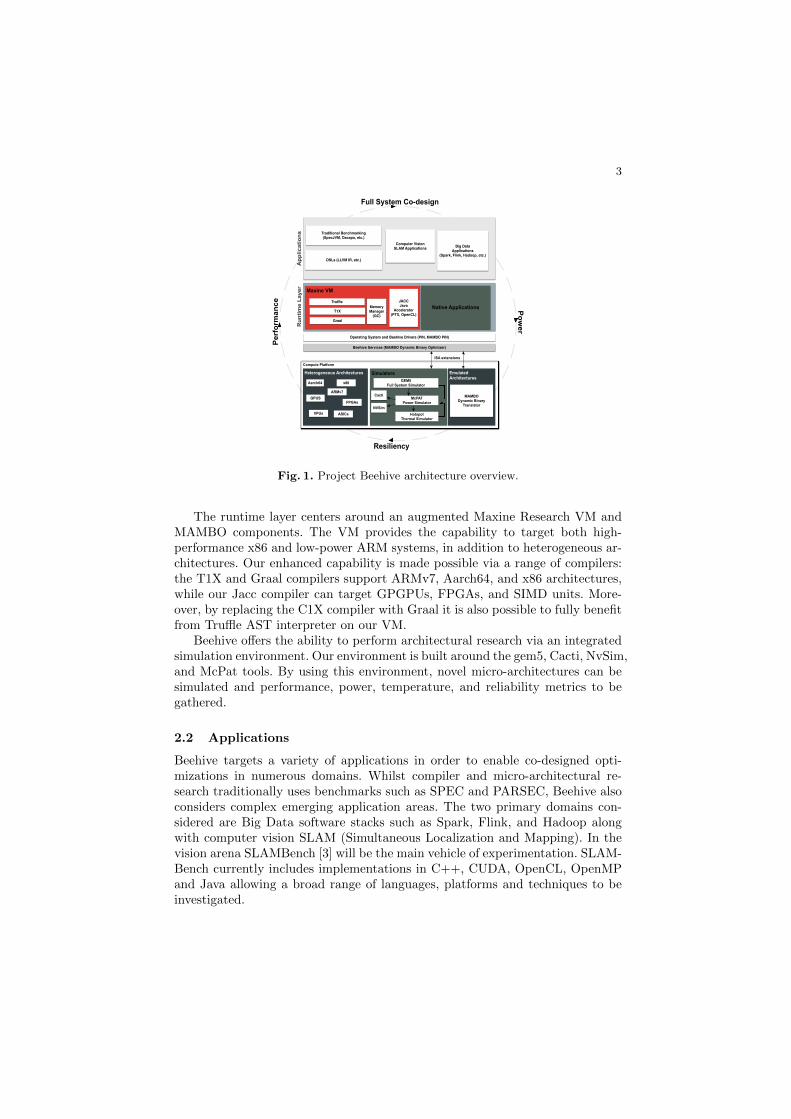
Fig. 1. Project Beehive architecture overview.
The runtime layer centers around an augmented Maxine Research VM andMAMBO components. The VM provides the capability to target both high-performance x86 and low-power ARM systems, in addition to heterogeneous ar-chitectures. Our enhanced capability is made possible via a range of compilers:the T1X and Graal compilers support ARMv7, Aarch64, and x86 architectures,while our Jacc compiler can target GPGPUs, FPGAs, and SIMD units. More-over, by replacing the C1X compiler with Graal it is also possible to fully benefitfrom Truffle AST interpreter on our VM.
Beehive offers the ability to perform architectural research via an integratedsimulation environment. Our environment is built around the gem5, Cacti, NvSim,and McPat tools. By using this environment, novel micro-architectures can besimulated and performance, power, temperature, and reliability metrics to begathered.
2.2 Applications
Beehive targets a variety of applications in order to enable co-designed opti-mizations in numerous domains. Whilst compiler and micro-architectural re-search traditionally uses benchmarks such as SPEC and PARSEC, Beehive alsoconsiders complex emerging application areas. The two primary domains con-sidered are Big Data software stacks such as Spark, Flink, and Hadoop alongwith computer vision SLAM (Simultaneous Localization and Mapping). In thevision arena SLAMBench [3] will be the main vehicle of experimentation. SLAM-Bench currently includes implementations in C++, CUDA, OpenCL, OpenMPand Java allowing a broad range of languages, platforms and techniques to beinvestigated.
4
2.3 Runtime Layer
Some of the key features of Beehive are found in its runtime layer, which pro-vides capability beyond simply running native applications. For instance, ourMAMBO64 component is able to translate ARMv7 binaries into Aarch64 in-structions at runtime, whilst MAMBO enables binary translation/optimizationin a manner similar to PIN 2.
Despite being able to execute native C/C++ applications, Beehive has beendesigned to target languages that utilize a managed runtime system. Our man-aged runtime system is based on the Maxine Research VM which has beenaugmented with a selection of state-of-the-art components. For example, wehave properly integrated and increased the stability of both the template, T1X,compiler and the Graal compiler which also allows Project Beehive to utilize theTruffle AST interpreter. Moreover, this work has required us to undertake exten-sive infrastructure work to allow us to easily downstream the Graal and Trufflecode bases in order to provide Beehive with the state-of-the-art components ona regular basis.
The VM is designed to enable execution across a range of hardware con-figurations. To that end, we introduce support for low-power ARM systems,by extending the T1X and Graal compilers to support both the ARMv7 andAarch64 architectures, along with continuing the existing x86 support. Addi-tionally, the VM supports heterogeneous execution via the Jacc (Java acceler-ator) framework. By annotating source code using Jacc’s API, which is similarto OpenMP/OpenAcc, it is possible to execute performance critical code onspecialized hardware such as GPGPUs and FPGAs.
Regarding the memory manager (GC), various options are being exploredranging from enhancing Maxine VM’s current GC algorithms to porting existingstate-of-the-art memory management components.
2.4 Hardware Layer
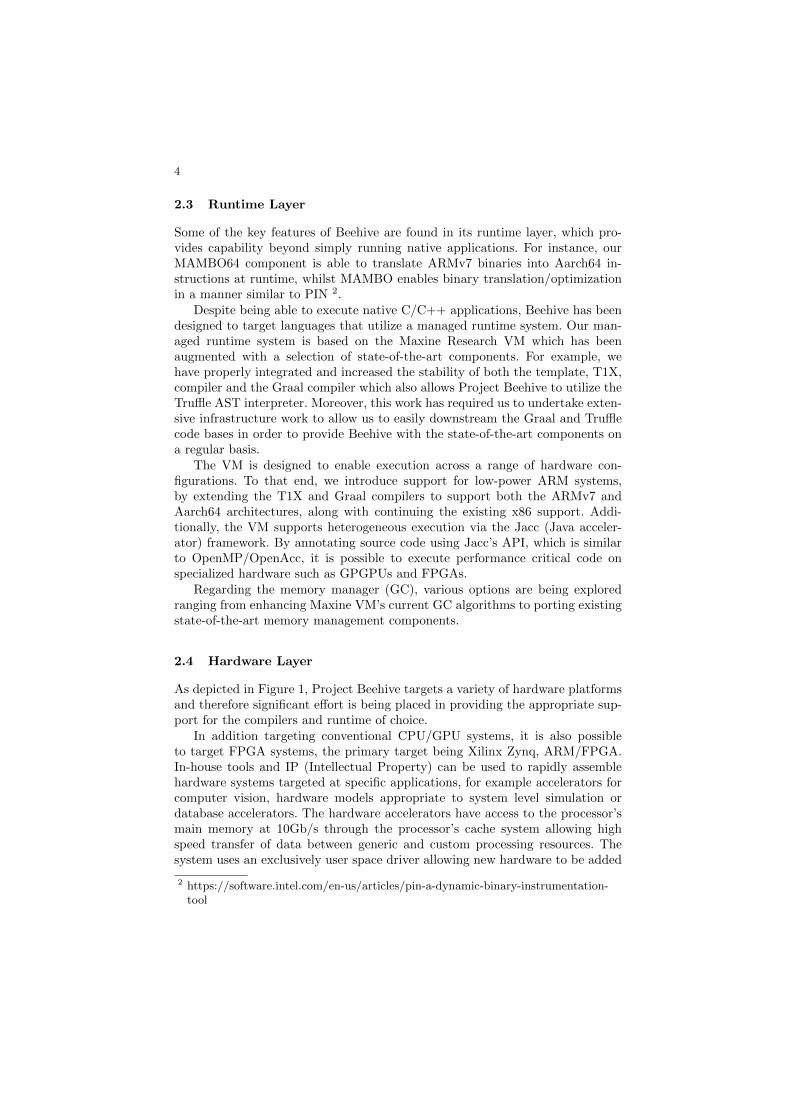
As depicted in Figure 1, Project Beehive targets a variety of hardware platformsand therefore significant effort is being placed in providing the appropriate sup-port for the compilers and runtime of choice.
In addition targeting conventional CPU/GPU systems, it is also possibleto target FPGA systems, the primary target being Xilinx Zynq, ARM/FPGA.In-house tools and IP (Intellectual Property) can be used to rapidly assemblehardware systems targeted at specific applications, for example accelerators forcomputer vision, hardware models appropriate to system level simulation ordatabase accelerators. The hardware accelerators have access to the processor’smain memory at 10Gb/s through the processor’s cache system allowing highspeed transfer of data between generic and custom processing resources. Thesystem uses an exclusively user space driver allowing new hardware to be added
2 https://software.intel.com/en-us/articles/pin-a-dynamic-binary-instrumentation-tool
5
and easily linked to runtimes or binary translators. Using the Zynq’s ARM pro-cessors it is possible to identify IP blocks currently configured on the FPGAand if necessary reconfigure it, whilst applications continue running on the hostARM device. This allows a runtime to dynamically tune its hardware resourcesto match its power/performance requirements.
Typical examples of the hardware layer in use might include preprocessingimage data in SLAMBench; integrating with MAMBO’s dynamic binary instru-mentation to provide high performance memory system simulation, using ourmemory system IP; or providing a small low power micro-controller which mightbe used for some runtime housekeeping task.
geomean
avrorabatik
fop h2 jythonluindex
lusearch
pmdsunflow
tomcat
tradebeans
tradesoap
xalan
Hotspot-C2-Current Hotspot-Graal-Current Maxine-Graal-Original Maxine-Graal-Current
0%
25%
50%
75%
100%
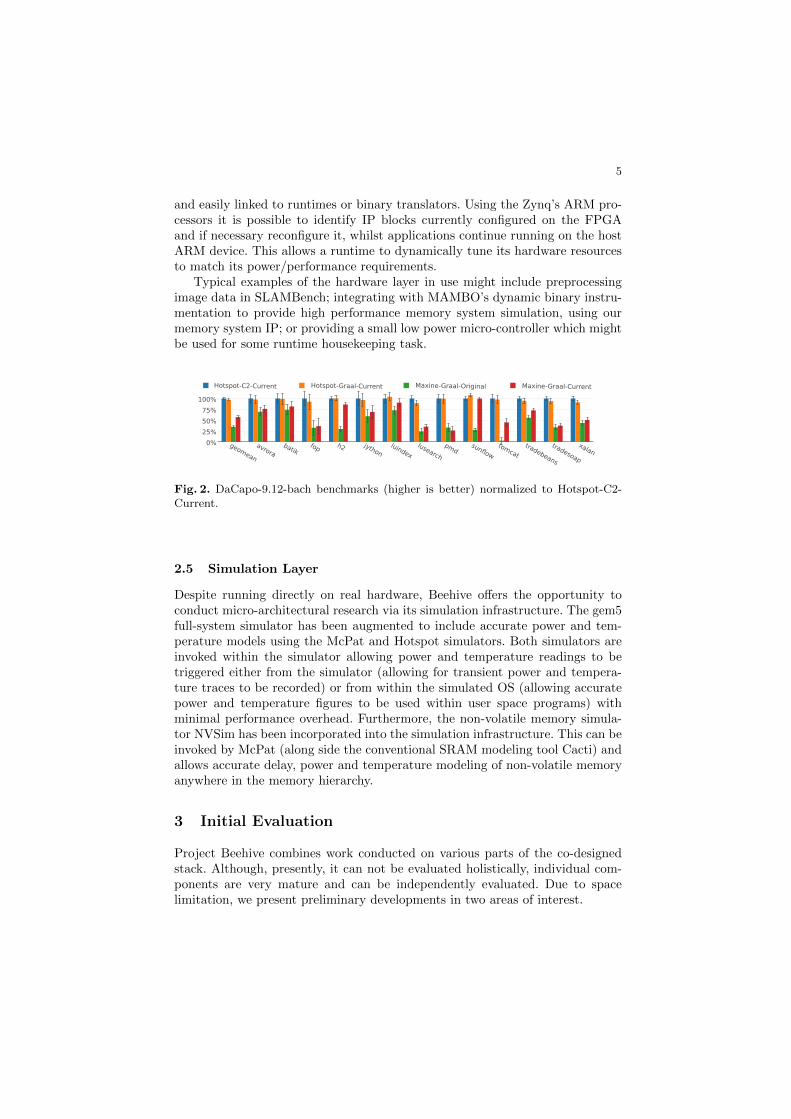
Fig. 2. DaCapo-9.12-bach benchmarks (higher is better) normalized to Hotspot-C2-Current.
2.5 Simulation Layer
Despite running directly on real hardware, Beehive offers the opportunity toconduct micro-architectural research via its simulation infrastructure. The gem5full-system simulator has been augmented to include accurate power and tem-perature models using the McPat and Hotspot simulators. Both simulators areinvoked within the simulator allowing power and temperature readings to betriggered either from the simulator (allowing for transient power and tempera-ture traces to be recorded) or from within the simulated OS (allowing accuratepower and temperature figures to be used within user space programs) withminimal performance overhead. Furthermore, the non-volatile memory simula-tor NVSim has been incorporated into the simulation infrastructure. This can beinvoked by McPat (along side the conventional SRAM modeling tool Cacti) andallows accurate delay, power and temperature modeling of non-volatile memoryanywhere in the memory hierarchy.
3 Initial Evaluation
Project Beehive combines work conducted on various parts of the co-designedstack. Although, presently, it can not be evaluated holistically, individual com-ponents are very mature and can be independently evaluated. Due to spacelimitation, we present preliminary developments in two areas of interest.
6
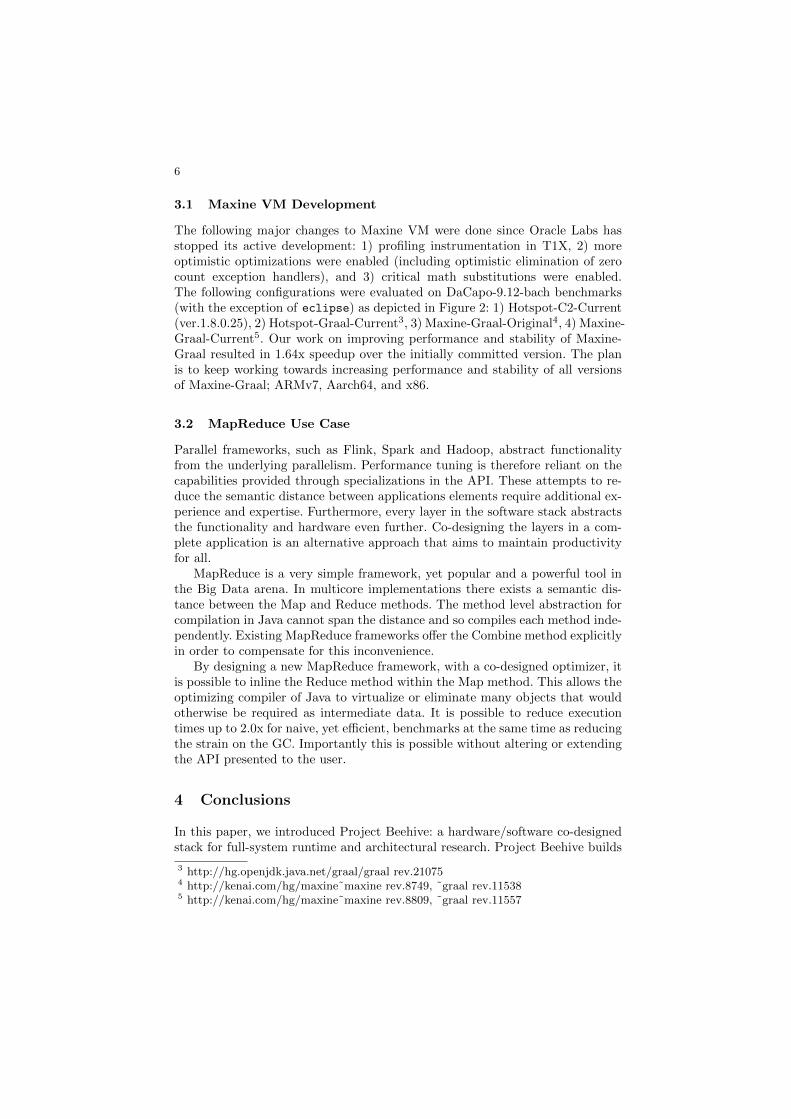
3.1 Maxine VM Development
The following major changes to Maxine VM were done since Oracle Labs hasstopped its active development: 1) profiling instrumentation in T1X, 2) moreoptimistic optimizations were enabled (including optimistic elimination of zerocount exception handlers), and 3) critical math substitutions were enabled.The following configurations were evaluated on DaCapo-9.12-bach benchmarks(with the exception of eclipse) as depicted in Figure 2: 1) Hotspot-C2-Current(ver.1.8.0.25), 2) Hotspot-Graal-Current3, 3) Maxine-Graal-Original4, 4) Maxine-Graal-Current5. Our work on improving performance and stability of Maxine-Graal resulted in 1.64x speedup over the initially committed version. The planis to keep working towards increasing performance and stability of all versionsof Maxine-Graal; ARMv7, Aarch64, and x86.
3.2 MapReduce Use Case
Parallel frameworks, such as Flink, Spark and Hadoop, abstract functionalityfrom the underlying parallelism. Performance tuning is therefore reliant on thecapabilities provided through specializations in the API. These attempts to re-duce the semantic distance between applications elements require additional ex-perience and expertise. Furthermore, every layer in the software stack abstractsthe functionality and hardware even further. Co-designing the layers in a com-plete application is an alternative approach that aims to maintain productivityfor all.
MapReduce is a very simple framework, yet popular and a powerful tool inthe Big Data arena. In multicore implementations there exists a semantic dis-tance between the Map and Reduce methods. The method level abstraction forcompilation in Java cannot span the distance and so compiles each method inde-pendently. Existing MapReduce frameworks offer the Combine method explicitlyin order to compensate for this inconvenience.
By designing a new MapReduce framework, with a co-designed optimizer, itis possible to inline the Reduce method within the Map method. This allows theoptimizing compiler of Java to virtualize or eliminate many objects that wouldotherwise be required as intermediate data. It is possible to reduce executiontimes up to 2.0x for naive, yet efficient, benchmarks at the same time as reducingthe strain on the GC. Importantly this is possible without altering or extendingthe API presented to the user.
4 Conclusions
In this paper, we introduced Project Beehive: a hardware/software co-designedstack for full-system runtime and architectural research. Project Beehive builds
3 http://hg.openjdk.java.net/graal/graal rev.210754 http://kenai.com/hg/maxine˜maxine rev.8749, ˜graal rev.115385 http://kenai.com/hg/maxine˜maxine rev.8809, ˜graal rev.11557

7
on top of existing state-of-the-art as well as novel components at all layers ofthe stack. The short-term plans are to complete the ARMv7 and Aarch64 portsof T1X and Graal compilers, while increasing confidence by achieving a highapplication coverage, along with establishing a high-performing GC framework.
Our vision regarding Project Beehive is to unify the platform capabilitiesunder a semantically aware runtime increasing developer productivity. Further-more, we plan on defining a hybrid ISA between emulated and hardware ca-pabilities in order to provide a roadmap of movement of capabilities betweenabstractions offered in software that later are offered in hardware. Finally, weplan to work on new hardware services for scale out and representation of volatileand non-volatile communication services in order to provide a consistent view ofplatform capabilities across heterogeneous processors.
Acknowledgement. The research leading to these results has receivedfunding from UK EPSRC grants DOME EP/J016330/1, AnyScale AppsEP/L000725/1, INPUT EP/K015699/1 and PAMELA EP/K008730/1and the European Union’s Seventh Framework Programme under grantagreement n 318633 AXLE project, and n 619788 RETHINK big. MikelLujan is funded by a Royal Society University Research Fellowship andAntoniu Pop a Royal Academy of Engineering Research Fellowship.
References
1. Cappello, F., Geist, A., Gropp, B., Kale, L., Kramer, B., Snir, M.: Toward exascaleresilience (November 2009)
2. Esmaeilzadeh, H., Blem, E., St. Amant, R., Sankaralingam, K., Burger, D.: Darksilicon and the end of multicore scaling. In: ISCA ’11 (2011)
3. Nardi, L., Bodin, B., Zia, M.Z., Mawer, J., Nisbet, A., Kelly, P.H.J., Davison,A.J., Lujan, M., O’Boyle, M.F.P., Riley, G., Topham, N., Furber, S.: IntroducingSLAMBench, a performance and accuracy benchmarking methodology for SLAM.In: ICRA (2015)
4. Wimmer, C., Haupt, M., Van De Vanter, M.L., Jordan, M., Daynes, L., Simon, D.:Maxine: An approachable virtual machine for, and in, java (January 2013)
5. Wurthinger, T., Wimmer, C., Woß, A., Stadler, L., Duboscq, G., Humer, C.,Richards, G., Simon, D., Wolczko, M.: One vm to rule them all. In: Proceedingsof the 2013 ACM International Symposium on New Ideas, New Paradigms, andReflections on Programming & Software. Onward! ’13 (2013)

Position Paper: Reaching intrinsic computeefficiency requires adaptable micro-architectures
Mark Wijtvliet, Luc Waeijen, Michael Adriaansen, and Henk Corporaal
Eindhoven University of Technology, 5612 AZ, The Netherlands,{m.wijtvliet, l.j.w.waeijen, h.corporaal}@tue.nl &
Abstract. Today’s embedded applications demand high compute per-formance at a tight energy budget, which requires a high compute effi-ciency. Compute efficiency is upper-bound by the technology node, how-ever in practice programmable devices are orders of magnitude awayfrom achieving this intrinsic compute efficiency. This work investigatesthe sources of inefficiency that cause this, and identifies four key designguidelines that can steer compute efficiency towards sub-picojoule peroperation. Based on these guidelines a novel architecture with adaptivemicro-architecture, and accompanying tool flow is proposed.
Keywords: adaptive micro-architecture, intrinsic compute efficiency,spatial layout
1 Introduction
Modern embedded applications require a high computational performance undersevere energy constraints. Mobile phones, for example, have to implement the4G protocol, which has a workload of about 1000 GOPS [11]. Due to batterycapacity limitations, the computation on a mobile phone has a budget of about1 Watt. Thus, under these requirement, each computational operation can onlyuse 1pJ of energy. Another example is ambulatory healthcare monitoring, wherea patients’ vital signs are monitored over an extended period of time. Becausethese devices have to be mobile and small, energy is very limited. An addedconstraint is that the compute platform has to be programmable, as the fieldof ambulatory healthcare is still developing, and improved algorithms and newapplications are developed at a fast rate.
To support such embedded applications, a computational operation has anenergy budget in the sub-pico joule domain. However, current programmabledevices do not have a high enough compute efficiency to meet this requirement.One of the most compute efficient microprocessors, the ARM Cortex-M0, has ancompute efficiency of 5.1pJ/op at 40nm low-power technology [8]. The intrinsiccompute efficiency (ICE) of 45nm technology is 1pJ/op [6]. There is thus a gapbetween the ICE and the achieved efficiency of at least a factor 5. However,to support compute intensive embedded applications, processors more powerfulthan the Cortex-M0 are needed, which increases the gap up to several orders of
2
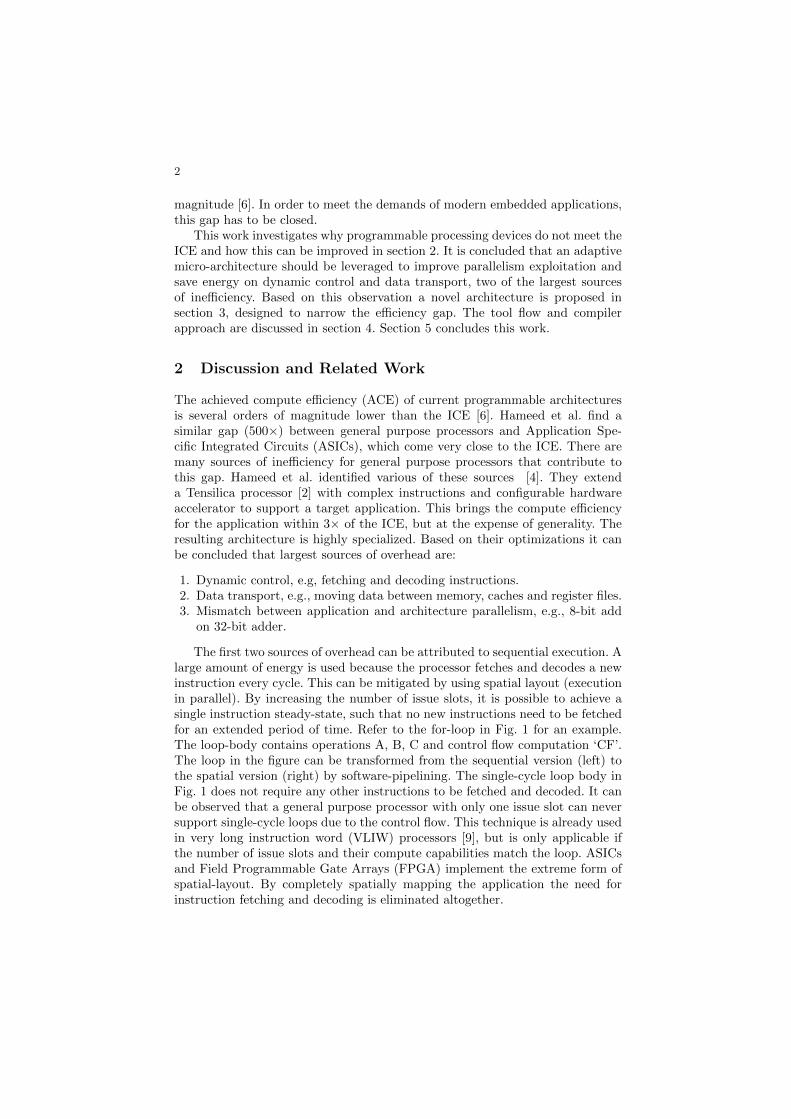
magnitude [6]. In order to meet the demands of modern embedded applications,this gap has to be closed.
This work investigates why programmable processing devices do not meet theICE and how this can be improved in section 2. It is concluded that an adaptivemicro-architecture should be leveraged to improve parallelism exploitation andsave energy on dynamic control and data transport, two of the largest sourcesof inefficiency. Based on this observation a novel architecture is proposed insection 3, designed to narrow the efficiency gap. The tool flow and compilerapproach are discussed in section 4. Section 5 concludes this work.
2 Discussion and Related Work
The achieved compute efficiency (ACE) of current programmable architecturesis several orders of magnitude lower than the ICE [6]. Hameed et al. find asimilar gap (500×) between general purpose processors and Application Spe-cific Integrated Circuits (ASICs), which come very close to the ICE. There aremany sources of inefficiency for general purpose processors that contribute tothis gap. Hameed et al. identified various of these sources [4]. They extenda Tensilica processor [2] with complex instructions and configurable hardwareaccelerator to support a target application. This brings the compute efficiencyfor the application within 3× of the ICE, but at the expense of generality. Theresulting architecture is highly specialized. Based on their optimizations it canbe concluded that largest sources of overhead are:
1. Dynamic control, e.g, fetching and decoding instructions.2. Data transport, e.g., moving data between memory, caches and register files.3. Mismatch between application and architecture parallelism, e.g., 8-bit add
on 32-bit adder.
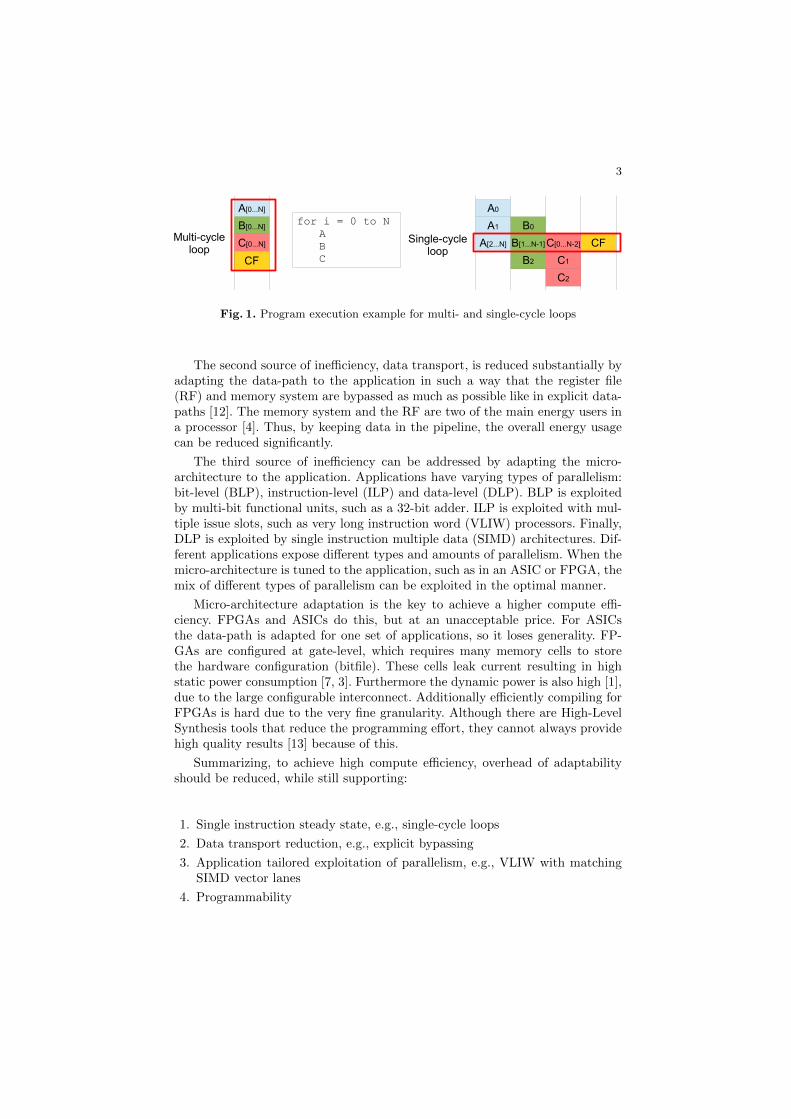
The first two sources of overhead can be attributed to sequential execution. Alarge amount of energy is used because the processor fetches and decodes a newinstruction every cycle. This can be mitigated by using spatial layout (executionin parallel). By increasing the number of issue slots, it is possible to achieve asingle instruction steady-state, such that no new instructions need to be fetchedfor an extended period of time. Refer to the for-loop in Fig. 1 for an example.The loop-body contains operations A, B, C and control flow computation ‘CF’.The loop in the figure can be transformed from the sequential version (left) tothe spatial version (right) by software-pipelining. The single-cycle loop body inFig. 1 does not require any other instructions to be fetched and decoded. It canbe observed that a general purpose processor with only one issue slot can neversupport single-cycle loops due to the control flow. This technique is already usedin very long instruction word (VLIW) processors [9], but is only applicable ifthe number of issue slots and their compute capabilities match the loop. ASICsand Field Programmable Gate Arrays (FPGA) implement the extreme form ofspatial-layout. By completely spatially mapping the application the need forinstruction fetching and decoding is eliminated altogether.
3
CF
for i = 0 to N
A
B
C
A0
A1
A[2...N]
B0
B[1...N-1]
B2
C[0...N-2]
C1
C2
Single-cycleloop
CF
A[0...N]
B[0...N]
C[0...N]Multi-cycleloop
Fig. 1. Program execution example for multi- and single-cycle loops
The second source of inefficiency, data transport, is reduced substantially byadapting the data-path to the application in such a way that the register file(RF) and memory system are bypassed as much as possible like in explicit data-paths [12]. The memory system and the RF are two of the main energy users ina processor [4]. Thus, by keeping data in the pipeline, the overall energy usagecan be reduced significantly.
The third source of inefficiency can be addressed by adapting the micro-architecture to the application. Applications have varying types of parallelism:bit-level (BLP), instruction-level (ILP) and data-level (DLP). BLP is exploitedby multi-bit functional units, such as a 32-bit adder. ILP is exploited with mul-tiple issue slots, such as very long instruction word (VLIW) processors. Finally,DLP is exploited by single instruction multiple data (SIMD) architectures. Dif-ferent applications expose different types and amounts of parallelism. When themicro-architecture is tuned to the application, such as in an ASIC or FPGA, themix of different types of parallelism can be exploited in the optimal manner.
Micro-architecture adaptation is the key to achieve a higher compute effi-ciency. FPGAs and ASICs do this, but at an unacceptable price. For ASICsthe data-path is adapted for one set of applications, so it loses generality. FP-GAs are configured at gate-level, which requires many memory cells to storethe hardware configuration (bitfile). These cells leak current resulting in highstatic power consumption [7, 3]. Furthermore the dynamic power is also high [1],due to the large configurable interconnect. Additionally efficiently compiling forFPGAs is hard due to the very fine granularity. Although there are High-LevelSynthesis tools that reduce the programming effort, they cannot always providehigh quality results [13] because of this.
Summarizing, to achieve high compute efficiency, overhead of adaptabilityshould be reduced, while still supporting:
1. Single instruction steady state, e.g., single-cycle loops
2. Data transport reduction, e.g., explicit bypassing
3. Application tailored exploitation of parallelism, e.g., VLIW with matchingSIMD vector lanes
4. Programmability
4
3 Architecture Proposal
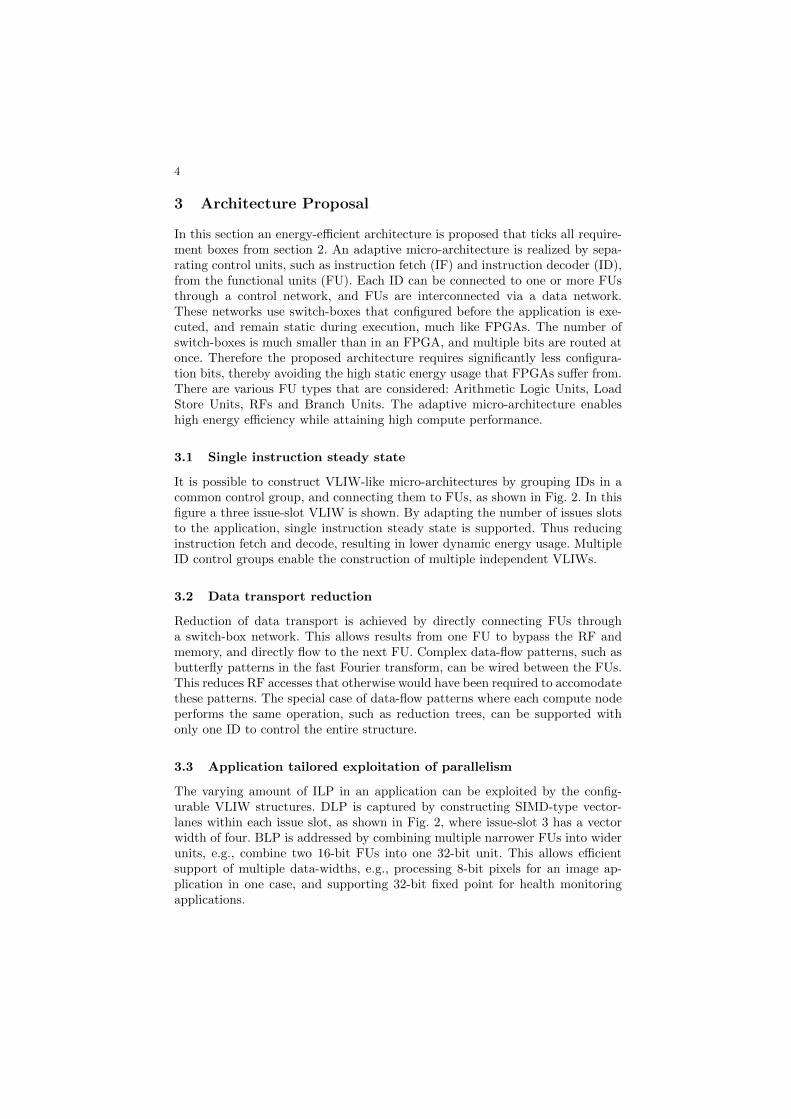
In this section an energy-efficient architecture is proposed that ticks all require-ment boxes from section 2. An adaptive micro-architecture is realized by sepa-rating control units, such as instruction fetch (IF) and instruction decoder (ID),from the functional units (FU). Each ID can be connected to one or more FUsthrough a control network, and FUs are interconnected via a data network.These networks use switch-boxes that configured before the application is exe-cuted, and remain static during execution, much like FPGAs. The number ofswitch-boxes is much smaller than in an FPGA, and multiple bits are routed atonce. Therefore the proposed architecture requires significantly less configura-tion bits, thereby avoiding the high static energy usage that FPGAs suffer from.There are various FU types that are considered: Arithmetic Logic Units, LoadStore Units, RFs and Branch Units. The adaptive micro-architecture enableshigh energy efficiency while attaining high compute performance.
3.1 Single instruction steady state
It is possible to construct VLIW-like micro-architectures by grouping IDs in acommon control group, and connecting them to FUs, as shown in Fig. 2. In thisfigure a three issue-slot VLIW is shown. By adapting the number of issues slotsto the application, single instruction steady state is supported. Thus reducinginstruction fetch and decode, resulting in lower dynamic energy usage. MultipleID control groups enable the construction of multiple independent VLIWs.
3.2 Data transport reduction
Reduction of data transport is achieved by directly connecting FUs througha switch-box network. This allows results from one FU to bypass the RF andmemory, and directly flow to the next FU. Complex data-flow patterns, such asbutterfly patterns in the fast Fourier transform, can be wired between the FUs.This reduces RF accesses that otherwise would have been required to accomodatethese patterns. The special case of data-flow patterns where each compute nodeperforms the same operation, such as reduction trees, can be supported withonly one ID to control the entire structure.
3.3 Application tailored exploitation of parallelism
The varying amount of ILP in an application can be exploited by the config-urable VLIW structures. DLP is captured by constructing SIMD-type vector-lanes within each issue slot, as shown in Fig. 2, where issue-slot 3 has a vectorwidth of four. BLP is addressed by combining multiple narrower FUs into widerunits, e.g., combine two 16-bit FUs into one 32-bit unit. This allows efficientsupport of multiple data-widths, e.g., processing 8-bit pixels for an image ap-plication in one case, and supporting 32-bit fixed point for health monitoringapplications.
5
3.4 Programmability
The possible configurations in the proposed architecture all bear a strong re-semblance to VLIW processors with an explicit data-path and issue slots withvector lanes. This requires a compiler which supports explicit bypassing, whichis described in more detail in section 4.
Instructionmemory
ID
Global data memory
LS
FU FU
FU FU
FU FU
FU FU
FU FU
FU FU
LocalMem.
ID
LS LS LS LS LS
LocalMem.
LocalMem.
LocalMem.
LocalMem.
LocalMem.
ID
IF
IF
IF
Host
VLIWSlot 1
VLIWSlot 2
VLIWSlot 3
Fig. 2. Proposed architecture
Architectureconstruction
ArchitectureDescription
Compiler
Unit selectionand routing
`
Configurationfile
ApplicationBinary
Chipdescription
ApplicationCode
Metrics
Fig. 3. Toolflow
4 Tool flow
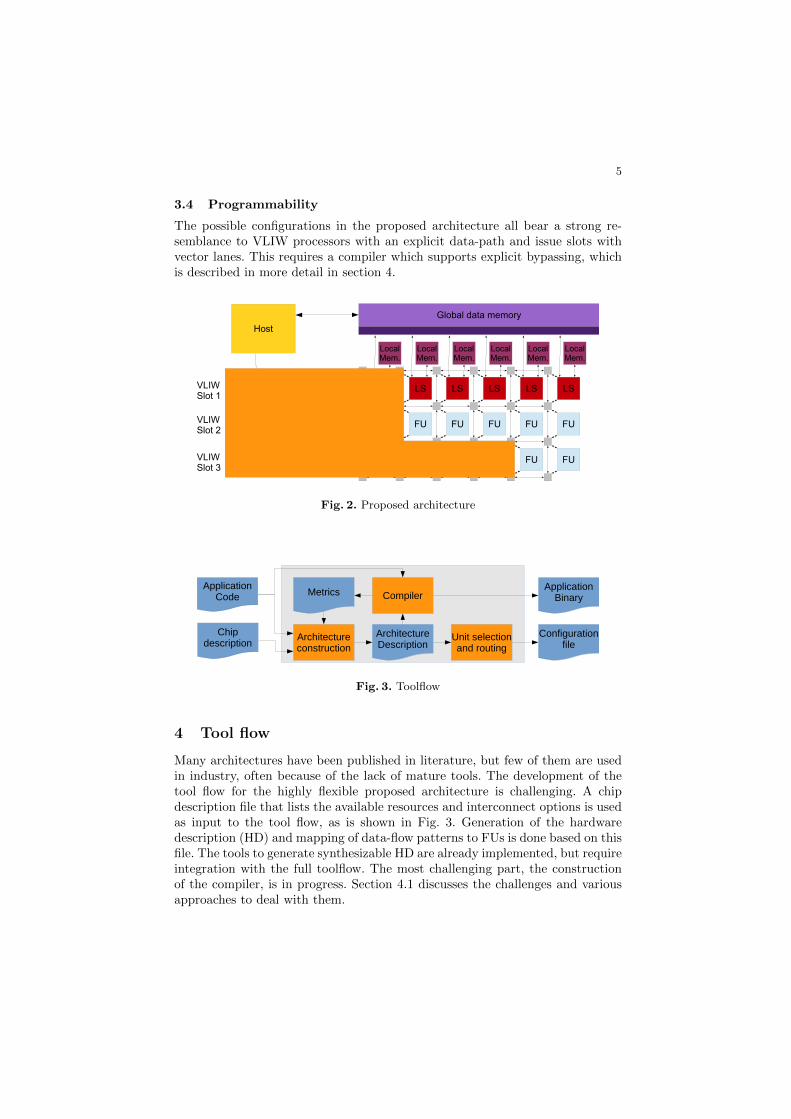
Many architectures have been published in literature, but few of them are usedin industry, often because of the lack of mature tools. The development of thetool flow for the highly flexible proposed architecture is challenging. A chipdescription file that lists the available resources and interconnect options is usedas input to the tool flow, as is shown in Fig. 3. Generation of the hardwaredescription (HD) and mapping of data-flow patterns to FUs is done based on thisfile. The tools to generate synthesizable HD are already implemented, but requireintegration with the full toolflow. The most challenging part, the constructionof the compiler, is in progress. Section 4.1 discusses the challenges and variousapproaches to deal with them.
6
ALU LSURF RIMM
ST
+
R1 5
R2ALU LSURF RIMM
ALU LSURF RIMM
Cycle 0
Cycle 1
Cycle 2
Fig. 4. Resource and dependence graphs
4.1 Compiler
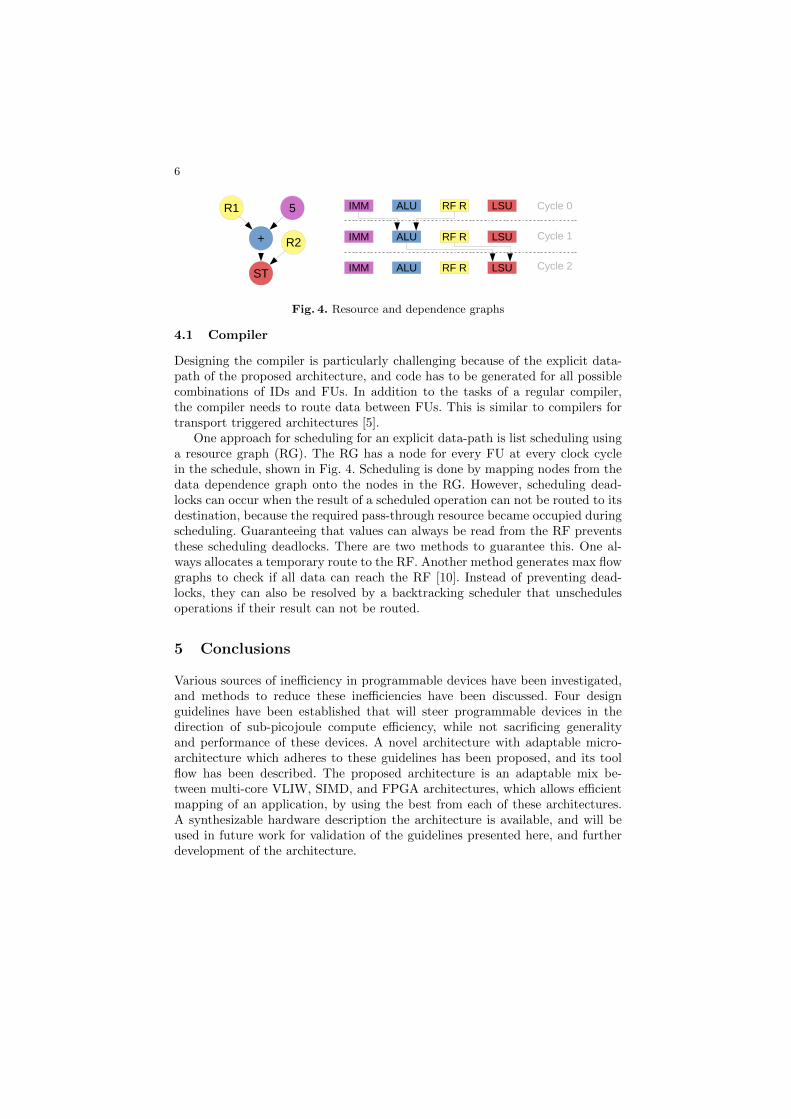
Designing the compiler is particularly challenging because of the explicit data-path of the proposed architecture, and code has to be generated for all possiblecombinations of IDs and FUs. In addition to the tasks of a regular compiler,the compiler needs to route data between FUs. This is similar to compilers fortransport triggered architectures [5].
One approach for scheduling for an explicit data-path is list scheduling usinga resource graph (RG). The RG has a node for every FU at every clock cyclein the schedule, shown in Fig. 4. Scheduling is done by mapping nodes from thedata dependence graph onto the nodes in the RG. However, scheduling dead-locks can occur when the result of a scheduled operation can not be routed to itsdestination, because the required pass-through resource became occupied duringscheduling. Guaranteeing that values can always be read from the RF preventsthese scheduling deadlocks. There are two methods to guarantee this. One al-ways allocates a temporary route to the RF. Another method generates max flowgraphs to check if all data can reach the RF [10]. Instead of preventing dead-locks, they can also be resolved by a backtracking scheduler that unschedulesoperations if their result can not be routed.
5 Conclusions
Various sources of inefficiency in programmable devices have been investigated,and methods to reduce these inefficiencies have been discussed. Four designguidelines have been established that will steer programmable devices in thedirection of sub-picojoule compute efficiency, while not sacrificing generalityand performance of these devices. A novel architecture with adaptable micro-architecture which adheres to these guidelines has been proposed, and its toolflow has been described. The proposed architecture is an adaptable mix be-tween multi-core VLIW, SIMD, and FPGA architectures, which allows efficientmapping of an application, by using the best from each of these architectures.A synthesizable hardware description the architecture is available, and will beused in future work for validation of the guidelines presented here, and furtherdevelopment of the architecture.
REFERENCES 7
References
[1] Amara Amara, Frederic Amiel, and Thomas Ea. “FPGA vs. ASIC for lowpower applications”. In: Microelectronics Journal 37.8 (2006), pp. 669 –677. issn: 0026-2692. doi: http://dx.doi.org/10.1016/j.mejo.2005.11.003. url: http://www.sciencedirect.com/science/article/pii/S0026269205003927.
[2] Inc. Cadence Design systems. Tensilica Customizable Processor IP. url:http : / / ip . cadence . com / ipportfolio / tensilica - ip (visited on11/20/2015).
[3] Lanping Deng, K. Sobti, and C. Chakrabarti. “Accurate models for esti-mating area and power of FPGA implementations”. In: Acoustics, Speechand Signal Processing, 2008. ICASSP 2008. IEEE International Confer-ence on. Mar. 2008, pp. 1417–1420. doi: 10.1109/ICASSP.2008.4517885.
[4] Rehan Hameed et al. “Understanding Sources of Inefficiency in General-purpose Chips”. In: SIGARCH Comput. Archit. News 38.3 (June 2010),pp. 37–47. issn: 0163-5964. doi: 10.1145/1816038.1815968.
[5] Jan Hoogerbrugge. Code generation for transport triggered architectures.TU Delft, Delft University of Technology, 1996.
[6] Akash Kumar et al. Multimedia Multiprocessor Systems: Analysis, Designand Management. Embedded Systems. Springer Netherlands, 2010. isbn:978-94-007-0083-3. doi: 10.1007/978-94-007-0083-3.
[7] Fei Li et al. “Architecture Evaluation for Power-efficient FPGAs”. In: Pro-ceedings of the 2003 ACM/SIGDA Eleventh International Symposium onField Programmable Gate Arrays. FPGA ’03. New York, NY, USA: ACM,2003, pp. 175–184. isbn: 1-58113-651-X. doi: 10.1145/611817.611844.url: http://doi.acm.org/10.1145/611817.611844.
[8] ARM Ltd. ARM Cortex-M0 Specifications. url: http://www.arm.com/products/processors/cortex-m/cortex-m0.php (visited on 11/19/2015).
[9] Yi Qian, Steve Carr, and Philip Sweany. “Loop fusion for clustered VLIWarchitectures”. In: ACM SIGPLAN Notices 37.7 (2002), pp. 112–119.
[10] Dongrui She et al. “Scheduling for register file energy minimization inexplicit datapath architectures”. In: Design, Automation Test in EuropeConference Exhibition (DATE), 2012. Mar. 2012, pp. 388–393. doi: 10.1109/DATE.2012.6176502.
[11] C.H. Van Berkel. “Multi-core for mobile phones”. In: Design, AutomationTest in Europe Conference Exhibition, 2009. DATE ’09. 2009, pp. 1260–1265. doi: 10.1109/DATE.2009.5090858.
[12] Luc Waeijen et al. “A Low-Energy Wide SIMD Architecture with ExplicitDatapath”. English. In: Journal of Signal Processing Systems 80.1 (2015),pp. 65–86. issn: 1939-8018. doi: 10.1007/s11265- 014- 0950- 8. url:http://dx.doi.org/10.1007/s11265-014-0950-8.
[13] M. Wijtvliet, S. Fernando, and H. Corporaal. “SPINE: From C loop-neststo highly efficient accelerators using Algorithmic Species”. In: Field Pro-grammable Logic and Applications (FPL), 2015 25th International Con-ference on. Sept. 2015, pp. 1–6. doi: 10.1109/FPL.2015.7294015.
Toward Transparent Heterogeneous Systems
Baptiste Delporte, Roberto Rigamonti, Alberto Dassatti
Reconfigurable and Embedded Digital Systems Institute — REDS HEIG-VDSchool of Business and Engineering Vaud
HES-SO, University of Applied Sciences Western Switzerland
Abstract. Heterogeneous parallel systems are widely spread nowadays.Despite their availability, their usage and adoption are still limited, andeven more rarely they are used to full power. Indeed, compelling newtechnologies are constantly developed and keep changing the technolog-ical landscape, but each of them targets a limited sub-set of supporteddevices, and nearly all of them require new programming paradigms andspecific toolsets. Software, however, can hardly keep the pace with thegrowing number of computational capabilities, and developers are lessand less motivated in learning skills that could quickly become obsolete.
In this paper we present our effort in the direction of a transparent systemoptimization based on automatic code profiling and Just-In-Time com-pilation, that resulted in a fully-working embedded prototype capable ofdynamically detect computing-intensive code blocks and automaticallydispatch them to different computation units.
Experimental results show that our system allows gains up to 32× inperformance — after an initial warm-up phase — without requiring anyhuman intervention.
1 Introduction
Improvements in computational power marked the last six decades and repre-sented the major factor that allowed mankind to tackle problems of growingcomplexity. However, owing to physical and technological limitations, this pro-cess came to an abrupt halt in the past few years [25, 20, 14]. Industry tried tocircumvent the obstacle by switching the paradigm, and both parallelism andspecialization became the keywords to understand current market trends: theformer identifies the tendency of having computing units that are composed ofmany independent entities that supposedly increase by a multiplicative factorthe throughput; the latter reflects the drift toward architectures (think of, forinstance, DSPs) that are focused on solving particular classes of problems thatarise when facing a specific task. These two non-exclusive phenomena broadenedthe panorama of technological solutions available to the system developer but,contrary to expectations, were not capable of sustaining the growth that wasobserved in the previous years [20, 8]. Indeed, while architectures and systemsevolve at a fast pace, software does not [9]. Big software projects, which are usu-ally the most computing-intensive ones, demand careful planning over the years,

2
and cannot sustain rapid twitches to adapt to the latest technological trend. De-velopers are even more of a “static” resource, in the sense that they require longtime periods before becoming proficient in a new paradigm. Moreover, the mostexperienced ones, which are the most valuable resource of a software companyand those who would be leading the change, are even less inclined to imposeradical turns to a project, as this would significantly affect their mastery andtheir control of the situation. Faced with such a dilemma, the only reasonablesolution seems to be automation.
In this paper we present a solution to this problem capable of detectingsegments of code that are “hot” from a computational stance and dynamicallydispatching them to different computing units, relieving thus the load of themain processor and increasing the execution speed by exploiting the peculiaritiesof those computing units. In particular, as a case study, we demonstrate ourapproach by providing a fully-working embedded system, based on the REPTARplatform [2], that automatically transfers heavy tasks from the board’s Cortex-A8 ARM processor to the C64x+ DSP processor that is incorporated in the sameDM3730 chip [23]. To achieve this goal, we execute the code we want to optimizein the LLVM [7] Just-In-Time (JIT) framework, we then identify functions worthoptimizing by using the Linux’s perf event [26] tool, and finally we dispatch themto the DSP, aiming at accelerating their execution. We will hereafter refer to ourproposal as Versatile Performance Enhancer (VPE). While the performance weobtain is obviously worse than the one we could achieve by a careful handcraftingof the code, we get this result at no cost for the developer, who is totally unawareof the environment in which the code will be executed. Also, as the code changesare performed at run-time, they can adapt to optimize particular input patterns— think of, for instance, a convolution where most of the kernel’s components arezeros —, further enhancing the performance. Finally, the system can dynamicallyreact to changes in the context of execution, for example resources that becomeavailable, are upgraded, or experience an hardware failure.
In the following we will first present the current state of the art, and thenaccurately describe our approach.
2 State of The Art
Parallel and heterogeneous architectures are increasingly widespread. While alot of research addresses Symmetrical Multi-Processors (SMP) systems, hetero-geneous architectures are yet not well integrated in the development flow, andintegrators usually have to come up with ad-hoc, non-portable solutions. Slowlythe scenario is changing and mainstream solutions start to be proposed. Par-ticularly interesting in this context are some language-based solutions, such asCUDA [1], OpenCL [13, 1], HSA [11], and OpenMP Extensions for HeterogeneousArchitectures [15]. All of these solutions are oriented to some specific hardwaresettings, they are very similar to a GPU in nature, and are constructed in sucha way that hardware manufacturers can keep a strong hold on their technolo-gies. While these proposals might look as a perfectly reasonable answer to the

3
heterogeneity problem, they share a major drawback: they all require the pro-grammers to learn a new programming paradigm and a new toolset to workwith them. Moreover, these solutions are similar but mainly incompatible in na-ture, and this fact worsens even further the situation. Supporting more than oneapproach is expensive for companies, and the reality is that the developer hasseldom the choice about the methodology to adopt once the hardware platformis selected — most likely by the team in charge of the hardware part, who isprobably unaware, or partially unaware, of the implications that choice has onthe programming side.
A partial solution to this problem, called SoSOC, is presented in [18]: toavoid setting the knowledge of the DSP architecture and the related toolset(compiler, library, . . . ) as an entry barrier to using the DM3730 chip for actualdevelopment, the authors wrote a library that presented a friendly interface tothe programmer and allowed the dispatching of functions to a set of targetsbased on either the developer’s wishes or some statistics computed during earlyruns. While interesting and with encouraging results, in our view the approachhas a major drawback: not only the user of SoSOC has to learn (yet) anotherlibrary, but also someone has to provide handcrafted code for any specializedunit of interest. This is a considerable waste of time and resources, and limitsthe applicability of the system to the restricted subset of architectures directlysupported by the development team. Furthermore, the developer might not beaware of the real bottlenecks of the system for a particular input set, so hemight candidate for remote execution non-relevant functions, wasting preciousresources.
Other academic proposals exist. A notable one is StarPU from INRIA Bor-deaux [4]. StarPU provides an API and a pragma-based environment that, cou-pled with a run-time scheduler for heterogeneous hardware, composes a completesolution. While the main focus of the project is CPU/GPU systems, it could beextended to less standard systems. As for [1, 13, 11, 15, 4, 18], StarPU shows thesame limitations: a new set of tools and a new language or API to master.
Compared with these alternatives, our solution does not need applicationdevelopers to be aware of the optimization steps that will be undertaken, it doesnot target a specific architecture, and it does not require any additional stepfrom the developer’s side.
Another interesting technique, called BAAR and focused on the Intel’s XeonPhi architecture, is presented in [16, 17]. This proposal is similar to ours, inthat the code to be optimized is run inside LLVM’s Just-In-Time framework,and functions deemed to be best executed on the Xeon Phi are offloaded to aremote server that compiles them with Intel’s compiler and executes them. How-ever, their analysis step lacks the “Versatility” that characterizes our approach:functions are statically analyzed using Polly [21], a state-of-the-art polyhedraloptimizer for automatic parallelization, to investigate their suitability for remoteexecution, and if this is the case, they are sent to the remote target. In our pro-posal, instead, optimizations are triggered according to an advanced performanceanalyzer, fitting to the current input set under processing and not to expected-
4
usage scenarios or other compile-time metrics. This allows us a fine-grained con-trol on the metric to optimize, the strategy to achieve this optimization, and thebest target selection for a given task at any moment during the program’s life.To the best of our knowledge, no other approach faces the versatility and thetransparency aspects simultaneously as VPE does.
3 VPE approach
The analysis in the previous section highlighted the importance of alternativesable to automate the code acceleration and dispatching steps. VPE aims at therun-time optimization of a generic code for a specific heterogeneous platformand input data pair, all in a transparent way. The idea behind it is that thedeveloper just writes the code as if it had to be executed on a standard CPU.The VPE framework JIT-compiles this code and executes it, collecting statisticsat run-time. When a user function — system calls are automatically excludedfrom the analysis — behaves according to a specific pattern, for instance, isparticularly CPU-intensive, VPE acts to alter the run-time behaviour trying tooptimize the execution. In the case of a CPU-intensive code, this could be thedispatching on a remote target specialized for the type of operations executed.After a warm-up delay, which can quickly become negligible for a large familyof algorithms adopted in both the scientific and industrial settings, the perfor-mances result potentially increased. If this is not the case — for instance afteran abrupt discontinuity in the input data pattern that makes the computationnot suitable for the selected remote target —, VPE can revise its decisions andact accordingly.
In structuring VPE, similarly to [16], we have chosen to cast the problemin the LLVM framework [5, 6]. LLVM recently came as an alternative to thewidely known GCC compiler, whose structure was deemed to be too intricateto allow people to easily start contributing to it. The biggest culprit seemedto be the non-neat separation between the front-end, the optimization, and theback-end steps [5]. LLVM tried to solve this issue by creating an IntermediateRepresentation (IR) — an enriched assembly — that acts as a common languagebetween the different steps [7]. The advantage here is that each component ofthe compilation chain can be unaware of the remaining parts and still be capableof doing its job; for instance, the ARM back-end does not need to know whetherthe code it is trying to assemble comes from C++ or FORTRAN code, allowinga back-end designer to focus solely on what this tool is supposed to do. Asa result, a slew of LLVM-based tools came out in the past few years, withremarkable contributions coming from the academic community too, and thisfueled its diffusion. Among others, LLVM features a Just-In-Time (JIT) compiler(MCJIT) — which is the core component of our system — since many years now,whereas GCC introduced it only at the end of 2014 [10]. Also, a number of toolsallowing in-depth code analysis and optimization, such as [12, 21, 22] to cite afew, can be easily integrated, leaving the door open to future extensions.

5
We have thus started from MCJIT, integrated an advanced profiling tech-nique, and altered its behaviour by acting directly on the code’s IR to allow usdynamically switch functions at will. We then took an embedded system thatsuited our needs, and experimentally verified the improvements introduced byour solution.
3.1 Profiling
Detecting which function is the best candidate to be speeded-up is a task thatcan be accomplished neither at development time, nor at compile time, as it isusually strongly dependent on inputs. We therefore had to shape our architec-ture to include a performance monitoring solution, and after considering differ-ent alternatives (such as OProfile [27]), we opted for perf event [26]. perf eventgives access to a large number of hardware performance counters, although ata penalty that can reach up to 20% overhead. In particular, very interestingmeasures can be acquired, including cache misses, branch misses, page faults,and many others, leaving the choice about which figure of merit optimize for, tothe system engineer.
In this paper we adopt, as the sole performance metrics for selecting whichfunction off-load, the number of CPU cycles requested for its execution. Our onlyoptimization strategy is blind off-loading — that is, we off-load the candidatefunction and we observe if this results in a performance improvement, eventuallyreverting our choice. It should be noted, however, that large gains could deriveby a careful crafting of this optimization step: as an example, one might thinkof reorganizing on-the-fly a data structure after figuring out that it is causingtoo many cache misses [24].
While we do claim that having reliable and accurate statistics is vital todevising a clever optimization strategy, and having such a powerful performanceanalyzer integrated in our system is surely a strength of our approach, we willnot investigate this topic further in this paper.
3.2 Function call techniques
Once an “interesting” function is detected, we would like to off-load it to anothercomputational unit (we will refer to this computational unit as remote targetfrom now on). For this to happen, we have to transfer all the function’s code,parameters, and shared data to the remote target, then give the control to it,wait for the function to return, and finally grab the returned values.
Invoking a function on the remote target is particularly tricky: while LLVM’sMCJIT compiler includes a Remote Target Interface, it has the peculiarity ofoperating on modules only, where a module is a collection of functions [3]. Thisbehaviour has only very recently been changed with the introduction of a newJIT, called ORC, but this code is still under development and it is available forthe x86 64 architecture only. Operating at module level is very uncomfortable,as MCJIT requires a module to be finalized before being executed, and leavesus no simple way to alter the function invocation at run-time. To acquire the

6
Fig. 1. Comparison of the execution flows in a standard system (left column) and inVPE (right column). While without VPE the JIT directly invokes the desired function,in VPE an intermediate step through a wrapper has to be made. When a remotetarget is selected, the wrapper invokes a function that is in charge of handling thecommunication with it, sending it the parameters and the code, and waiting for theresults to be handed back.
capacity of dynamically dispatching functions, we thus automatically replace allfunctions with a caller that, in normal situations, simply executes the corre-sponding function via a function pointer (see Figure 1). While this introducesa call overhead (as all function invocations must perform this additional “callerstep”), when we wish to execute a function on the remote target, we just have toalter this function pointer to make it point to another function that deals withthe remote target, as shown in Figure 1.
Similarly, when we consider that a function is not worth remote executionanymore — for instance we might have observed that the remote target is slowerthat the local CPU on the given task, we know that the remote target is alreadybusy, or we have a more suitable function for the given computation unit — weset back this pointer to its original value. Since computing-intensive functions areautomatically detected and offloaded to the remote target, the overhead imposedby the additional step quickly becomes negligible.
3.3 Memory allocation problem
As briefly mentioned in the previous paragraph, once a function is invoked onthe remote target, all data relative to it have to be transferred as well. In stan-dard SMP systems this issue is not very relevant: all processors usually access allmemory space, and hardware mechanisms guarantee cache coherency. On het-erogeneous systems, however, the problem is more relevant. Often the remotetarget has only a partial access to the main system’s memory and there is nohardware support to ease the data sharing. In this context differences betweensystems are remarkable, and we can distinguish between two macro-categories

7
based on memory organization: we have indeed systems with shared memory(physically shared or virtually shared), and systems without it. We stress herethat the two types can easily co-exist in the same platform, and while a sub-setof processing units can see the memory as a single address space, a differentsub-set can provide a different view.
In the context of VPE we consider only shared memory systems; in systemswhere this assumption is proven false, we could adopt a message passing layerto virtualize the real hardware resources as in [17].
4 Experimental Setup
To validate our proposal, we looked for an heterogeneous platform suitable forbuilding a demonstrator. We have chosen a TI-DM3730 DaVinci digital mediaprocessor SoC. It is present on the REPTAR platform [2] we could use for ourtests and has already been adopted by [18], allowing us an indirect comparison.The DM3730 chip hosts an ARM Cortex-A8 1GHz processor and a C64x+ DSPprocessor running at 800MHz. Part of the address space is shared between thetwo processors, therefore we can easily transfer data by placing them in thisregion. This can be achieved by custom memory management functions, whichhowever do not require any human intervention: when the JIT loads the IRcode, it detects the memory operations and automatically replaces them withour custom ones. Note that this setup is not restrictive, as transfers among non-shared memory regions can be easily achieved by a framework such as MPI, asin [17].
The chosen DSP lacks an LLVM back-end we could use to automaticallycompile the code we are running in the JIT. The TI compiler used to produce thebinaries executed on the DSP is proprietary software, and writing a compatibleback-end was out of the scope of the project. While this could appear as a majorobstacle, we have circumvented it by creating a set of scripts that compilesthe functions’ code using the aforementioned closed-source compiler, and thenextracts a symbol table that is loaded and used in VPE.
5 Benchmarking
5.1 Methodology
We have evaluated the performance of VPE using a set of six algorithms: con-struction of the complementary nucleotidic sequence of an input DNA sequence,2D convolution with a square kernel matrix, dot product of two vectors, multi-plication of two square matrices, search of a nucleotidic pattern in an input DNAsequence, and Fast Fourier Transform (FFT). These algorithms were inspired bythe Computer Language Benchmarks Game1 and were adapted to limit the useof floating point numbers, which are only handled in software by the DSP we
1 http://benchmarksgame.alioth.debian.org
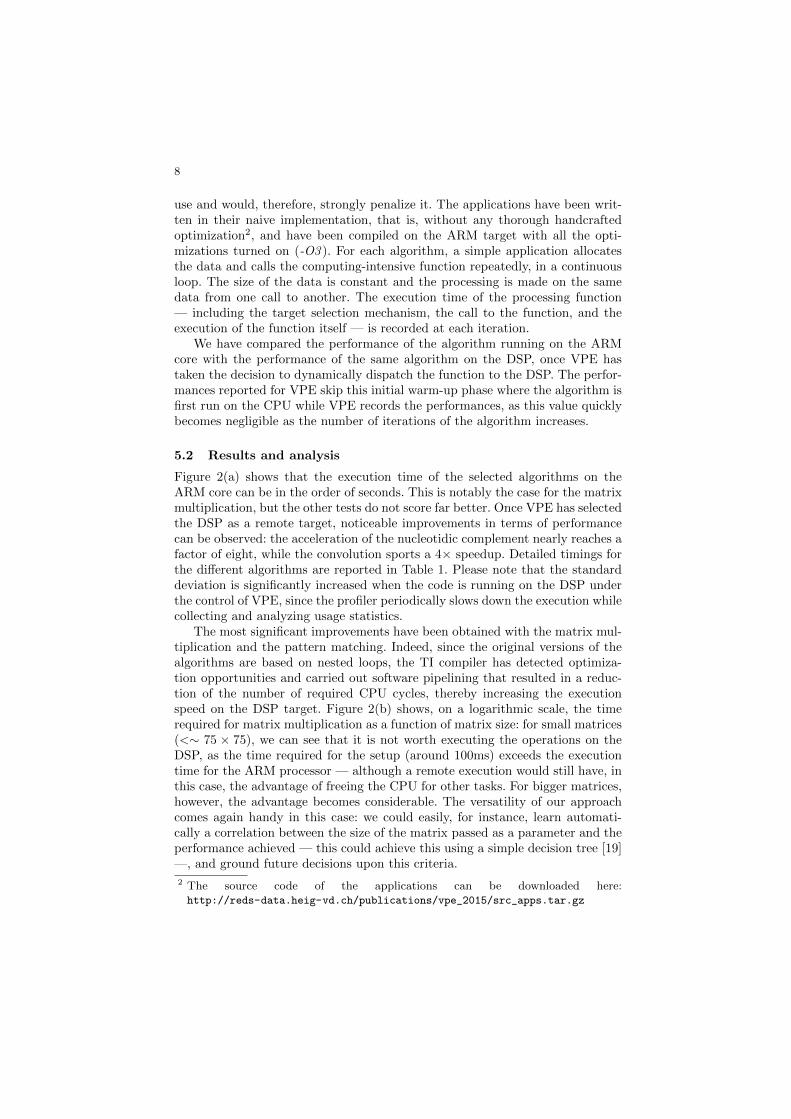
8
use and would, therefore, strongly penalize it. The applications have been writ-ten in their naive implementation, that is, without any thorough handcraftedoptimization2, and have been compiled on the ARM target with all the opti-mizations turned on (-O3 ). For each algorithm, a simple application allocatesthe data and calls the computing-intensive function repeatedly, in a continuousloop. The size of the data is constant and the processing is made on the samedata from one call to another. The execution time of the processing function— including the target selection mechanism, the call to the function, and theexecution of the function itself — is recorded at each iteration.
We have compared the performance of the algorithm running on the ARMcore with the performance of the same algorithm on the DSP, once VPE hastaken the decision to dynamically dispatch the function to the DSP. The perfor-mances reported for VPE skip this initial warm-up phase where the algorithm isfirst run on the CPU while VPE records the performances, as this value quicklybecomes negligible as the number of iterations of the algorithm increases.
5.2 Results and analysis
Figure 2(a) shows that the execution time of the selected algorithms on theARM core can be in the order of seconds. This is notably the case for the matrixmultiplication, but the other tests do not score far better. Once VPE has selectedthe DSP as a remote target, noticeable improvements in terms of performancecan be observed: the acceleration of the nucleotidic complement nearly reaches afactor of eight, while the convolution sports a 4× speedup. Detailed timings forthe different algorithms are reported in Table 1. Please note that the standarddeviation is significantly increased when the code is running on the DSP underthe control of VPE, since the profiler periodically slows down the execution whilecollecting and analyzing usage statistics.
The most significant improvements have been obtained with the matrix mul-tiplication and the pattern matching. Indeed, since the original versions of thealgorithms are based on nested loops, the TI compiler has detected optimiza-tion opportunities and carried out software pipelining that resulted in a reduc-tion of the number of required CPU cycles, thereby increasing the executionspeed on the DSP target. Figure 2(b) shows, on a logarithmic scale, the timerequired for matrix multiplication as a function of matrix size: for small matrices(<∼ 75 × 75), we can see that it is not worth executing the operations on theDSP, as the time required for the setup (around 100ms) exceeds the executiontime for the ARM processor — although a remote execution would still have, inthis case, the advantage of freeing the CPU for other tasks. For bigger matrices,however, the advantage becomes considerable. The versatility of our approachcomes again handy in this case: we could easily, for instance, learn automati-cally a correlation between the size of the matrix passed as a parameter and theperformance achieved — this could achieve this using a simple decision tree [19]—, and ground future decisions upon this criteria.
2 The source code of the applications can be downloaded here:http://reds-data.heig-vd.ch/publications/vpe_2015/src_apps.tar.gz
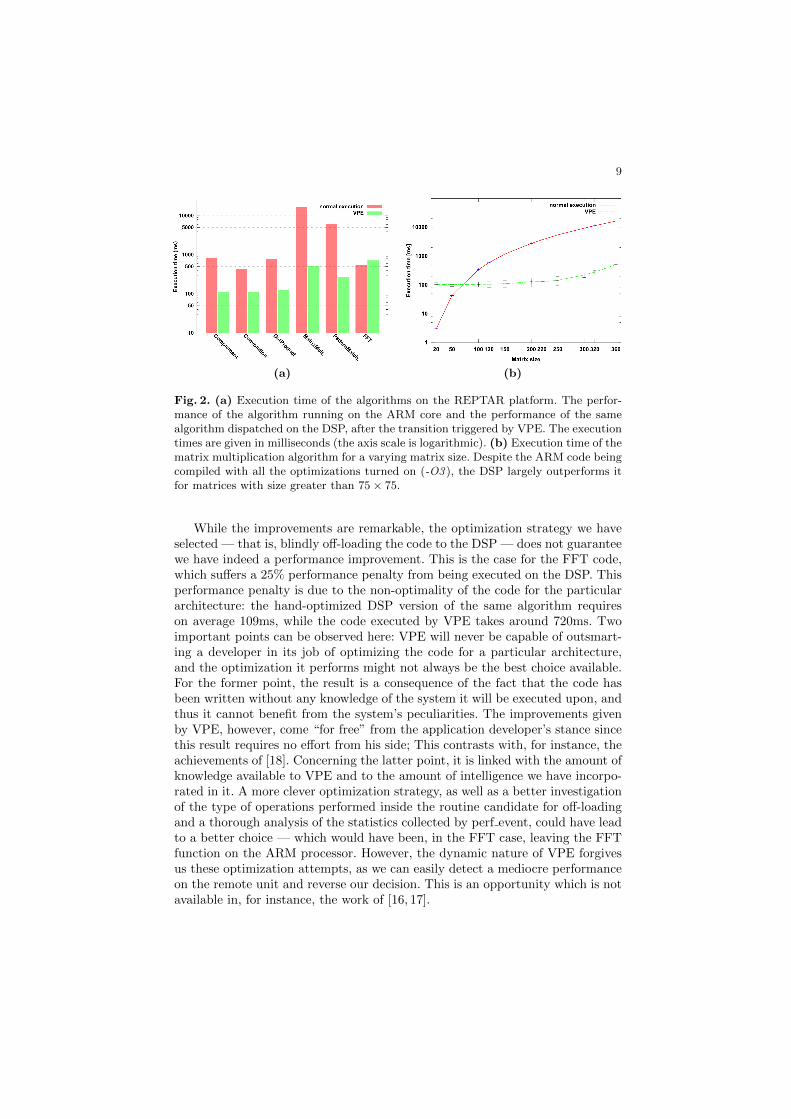
9
(a) (b)
Fig. 2. (a) Execution time of the algorithms on the REPTAR platform. The perfor-mance of the algorithm running on the ARM core and the performance of the samealgorithm dispatched on the DSP, after the transition triggered by VPE. The executiontimes are given in milliseconds (the axis scale is logarithmic). (b) Execution time of thematrix multiplication algorithm for a varying matrix size. Despite the ARM code beingcompiled with all the optimizations turned on (-O3 ), the DSP largely outperforms itfor matrices with size greater than 75 × 75.
While the improvements are remarkable, the optimization strategy we haveselected — that is, blindly off-loading the code to the DSP — does not guaranteewe have indeed a performance improvement. This is the case for the FFT code,which suffers a 25% performance penalty from being executed on the DSP. Thisperformance penalty is due to the non-optimality of the code for the particulararchitecture: the hand-optimized DSP version of the same algorithm requireson average 109ms, while the code executed by VPE takes around 720ms. Twoimportant points can be observed here: VPE will never be capable of outsmart-ing a developer in its job of optimizing the code for a particular architecture,and the optimization it performs might not always be the best choice available.For the former point, the result is a consequence of the fact that the code hasbeen written without any knowledge of the system it will be executed upon, andthus it cannot benefit from the system’s peculiarities. The improvements givenby VPE, however, come “for free” from the application developer’s stance sincethis result requires no effort from his side; This contrasts with, for instance, theachievements of [18]. Concerning the latter point, it is linked with the amount ofknowledge available to VPE and to the amount of intelligence we have incorpo-rated in it. A more clever optimization strategy, as well as a better investigationof the type of operations performed inside the routine candidate for off-loadingand a thorough analysis of the statistics collected by perf event, could have leadto a better choice — which would have been, in the FFT case, leaving the FFTfunction on the ARM processor. However, the dynamic nature of VPE forgivesus these optimization attempts, as we can easily detect a mediocre performanceon the remote unit and reverse our decision. This is an opportunity which is notavailable in, for instance, the work of [16, 17].

10
Table 1. Timings (in ms) for the different algorithms tested on the REPTAR platform.The number reported after the ± represents one standard deviation. With “normalexecution” we indicate the execution of the algorithm on the ARM CPU with noperformance collection undergoing, while with “VPE” we indicate the very same codebut running on the DSP in the VPE framework
Algorithm normal execution VPE Speedup
Complement 818.4 ± 6 109.9 ± 29 7.4×Convolution 432.2 ± 1 111.5 ± 31 3.8×DotProduct 783.8 ± 1 124.9 ± 43 6.3×MatrixMult. 16482.0 ± 158 515.9 ± 35 31.9×FFT 542.7 ± 1 720.9 ± 38 0.7×PatternMatch. 6081.7 ± 58 268.2 ± 48 22.7×
5.3 Image processing prototype
We have also built a prototype demonstrator for the REPTAR board that usesa 2D convolution algorithm to detect contours in a video, similar in spirit to theone proposed in SOSoC3. Both the CPU usage and the frame rate are displayedduring the execution of the video processing. We use the OpenCV library todecode and display the video frames in a dedicated process. The system startsby invoking the video process that is in charge of decoding the current frame,then the pixel matrix is sent to the convolution process. The computation of theconvolution is performed within VPE and the resulting matrix is sent back tothe video application, which displays it.
Figure 3(a) shows that, despite the main CPU being under heavy load, theframe rate is very low, being around 1.5fps. After a predefined time interval,chosen to allow the spectators to observe the system running for a while, VPEis granted the right to automatically optimize the execution. Once this happens,it detects that the convolution is the most expensive task and starts sending thenew frames to the DSP, halving the CPU load — the image handling is still per-formed by the CPU — and multiplying by four the frame rate. Short bursts ofCPU usage are, however, to be foreseen even when the convolution code is run-ning on the DSP, as VPE still periodically analyzes the collected performancesto spot variations in the system’s usage that could trigger a different resourcesallocation policy. A detailed view of the CPU usage and frame rate evolutionare shown in Figure 3(c).
6 Conclusion
In this paper we have presented a transparent system optimization scheme ca-pable of using a run-time code profiler and a JIT to automatically dispatchcomputing-intensive chunks of code to a set of heterogeneous computing units.
3 http://reds.heig-vd.ch/rad/projets/sosoc
11
We have also built a working prototype that exploits this technique to acceler-ate by a factor of four a standard image processing algorithm, and significantlyimprove the performances on a set of standard benchmarks.
Future work will concentrate on testing our approach on a larger number ofplatforms, as well as exploring additional run-time optimization schemes thatcould further reduce the algorithm’s computation time.
References
1. A. Danalis and G. Marin and C. McCurdy and J.S. Meredith and P.C. Roth andK. Spafford and V. Tipparaju and J.S. Vetter: The Scalable Heterogeneous Com-puting (SHOC) Benchmark Suite. In: Proc. of the General-Purpose Computationon Graphics Processing Units Workshop (2010)
2. A. Dassatti and O. Auberson and R. Bornet and E. Messerli and J. Stadelmannand Y. Thoma: REPTAR: A Universal Platform For Codesign Applications. In:Proc. of the European Embedded Design Conf. in Education and Research (2014)
3. B.C. Lopes and R. Auler: Getting Started with LLVM Core Libraries. Packt Pub-lishing (2014)
4. C. Augonnet and S. Thibault and R. Namyst and P.A. Wacrenier: StarPU: AUnified Platform for Task Scheduling on Heterogeneous Multicore Architectures.Concurrency and Computation: Practice & Experience (2011)
5. C. Lattner: Introduction to the LLVM Compiler System. In: Proc. of the ACATWorkshop (2008)
6. C. Lattner: LLVM and Clang: Advancing Compiler Technology. In: Proc. of theFOSDEM (2011)
7. C. Lattner and V. Adve: LLVM: A Compilation Framework for Life-long ProgramAnalysis & Transformation. In: Proc. of the CGO Symposium (2004)
8. D.E. Womble and S.S. Dosanjh and B. Hendrickson and M.A. Heroux and S.J.Plimpton and J.L. Tomkins and D.S. Greenberg: Massively parallel computing: ASandia perspective. Parallel Computing (1999)
9. F.P. Brooks: The Mythical Man-month (Anniversary Ed.) (1995)10. Free Software Foundation Inc.: GCC 5 Release Notes, https://gcc.gnu.org/
gcc-5/changes.html
11. G. Kyriazis: Heterogeneous system architecture: A technical review. Tech. rep.,AMD (2013)
12. G. Venkatesh and J. Sampson and N. Goulding and S. Garcia and V. Bryksin andJ. Lugo-Martinez and S. Swanson and M.B. Taylor: Conservation Cores: Reducingthe Energy of Mature Computations. In: Proc. of the ASPLOS Conference (2010)
13. J.E. Stone and D. Gohara and G. Shi: OpenCL: A Parallel Programming Stan-dard for Heterogeneous Computing Systems. Computing in Science & Engineering(2010)
14. K. Asanovic and R. Bodik and B.C. Catanzaro and J.J. Gebis and P. Husbands andK. Keutzer and D.A. Patterson and W.L. Plishker and J. Shalf and S.W. Williamsand K.A. Yelick: The Landscape of Parallel Computing Research: A View fromBerkeley. Tech. rep., EECS Department, University of California, Berkeley (2006)
15. L. White: OpenMP Extensions for Heterogeneous Architectures. Lecture Notes inComputer Science (2011)
16. M. Damschen and C. Plessl: Easy-to-use on-the-fly binary program acceleration onmany-cores. In: Proc. Int. ASCS Workshop (2015)

12
17. M. Damschen and H. Riebler and G. Vaz and C. Plessl: Transparent Offloading ofComputational Hotspots from Binary Code to Xeon Phi. In: Proc. of the Design,Automation & Test in Europe Conference & Exhibition (2015)
18. O. Nasrallah and W. Luithardt and D. Rossier and A. Dassatti and J. Stadelmannand X. Blanc and N. Pazos and F. Sauser and S. Monnerat: SOSoC, a Linuxframework for System Optimization using System on Chip. In: Proc. of the IEEESystem-on-Chip Conference (2013)
19. S.R. Safavian and D. Landgrebe: A Survey of Decision Tree Classifier Methodology.IEEE Trans. on Systems, Man, and Cybernetics (1991)
20. S.W. Keckler and W.J. Dally and B. Khailany and M. Garland and D. Glasco:GPUs and the Future of Parallel Computing. IEEEMicro (2011)
21. T. Grosser, A. Groesslinger, C. Lengauer: Polly - Performing polyhedral optimiza-tions on a low-level intermediate representation. Parallel Processing Letters (2012)
22. T. Oh and H. Kim and N.P. Johnson and J.W. Lee, and D.I. August: PracticalAutomatic Loop Specialization. In: Proc. of the ASPLOS Conference (2013)
23. Texas Instruments Incorporated: DM3730, DM3725 Digital Media ProcessorsDatasheet (2011)
24. T.M. Chilimbi and M.D. Hill and J.R. Larus: Cache-Conscious Structure Layout.In: Proc. of the PLDI Conf. (1999)
25. U. Lopez-Novoa and A. Mendiburu and J. Miguel-Alonso: A Survey of Perfor-mance Modeling and Simulation Techniques for Accelerator-Based Computing.IEEE Transactions on Parallel and Distributed Systems (2015)
26. V.M. Weaver: Linux perf event Features and Overhead. In: Proc. of the FastPathWorkshop (2013)
27. W.E. Cohen: Multiple Architecture Characterization of the Linux Build Processwith OProfile. In: Proc. of the Workshop on Workload Characterization (2003)
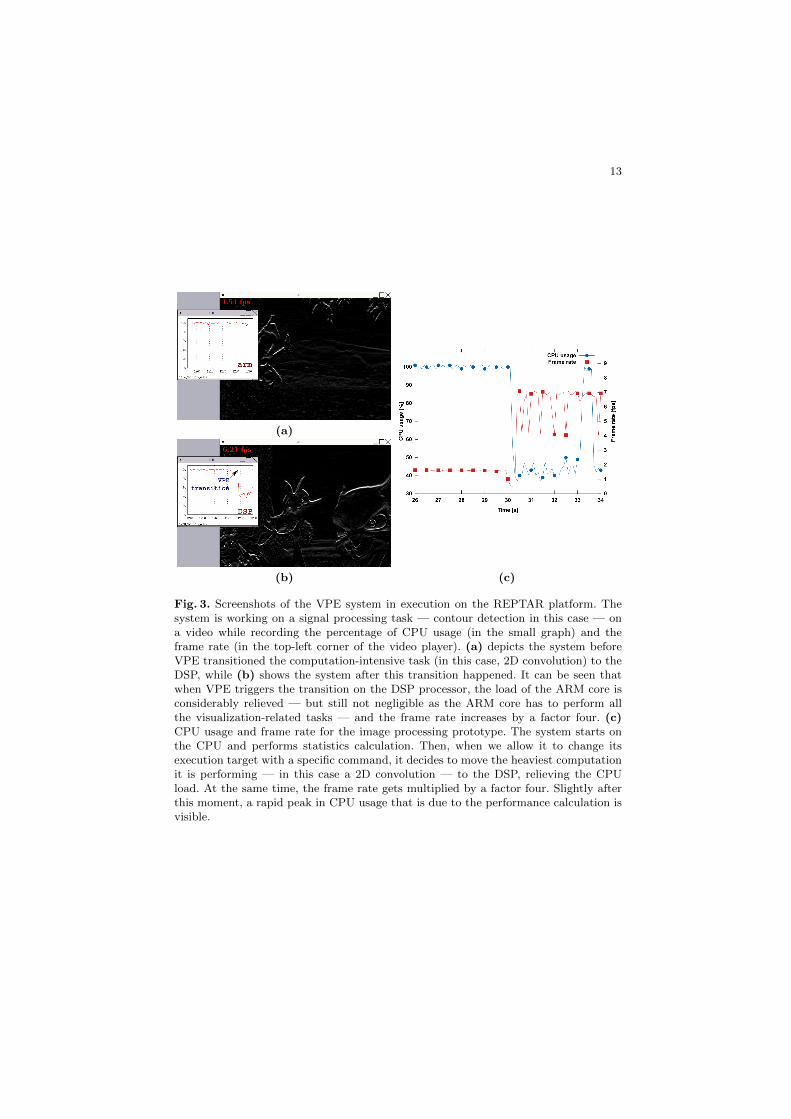
13
(a)
(b) (c)
Fig. 3. Screenshots of the VPE system in execution on the REPTAR platform. Thesystem is working on a signal processing task — contour detection in this case — ona video while recording the percentage of CPU usage (in the small graph) and theframe rate (in the top-left corner of the video player). (a) depicts the system beforeVPE transitioned the computation-intensive task (in this case, 2D convolution) to theDSP, while (b) shows the system after this transition happened. It can be seen thatwhen VPE triggers the transition on the DSP processor, the load of the ARM core isconsiderably relieved — but still not negligible as the ARM core has to perform allthe visualization-related tasks — and the frame rate increases by a factor four. (c)CPU usage and frame rate for the image processing prototype. The system starts onthe CPU and performs statistics calculation. Then, when we allow it to change itsexecution target with a specific command, it decides to move the heaviest computationit is performing — in this case a 2D convolution — to the DSP, relieving the CPUload. At the same time, the frame rate gets multiplied by a factor four. Slightly afterthis moment, a rapid peak in CPU usage that is due to the performance calculation isvisible.
Exploring LLVM Infrastructure for SimplifiedMulti-GPU Programming
Alexander Matz1, Mark Hummel2 and Holger Froning3
1,3 Ruprecht-Karls University of Heidelberg, Germany,[email protected]
2 NVIDIA, [email protected]
Abstract. GPUs have established themselves in the computing land-scape, convincing users and designers by their excellent performanceand energy efficiency. They differ in many aspects from general-purposeCPUs, for instance their highly parallel architecture, their thread-collective bulk-synchronous execution model, and their programmingmodel. In particular, languages like CUDA or OpenCL require usersto express parallelism very fine-grained but also highly structured inhierarchies, and to express locality very explicitly. We leverage these ob-servations for deriving a methodology to scale out single-device programsto an execution on multiple devices, aggregating compute and memoryresources. Our approach comprises three steps: 1. Collect informationabout data dependency and memory access patterns using static codeanalysis 2. Merge information in order to choose an appropriate parti-tioning strategy 3. Apply code transformations to implement the chosenpartitioning and insert calls to a dynamic runtime library. We envisiona tool that allows a user write a single-device program that utilizes anarbitrary number of GPUs, either within one machine boundary or dis-tributed at cluster level. In this work, we introduce our concept and toolchain for regular workloads. We present results from early experimentsthat further motivate our work and provide a discussion on related op-portunities and future directions.
1 Introduction
GPU Computing has gained a tremendous amount of interest in the computinglandscape due to multiple reasons. GPUs as processors have a high computa-tional power and an outstanding energy efficiency in terms of performance-per-Watt metrics. Domain-specific languages like OpenCL or CUDA, which are basedon data-parallel programming, have been key to bring these properties to themasses. Without such tools, graphical programming using tools like OpenGL orsimilar would have been too cumbersome for most users.
We observe that data-parallel languages like OpenCL or CUDA can greatlysimplify parallel programming, as no hybrid solutions like sequential code en-riched with vector instructions is required. The inherent domain decomposition
2
principle ensures finest granularity when partitioning the problem, typically re-sulting in a mapping of one single output element to one thread. Work agglom-eration at thread level is rendered unnecessary. The Bulk-Synchronous Parallel(BSP) programming paradigm and its associated slackness regarding the ratioof virtual to physical processors allows effective latency hiding techniques thatmake large caching structures obsolete. At the same time, a typical code exhibitssubstantial amounts of locality, as the rather flat memory hierarchy of thread-parallel processors has to rely on large amounts of data reuse to keep their vastamount of processing units busy.
However, this beauty of simplicity only is applicable to single-GPU programs.Once a program is scaled out to any number of GPUs larger than one, the pro-grammer has to start using orthogonal orchestration techniques for data move-ment and kernel launch. These modification are scattered throughout host anddevice code. We understand the efforts behind this orchestration to be high andcompletely incompatible with the single-device programming model, indepen-dent if these multiple GPUs are within one or multiple machine boundaries.
With this work we introduce our efforts on GPU Mekong1. Its main objectiveis to provide a simplified path to scale-out the execution of GPU programsfrom one GPU to almost any number, independent if the GPUs are locatedwithin one host or distributed at cloud or cluster level. Unlike existing solutions,this work proposes to maintain the GPU’s native programming model, whichrelies on a bulk-synchronous, thread-collective execution. No hybrid solutionslike OpenCL/CUDA programs combined with message passing are required. Asa result, we can maintain the simplicity and efficiency of GPU Computing in thescale-out case, together with high productivity and performance.
We base our approach on compilation techniques including static code anal-ysis and code transformations regarding host and device code. We initially fo-cus on multiple GPU devices within one machine boundary (single computer),allowing avoiding efforts regarding multi-device programming (cudaSetDevice,streams, events and similar). Our initial tool stack is based on OpenCL pro-grams as input, LLVM as compilation infrastructure and a CUDA backend toorchestrate data movement and kernel launches on any number of GPUs. In thispaper, we make the following contributions:
1. A detailed reasoning about the motivation and conceptual ideas of our ap-proach, including a discussion of current design space options
2. Introduction of our compilation tool stack for analysis passes and code trans-formation regarding device and host code
3. Initial analysis of workload characteristics regarding suitability for this ap-proach
1 With Mekong we are actually referring to the Mekong Delta, a huge river delta insouthwestern Vietnam that transforms one of the longest rivers of the world intoan abundant number of tributaries, before this huge water stream is finally emptiedin the South China Sea. Similar to this river delta, Mekong as a project gears totransform a single data stream into a large number of smaller streams that can beeasily mapped to multiple GPUs.
3
4. Exemplary performance analysis of the execution of a single-device workloadon four GPUs
The remainder of this work is structured as follows: first, we establish somebackground about GPUs and their programming models in section 2. We de-scribe the overall idea and our preliminary compilation pipeline in section 3. Insection 4, we describe the characteristics of BSP applications suitable for ourapproach. We present the partitioning schemes and their implementation in sec-tion 5. Our first experiments are described and discussed in section 6. Section 7presents background information and section 8 discusses our current state andfuture direction.
2 Background
A GPU is a powerful high-core-count device with multiple Shared Multipro-cessors (SMs) that can execute thousands of threads concurrently. Each SMis essentially composed by a large number of computing cores, and a sharedscratchpad memory. Threads are organized in blocks, but the scheduler of aGPU doesn’t handle each single thread or block; instead threads are organizedin warps (typically 32 threads) and these warps are scheduled to the SMs duringruntime. Context switching between warps comes at negligible costs, so long-latency events can easily be hidden.
GPU Computing has been dramatically pushed by the availability of pro-gramming languages like OpenCL or CUDA. They are mainly based on threeconcepts: (1) a thread hierarchy based on collaborative thread arrays (CTAs)to facilitate an effective mapping of the vast number of threads (often upwardsof several thousands) to organizational units like the SMs. (2) shared memorythat is an explicit element of the memory hierarchy, in essence enforcing usersto manually specify the locality and thereby inherently optimizing locality to alarge extend. (3) barrier synchronization for the enforcement of a logical orderbetween autonomous computational instances like threads or CTAs.
Counter-intuitively, developing applications that utilize multiple GPUs israther difficult despite the explicitly expressed high degree of parallelism. Thesedifficulties stem from the need to orchestrate execution and manage the availablememory. In contrast to multi-socket CPU systems, the memory from multipleGPUs in a single system is not shared and data has to be moved explicitlybetween the main memory and the memory of each GPU.
3 Concept and Compilation Pipeline
We base our approach on the following observations: first, the inherent threadhierarchy that forms CTAs allows an easy remapping to multiple GPUs. Weleverage this to span up BSP aggregation layers that cover all SMs of multipleGPUs. While this step is rather straight-forward, the huge bandwidth disparity
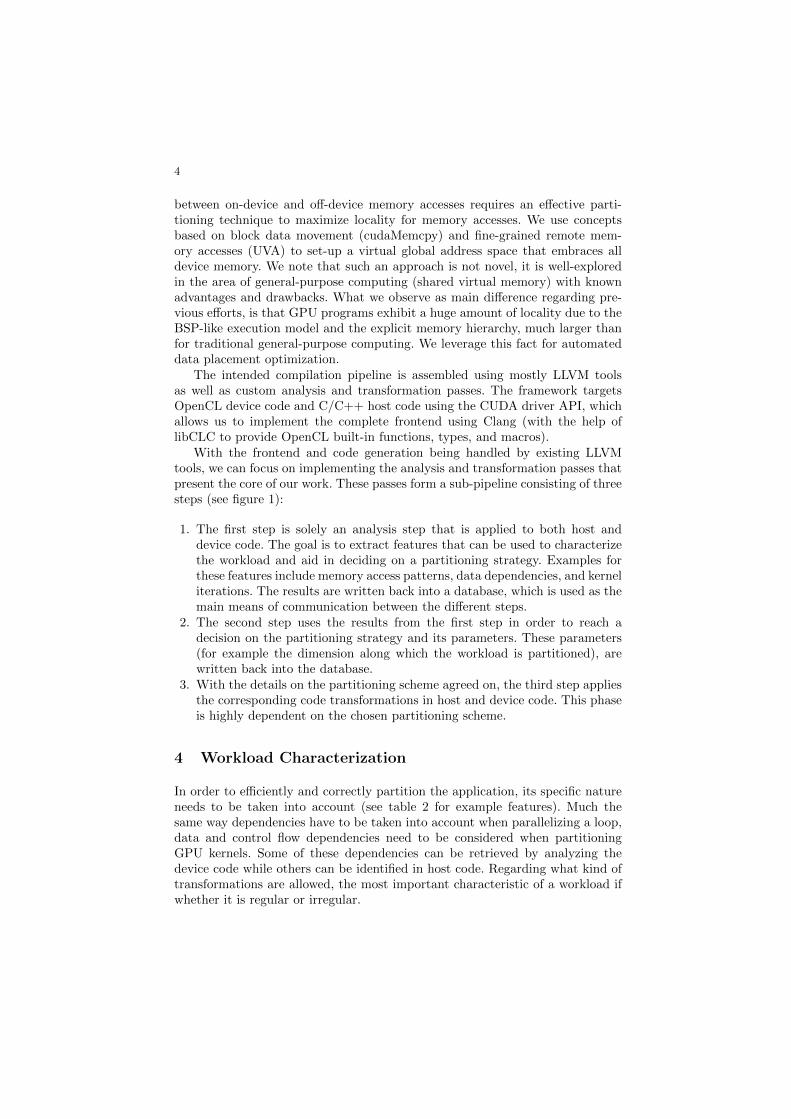
4
between on-device and off-device memory accesses requires an effective parti-tioning technique to maximize locality for memory accesses. We use conceptsbased on block data movement (cudaMemcpy) and fine-grained remote mem-ory accesses (UVA) to set-up a virtual global address space that embraces alldevice memory. We note that such an approach is not novel, it is well-exploredin the area of general-purpose computing (shared virtual memory) with knownadvantages and drawbacks. What we observe as main difference regarding pre-vious efforts, is that GPU programs exhibit a huge amount of locality due to theBSP-like execution model and the explicit memory hierarchy, much larger thanfor traditional general-purpose computing. We leverage this fact for automateddata placement optimization.
The intended compilation pipeline is assembled using mostly LLVM toolsas well as custom analysis and transformation passes. The framework targetsOpenCL device code and C/C++ host code using the CUDA driver API, whichallows us to implement the complete frontend using Clang (with the help oflibCLC to provide OpenCL built-in functions, types, and macros).
With the frontend and code generation being handled by existing LLVMtools, we can focus on implementing the analysis and transformation passes thatpresent the core of our work. These passes form a sub-pipeline consisting of threesteps (see figure 1):
1. The first step is solely an analysis step that is applied to both host anddevice code. The goal is to extract features that can be used to characterizethe workload and aid in deciding on a partitioning strategy. Examples forthese features include memory access patterns, data dependencies, and kerneliterations. The results are written back into a database, which is used as themain means of communication between the different steps.
2. The second step uses the results from the first step in order to reach adecision on the partitioning strategy and its parameters. These parameters(for example the dimension along which the workload is partitioned), arewritten back into the database.
3. With the details on the partitioning scheme agreed on, the third step appliesthe corresponding code transformations in host and device code. This phaseis highly dependent on the chosen partitioning scheme.
4 Workload Characterization
In order to efficiently and correctly partition the application, its specific natureneeds to be taken into account (see table 2 for example features). Much thesame way dependencies have to be taken into account when parallelizing a loop,data and control flow dependencies need to be considered when partitioningGPU kernels. Some of these dependencies can be retrieved by analyzing thedevice code while others can be identified in host code. Regarding what kind oftransformations are allowed, the most important characteristic of a workload ifwhether it is regular or irregular.

5
Fig. 1. High level overview of the compilation pipeline
Regular workloads are characterized by their well-defined memory access pat-terns in kernels. Well-defined in this context means that the memory locationsaccessed over time depend on a fixed number of parameters that are known atkernel launch time. The memory locations accessed being the result of derefer-encing input data (as is the case in sparse computations for example) is a clearexclusion criterion.
They can be analyzed to a very high extend, which allows for extensivereasoning about the applied partitioning scheme and other optimization schemes.They usually can be statically partitioned according to elements in the outputdata. Device code can be inspected for data reuse that does not leverage sharedmemory and can be optimized accordingly. On the host code side, data movementand kernel synchronization are the main optimization targets.
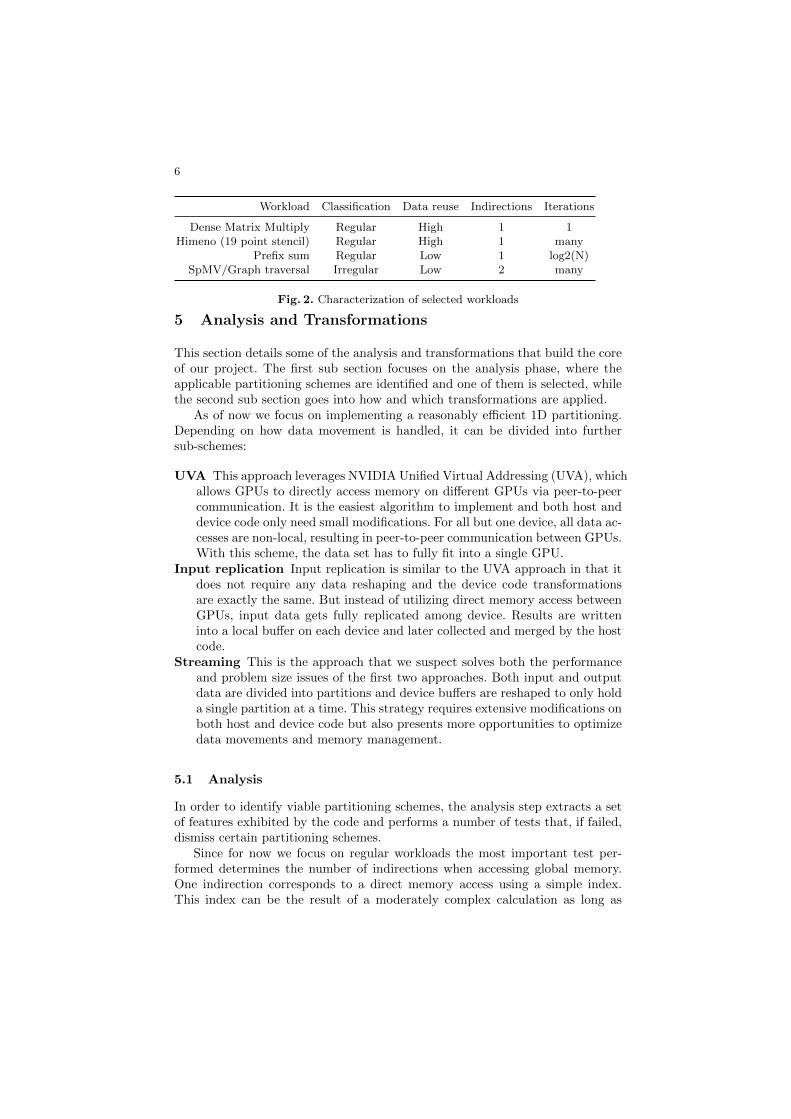
6
Workload Classification Data reuse Indirections Iterations
Dense Matrix Multiply Regular High 1 1Himeno (19 point stencil) Regular High 1 many
Prefix sum Regular Low 1 log2(N)SpMV/Graph traversal Irregular Low 2 many
Fig. 2. Characterization of selected workloads
5 Analysis and Transformations
This section details some of the analysis and transformations that build the coreof our project. The first sub section focuses on the analysis phase, where theapplicable partitioning schemes are identified and one of them is selected, whilethe second sub section goes into how and which transformations are applied.
As of now we focus on implementing a reasonably efficient 1D partitioning.Depending on how data movement is handled, it can be divided into furthersub-schemes:
UVA This approach leverages NVIDIA Unified Virtual Addressing (UVA), whichallows GPUs to directly access memory on different GPUs via peer-to-peercommunication. It is the easiest algorithm to implement and both host anddevice code only need small modifications. For all but one device, all data ac-cesses are non-local, resulting in peer-to-peer communication between GPUs.With this scheme, the data set has to fully fit into a single GPU.
Input replication Input replication is similar to the UVA approach in that itdoes not require any data reshaping and the device code transformationsare exactly the same. But instead of utilizing direct memory access betweenGPUs, input data gets fully replicated among device. Results are writteninto a local buffer on each device and later collected and merged by the hostcode.
Streaming This is the approach that we suspect solves both the performanceand problem size issues of the first two approaches. Both input and outputdata are divided into partitions and device buffers are reshaped to only holda single partition at a time. This strategy requires extensive modifications onboth host and device code but also presents more opportunities to optimizedata movements and memory management.
5.1 Analysis
In order to identify viable partitioning schemes, the analysis step extracts a setof features exhibited by the code and performs a number of tests that, if failed,dismiss certain partitioning schemes.
Since for now we focus on regular workloads the most important test per-formed determines the number of indirections when accessing global memory.One indirection corresponds to a direct memory access using a simple index.This index can be the result of a moderately complex calculation as long as
7
none of the values used in the calculations themselves have been read fromglobal memory. Every time the result of one or more load instructions is used tocalculate an index it counts as another level of indirection.
For regular workloads, where we know the data dependencies in advance, anylevel of indirection that is greater than one dismisses the workload for partition-ing. Although this might seem like a massive limitation, a number of workloadscan be implemented using only one level of indirection. Examples include matrixmultiplications, reductions, stencil codes, and n-body (without cluster optimiza-tions).
If the code is a regular workload, certain features that help deciding on apartitioning scheme are extracted. Useful information includes:
– Maximum loop nesting level– Minimum and maximum values of indices– Index stride between loop iterations– Index stride between neighboring threads– Number and index of output elements
For the partitioning schemes we are currently exploring, we require the outputelements to be distinct for each thread (i.e. no two threads have the same outputelement). Without this restriction, access to output data would have to be keptcoherent between devices.
The index stride between neighboring threads on input data is used in orderto determine partition shapes and sizes. For UVA and Input Replication thisis not relevant, but streaming kernels with partitioned input data should onlybe partitioned across ”block-working-set” boundaries. The analysis of the indexstride between loop iterations gives a deeper insight into the nature of the work-load. As an example, in a non-transposed matrix multiplication the loop stridein the left matrix is 1 while it is the matrix width in the right matrix.
All extracted features will be used to train a classifier that later provideshints for proven-good partitioning schemes.
5.2 Transformation
The transformation phase is highly dependent on the chosen partitioning scheme.Host code of the kind of CUDA applications we are looking at usually followsthe following formula:
1. Read input data2. Initialize device(s)3. Distribute data4. Launch kernels5. Read back results6. Produce output7. Clean up
8
The relevant parts of this code are steps 2 through 5. Iterative workloadshave the same structure, but repeat steps 3 through 5.
Host code modifications currently consist of replacing the regular CUDAcalls with custom replacements that act on several GPUs instead of a singleone. These are the functions that are implemented differently depending on thepartitioning scheme. As an example, for 1D UVA based partitioning, cuMallocallocates memory only on a single GPU, but enables peer-to-peer access betweenthat and all other visible GPUs. In contrast, for 1D Input Replication based par-titioning, cuMalloc allocates memory of the same size on all available GPUs. Inall cases the kernel configuration is modified to account for the possibly multipledevice buffers and the new partitioned grid size.
For device code we currently employ a trick that greatly simplifies 1D par-titioning for UVA and Input Replication schemes. The regular thread grid isembedded in a larger ”super” grid that spans the complete workload on all de-vices. The super ID corresponds to the device number of a GPU within the supergrid and the super size corresponds to the size of a single partition. These addi-tional parameters are passed as extra arguments to the kernel. With this abstrac-tion, transformations on the device code are limited to augmenting the functionto accept these arguments as well as replacing calls to get global id. All calls toget global id that query for the dimension we are partitioning along, get replacedwith the following computation: super_id*super_size + get_global_id(<original
arguments>). This way, no index recalculations have to be performed, as thekernel is essentially the same just with the grid shrunken on and shifted alongthe partitioned dimension. In order to distribute data for the input replicationscheme, regular CUDA memcpys are employed. So far this does not pose a prob-lem, since all GPUs involved are part of the local system.
6 Early Experiments
In order to proof-of-concept our ideas, we did preliminary experiments with thefirst implementation of our toolstack that implements automatic 1D UVA andInput Replication partitioning from section 5. The workload in question is arelatively naive square matrix multiply with the only optimization being the useof 32x32 tiling. It has been chosen due to its regular nature and high computationto communication ratio.
The experiments have been executed on a single node system equipped withtwo Intel Xeon E5-2667 v3 running at 3.20Ghz, 256GB of DDR3 RAM, and aset of 8 NVIDIA K80 GPUs (each combining 2 GK210 GPUs). The systems runson Ubuntu 14.04.
As can be seen in figure 3, even with the high compute to memory ratio ofa matrix multiply, a UVA based partitioning does not perform well and alwaysresults in a speedup of less than one. This can be attributed to the high latencyfor memory accesses on peers that can not be hidden even by the very highamount of parallelism exposed by this kernel.

9
0.25
0.50
0.75
1.00
2 4 6 8Number of GPUs
Spe
edup
2
4
6
4 8 12 16Number of GPUs
Spe
edup
N (NxN matrices) 4096 8192 12288 16384 20480 24576
Fig. 3. Measured speedup for 1D UVA partitioning vs Input Replication.
0.00
0.01
0.02
0.03
0.04
0.05
4 8 12 16Number of GPUs
Tim
e(s)
0
25
50
75
100
125
4 8 12 16Number of GPUs
Tim
e(s)
Operation Dev−>Host Kernel Host−>Dev
Fig. 4. Runtime breakdown of 1D Input Replication partitioning with N=4096 andN=24576.
Input replication, on the other hand, performs reasonably well for larger in-put sizes. As suspected, figure 4 shows that the initial higher cost of having todistribute the data to all devices is outweighed by the speedup of the kernel ex-ecution up to a certain number of gpus. Until the workload hits its problem sizedependent point of saturation, the speedup is just slightly less than linear. Theseinitial results indicate that Input based (and possibly Streaming) based auto-mated partitioning might be a promising option to produce high performanceGPU code in a productive manner.
7 Related Work
There are several projects that focus on simplifying distributed GPU program-ming without introducing new programming languages or specific libraries thathave to be used by the user. Highly relevant are the projects SnuCL from [8]and RCUDA from [13]. They offer a solution to virtualize GPUs on remotenotes in a way so that they appear as local devices local (for OpenCL andCUDA respectively) and still require the user to partition the application man-ually. We consider these projects to be a highly attractive option to scale froma single-node-single-gpu application to a multi-node-multi-gpu application usingour techniques.
Several forms of automated partitioning techniques have been proposed inthe past. Even though all are similar in principle, the details make them differ
10
substantially. Cilardo et al. discuss memory optimized automated partitioning ofapplications for FPGA platforms : while [4] focuses on analyzing memory accesspatterns using Z-polyhedrals, [5] explores memory partitioning in High-LevelSynthesis (HLS) tasks.
The work about run-time systems we examined focus on shared virtual mem-ory and memory optimizations. Li et al. explore the use of page migration forvirtual shared memory in [11]. Tao et al. utilize page migration techniques inorder to optimize data distribution in NUMA systems in [14]. Both of theseworks are a great inspiration for the virtual shared memory system we intend onusing in order to support irregular workloads. ScaleMP is a successful real-worldexample of a software based virtual shared memory system.
A mix of compile-time and run-time systems (similar to our approach) hasbeen used for various work: Pai et al. describe the use of page migration to man-age distinct address spaces of general-purpose CPUs and discrete acceleratorslike GPUs, based on the X10 compiler and run-time [12]. Lee et al. use kernel par-titioning techniques to enable a collaborative execution of a single kernels acrossheterogeneous processors like CPUs and GPUs (SKMD) [9], and introduce anautomatic system for mapping multiple kernels across multiple computing de-vices, using out-of-order scheduling and mapping of multiple kernels on multipleheterogeneous processors (MKMD) [10].
Work on memory access patterns has a rich history. Recent work that fo-cuses on GPUs include Fang et al., who introduced a tool to analyze memoryaccess patterns to predict performance of OpenCL kernels using local memory[6], which we find very inspiring for our work. Ben-Nun et al. are a very recentrepresentative of various work that extends code with library calls to optimizeexecution on multiple GPUs by decisions based on the specified access pattern[3]. Code analysis and transformation has also been used to optimize single-device code. In [7], Fauzia et al. utilize static code analysis in order to speedup execution by coalescing memory accesses and promoting data from sharedmemory to registers and local memory respectively. Similary, Baskaran et al.focus on automatically moving memory between slow off-chip and faster on-chipmemory [1].
8 Discussion
In this paper, we presented our initial work on GPU Mekong, a tool that sim-plifies multi-GPU programming using the LLVM infrastructure for source codeanalysis and code transformations. We observe that the use of multiple GPUssteadily increases for reasons including memory aggregation and computationalpower. In particular, even NVIDIA’s top-notch Tesla-class GPU called K80 isinternally composed of two K40 connected by a PCIe switch, requiring multi-device programming techniques and manual partitioning. With GPU Mekong,we gear to support such multi-GPU systems without additional efforts besidesgood (single-device) CUDA/OpenCL programming skills.

11
We observe that a dense matrix multiply operation can be computed inparallel with a very high efficiency, given the right data distribution technique.It seems that UVA techniques (load/store forwarding over PCIe) is too limitedin terms of bandwidth and/or access latency. Depending on the workload, itmight be useful revisiting it later to support fine-grain remote accesses.
For irregular workloads with more than one level of indirection, our currentapproach of statically partitioning data and code is not going to work. We seevirtual shared memory based on page migration as a possible solution for thesecases. Given the highly structured behavior of GPU kernels, in particular dueto the use of shared memory optimizations (bulk data movement prior to fine-grained accesses), we see strong differences to page migration techniques forgeneral-purpose processors like CPUs. Also, even though it is a common beliefthat irregular workloads have no locality, recent work has shown that this is nottrue [2].
As multi-device systems show strong locality effects by tree-like interconnec-tion networks (in particular for PCIe), we anticipate that a scheduling such datamovements correctly is mandatory to diminish bandwidth limitations due tocontention effects. We plan to support this with a run-time that intercepts blockdata movements, predicts associated costs, and re-schedules them as needed.
Besides such work on fully-automated code transformations for multipleGPUs, we are envisioning multiple other research aspects. In particular, ourcode analysis technique could also highlight performance issues found in thesingle-GPU code. Examples include detecting shared memory bank conflicts, orglobal memory coalescing issues. However, we still have to find out to which ex-tend these “performance bugs” could be automatically solved, or if they simplyhave to be reported to the user. Similarly, we are considering exploring promot-ing global memory allocations automatically to shared memory for performancereasons. Such a privatization would dramatically help using explicit level of thememory hierarchy.
9 Acknowledgements
We gratefully acknowledge the sponsoring we have received from Google (GoogleResearch Award, 2014) and the German Excellence Initiative, with substantialequipment grants from NVIDIA. We acknowledge the support by various col-leagues during discussions, in particular Sudhakar Yalamanchili from GeorgiaTech.
References
1. Baskaran, M.M., Bondhugula, U., Krishnamoorthy, S., Ramanujam, J., Roun-tev, A., Sadayappan, P.: Automatic data movement and computation mappingfor multi-level parallel architectures with explicitly managed memories. In: Pro-ceedings of the 13th ACM SIGPLAN Symposium on Principles and Practice ofParallel Programming. pp. 1–10. PPoPP ’08, ACM, New York, NY, USA (2008),http://doi.acm.org/10.1145/1345206.1345210

12
2. Beamer, S., Asanovic, K., Patterson, D.: Locality exists in graph processing:Workload characterization on an ivy bridge server. In: Workload Characterization(IISWC), 2015 IEEE International Symposium on. pp. 56–65 (Oct 2015)
3. Ben-Nun, T., Levy, E., Barak, A., Rubin, E.: Memory access patterns:The missing piece of the multi-gpu puzzle. In: Proceedings of the Inter-national Conference for High Performance Computing, Networking, Storageand Analysis. pp. 19:1–19:12. SC ’15, ACM, New York, NY, USA (2015),http://doi.acm.org/10.1145/2807591.2807611
4. Cilardo, A., Gallo, L.: Improving multibank memory access parallelism with lattice-based partitioning. ACM Transactions on Architecture and Code Optimization(TACO) 11(4), 45 (2015)
5. Cilardo, A., Gallo, L.: Interplay of loop unrolling and multidimensional memorypartitioning in hls. In: Proceedings of the 2015 Design, Automation & Test inEurope Conference & Exhibition. pp. 163–168. EDA Consortium (2015)
6. Fang, J., Sips, H., Varbanescu, A.: Aristotle: a performance impact indicator forthe opencl kernels using local memory. Scientific Programming 22(3), 239—-257(Jan 2014)
7. Fauzia, N., Pouchet, L.N., Sadayappan, P.: Characterizing and enhancing globalmemory data coalescing on gpus. In: Proceedings of the 13th Annual IEEE/ACMInternational Symposium on Code Generation and Optimization. pp. 12–22. IEEEComputer Society (2015)
8. Kim, J., Seo, S., Lee, J., Nah, J., Jo, G., Lee, J.: Snucl: An opencl framework forheterogeneous cpu/gpu clusters. In: Proceedings of the 26th ACM InternationalConference on Supercomputing. pp. 341–352. ICS ’12, ACM, New York, NY, USA(2012), http://doi.acm.org/10.1145/2304576.2304623
9. Lee, J., Samadi, M., Mahlke, S.: Orchestrating multiple data-parallel kernels onmultiple devices. In: International Conference on Parallel Architectures and Com-pilation Techniques (PACT). vol. 24 (2015)
10. Lee, J., Samadi, M., Park, Y., Mahlke, S.: Skmd: Single kernel on multiple devicesfor transparent cpu-gpu collaboration. ACM Transactions on Computer Systems(TOCS) 33(3), 9 (2015)
11. Li, K., Hudak, P.: Memory coherence in shared virtual memory systems. ACMTransactions on Computer Systems (TOCS) 7(4), 321–359 (1989)
12. Pai, S., Govindarajan, R., Thazhuthaveetil, M.J.: Fast and efficient automaticmemory management for gpus using compiler-assisted runtime coherence scheme.In: Proceedings of the 21st international conference on Parallel architectures andcompilation techniques. pp. 33–42. ACM (2012)
13. Pena, A.J., Reano, C., Silla, F., Mayo, R., Quintana-Ortı, E.S.,Duato, J.: A complete and efficient cuda-sharing solution for{HPC} clusters. Parallel Computing 40(10), 574 – 588 (2014),http://www.sciencedirect.com/science/article/pii/S0167819114001227
14. Tao, J., Schulz, M., Karl, W.: Ars: an adaptive runtime system for locality opti-mization. Future Generation Computer Systems 19(5), 761–776 (2003)
Efficient scheduling policies for dynamicdataflow programs executed on multi-core
Ma lgorzata Michalska1, Nicolas Zufferey2, Jani Boutellier3, Endri Bezati1, andMarco Mattavelli1
1 EPFL STI-SCI-MM, Ecole Polytechnique Federale de Lausanne, Switzerland2 Geneva School of Economics and Management, University of Geneva, Switzerland3 Department of Computer Science and Engineering, University of Oulu, Finland
Abstract. An important challenge for dataflow program implementa-tions on multi-core platforms is the partitioning and scheduling providingthe best possible throughput when satisfying multiple objective func-tions. Not only it has been proven that these problems are NP-complete,but also the quality of any heuristic approach is strongly affected byother factors, such as: buffer dimensioning, influence of an establishedpartitioning configuration and scheduling strategy on each other, un-certainties of a compiler affecting the profiling information. This paperfocuses on the adaptation of some alternative scheduling policies to thedataflow domain and observation of their properties and behavior whenapplied to different partitioning configurations. It investigates the impactof the scheduling on the overall execution time, and verifies which policiescould further drive the metaheuristic-based search of a close-to-optimalpartitioning configuration.
1 Introduction
In the emerging field of massively parallel platforms, it is highly requested todevelop efficient implementations exploiting the available concurrency. Dataflowprograms, characterized by some interesting properties providing a natural wayof dealing with parallelism, seem to posses the necessary features to successfullyhandle this requirement. For the purpose of mapping a dataflow program on atarget architecture, the program should be treated as a set of non-decomposablecomponents (connected to each other by a set of buffers) that can be freelyplaced. This implies that dataflow programs are portable to different architec-tures with making only two decisions: (1) assign the components to the process-ing units; (2) find the execution order (sequencing) inside every unit. For staticdataflow programs the problem of partitioning and scheduling has been studiedvery well and the whole class of compile time algorithms is proven valid [14]. Inthe case of dynamic dataflow programs the problem becomes much complicated,because it requires creating a reliable model of execution that could sufficientlycover and capture the entire application behavior, which depends on the inputdata.

The exploration of the design space should take into consideration three di-mensions: partitioning of dataflow components, scheduling inside each partitionand dimensioning of the buffers that connect the components with each other [8].Exploring one dimension requires making an assumption or at least narrowingthe setup of other two dimensions. On the other hand, such assumptions usuallystrongly influence the outcome of the exploration. For instance, in the case ofscheduling exploration, the quality of applied partitioning and buffer dimension-ing determines the size of the space of possible admissible scheduling configura-tions. Still it can be stated that if the whole dynamic behavior of an applicationis properly captured for a given input sequence and the non-blocking buffer di-mensioning is applied, the scheduling problem for dataflow programs is alwaysfeasible, in comparison to some other Models of Computation (MoCs) [2]. Underthe circumstances the challenge becomes to find such a scheduling configurationthat optimizes the desired objective. For the case of signal processing systems,among various possible objective functions, the most natural is the maximiza-tion of the data throughput, since it contributes to the improvement of otherobjective functions [12]. Providing such an optimal solution to the partitioning-scheduling problem has been, however, proven to be NP-complete even if only aplatform with two processors is considered [25].
After discussing the related work in Section 2, the contribution of this paperstarts in Section 3 from a proper formulation of the partitioning and schedulingproblem, specifically in the dataflow domain. Indeed, to the best of our knowl-edge, such a formulation is still missing in the dataflow related literature. Fur-thermore, the Section 4 presents the methodology of experiments which involvesmodeling of the program execution, target architecture, simulation an verifi-cation of some different scheduling policies described in Section 5. The mainobjective is the analysis of these policies and their performance potential fordifferent partitioning configurations. Section 6 contains the results of simulationsupported with experiments conducted on a real platform. Finally, the results,observations, advantages and drawbacks of the applied methodology clarify adirection of future work discussed in Section 7.
2 Related work
Among several existing dataflow computation models, a dataflow program isin principle structured as a network of communicating computational kernels,called actors. They are in turn connected by directed, lossless, order preservingpoint-to-point communication channels (called buffers), and data exchanges areonly permitted by sending data packets (called tokens) over those channels. Thismodel is presented in Fig. 1. As a result, the flow of data between actors in sucha network is fully explicit. The most general dataflow MoC is known in literatureas ”Dataflow Process Network (DPN ) with firings” [15]. A DPN evolves as asequence of discrete steps by executing actors firings (called actions) that mayconsume and/or produce a finite number of tokens and modify the internal actorstate. At each step, according to the current actor internal state, only one action

can be executed. The processing part of actors is encapsulated in the atomicfiring completely abstracting from time.
The problem of partitioning and scheduling of parallel programs in generalhas been widely described in literature in numerous variants [22]. In the dataflowdomain, in particular, the programs are usually treated as graphs that need tobe optimally partitioned [29]. According to the commonly used terminology,the partitioning can be defined as a mapping of an application in the spatialdomain (binding), whereas scheduling takes place in the temporal domain (se-quencing) [24]. It is also usually emphasized that the partitioning is performedat compile time, whereas scheduling occurs at run-time and is subject to thesatisfaction of firing rules, as well as to the scheduling policy for the sequen-tial execution of actors inside each processor [9]. Although the partitioning andscheduling problems seem to rely and impact each other, much more attentionhas been paid so far to the partitioning problem. Several experiments lead to con-sider finding a solution to the partitioning problem dominant over the schedulingproblem [2, 7].
Since some dataflow models can be very general and therefore difficult toschedule efficiently, an interesting idea comes along with the concept of a flow-shop scheduling [1]. The asynchronous dataflow models can be, in some cases,transformed into simpler synchronous ones, where the partitioning and schedul-ing can be applied directly to the actions. After the partitioning stage (which isan assignment of all actions to the processing units), the scheduling is performedfirst in the offline phase (schedules are computed at compile time), and then inthe run-time phase where a dispatching mechanism selects a schedule for dataprocessing [3].
Another approach for simplifying the scheduling problem is to reduce thecomplexity of the network and control the desired level of granularity. This canbe achieved by actor merging, which can be treated as a special transformationperformed on the sets of actors [13]. Recent research shows that actor mergingis possible even in the case of applications with data dependent behavior and inthe end can act quasi-statically [4]. This, however, does not solve the schedulingproblem entirely, since even for a set of merged actors, if multiple merged actorsare partitioned on one processor, a scheduling approach needs to be defined.
A
C
Network
Actor
StateVariables
Actions
Finite State
Machine
B
Buffer
Fig. 1. Construction of a dataflow network and actor.
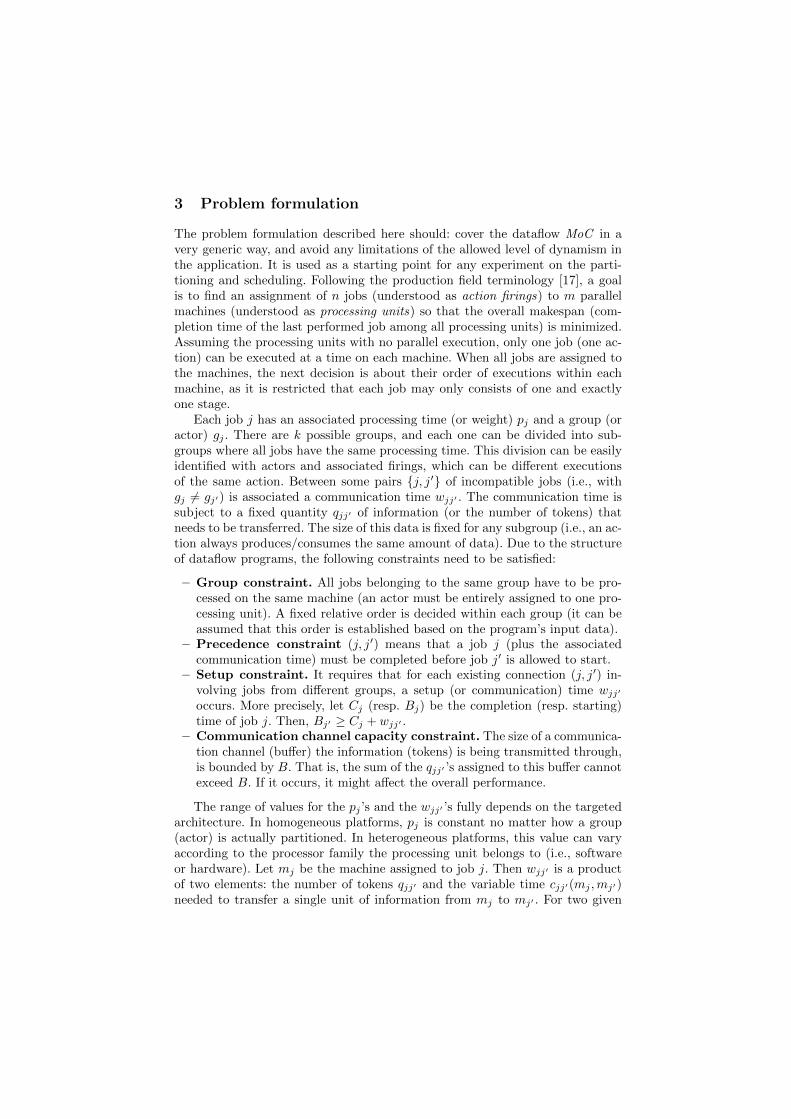
3 Problem formulation
The problem formulation described here should: cover the dataflow MoC in avery generic way, and avoid any limitations of the allowed level of dynamism inthe application. It is used as a starting point for any experiment on the parti-tioning and scheduling. Following the production field terminology [17], a goalis to find an assignment of n jobs (understood as action firings) to m parallelmachines (understood as processing units) so that the overall makespan (com-pletion time of the last performed job among all processing units) is minimized.Assuming the processing units with no parallel execution, only one job (one ac-tion) can be executed at a time on each machine. When all jobs are assigned tothe machines, the next decision is about their order of executions within eachmachine, as it is restricted that each job may only consists of one and exactlyone stage.
Each job j has an associated processing time (or weight) pj and a group (oractor) gj . There are k possible groups, and each one can be divided into sub-groups where all jobs have the same processing time. This division can be easilyidentified with actors and associated firings, which can be different executionsof the same action. Between some pairs {j, j′} of incompatible jobs (i.e., withgj 6= gj′) is associated a communication time wjj′ . The communication time issubject to a fixed quantity qjj′ of information (or the number of tokens) thatneeds to be transferred. The size of this data is fixed for any subgroup (i.e., an ac-tion always produces/consumes the same amount of data). Due to the structureof dataflow programs, the following constraints need to be satisfied:
– Group constraint. All jobs belonging to the same group have to be pro-cessed on the same machine (an actor must be entirely assigned to one pro-cessing unit). A fixed relative order is decided within each group (it can beassumed that this order is established based on the program’s input data).
– Precedence constraint (j, j′) means that a job j (plus the associatedcommunication time) must be completed before job j′ is allowed to start.
– Setup constraint. It requires that for each existing connection (j, j′) in-volving jobs from different groups, a setup (or communication) time wjj′
occurs. More precisely, let Cj (resp. Bj) be the completion (resp. starting)time of job j. Then, Bj′ ≥ Cj + wjj′ .
– Communication channel capacity constraint. The size of a communica-tion channel (buffer) the information (tokens) is being transmitted through,is bounded by B. That is, the sum of the qjj′ ’s assigned to this buffer cannotexceed B. If it occurs, it might affect the overall performance.
The range of values for the pj ’s and the wjj′ ’s fully depends on the targetedarchitecture. In homogeneous platforms, pj is constant no matter how a group(actor) is actually partitioned. In heterogeneous platforms, this value can varyaccording to the processor family the processing unit belongs to (i.e., softwareor hardware). Let mj be the machine assigned to job j. Then wjj′ is a productof two elements: the number of tokens qjj′ and the variable time cjj′(mj ,mj′)needed to transfer a single unit of information from mj to mj′ . For two given
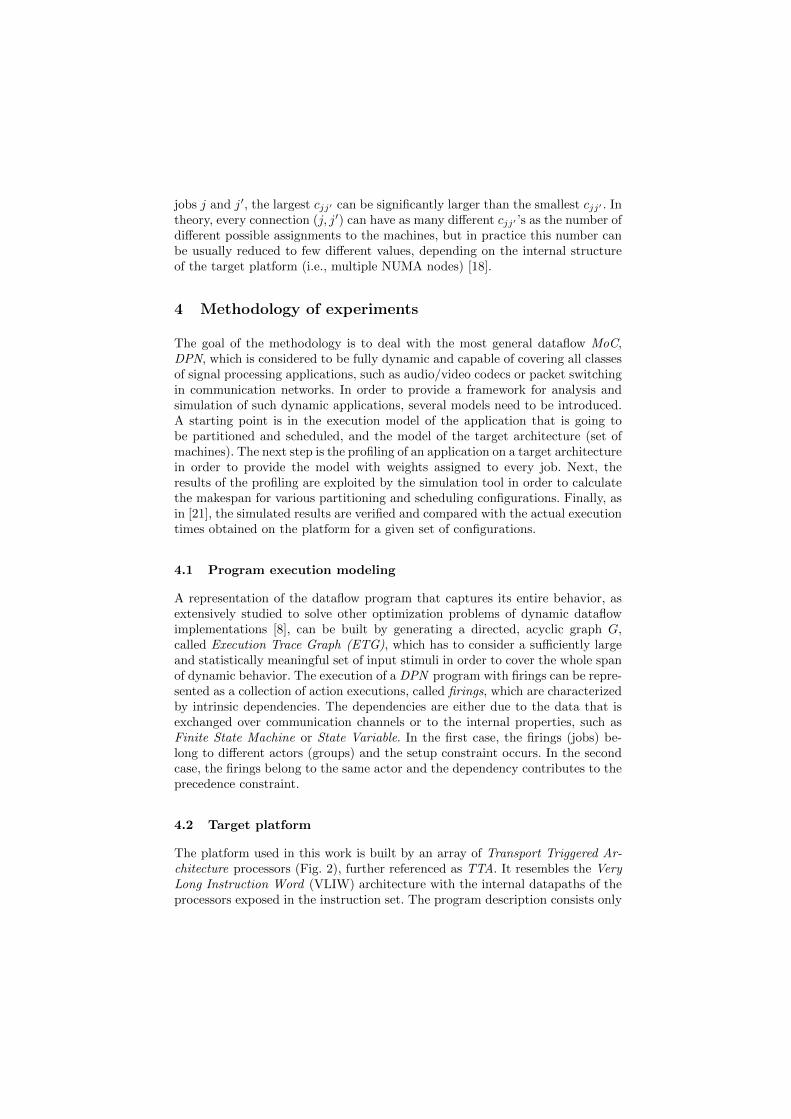
jobs j and j′, the largest cjj′ can be significantly larger than the smallest cjj′ . Intheory, every connection (j, j′) can have as many different cjj′ ’s as the number ofdifferent possible assignments to the machines, but in practice this number canbe usually reduced to few different values, depending on the internal structureof the target platform (i.e., multiple NUMA nodes) [18].
4 Methodology of experiments
The goal of the methodology is to deal with the most general dataflow MoC,DPN, which is considered to be fully dynamic and capable of covering all classesof signal processing applications, such as audio/video codecs or packet switchingin communication networks. In order to provide a framework for analysis andsimulation of such dynamic applications, several models need to be introduced.A starting point is in the execution model of the application that is going tobe partitioned and scheduled, and the model of the target architecture (set ofmachines). The next step is the profiling of an application on a target architecturein order to provide the model with weights assigned to every job. Next, theresults of the profiling are exploited by the simulation tool in order to calculatethe makespan for various partitioning and scheduling configurations. Finally, asin [21], the simulated results are verified and compared with the actual executiontimes obtained on the platform for a given set of configurations.
4.1 Program execution modeling
A representation of the dataflow program that captures its entire behavior, asextensively studied to solve other optimization problems of dynamic dataflowimplementations [8], can be built by generating a directed, acyclic graph G,called Execution Trace Graph (ETG), which has to consider a sufficiently largeand statistically meaningful set of input stimuli in order to cover the whole spanof dynamic behavior. The execution of a DPN program with firings can be repre-sented as a collection of action executions, called firings, which are characterizedby intrinsic dependencies. The dependencies are either due to the data that isexchanged over communication channels or to the internal properties, such asFinite State Machine or State Variable. In the first case, the firings (jobs) be-long to different actors (groups) and the setup constraint occurs. In the secondcase, the firings belong to the same actor and the dependency contributes to theprecedence constraint.
4.2 Target platform
The platform used in this work is built by an array of Transport Triggered Ar-chitecture processors (Fig. 2), further referenced as TTA. It resembles the VeryLong Instruction Word (VLIW) architecture with the internal datapaths of theprocessors exposed in the instruction set. The program description consists only

of the operand transfers between the computational resources. A TTA proces-sor is made of functional units connected by input and output sockets to aninterconnection network consisting of buses [31]. Among several strengths ofthe TTA architecture, the property of highest importance for the sake of thiswork is a simple instruction memory without caches [11, 28]. As far as we areconcerned, this is also the only multiprocessor platform with no significant inter-processor communication penalty. Thus, it allows a validation of an execution- and architecture model with regards to different partitioning and schedulingconfigurations, before the methodology is extended by a figure of merit for thepossibly complex communication time.
Fig. 2. Transport Triggered Architecture model.
The choice of the TTA as a target platform has been also dictated by thequest for the measurable and deterministic processing time of an applicationwith possibly negligible overheads. In fact, the applied profiling methodologyoperates on actors executed in isolation, that is, one actor at a time on a singleprocessor core. Thanks to that, it is possible to apply the profiling only onceand explore its results in various configurations. It is a precious property of theTTA architecture comparing to profiling of other platforms, where the results ofprofiling usually depend on the partitioning configuration and may turn to beinvalid when other configurations are approached [18, 26].
The profiling information is obtained using a minimally intrusive timestamphardware operation taking place on the cycle-accurate TTA simulator [30]. Thelocation of timestamp calls allows to measure the execution time in clock-cyclesfor every action inside the application as well as the overall time spent insideevery actor outside the actual algorithmic parts (actions). This additional timecan be identified with the internal scheduling overhead of an actor. Such a profil-ing seems to be a unique opportunity comparing to other platforms (i.e., NUMAarchitectures), where especially the communication time profiling is a highlytroublesome process [18].
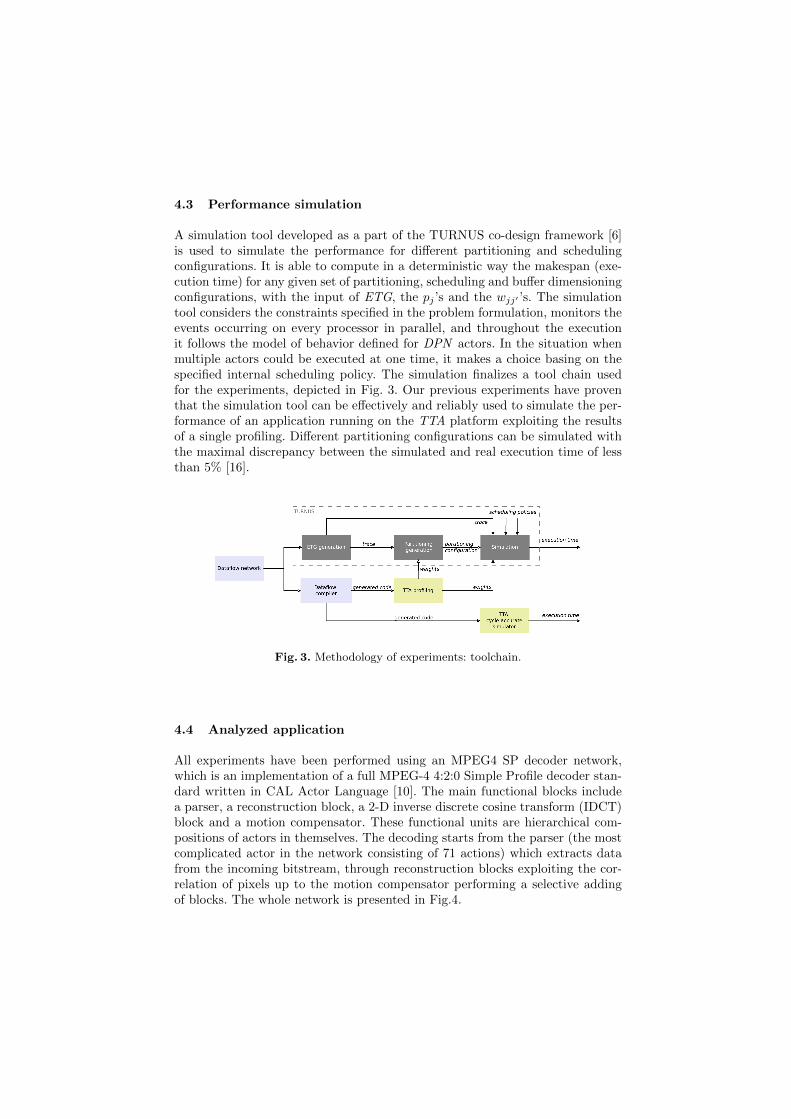
4.3 Performance simulation
A simulation tool developed as a part of the TURNUS co-design framework [6]is used to simulate the performance for different partitioning and schedulingconfigurations. It is able to compute in a deterministic way the makespan (exe-cution time) for any given set of partitioning, scheduling and buffer dimensioningconfigurations, with the input of ETG, the pj ’s and the wjj′ ’s. The simulationtool considers the constraints specified in the problem formulation, monitors theevents occurring on every processor in parallel, and throughout the executionit follows the model of behavior defined for DPN actors. In the situation whenmultiple actors could be executed at one time, it makes a choice basing on thespecified internal scheduling policy. The simulation finalizes a tool chain usedfor the experiments, depicted in Fig. 3. Our previous experiments have proventhat the simulation tool can be effectively and reliably used to simulate the per-formance of an application running on the TTA platform exploiting the resultsof a single profiling. Different partitioning configurations can be simulated withthe maximal discrepancy between the simulated and real execution time of lessthan 5% [16].
Fig. 3. Methodology of experiments: toolchain.
4.4 Analyzed application
All experiments have been performed using an MPEG4 SP decoder network,which is an implementation of a full MPEG-4 4:2:0 Simple Profile decoder stan-dard written in CAL Actor Language [10]. The main functional blocks includea parser, a reconstruction block, a 2-D inverse discrete cosine transform (IDCT)block and a motion compensator. These functional units are hierarchical com-positions of actors in themselves. The decoding starts from the parser (the mostcomplicated actor in the network consisting of 71 actions) which extracts datafrom the incoming bitstream, through reconstruction blocks exploiting the cor-relation of pixels up to the motion compensator performing a selective addingof blocks. The whole network is presented in Fig.4.
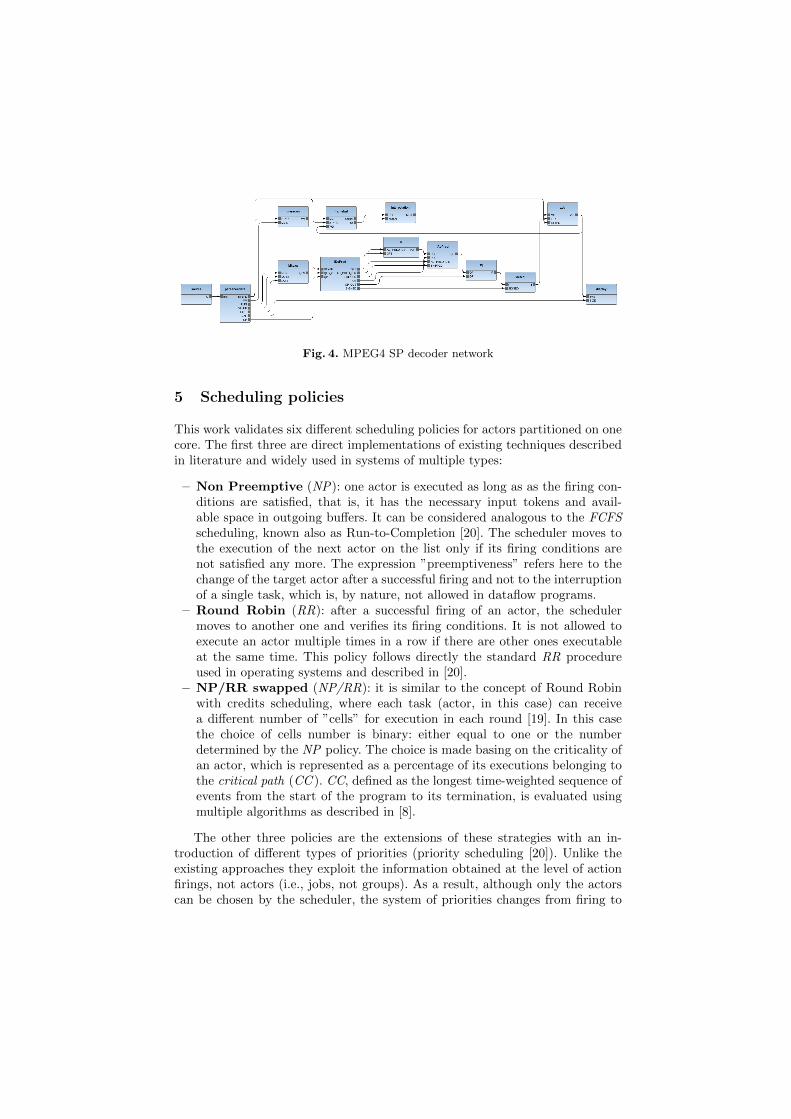
Fig. 4. MPEG4 SP decoder network
5 Scheduling policies
This work validates six different scheduling policies for actors partitioned on onecore. The first three are direct implementations of existing techniques describedin literature and widely used in systems of multiple types:
– Non Preemptive (NP): one actor is executed as long as as the firing con-ditions are satisfied, that is, it has the necessary input tokens and avail-able space in outgoing buffers. It can be considered analogous to the FCFSscheduling, known also as Run-to-Completion [20]. The scheduler moves tothe execution of the next actor on the list only if its firing conditions arenot satisfied any more. The expression ”preemptiveness” refers here to thechange of the target actor after a successful firing and not to the interruptionof a single task, which is, by nature, not allowed in dataflow programs.
– Round Robin (RR): after a successful firing of an actor, the schedulermoves to another one and verifies its firing conditions. It is not allowed toexecute an actor multiple times in a row if there are other ones executableat the same time. This policy follows directly the standard RR procedureused in operating systems and described in [20].
– NP/RR swapped (NP/RR): it is similar to the concept of Round Robinwith credits scheduling, where each task (actor, in this case) can receivea different number of ”cells” for execution in each round [19]. In this casethe choice of cells number is binary: either equal to one or the numberdetermined by the NP policy. The choice is made basing on the criticality ofan actor, which is represented as a percentage of its executions belonging tothe critical path (CC ). CC, defined as the longest time-weighted sequence ofevents from the start of the program to its termination, is evaluated usingmultiple algorithms as described in [8].
The other three policies are the extensions of these strategies with an in-troduction of different types of priorities (priority scheduling [20]). Unlike theexisting approaches they exploit the information obtained at the level of actionfirings, not actors (i.e., jobs, not groups). As a result, although only the actorscan be chosen by the scheduler, the system of priorities changes from firing to
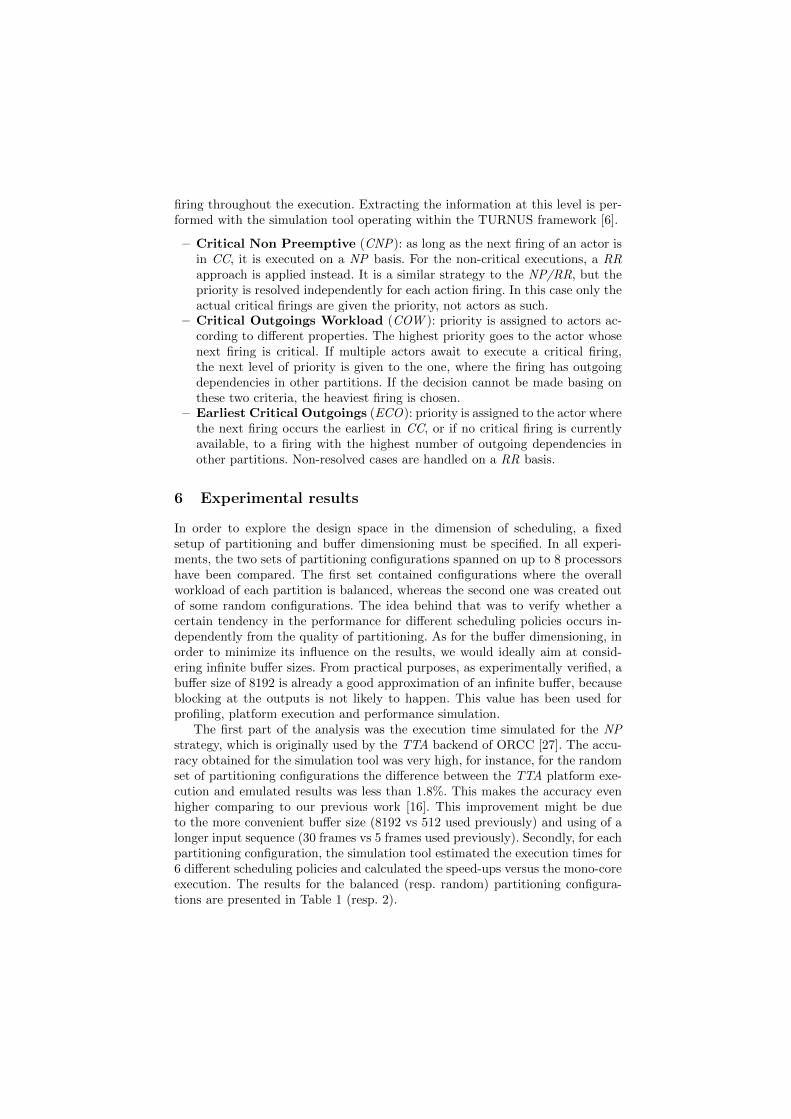
firing throughout the execution. Extracting the information at this level is per-formed with the simulation tool operating within the TURNUS framework [6].
– Critical Non Preemptive (CNP): as long as the next firing of an actor isin CC, it is executed on a NP basis. For the non-critical executions, a RRapproach is applied instead. It is a similar strategy to the NP/RR, but thepriority is resolved independently for each action firing. In this case only theactual critical firings are given the priority, not actors as such.
– Critical Outgoings Workload (COW ): priority is assigned to actors ac-cording to different properties. The highest priority goes to the actor whosenext firing is critical. If multiple actors await to execute a critical firing,the next level of priority is given to the one, where the firing has outgoingdependencies in other partitions. If the decision cannot be made basing onthese two criteria, the heaviest firing is chosen.
– Earliest Critical Outgoings (ECO): priority is assigned to the actor wherethe next firing occurs the earliest in CC, or if no critical firing is currentlyavailable, to a firing with the highest number of outgoing dependencies inother partitions. Non-resolved cases are handled on a RR basis.
6 Experimental results
In order to explore the design space in the dimension of scheduling, a fixedsetup of partitioning and buffer dimensioning must be specified. In all experi-ments, the two sets of partitioning configurations spanned on up to 8 processorshave been compared. The first set contained configurations where the overallworkload of each partition is balanced, whereas the second one was created outof some random configurations. The idea behind that was to verify whether acertain tendency in the performance for different scheduling policies occurs in-dependently from the quality of partitioning. As for the buffer dimensioning, inorder to minimize its influence on the results, we would ideally aim at consid-ering infinite buffer sizes. From practical purposes, as experimentally verified, abuffer size of 8192 is already a good approximation of an infinite buffer, becauseblocking at the outputs is not likely to happen. This value has been used forprofiling, platform execution and performance simulation.
The first part of the analysis was the execution time simulated for the NPstrategy, which is originally used by the TTA backend of ORCC [27]. The accu-racy obtained for the simulation tool was very high, for instance, for the randomset of partitioning configurations the difference between the TTA platform exe-cution and emulated results was less than 1.8%. This makes the accuracy evenhigher comparing to our previous work [16]. This improvement might be dueto the more convenient buffer size (8192 vs 512 used previously) and using of alonger input sequence (30 frames vs 5 frames used previously). Secondly, for eachpartitioning configuration, the simulation tool estimated the execution times for6 different scheduling policies and calculated the speed-ups versus the mono-coreexecution. The results for the balanced (resp. random) partitioning configura-tions are presented in Table 1 (resp. 2).

Table 1. Estimated speed-ups: balanced partitioning configurations
No. of units NP RR NP/RR CNP COW ECO
1 1.00 1.00 1.00 1.00 1.00 1.002 1.78 1.99 1.79 1.70 1.89 1.993 2.27 2.84 2.36 2.31 2.30 2.794 2.72 3.57 2.75 2.68 3.28 3.465 3.14 4.20 3.29 3.62 3.85 4.146 4.41 4.67 4.43 4.67 4.72 4.687 5.04 5.12 4.99 5.14 5.10 5.128 5.41 5.46 5.41 5.47 5.49 5.46
Table 2. Estimated speed-ups: random partitioning configurations
No. of units NP RR NP/RR CNP COW ECO
1 1.00 1.00 1.00 1.00 1.00 1.002 1.61 1.64 1.61 1.54 1.59 1.623 2.30 2.48 2.31 2.19 2.47 2.484 2.59 2.97 2.68 2.45 2.73 2.975 2.84 3.21 2.87 3.03 2.97 3.216 2.73 2.86 2.72 2.82 2.67 2.877 2.83 2.98 2.83 2.85 2.98 2.988 4.47 5.01 4.46 4.70 4.63 5.02
It can be clearly observed that some policies tend to perform much betterthan the others for almost any set of configuration. For example, RR outperformsNP by more than 10% on average, and up to even 25%. The strategies relying onchanging the actor after every execution (RR, COW, ECO) are also in generalmore efficient than NP and its derivatives. Surprisingly, CNP does not performreally well. It can be due to the fact that, as for the scheduling policy, when thecritical firings were given a priority to fire, the critical path might have beenmodified by the concurrent decision of the scheduler. At the higher processorcount all policies start to perform very similarly. It can be due to the fact thatas the average number of actors in one processor decreases, the possible choiceof scheduler becomes limited and less sensitive to the strategy it is using.
Another observation is that the balanced partitioning configurations resultedin much more diversity in the results than the random ones. This can lead to aconclusion that the partitioning problem should be in fact considered dominantover the scheduling problem, as it is responsible for a room for improvementavailable for scheduling policies. The same kind of observation was made inorder and acceptance scheduling problems [23]. For further experiments, the tworelatively extreme strategies RR and NP have been chosen. The scheduler insidethe TTA backend has been modified to perform the scheduling on both NP andRR basis, so that a comparison of performances is possible. The execution timesare presented in Fig. 5 (resp. 6) for balanced (resp. random) configurations.
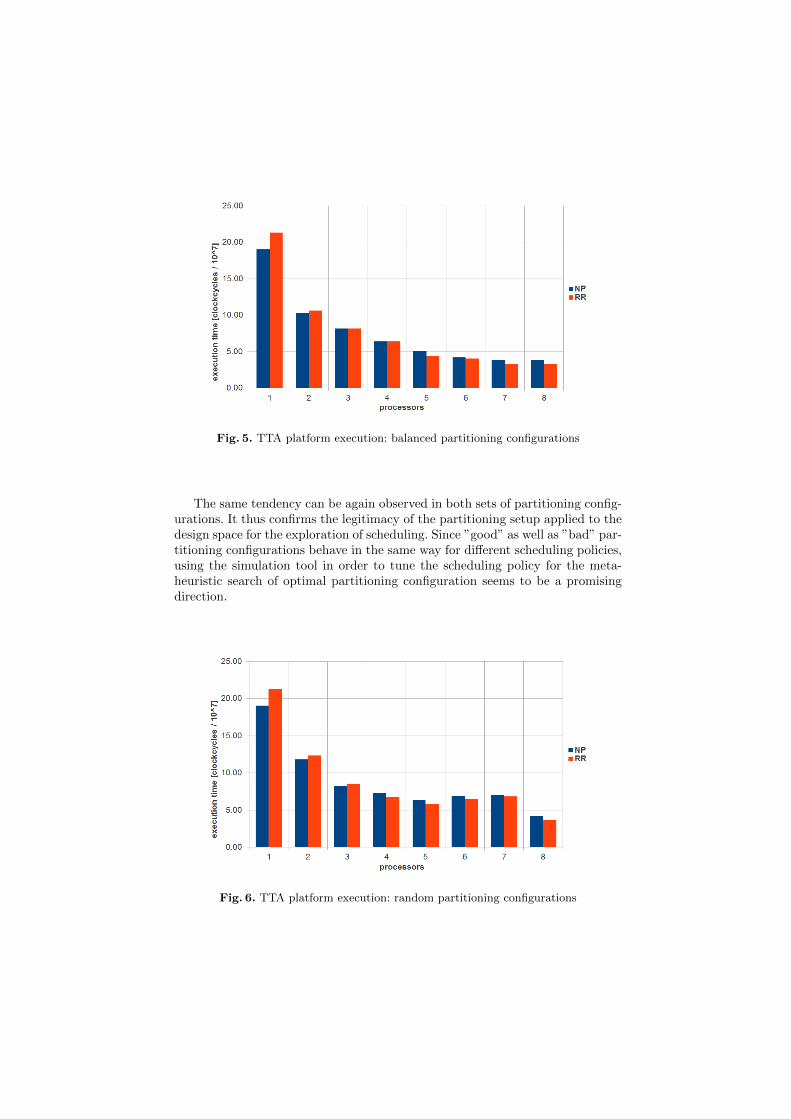
Fig. 5. TTA platform execution: balanced partitioning configurations
The same tendency can be again observed in both sets of partitioning config-urations. It thus confirms the legitimacy of the partitioning setup applied to thedesign space for the exploration of scheduling. Since ”good” as well as ”bad” par-titioning configurations behave in the same way for different scheduling policies,using the simulation tool in order to tune the scheduling policy for the meta-heuristic search of optimal partitioning configuration seems to be a promisingdirection.
Fig. 6. TTA platform execution: random partitioning configurations

At the beginning, that is, up to 3 units, NP outperforms RR. However,the difference between them gradually decreases. From 4 units, RR achieves abetter performance. This phenomenon can by explained by the presence of intra-partition scheduling overhead. This overhead is not measurable according to thecurrent profiling methodology, but we would logically expect it to be proportionalto the number of actors in one partition, since if there are more actors, moreconditions need to be checked at every scheduling decision. Nevertheless, evenin the presence of this unfavorable overhead, the modified scheduler RR broughtup to 14.5% of improvement.
7 Future work
The most promising aspect of our current work is the expansion of differentscheduling approaches to platforms different than TTA with an emphasis onthe NUMA architectures and various heterogeneous platforms. This involvesmuch more advanced profiling methodology and the introduction of the proba-bility model since a bigger notion of uncertainty is present in the architecture,especially regarding the caches. On the other hand, it is highly important tounderstand the differences between the estimated execution times and platformresults and, in particular, investigate if the intra-partition scheduling overheadcan be measured or at least approximated. For this purpose, the goal would beto extend the simulation tool to keep track on the schedulers decision in a moredetailed way, especially in terms of the overall number of firing conditions thatare checked before a successful execution.
In this work, the scheduling strategies are evaluated globally, that is, thesame strategy is defined for every processing unit (partition). It might be usefulto analyze also the opportunity of defining a different scheduling policy for eachpartition, depending on the level of dynamism occurring in the sequencing forevery subset of actors. Finally, having the model extended to cover different ar-chitectures in a generic way, the target will be to use the simulation tool in orderto improve the algorithms for partitioning of dataflow applications. Exploringthe properties and performance potential of different scheduling policies shouldhelp drive the metaheuristic search for a close-to-optimal partitioning.
References
1. Baker, K. R., Trietsch, D.: Principles of Sequencing and Scheduling. Wiley (2009).2. Benini, L., Lombardi, M., Milano, M., Ruggiero. M: Optimal resource allocation
and scheduling for the CELL BE platform. Annals of Operations Research, 51–77(2011).
3. Boutellier, J., Sadhanala, V., Lucarz, C., Brisk, P., Mattavelli, M.: Scheduling ofdataflow models within the reconfigurable video coding framework. IEEE Workshopon Signal Processing Systems, Washington, DC, 182–187 (2008).
4. Boutellier, J., Ersfolk, J., Lilius, J., Mattavelli, M., Roquier, G., Silven, O.: ActorMerging for Dataflow Process Networks. IEEE Transactions on Signal Processing,vol. 63, 2496–2508 (2015).

5. Casale-Brunet, S., Elguindy. A., Bezati, E., Thavot, R., Roquier, G., Mattavelli, M.,Janneck, J. W.: Methods to explore design space for MPEG RMC codec specifica-tions. Signal Processing: Image Communication, vol. 28, 1278–1294 (2013).
6. Casale-Brunet, S., Alberti, C., Mattavelli, M., Janneck, J. W.: TURNUS: a UnifiedDataflow Design Space Exploration Framework for Heterogeneous Parallel Systems.Conference on Design and Architectures for Signal and Image Processing (DASIP),Cagliari, Italy (2013).
7. Casale-Brunet, S., Bezati, E., Alberti, C., Mattavelli, M., Amaldi, E., Janneck, J.W.: Partitioning And Optimization Of High Level Stream Applications For MultiClock Domain Architectures. IEEE Workshop on Signal Processing, Taipei, Taiwan,177–182 (2013).
8. Casale-Brunet, S.: Analysis and optimization of dynamic dataflow programs. PhDThesis at EPFL, Switzerland (2015).
9. Eisenring, M., Teich, J., Thiele, L.: Rapid Prototyping of Dataflow Programs onHardware/Software Architectures. Proc. of HICSS-31, Proc. of the Hawai Int. Conf.on System Sciences, 187–196 (1998).
10. Eker, J., Janneck, J. W.: CAL Language Report. Tech. Memo UCB/ERL M03/48,UC Berkeley (2003).
11. Esko, O., Jaaskelainen, P., Huerta, P., de La Lama, C. S., Takala, J., Martinez, J.I.: Customized exposed datapath soft-core design flow with compiler support. 15thAnnual IEEE International ASIC/SOC Conference, 87–91 (2002).
12. Hirzel, M., Soule, R., Schneider, S., Gedik, B., Grimm, R.: A catalog of StreamProcessing Optimizations. ACM Computing Surveys, vol. 46 (2014).
13. Janneck, J. W.: Actors and their composition. Formal Aspects Comput., vol. 15,349–369 (2003).
14. Lee, E. A., Messerschmitt, D. G. : Static Scheduling of Synchronous Data FlowPrograms for Digital Signal Processing. IEEE Transactions on Computers, vol. C-36,24–35 (1987).
15. Lee, E. A., Parks, T. M.: Dataflow process networks. Proceedings of the IEEE,773–801 (1995).
16. Michalska, M., Boutellier, J., Mattavelli, M.: A methodology for profiling and par-titioning stream programs on many-core architectures. International Conference onComputational Science (ICCS), Procedia Computer Science Ed., 2962–2966 (2015).
17. Pinedo, M.: Scheduling: Theory, Algorithms, and Systems, third edition. PrenticeHall (2008).
18. Selva, M.: Performance Monitoring of Throughput Constrained Dataflow ProgramsExecuted On Shared-Memory Multi-core Architectures. PhD Thesis at INSA Lyon,France (2015).
19. Singh, S.: Round-robin with credits: an improved scheduling strategy for rate-allocation in high-speed packet-switching. Global Telecommunications Conference,GLOBECOM (1994).
20. Silberschatz, A., Galvin, P., Gagne, G: Operating System Concepts. Wiley (2005).
21. Silver, E. A., Zufferey, N.: Inventory Control of an Item with a Probabilistic Replen-ishment Lead Time and a Known Supplier Shutdown Period. International Journalof Production Research 49 (4), 923–947 (2011).
22. Sinnen, O.: Task scheduling for parallel systems. Wiley Series on Parallel andDistributed Computing (2007).
23. Thevenin, S., Zufferey, N., Widmer, M.: Metaheuristics for a Scheduling Problemwith Rejection and Tardiness Penalties. Journal of Scheduling 18 (1), 89–105 (2015).
Thiele, L., Bacivarov, I., Haid, W., Huang, K.: Mapping Applications to Tiled Mul-tiprocessor Embedded Systems. Seventh International Conference on Application ofConcurrency to System Design, 29–40 (2007).
24. Thiele, L., Bacivarov, I., Haid, W., Huang, K.: Mapping Applications to Tiled Mul-tiprocessor Embedded Systems. Seventh International Conference on Application ofConcurrency to System Design, 29–40 (2007).
25. Ullman, J. D.: NP-complete scheduling problems. Journal of Computer and SystemSciences, 384–393 (1975).
26. Weaver, V., Terpstra, D., Moore, S. Non-Determinism and Overcount on ModernHardware Performance Counter Implementations. IEEE International Symposiumon Performance Analysis of Systems and Software, Austin (2013).
27. Yviquel, H., Lorence, A., Jerbi, K., Cocherel, G.: Orcc: Multimedia DevelopmentMade Easys. Proceedings of the 21st ACM International Conference on Multimedia,863–866 (2013).
28. Yviquel, H.: From dataflow-based video coding tools to dedicated embedded multi-core platforms. PhD Thesis at Universite Rennes, France (2013).
29. Yviquel, H., Casseau, E., Raulet, M., Jaaskelainen, P., Takala, J.: Towards run-time actor mapping of dynamic dataflow programs onto multi-core platforms. 8thInternational Symposium on Image and Signal Processing and Analysis (2013).
30. Yviquel, H., Sanchez, A., Jaaskelainen, P., Takala, J., Raulet, M., Casseau, E.:Embedded Multi-Core Systems Dedicated to Dynamic Dataflow Programs. Journalof Signal Processing Systems, 1–16 (2014).
31. TTA-Based Co-design Environment,http://http://tce.cs.tut.fi/tta.html, Last checked: December 2014.

Position Paper: OpenMP scheduling on ARMbig.LITTLE architecture
Anastasiia Butko, Louisa Bessad, David Novo,Florent Bruguier, Abdoulaye Gamatie, Gilles Sassatelli,
Lionel Torres, and Michel Robert
LIRMM (CNRS and University of Montpellier), Montpellier, [email protected]
Abstract. Single-ISA heterogeneous multicore systems are emerging asa promising direction to achieve a more suitable balance between perfor-mance and energy consumption. However, a proper utilization of thesearchitectures is essential to reach the energy benefits. In this paper, wedemonstrate the ineffectiveness of popular OpenMP scheduling policiesexecuting Rodinia benchmark on the Exynos 5 Octa (5422) SoC, whichintegrates the ARM big.LITTLE architecture.
1 Introduction
Traditional CPUs consume just too much power and new solutions are needed toscale up to the ever-growing demand on computational complexity. Accordingly,major efforts are focusing on achieving a more holistic balance between perfor-mance and energy consumption. In this context, heterogeneous multicore archi-tectures are firmly established as the main gateway to higher energy efficiency.Particularly interesting is the concept of single-ISA heterogeneous multicore sys-tems [1], which is an attempt to include heterogeneity at the microarchitecturallevel while preserving a common abstraction to the software stack. In single-ISAheterogeneous multicore systems, all cores execute the same machine code andthus, any core can execute any part of the code. Such model makes it possibleto execute the same OS kernel binary implemented for symmetric Chip Multi-Processors (CMPs) with only minimal configuration changes.
In order to take advantage of single-ISA heterogeneous multicore architec-tures, we need an appropriate strategy to manage the distribution of compu-tation tasks—also known as efficient thread scheduling in multithreading pro-gramming models. OpenMP [2] is a popular programming model that provides ashared memory parallel programming interface. It features a thread-based fork-join task allocation model and various loop scheduling policies to determine theway in which iterations of a parallel loop are assigned to threads.
This paper measures the impact of different loop scheduling policies in a realstate-of-the-art single-ISA heterogeneous multicore system. We use the Exynos 5Octa (5422) System-on-Chip (SoC) [3] integrating the ARM big.LITTLE archi-tecture [4], which couples relatively slower, low-power processor cores (LITTLE)
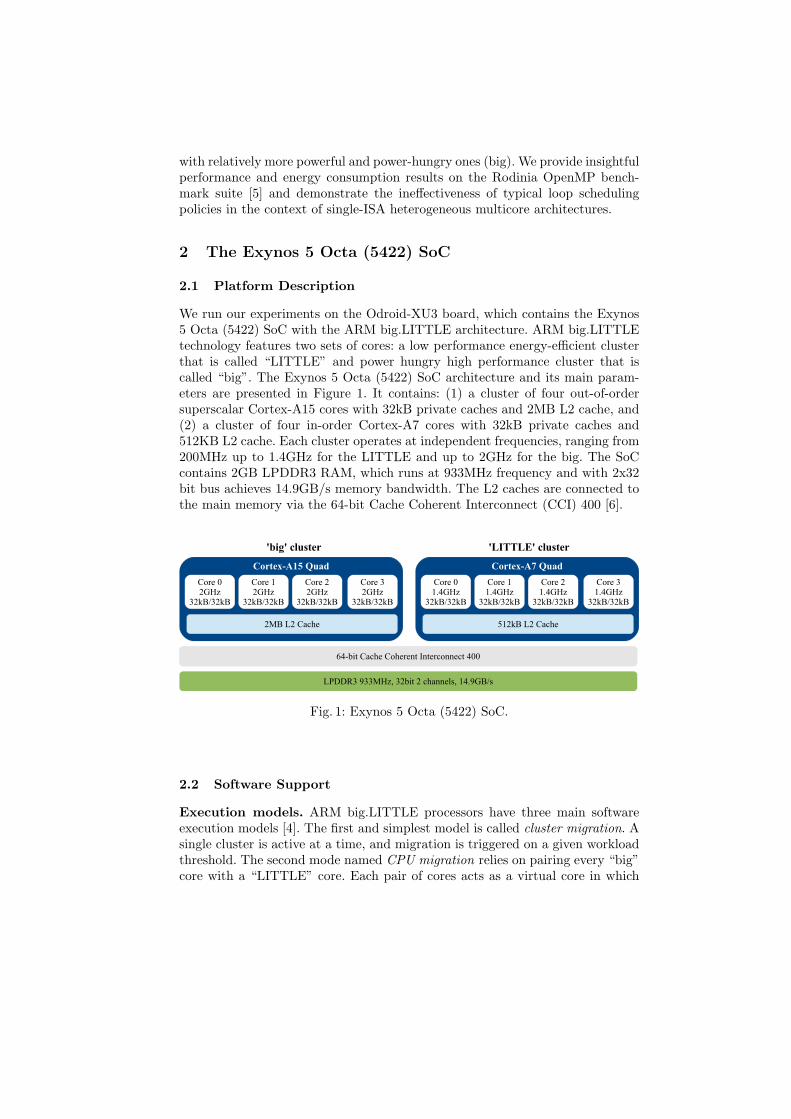
with relatively more powerful and power-hungry ones (big). We provide insightfulperformance and energy consumption results on the Rodinia OpenMP bench-mark suite [5] and demonstrate the ineffectiveness of typical loop schedulingpolicies in the context of single-ISA heterogeneous multicore architectures.
2 The Exynos 5 Octa (5422) SoC
2.1 Platform Description
We run our experiments on the Odroid-XU3 board, which contains the Exynos5 Octa (5422) SoC with the ARM big.LITTLE architecture. ARM big.LITTLEtechnology features two sets of cores: a low performance energy-efficient clusterthat is called “LITTLE” and power hungry high performance cluster that iscalled “big”. The Exynos 5 Octa (5422) SoC architecture and its main param-eters are presented in Figure 1. It contains: (1) a cluster of four out-of-ordersuperscalar Cortex-A15 cores with 32kB private caches and 2MB L2 cache, and(2) a cluster of four in-order Cortex-A7 cores with 32kB private caches and512KB L2 cache. Each cluster operates at independent frequencies, ranging from200MHz up to 1.4GHz for the LITTLE and up to 2GHz for the big. The SoCcontains 2GB LPDDR3 RAM, which runs at 933MHz frequency and with 2x32bit bus achieves 14.9GB/s memory bandwidth. The L2 caches are connected tothe main memory via the 64-bit Cache Coherent Interconnect (CCI) 400 [6].
���������� ��
������
��
��� ����
������
��
��� ����
������
��
��� ����
������
��
��� ����
�� ���������
��������������������������������������
������� ���!���������������"#!���$ � �#
�������� ���� ����������� ����
����������� ��
������
�$��
��� ����
������
�$��
��� ����
������
�$��
��� ����
������
�$��
��� ����
%��� ���������
Fig. 1: Exynos 5 Octa (5422) SoC.
2.2 Software Support
Execution models. ARM big.LITTLE processors have three main softwareexecution models [4]. The first and simplest model is called cluster migration. Asingle cluster is active at a time, and migration is triggered on a given workloadthreshold. The second mode named CPU migration relies on pairing every “big”core with a “LITTLE” core. Each pair of cores acts as a virtual core in which
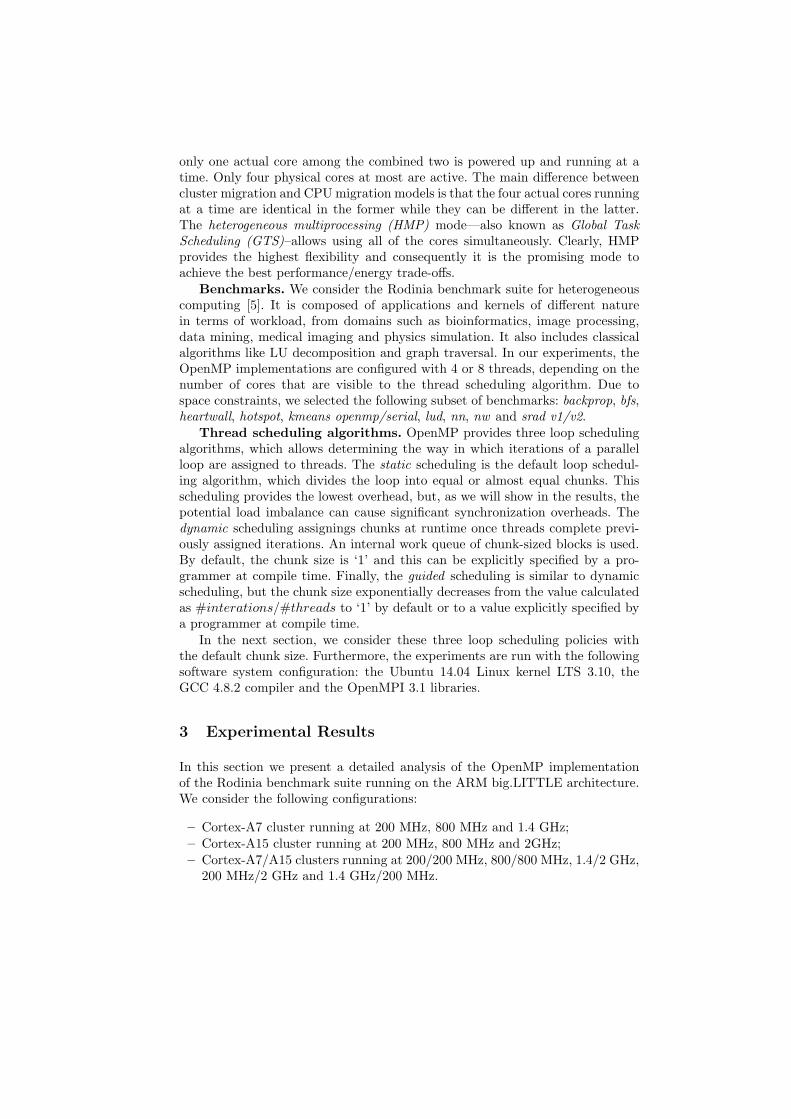
only one actual core among the combined two is powered up and running at atime. Only four physical cores at most are active. The main difference betweencluster migration and CPUmigration models is that the four actual cores runningat a time are identical in the former while they can be different in the latter.The heterogeneous multiprocessing (HMP) mode—also known as Global TaskScheduling (GTS)–allows using all of the cores simultaneously. Clearly, HMPprovides the highest flexibility and consequently it is the promising mode toachieve the best performance/energy trade-offs.
Benchmarks. We consider the Rodinia benchmark suite for heterogeneouscomputing [5]. It is composed of applications and kernels of different naturein terms of workload, from domains such as bioinformatics, image processing,data mining, medical imaging and physics simulation. It also includes classicalalgorithms like LU decomposition and graph traversal. In our experiments, theOpenMP implementations are configured with 4 or 8 threads, depending on thenumber of cores that are visible to the thread scheduling algorithm. Due tospace constraints, we selected the following subset of benchmarks: backprop, bfs,heartwall, hotspot, kmeans openmp/serial, lud, nn, nw and srad v1/v2.
Thread scheduling algorithms. OpenMP provides three loop schedulingalgorithms, which allows determining the way in which iterations of a parallelloop are assigned to threads. The static scheduling is the default loop schedul-ing algorithm, which divides the loop into equal or almost equal chunks. Thisscheduling provides the lowest overhead, but, as we will show in the results, thepotential load imbalance can cause significant synchronization overheads. Thedynamic scheduling assignings chunks at runtime once threads complete previ-ously assigned iterations. An internal work queue of chunk-sized blocks is used.By default, the chunk size is ‘1’ and this can be explicitly specified by a pro-grammer at compile time. Finally, the guided scheduling is similar to dynamicscheduling, but the chunk size exponentially decreases from the value calculatedas #interations/#threads to ‘1’ by default or to a value explicitly specified bya programmer at compile time.
In the next section, we consider these three loop scheduling policies withthe default chunk size. Furthermore, the experiments are run with the followingsoftware system configuration: the Ubuntu 14.04 Linux kernel LTS 3.10, theGCC 4.8.2 compiler and the OpenMPI 3.1 libraries.
3 Experimental Results
In this section we present a detailed analysis of the OpenMP implementationof the Rodinia benchmark suite running on the ARM big.LITTLE architecture.We consider the following configurations:
– Cortex-A7 cluster running at 200 MHz, 800 MHz and 1.4 GHz;– Cortex-A15 cluster running at 200 MHz, 800 MHz and 2GHz;– Cortex-A7/A15 clusters running at 200/200 MHz, 800/800 MHz, 1.4/2 GHz,
200 MHz/2 GHz and 1.4 GHz/200 MHz.

Static Thread Scheduling. Figure 2(a) shows in logarithmic scale themeasured execution time of different configurations using the static schedulingalgorithm. The results are normalized with respect to the slowest configuration,i.e., Cortex-A7 running at 200MHz. As expected, the highest performance istypically achieved by the Cortex-A15 running at 2GHz. For example, a speedupof 21x is observed when running the kmeans openmp in the big cluster. Whenusing the HMP mode to simultaneously run on the big and LITTLE clusters(i.e., A7/A15 in the figure), the execution time is usually slower to that of thebig cluster alone, despite using four additional actives cores. An even higherpenalty is observed when operating the LITTLE cluster at a lower frequency,especially so for the lud, nn and nw applications.
�����������������
��
��
�������������
�����������������
������������������
������������ ������������� �!���! ���!�� "#�"�$�����
%���
� ����&������
���
�
�
�
��
��
(a) Execution time speedup comparison
�����������������
���������������
�����������������
������������������ ��
������������ ������������� �!���! ���!�� "#�"�$�����
%���
� ����&!�'
�����
�����
(b) EtoS comparison
Fig. 2: Normalized speedup using Static scheduling (reference A7 at 200MHz).
Figure 2(b) shows the normalized Energy to Solution (EtoS) measured withthe on-board power monitors present in the Odroid-XU3 board. Results areagain normalized against the reference Cortex-A7 running at 200MHz. We ob-serve, that the Cortex-A7 cluster is generally more energy-efficient than theCortex-A15. Furthermore, the best energy efficiency is achieved when operatingat 800MHz. Besides, we also observe that for a few applications (i.e., bfs, kmeansserial, and srad v1 ) the Cortex-A15 running at 800MHz provides slightly betterEtoS than the reference Cortex-A7 cluster. These applications benefit the mostfrom the A15 out-of-order architecture achieving the largest speedups. This leads
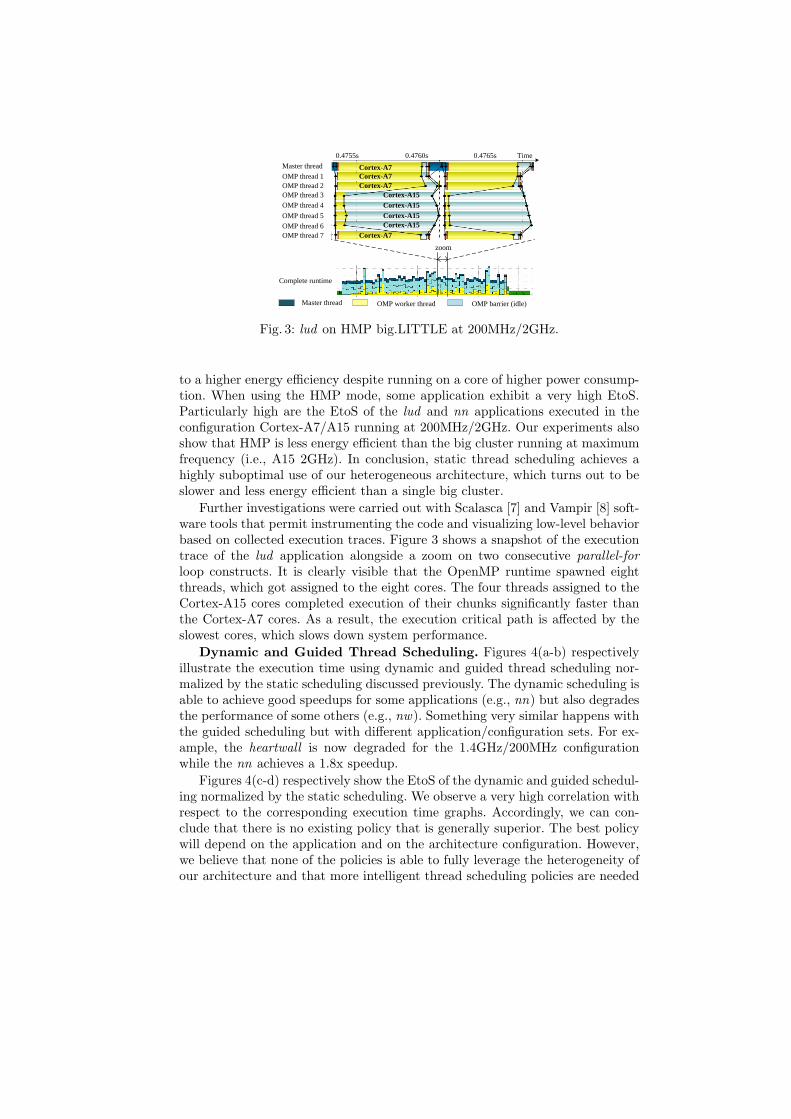
Master thread
OMP thread 1OMP thread 2OMP thread 3
0.4755s
OMP thread 4
OMP thread 5
OMP thread 6OMP thread 7
0.4760s 0.4765s Time
Cortex-A7Cortex-A7Cortex-A7
Cortex-A7
Cortex-A15Cortex-A15Cortex-A15Cortex-A15
Complete runtime
zoom
Master thread OMP worker thread OMP barrier (idle)
Fig. 3: lud on HMP big.LITTLE at 200MHz/2GHz.
to a higher energy efficiency despite running on a core of higher power consump-tion. When using the HMP mode, some application exhibit a very high EtoS.Particularly high are the EtoS of the lud and nn applications executed in theconfiguration Cortex-A7/A15 running at 200MHz/2GHz. Our experiments alsoshow that HMP is less energy efficient than the big cluster running at maximumfrequency (i.e., A15 2GHz). In conclusion, static thread scheduling achieves ahighly suboptimal use of our heterogeneous architecture, which turns out to beslower and less energy efficient than a single big cluster.
Further investigations were carried out with Scalasca [7] and Vampir [8] soft-ware tools that permit instrumenting the code and visualizing low-level behaviorbased on collected execution traces. Figure 3 shows a snapshot of the executiontrace of the lud application alongside a zoom on two consecutive parallel-forloop constructs. It is clearly visible that the OpenMP runtime spawned eightthreads, which got assigned to the eight cores. The four threads assigned to theCortex-A15 cores completed execution of their chunks significantly faster thanthe Cortex-A7 cores. As a result, the execution critical path is affected by theslowest cores, which slows down system performance.
Dynamic and Guided Thread Scheduling. Figures 4(a-b) respectivelyillustrate the execution time using dynamic and guided thread scheduling nor-malized by the static scheduling discussed previously. The dynamic scheduling isable to achieve good speedups for some applications (e.g., nn) but also degradesthe performance of some others (e.g., nw). Something very similar happens withthe guided scheduling but with different application/configuration sets. For ex-ample, the heartwall is now degraded for the 1.4GHz/200MHz configurationwhile the nn achieves a 1.8x speedup.
Figures 4(c-d) respectively show the EtoS of the dynamic and guided schedul-ing normalized by the static scheduling. We observe a very high correlation withrespect to the corresponding execution time graphs. Accordingly, we can con-clude that there is no existing policy that is generally superior. The best policywill depend on the application and on the architecture configuration. However,we believe that none of the policies is able to fully leverage the heterogeneity ofour architecture and that more intelligent thread scheduling policies are needed
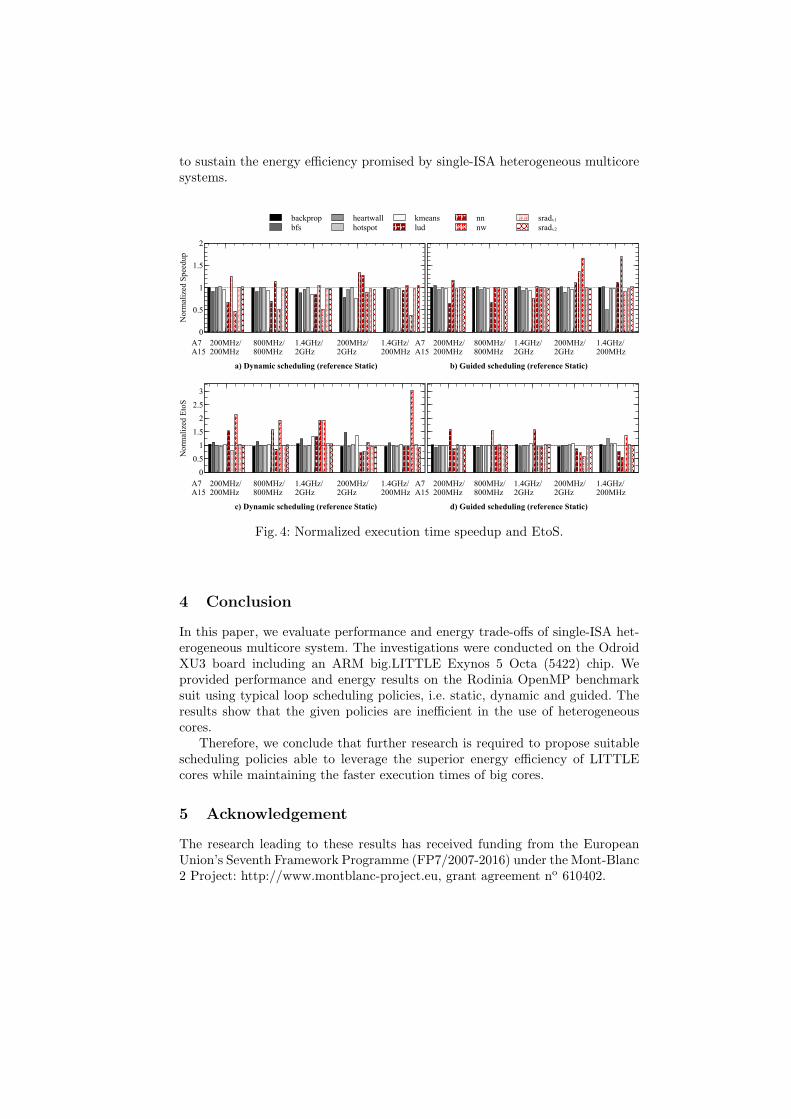
to sustain the energy efficiency promised by single-ISA heterogeneous multicoresystems.
����������������� �����������������
����������������������� ����� �������������������������
����������������������� ����� �������������������������
����������������� �����������������
���������������� �����������������
����������������������� ����� �������������������������
����
�����������
�
�
��
�
��
�
����������������� �����������������
����������������������� ����� �������������������������
��� !��!
�"#
$����%���
$��#!��
���&#
�'�
&&
&%
#���(�#���(�
����
��������!���'!
�
�
��
�
Fig. 4: Normalized execution time speedup and EtoS.
4 Conclusion
In this paper, we evaluate performance and energy trade-offs of single-ISA het-erogeneous multicore system. The investigations were conducted on the OdroidXU3 board including an ARM big.LITTLE Exynos 5 Octa (5422) chip. Weprovided performance and energy results on the Rodinia OpenMP benchmarksuit using typical loop scheduling policies, i.e. static, dynamic and guided. Theresults show that the given policies are inefficient in the use of heterogeneouscores.
Therefore, we conclude that further research is required to propose suitablescheduling policies able to leverage the superior energy efficiency of LITTLEcores while maintaining the faster execution times of big cores.
5 Acknowledgement
The research leading to these results has received funding from the EuropeanUnion’s Seventh Framework Programme (FP7/2007-2016) under the Mont-Blanc2 Project: http://www.montblanc-project.eu, grant agreement no 610402.
References
1. R. Kumar, D. M. Tullsen, P. Ranganathan, N. P. Jouppi, and K. I. Farkas,“Single-isa heterogeneous multi-core architectures for multithreaded workload per-formance,” in Proceedings of the 31st Annual International Symposium on ComputerArchitecture, ISCA ’04, (Washington, DC, USA), pp. 64–, IEEE Computer Society,2004.
2. O. A. R. Board, “The openmp api specification for parallel programming.”http://openmp.org/wp/, November 2015.
3. Samsung, “Exynos Octa SoC.” https://http://www.samsung.com/, November2015.
4. B. Jeff, “big.little technology moves towards fully heterogeneous global task schedul-ing.” http://www.arm.com/files/pdf/, November 2013.
5. S. Che, M. Boyer, J. Meng, D. Tarjan, J. Sheaffer, S.-H. Lee, and K. Skadron,“Rodinia: A benchmark suite for heterogeneous computing,” in Workload Charac-terization, 2009. IISWC 2009. IEEE International Symposium on, pp. 44–54, Oct2009.
6. ARM, CoreLink CCI-400 Cache Coherent Interconnect Technical Reference Manual,November 16 2012. Revision r1p1.
7. “Scalasca.” http://www.scalasca.org/, November 2015.8. “Vampir - performance optimization.” https://www.vampir.eu/, November 2015.

Collaborative design and optimizationusing Collective Knowledge
Anton Lokhmotov1 and Grigori Fursin1,2
1 dividiti, UK 2 cTuning foundation, France
Abstract. Designing faster, more energy efficient and reliable computersystems requires effective collaboration between hardware designers, sys-tem programmers and performance analysts, as well as feedback fromsystem users. We present Collective Knowledge (CK), an open frame-work for reproducible and collaborative design and optimization. CKenables systematic and reproducible experimentation, combined withleading edge predictive analytics to gain valuable insights into systemperformance. The modular architecture of CK helps engineers create andshare entire experimental workflows involving modules such as tools, pro-grams, data sets, experimental results, predictive models and so on. Weencourage a wide community, including system engineers and users, toshare and reuse CK modules to fuel R&D on increasing the efficiencyand decreasing the costs of computing everywhere.
1 Introduction
1.1 The need for collaboration
Designing faster, more energy efficient and reliable computer systems requireseffective collaboration between several groups of engineers, for example:
– hardware designers develop and optimize hardware, and provide low-leveltools to analyze their behavior such as simulators and profilers with eventcounters;
– system programmers port to new hardware and then optimize proprietaryor open-source compilers (e.g. LLVM, GCC) and libraries (e.g. OpenCL,1
OpenVX,2 OpenCV,3 Caffe,4 BLAS5);– performance analysts collect benchmarks and representative workloads, and
automate running them on new hardware.
In our experience, the above groups still collaborate infrequently (e.g. onachieving development milestones), despite the widely recognized virtues of hard-ware/software co-design [1]. Moreover, the effectiveness of collaboration typically
1 Khronos Group’s standard API for heterogeneous systems: khronos.org/opencl2 Khronos Group’s standard API for computer vision: khronos.org/openvx3 Open library for computer vision: opencv.org4 Open library for deep learning: caffe.berkeleyvision.org5 Standard API for linear algebra: netlib.org/blas

depends on the proactivity and diligence of individual engineers, the level of in-vestment into collaboration tools, the pressure exerted by customers and users,and so on. Ineffective collaboration could perhaps be tolerated many decadesago when design and optimization choices were limited. Today systems are socomplex that any seemingly insignificant choice can lead to dramatic degrada-tion of performance and other important characteristics [2,3,4,5]. To mitigatecommercial risks, companies develop proprietary infrastructures for testing andperformance analysis, and bear the associated maintenance costs.
For example, whenever a performance analyst reports a performance issue,she should provide the program code along with instructions for how to buildand run it, and the experimental conditions (e.g. the hardware and compiler re-visions). Reproducing the reported issue may take many days, while omitting asingle condition in the report may lead to frustrating back-and-forth communi-cation and further time being wasted. Dealing with a performance issue reportedby a user is even harder: the corresponding experimental conditions need to beelicited from the user (or guessed), the program code and build scripts importedinto the proprietary infrastructure, the environment painstakingly reconstructed,etc.
Ineffective collaboration wastes precious resources and runs the risk of de-signing uncompetitive computer systems.
1.2 The need for representative workloads
The conclusions of performance analysis intrinsically depend on the workloadsselected for evaluation [6]. Several companies devise and license benchmark suitesbased on their guesses of what representative workloads might be in the near fu-ture. Since benchmarking is their primary business, their programs, data sets andmethodology often go unchallenged, with the benchmarking scores driving thepurchasing decisions both of OEMs (e.g. phone manufacturers) and consumers(e.g. phone users). When stakes are that high, the vendors have no choice but tooptimize their products for the commercial benchmarks. When those turn outto have no close resemblance to real workloads, the products underperform.
Leading academics have long recognized the need for representative work-loads to drive research in hardware design and software tools [7,8]. With fund-ing agencies increasingly requiring academics to demonstrate impact, academicshave the right incentives to share representative workloads and data sets withthe community.
Incentives to share representative workloads may be somewhat different forindustry. Consider the example of Realeyes,6 a participant in the EU CARPproject.7 Recognizing the value of collaborative R&D, Realeyes released undera permissive license a benchmark comprised of several standard image process-ing algorithms used in their pipeline for evaluating human emotions [9]. Now
6 realeyesit.com7 carpproject.eu
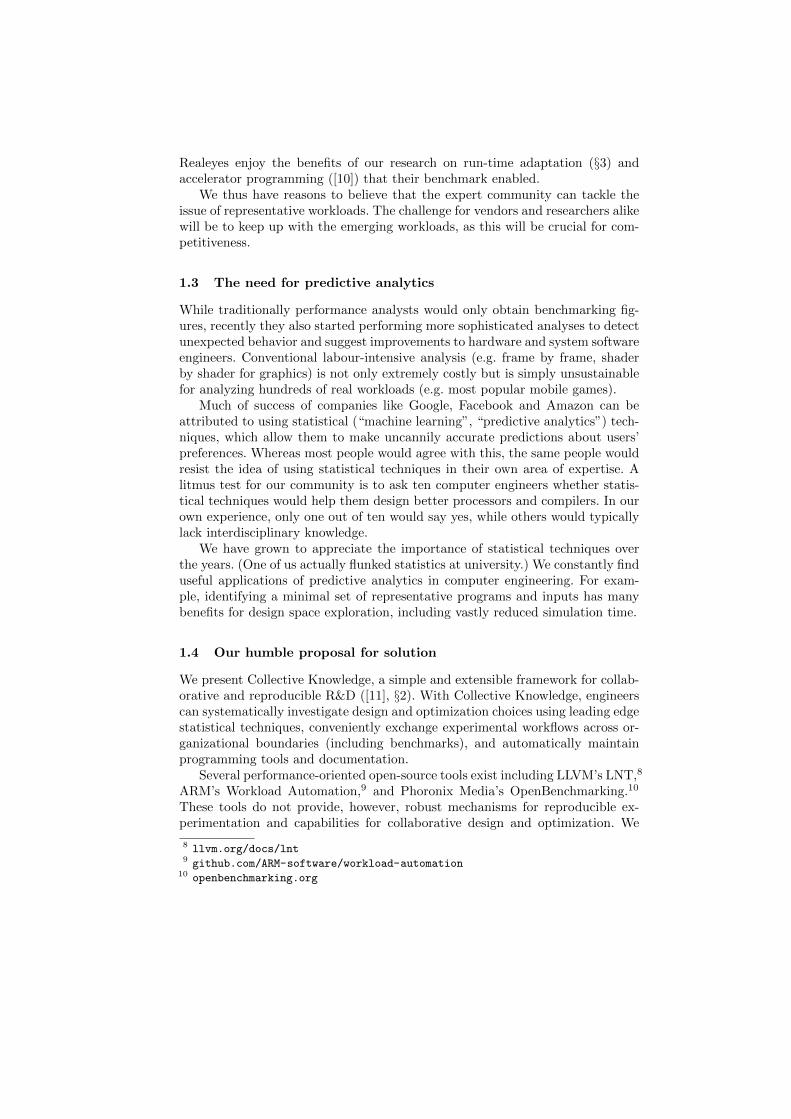
Realeyes enjoy the benefits of our research on run-time adaptation (§3) andaccelerator programming ([10]) that their benchmark enabled.
We thus have reasons to believe that the expert community can tackle theissue of representative workloads. The challenge for vendors and researchers alikewill be to keep up with the emerging workloads, as this will be crucial for com-petitiveness.
1.3 The need for predictive analytics
While traditionally performance analysts would only obtain benchmarking fig-ures, recently they also started performing more sophisticated analyses to detectunexpected behavior and suggest improvements to hardware and system softwareengineers. Conventional labour-intensive analysis (e.g. frame by frame, shaderby shader for graphics) is not only extremely costly but is simply unsustainablefor analyzing hundreds of real workloads (e.g. most popular mobile games).
Much of success of companies like Google, Facebook and Amazon can beattributed to using statistical (“machine learning”, “predictive analytics”) tech-niques, which allow them to make uncannily accurate predictions about users’preferences. Whereas most people would agree with this, the same people wouldresist the idea of using statistical techniques in their own area of expertise. Alitmus test for our community is to ask ten computer engineers whether statis-tical techniques would help them design better processors and compilers. In ourown experience, only one out of ten would say yes, while others would typicallylack interdisciplinary knowledge.
We have grown to appreciate the importance of statistical techniques overthe years. (One of us actually flunked statistics at university.) We constantly finduseful applications of predictive analytics in computer engineering. For exam-ple, identifying a minimal set of representative programs and inputs has manybenefits for design space exploration, including vastly reduced simulation time.
1.4 Our humble proposal for solution
We present Collective Knowledge, a simple and extensible framework for collab-orative and reproducible R&D ([11], §2). With Collective Knowledge, engineerscan systematically investigate design and optimization choices using leading edgestatistical techniques, conveniently exchange experimental workflows across or-ganizational boundaries (including benchmarks), and automatically maintainprogramming tools and documentation.
Several performance-oriented open-source tools exist including LLVM’s LNT,8
ARM’s Workload Automation,9 and Phoronix Media’s OpenBenchmarking.10
These tools do not provide, however, robust mechanisms for reproducible ex-perimentation and capabilities for collaborative design and optimization. We
8 llvm.org/docs/lnt9 github.com/ARM-software/workload-automation
10 openbenchmarking.org
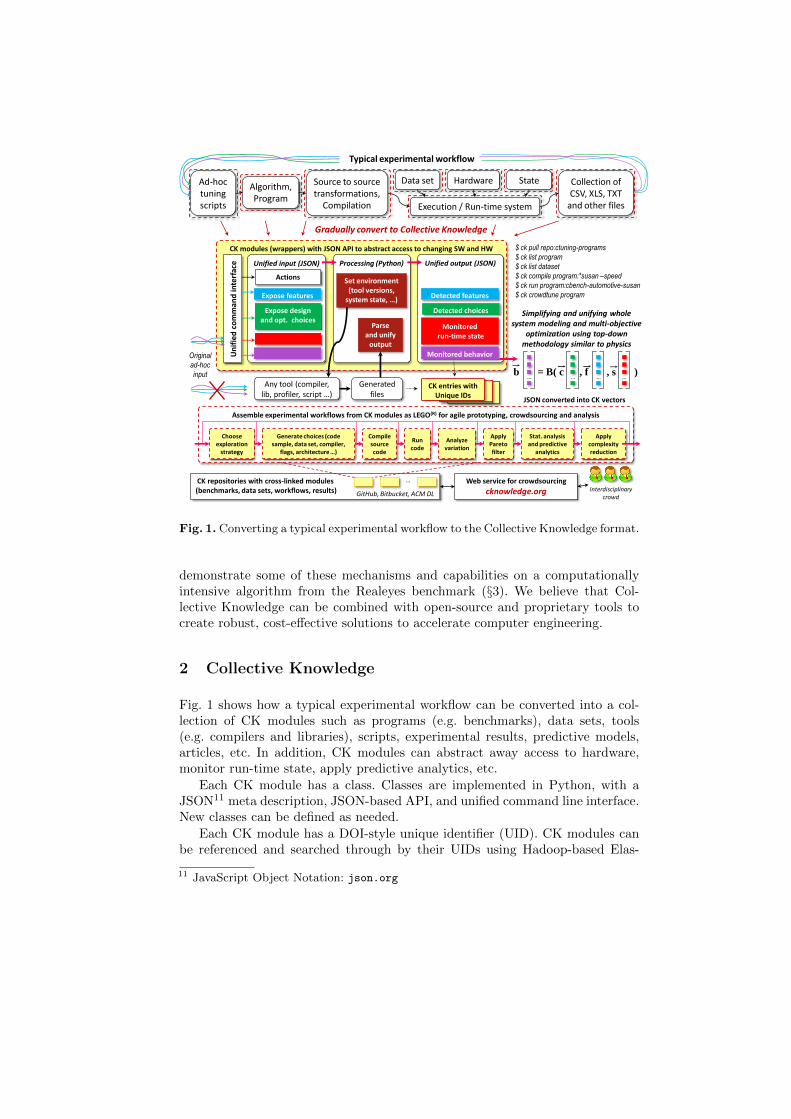
CK modules (wrappers) with JSON API to abstract access to changing SW and HW
Unified input (JSON)
Un
ifie
d c
om
ma
nd
inte
rfac
e
Any tool (compiler, lib, profiler, script …)
Expose design and opt. choices
Expose features
Actions
Processing (Python)
Generated files
Set environment (tool versions,
system state, …)
Parse and unify
output
Unified output (JSON)
Monitored behavior
Detected choices
Detected features
Monitored run-time state
Original
ad-hoc
input b = B( c , f , s ) … … … …
Simplifying and unifying whole system modeling and multi-objective
optimization using top-down methodology similar to physics
JSON converted into CK vectors
Assemble experimental workflows from CK modules as LEGO(R) for agile prototyping, crowdsourcing and analysis
CK repositories with cross-linked modules (benchmarks, data sets, workflows, results)
Web service for crowdsourcing
cknowledge.org Interdisciplinary crowd
Choose exploration
strategy
Generate choices (code sample, data set, compiler,
flags, architecture …)
Compile source code
Run code
Analyze variation
Apply Pareto filter
Stat. analysis and predictive
analytics
Apply complexity reduction
…
Ad-hoc tuning scripts
Collection of CSV, XLS, TXT
and other files
Typical experimental workflow
Algorithm, Program
Source to source transformations,
Compilation
Data set Hardware State
Execution / Run-time system
GitHub, Bitbucket, ACM DL
$ ck pull repo:ctuning-programs
$ ck list program
$ ck list dataset
$ ck compile program:*susan –speed
$ ck run program:cbench-automotive-susan
$ ck crowdtune program
CK entries with UID
CK entries with UID
CK entries with Unique IDs
Gradually convert to Collective Knowledge
Fig. 1. Converting a typical experimental workflow to the Collective Knowledge format.
demonstrate some of these mechanisms and capabilities on a computationallyintensive algorithm from the Realeyes benchmark (§3). We believe that Col-lective Knowledge can be combined with open-source and proprietary tools tocreate robust, cost-effective solutions to accelerate computer engineering.
2 Collective Knowledge
Fig. 1 shows how a typical experimental workflow can be converted into a col-lection of CK modules such as programs (e.g. benchmarks), data sets, tools(e.g. compilers and libraries), scripts, experimental results, predictive models,articles, etc. In addition, CK modules can abstract away access to hardware,monitor run-time state, apply predictive analytics, etc.
Each CK module has a class. Classes are implemented in Python, with aJSON11 meta description, JSON-based API, and unified command line interface.New classes can be defined as needed.
Each CK module has a DOI-style unique identifier (UID). CK modules canbe referenced and searched through by their UIDs using Hadoop-based Elas-
11 JavaScript Object Notation: json.org

ticsearch.12 CK modules can be flexibly combined into experimental workflows,similar to playing with LEGO R© modules.
Engineers can share CK workflows complete with all their modules via repos-itories such as GitHub. Other engineers can reproduce an experiment under thesame or similar conditions using a single CK command. Importantly, if the otherengineers are unable to reproduce an experiment due to uncaptured dependencies(e.g. on run-time state), they can “debug” the workflow and share the “fixed”workflow back (possibly with new extensions, experiments, models, etc.)
Collaborating groups of engineers are thus able to gradually expose in a uni-fied way multi-dimensional design and optimization choices c of all modules,their features f, dependencies on other modules, run-time state s and observedbehavior b, as shown in Fig. 1 and described in detail in [12,13]. This, in turn,enables collaboration on the most essential question of computer engineering:how to optimize any given computation in terms of performance, power con-sumption, resource usage, accuracy, resiliency and cost; in other words, how tolearn and optimize the behavior function B :
b = B(c, f , s)
2.1 Systematic benchmarking
Collective Knowledge supports systematic benchmarking of a program’s perfor-mance profile under reproducible conditions, with the experimental results beingaggregated in a local or remote CK repository. Engineers gradually improve re-producibility of CK benchmarking by implementing CK modules to set run-timestate and monitor unexpected behavior across participating systems.
For example, on mobile devices, unexpected performance variation can of-ten be attributed to dynamic voltage and frequency scaling (DVFS). Mobiledevices have power and temperature limits to prevent device damage; in ad-dition, when a workload’s computational requirements can still be met at alower frequency, lowering the frequency conserves energy. Further complicationsarise when benchmarking on heterogeneous multicore systems such as ARMbig.LITTLE: in a short time, a workload can migrate between cores having dif-ferent microarchitectures, as well as running at different frequencies. Controllingfor such factors (or at least accounting for them with elementary statistics) iskey to meaningful performance evaluation on mobile devices.
3 Example
Systematically collecting performance data that can be trusted is essential butdoes not by itself produce insights. The Collective Knowledge approach permitsto seamlessly apply leading edge statistical techniques on the collected data, thusconverting “raw data” into “useful insights”.
12 Open-source distributed real-time search and analytics: elastic.co

Platform CPU (ARM) GPU (ARM)
Chromebook 1 Cortex-A15×2 Mali-T604×4
Chromebook 2 Cortex-A15×4 Mali-T628×4
Table 1. Experimental platforms: Samsung Chromebooks 1 (XE303C12, 2012) and 2(XE503C12, 2014). Notation: “processor architecture” × “number of cores”.
Consider the Histogram of Oriented Gradients (HOG), a widely used com-puter vision algorithm for detecting objects [14]. Realeyes deploy HOG in severalstages of their image processing pipeline. Different stages use different “flavours”of HOG, considerably varying in their computational requirements. For exam-ple, one stage of the pipeline may invoke HOG on a small-sized image but witha high amount of computation per pixel (“computational intensity”); anotherstage, may invoke HOG on a medium-sized image but with low computationalintensity. In addition, the Realeyes pipeline may be customized differently forrunning on mobile devices (e.g. phones), personal computers (e.g. laptops) or inthe cloud.
In this paper, we use two versions of HOG: an OpenCV-based CPU imple-mentation (with TBB parallelization) and a hand-written OpenCL implementa-tion (data parallel kernel).13 Suppose we are interested in optimizing the execu-tion time of HOG.14 Computing HOG on the GPU is typically faster than on theCPU. The total GPU execution time (including the memory transfer overhead),however, may exceed the CPU execution time.
Figure 2 shows a performance surface plot for one flavour of HOG with DVFSdisabled and the processors’ frequencies controlled for. The X and Y axis showthe CPU and the GPU frequencies, while the Z axis shows the CPU executiontime divided by the total GPU execution time. When this ratio is greater than 1(the light pink to bright red areas), using the GPU is faster than using the CPU,despite the memory transfer overhead. A sensible scheduling decision, therefore,is to schedule the workload on the GPU.
While it may be possible to infer when to use the GPU from this plot (justavoid the light blue to navy areas), what if the performance also depends onother factors as well as the processors’ frequencies? Will we still be able to makesensible scheduling decisions most of the time?
To answer this question, we conducted multiple experiments with HOG (1×1cells) on two Chromebook platforms (see Table 1). The experiments covered theCartesian product of the CPU and GPU frequencies available on both platforms(CPU: 1600 MHz, 800 MHz; GPU: 533 MHz, 266 MHz), 3 block size (16, 64,128), 23 images (in different shapes and sizes), for the total of 276 samples (with5 repetitions each).
13 The related CK repository is at github.com/ctuning/reproduce-carp-project.14 We can also consider multi-objective optimization e.g. finding appropriate trade-offs
between execution time vs. energy consumption vs. cost.
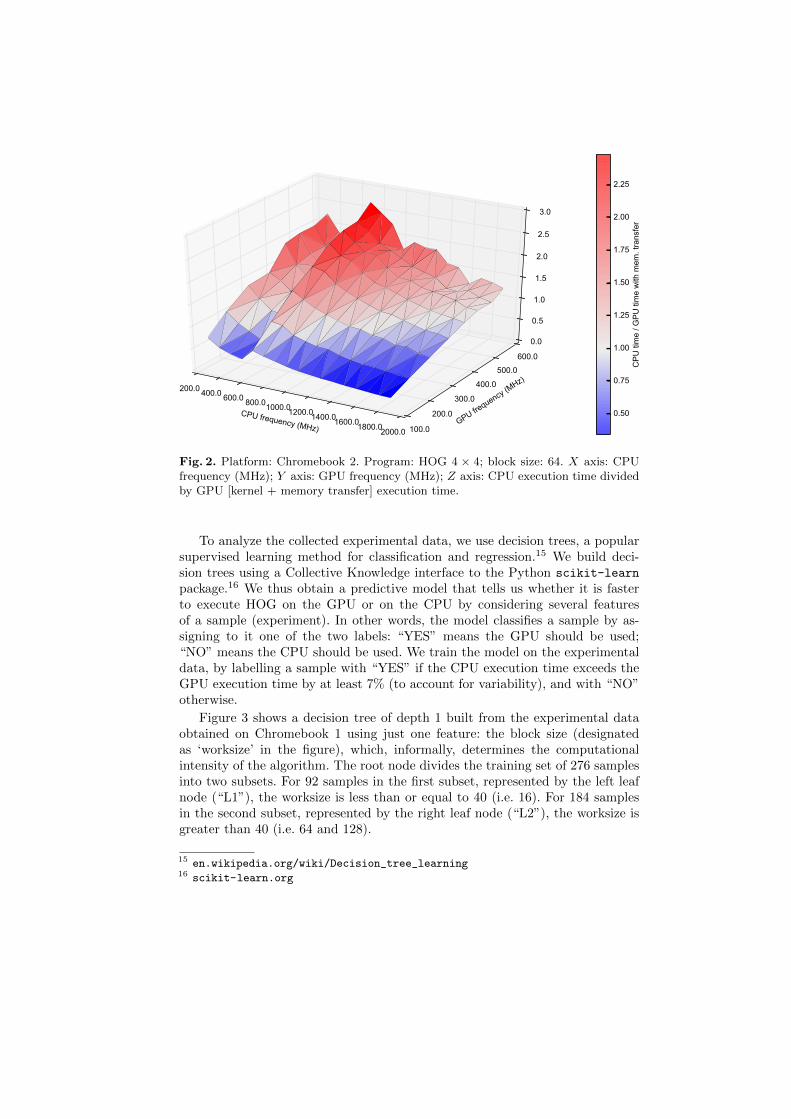
CPU frequency (MHz)
200.0 400.0 600.0 800.01000.01200.01400.01600.01800.02000.0GPU fre
quency (MHz)
100.0
200.0
300.0
400.0
500.0
600.0
0.0
0.5
1.0
1.5
2.0
2.5
3.0
0.50
0.75
1.00
1.25
1.50
1.75
2.00
2.25
CP
U ti
me
/ GP
U ti
me
with
mem
. tra
nsfe
r
Fig. 2. Platform: Chromebook 2. Program: HOG 4 × 4; block size: 64. X axis: CPUfrequency (MHz); Y axis: GPU frequency (MHz); Z axis: CPU execution time dividedby GPU [kernel + memory transfer] execution time.
To analyze the collected experimental data, we use decision trees, a popularsupervised learning method for classification and regression.15 We build deci-sion trees using a Collective Knowledge interface to the Python scikit-learn
package.16 We thus obtain a predictive model that tells us whether it is fasterto execute HOG on the GPU or on the CPU by considering several featuresof a sample (experiment). In other words, the model classifies a sample by as-signing to it one of the two labels: “YES” means the GPU should be used;“NO” means the CPU should be used. We train the model on the experimentaldata, by labelling a sample with “YES” if the CPU execution time exceeds theGPU execution time by at least 7% (to account for variability), and with “NO”otherwise.
Figure 3 shows a decision tree of depth 1 built from the experimental dataobtained on Chromebook 1 using just one feature: the block size (designatedas ‘worksize’ in the figure), which, informally, determines the computationalintensity of the algorithm. The root node divides the training set of 276 samplesinto two subsets. For 92 samples in the first subset, represented by the left leafnode (“L1”), the worksize is less than or equal to 40 (i.e. 16). For 184 samplesin the second subset, represented by the right leaf node (“L2”), the worksize isgreater than 40 (i.e. 64 and 128).
15 en.wikipedia.org/wiki/Decision_tree_learning16 scikit-learn.org
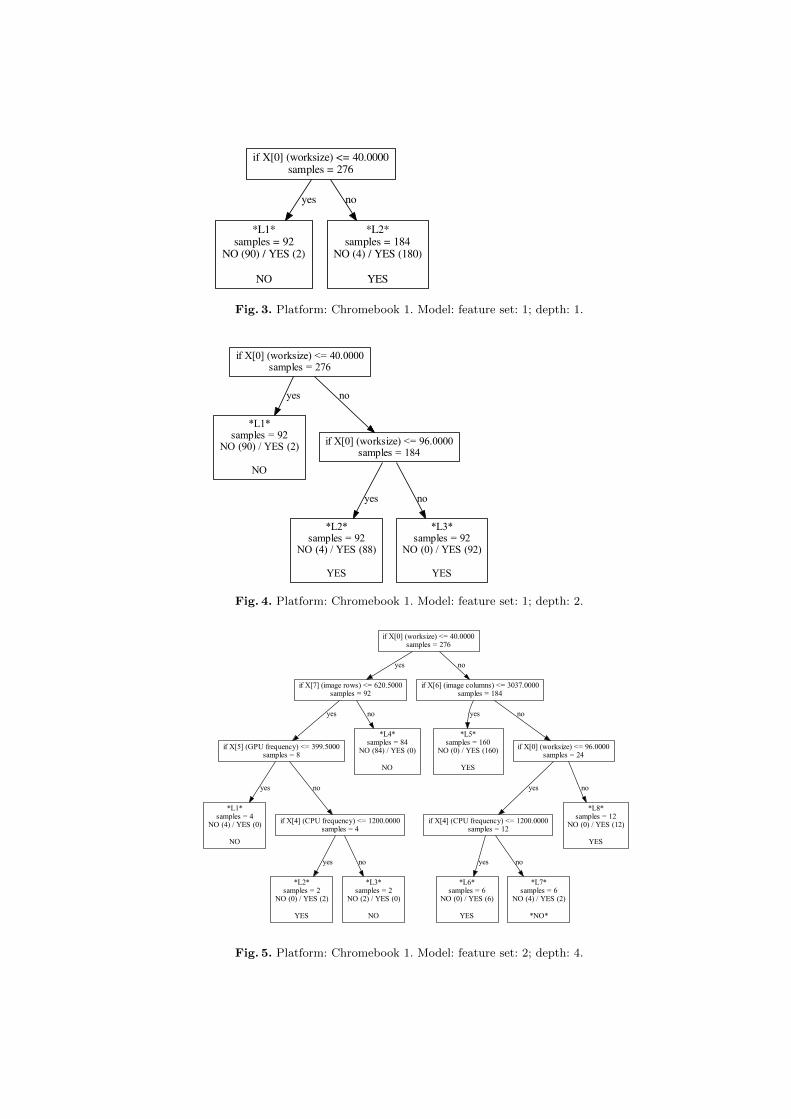
if X[0] (worksize) <= 40.0000samples = 276
*L1*samples = 92
NO (90) / YES (2)
NO
yes
*L2*samples = 184
NO (4) / YES (180)
YES
no
Fig. 3. Platform: Chromebook 1. Model: feature set: 1; depth: 1.
if X[0] (worksize) <= 40.0000samples = 276
*L1*samples = 92
NO (90) / YES (2)
NO
yes
if X[0] (worksize) <= 96.0000samples = 184
no
*L2*samples = 92
NO (4) / YES (88)
YES
yes
*L3*samples = 92
NO (0) / YES (92)
YES
no
Fig. 4. Platform: Chromebook 1. Model: feature set: 1; depth: 2.
if X[0] (worksize) <= 40.0000samples = 276
if X[7] (image rows) <= 620.5000samples = 92
yes
if X[6] (image columns) <= 3037.0000samples = 184
no
if X[5] (GPU frequency) <= 399.5000samples = 8
yes
*L4*samples = 84
NO (84) / YES (0)
NO
no
*L1*samples = 4
NO (4) / YES (0)
NO
yes
if X[4] (CPU frequency) <= 1200.0000samples = 4
no
*L2*samples = 2
NO (0) / YES (2)
YES
yes
*L3*samples = 2
NO (2) / YES (0)
NO
no
*L5*samples = 160
NO (0) / YES (160)
YES
yes
if X[0] (worksize) <= 96.0000samples = 24
no
if X[4] (CPU frequency) <= 1200.0000samples = 12
yes
*L8*samples = 12
NO (0) / YES (12)
YES
no
*L6*samples = 6
NO (0) / YES (6)
YES
yes
*L7*samples = 6
NO (4) / YES (2)
*NO*
no
Fig. 5. Platform: Chromebook 1. Model: feature set: 2; depth: 4.

Id Features
FS1 worksize [block size]
FS2 all features from FS1, CPU frequency, GPU frequency,image rows (m), image columns (n), image size (m× n),(GWS0, GWS1, GWS2) [OpenCL global work size]
FS3 all features from FS2, CPU frequency / GPU frequency,image size / CPU frequency, image size / GPU frequency,
Table 2. Feature sets: simple (FS1); natural (FS2); designed (FS3).
In the first subset, 90 samples are labelled with “NO” and 2 samples arelabelled with “YES”. Since the majority of the samples are labelled with “NO”,the tree predicts that the workload for which the worksize is less than or equalto 40 should be executed on the CPU. Similarly, the workload for which theworksize is greater than 40 should be executed on the GPU. Intuitively, thismakes sense: the workload with a higher computational intensity (a higher valueof the worksize) should be executed on the GPU, despite the memory transferoverhead.
For 6 samples out of 276, the model in Figure 3 mispredicts the correctscheduling decision. (We say that the rate of correct predictions is 270/276 or97.8%.) For example, for the two samples out of 92 in the subset for which theworksize is 16 (“L1”), the GPU was still faster than the CPU. Yet, based onlabelling of the majority of the samples in this subset, the model mispredictsthat the workload should be executed on the CPU.
Figure 4 shows a decision tree of depth 2 using the same worksize feature.The right child of the root now has two children of its own. All the samples inthe rightmost leaf (“L3”) for which the worksize is greater than 96 (i.e. 128) arelabelled with “YES”. This means that at the highest computational intensity, theGPU was always faster than the CPU, thus confirming our intuition. However,the model in Figure 4 still makes 6 mispredictions. To improve the predictionrate, we build models using more features, as well as having more levels. InTable 2, we consider two more sets of features.
The “natural” set is constructed from the features that we expected wouldimpact the scheduling. Figure 5 shows a decision tree of depth 4 built using thenatural feature set. This model uses 4 additional features (the GPU frequency,the CPU frequency, the number of image columns, the number of image rows)and has 8 leaf nodes, but still results in 2 mispredictions (“L7”), achieving theprediction rate of 99.3%. This model makes the same decision on the worksizeat the top level, but better fits the training data at lower levels. However, thismodel is more difficult to grasp intuitively and may not fit new data well.
The “designed” set can be used to build models achieving the 100.0% pre-diction rate. A decision tree of depth 5 (not shown) uses all the new featuresfrom the designed set. With 12 leaf nodes, however, this model is even moredifficult to grasp intuitively and exhibits even more overfitting than the modelin Figure 5.

if X[0] (worksize) <= 96.0000samples = 276
if X[0] (worksize) <= 40.0000samples = 184
yes
*L3*samples = 92
NO (52) / YES (40)
*NO*
no
*L1*samples = 92
NO (92) / YES (0)
NO
yes
*L2*samples = 92
NO (83) / YES (9)
NO
no
Fig. 6. Platform: Chromebook 2. Model: feature set: 1; depth: 2.
Now, if we use a simple model trained on data from Chromebook 1 (Fig-ure 4) for predicting scheduling decisions on Chromebook 2, we only achievea 51.1% prediction rate (not shown). A similar model retrained on data fromChromebook 2 (Figure 6) achieves a 82.3% prediction rate. Note that the top-level decision has changed to the worksize being less than 96. In other words,up to that worksize the CPU is generally faster than the GPU even as prob-lems become more computationally intensive. This makes sense: the CPU ofChromebook 2 has 4 cores, whereas the CPU of Chromebook 1 has 2 cores. Thisdemonstrates the importance of retraining models for different platforms.
As before, using more features and levels can bring the prediction rate to100.0%. For example, using the natural feature set improves the prediction rateto 90.2% (Figure 7). Note that the top-level decision no longer depends on theworksize but on the first dimension of the OpenCL global work size.
For brevity, we omit a demonstration of the importance of using more datafor training. For example, to build more precise models, we could have addedexperiments with the worksize of 32 to determine if that would still be considerednon-intensive as the worksize of 16. The Collective Knowledge approach allowsto crowdsource such experiments and rebuild models as more mispredictions aredetected and more data becomes available.
High-level programming frameworks for heterogeneous systems such as An-droid’s RenderScript,17 Qualcomm’s Symphony,18 and Khronos’s OpenVX19 canbe similarly trained to dispatch tasks to system resources efficiently.
17 developer.android.com/guide/topics/renderscript18 developer.qualcomm.com/symphony (formerly known as MARE)19 khronos.org/openvx

if X[1] (GWS0) <= 14.0000samples = 276
if X[4] (CPU frequency) <= 1200.0000samples = 92
yes
if X[7] (image rows) <= 1374.5000samples = 184
no
*L1*samples = 46
NO (12) / YES (34)
*YES*
yes
*L2*samples = 46
NO (40) / YES (6)
*NO*
no
*L3*samples = 64
NO (55) / YES (9)
*NO*
yes
*L4*samples = 120
NO (120) / YES (0)
NO
no
Fig. 7. Platform: Chromebook 2. Model: feature set: 2; depth: 2.
4 Conclusion
We have presented Collective Knowledge, an open methodology that enablescollaborative design and optimization of computer systems. This methodologyencourages contributions from the expert community to avoid common bench-marking pitfalls (allowing, for example, to fix the processor frequency, capturerun-time state, find missing software/hardware features, improve models, etc.)
4.1 Representative workloads
We believe the expert community can tackle the issue of representative work-loads as well as the issue of rigorous evaluation. The community will both providerepresentative workloads and rank them according to established quality crite-ria. Furthermore, a panel of recognized experts could periodically (say, every 6months) provide a ranking to complement commercial benchmark suites.
The success will depend on establishing the right incentives for the com-munity. As the example of Realeyes shows, even when commercial sensitivityprevents a company from releasing their full application under an open-sourcelicense, it may still be possible to distill a performance-sensitive portion of it intoa standalone benchmark. The community can help the company to optimize theirbenchmark (for free or for fee), thus improving the overall performance of theirfull application.20 Some software developers will just want to see their bench-mark appear in the ranked selection of workloads, highlighting their skill andexpertise (similar to “kudos” for open-source contributions).
4.2 Predictive analytics
We believe that the Collective Knowledge approach convincingly demonstratesthat statistical techniques can indeed help computer engineers do a better job
20 The original HOG paper [14] has over 12500 citations. Just imagine this commu-nity combining their efforts to squeeze out every gram of HOG performance acrossdifferent “flavours”, data sets, hardware platforms, etc.

in many practical scenarios. Why do we think it is important? Although we arenot suggesting that even most advanced statistical techniques can ever substi-tute human expertise and ingenuity, applying them can liberate engineers fromrepetitive, time-consuming and error-prone tasks that machines are better at.Instead, engineers can unleash their creativity on problem solving and innovat-ing. Even if this idea is not particularly novel, Collective Knowledge brings itone small step closer to reality.
4.3 Trust me, I am a catalyst!
We view Collective Knowledge as a catalyst for accelerating knowledge discoveryand stimulating flows of reproducible insights across largely divided hardware/-software and industry/academia communities. Better flows will lead to break-throughs in energy efficiency, performance and reliability of computer systems.Effective knowledge sharing and open innovation will enable new exciting appli-cations in consumer electronics, robotics, automotive and healthcare—at betterquality, lower cost and faster time-to-market.
5 Acknowledgements
We thank the EU FP7 609491 TETRACOM Coordination Action for fundinginitial CK development. We thank the CK community for their encouragement,support and contributions. In particular, we thank our partners and customersfor providing us valuable opportunities to improve Collective Knowledge on real-world use cases.
References
1. J. Teich. Hardware/software codesign: The past, the present, and predicting thefuture. Proceedings of the IEEE, 100(Special Centennial Issue):1411–1430, May2012.
2. John L. Hennessy and David A. Patterson. Computer architecture, a quantitativeapproach (second edition). Morgan Kaufmann publishers, 1995.
3. R. Whaley and J. Dongarra. Automatically tuned linear algebra software. InProceedings of the Conference on High Performance Networking and Computing,1998.
4. B. Aarts, M. Barreteau, F. Bodin, P. Brinkhaus, Z. Chamski, H.-P. Charles,C. Eisenbeis, J. Gurd, J. Hoogerbrugge, P. Hu, W. Jalby, P.M.W. Knijnenburg,M.F.P O’Boyle, E. Rohou, R. Sakellariou, H. Schepers, A. Seznec, E.A. Stohr,M. Verhoeven, and H.A.G. Wijshoff. OCEANS: Optimizing compilers for embed-ded applications. In Proc. Euro-Par 97, volume 1300 of Lecture Notes in ComputerScience, pages 1351–1356, 1997.
5. K.D. Cooper, D. Subramanian, and L. Torczon. Adaptive optimizing compilers forthe 21st century. Journal of Supercomputing, 23(1), 2002.
6. Raj Jain. The Art of Computer Systems Performance Analysis: Techniques forExperimental Design, Measurement, Simulation, and Modeling. May 1991.

7. Krste Asanovic, Ras Bodik, Bryan C. Catanzaro, Joseph J. Gebis, Parry Husbands,Kurt Keutzer, David A. Patterson, William L. Plishker, John Shalf, Samuel W.Williams, and Katherine A. Yelick. The landscape of parallel computing research:a view from Berkeley. Technical Report UCB/EECS-2006-183, Electrical Engi-neering and Computer Sciences, University of California at Berkeley, December2006.
8. Luigi Nardi, Bruno Bodin, M. Zeeshan Zia, John Mawer, Andy Nisbet, Paul H. J.Kelly, Andrew J. Davison, Mikel Lujan, Michael F. P. O’Boyle, Graham Riley, NigelTopham, and Steve Furber. Introducing SLAMBench, a performance and accuracybenchmarking methodology for SLAM. In Proceedings of the IEEE Conference onRobotics and Automation (ICRA), May 2015. arXiv:1410.2167.
9. Elnar Hajiyev, Robert David, Laszlo Marak, and Riyadh Baghdadi. Realeyes im-age processing benchmark. https://github.com/Realeyes/pencil-benchmarks-
imageproc, 2011–2015.10. Riyadh Baghdadi, Ulysse Beaugnon, Tobias Grosser, Michael Kruse, Chandan
Reddy, Sven Verdoolaege, Javed Absar, Sven van Haastregt, Alexey Kravets,Robert David, Elnar Hajiyev, Adam Betts, Jeroen Ketema, Albert Cohen, Alas-tair Donaldson, and Anton Lokhmotov. PENCIL: a platform-neutral computeintermediate language for accelerator programming. In Proceedings of the 24thInternational Conference on Parallel Architectures and Compilation Techniques(PACT’15), September 2015.
11. Grigori Fursin, Anton Lokhmotov, and Ed Plowman. Collective Knowledge: to-wards R&D sustainability. In Proceedings of the Conference on Design, Automationand Test in Europe (DATE’16), March 2016.
12. Grigori Fursin, Renato Miceli, Anton Lokhmotov, Michael Gerndt, Marc Baboulin,D. Malony, Allen, Zbigniew Chamski, Diego Novillo, and Davide Del Vento. Col-lective Mind: Towards practical and collaborative auto-tuning. Scientific Program-ming, 22(4):309–329, July 2014.
13. Grigori Fursin, Abdul Memon, Christophe Guillon, and Anton Lokhmotov. Collec-tive Mind, Part II: Towards performance- and cost-aware software engineering asa natural science. In Proceedings of the 18th International Workshop on Compilersfor Parallel Computing (CPC’15), January 2015.
14. Navneet Dalal and Triggs Bill. Histograms of oriented gradients for human de-tection. In Proceedings of the IEEE Conference on Computer Vision and PatternRecognition (CVPR), pages 886–893, 2005.
Heterogeneous (CPU+GPU) Working-set HashTables
Ziaul Choudhury and Suresh Purini
International Institute of Information Technology,Hyderabad,India
{ziaul.choudhury@research., suresh.purini@}iiit.ac.in
Abstract. In this paper, we propose heterogeneous (CPU+GPU) hashtables, that optimize operations for frequently accessed keys. The idea isto maintain a dynamic set of most frequently accessed keys in the GPUmemory and the rest of the keys in the CPU main memory. Further,queries are processed in batches of fixed size. We measured the querythroughput of our hash tables using Millions of Queries Processed perSecond (MQPS) as a metric, on different key access distributions. Ondistributions, where some keys are queried more frequently than others,we achieved on average 10x higher MQPS when compared to a highlytuned serial hash table in the C++ Boost library; and 5x higher MQPSagainst a state of the art concurrent lock free hash table. The maximumload factor on the hash tables was set to 0.9. On uniform random querydistributions, as expected our hash tables do not outperform concurrentlock free hash tables, nevertheless matches their performance.
1 Introduction
A hash table is a key-value store which supports constant time insert, delete andsearch operations. Hash tables do not lay any special emphasis on the key accesspatterns over time. However, the key access sequences in real world applicationstend to have some structure. For example, till a certain point in time a smallsubset of keys could be searched more frequently than the rest. Data structureslike Splay trees [17] are specifically designed to reduce the access times of thefrequently accessed keys by keeping them close to the root using rotation op-erations on the tree. The working set property states that it requires at mostO(log[ω(x) + 2]) time to search for a key x, where ω(x) is the number of dis-tinct keys accessed since the last access of x. Splay trees satisfy this propertyin an amortized sense [17], while the working-set structure satisfies the samein the worst case sense [4]. The working-set structure is an array of balancedbinary search trees where the most recent keys occupy the smaller trees at front.Through a sequence of insertions and deletions the older keys are propagated tothe bigger trees towards the end.
Following the recent uprise of accelerator based computing, like the heteroge-neous multi-core CPU+GPU based systems, many data structures, for examplequad-trees [9] and B+ trees [5] have been successfully ported to these exotic

2 Ziaul Choudhury, Suresh Purini
platforms thus achieving greater performance. In this direction, inspired by theworking-set structure, we propose a set of two level heterogeneous (CPU+GPU)hash tables in this paper. In all the designs the first level of the hash table issmaller in size and resides in the GPU memory. It essentially caches the mostrecently accessed keys or in other words hot data. The second level hash tableresides in the CPU memory and contains the rest of the keys. We overlay anMRU list on the keys residing in the GPU hash table. The queries are batchedand are processed first on the GPU followed by the CPU. Our overall hash ta-bles can be viewed as a heterogeneous two level working-set structure. To thebest of our knowledge, this is the first attempt towards designing heterogeneous(CPU+GPU) hash tables, wherein we use the GPU accelerator to improve thequery throughput by exploiting the key access patterns of the hash table.
The rest of the paper is organized as follows. In section 2 we give a brief back-ground necessary towards designing a heterogeneous (CPU+GPU) hash table.In section 3 we describe our hash table designs in detail followed by experimentalresults in section 4. We conclude with directions to some future work in section5.
2 Background
This section gives an overview of the heterogeneous (CPU+GPU) architecturefollowed by a brief discussion on the multi-core CPU and GPU hash tables thatinspired the work in this paper.
NVIDIA GPUs are composed of multiple streaming multiprocessors (SMs)each containing a number of light weight primitive cores. The SMs execute inparallel independently. The memory subsystem is composed of a global DRAMand a L2 cache shared by all the SMs. There is also a small software manageddata cache whose access times is close to register speeds called shared memory.This is attached to each SM and shared by all the cores within a SM. A computekernel on a GPU is organized as a collection of thread blocks which are in turngrouped into batches of 32 threads called warps. One instruction by a warp ofthreads is executed in a constant number of cycles within the SM. A warp isthe basic unit of execution in a GPU kernel. The GPU is embedded in a systemas an accelerator device connected to the CPU through a low bandwidth PCIeexpress bus. GPUs are programmed using popular frameworks like CUDA [1] andOpenCL. Heterogeneous computing using CPU and GPU traditionally involvesthe GPU handling the data parallel part of the computation by taking advantageof its massive number of light weight parallel threads, while the CPU handlingthe sequential code or data transfer management. Unfortunately a large fractionof time in a CPU+GPU code is spent in transferring data across the slow PCIebus. This problem can be mitigated by carefully placing the data in the GPU sothat fetching of new data from the CPU is as minimum as possible. The CPUafter transferring the data and launching the kernel mostly sits idle during the
Heterogeneous Hash Tables 3
computation. In this work the motivation is to keep both the devices1 busy whileexecuting successive operations on the respective hash tables.
Data structures that use both the CPU and GPU simultaneously have beenreported in literature. Kelly and Breslow [9] proposed a heterogeneous approachto construct quad-trees by building the first few levels in the CPU and the rest ofthe levels in the GPU. The work load division strategy has also proven its worthin cases where the costly or frequent operations were accelerated on the GPUwhile the rest of the operations were handled by the CPU. Daga and Nutter [5]proposed a B+ tree implementation on an Accelerated Processing Unit (APU).They eliminated the need to copy the entire tree to the GPU memory, thusfreeing the implementation from the limited GPU memory.
General hash table designs include linear hash table, chained hash table,cuckoo hash table and hopscotch hash table [7]. Among these the cuckoo hash-ing [15] technique can achieve good performance for lookup operations. Cuckoohashing is an open address hashing scheme which uses a fixed number of hashtables with one hash function per table. On collision the key replaces the alreadypresent key in the slot. Now the ”slotless” key is hashed into a different tableby the hash function of that table and the process continues until all the keyshave a slot. There has been efforts directed towards designing high performancehash tables for multi-core systems. Lea’s hash table from the Java ConcurrencyPackage [11] is a closed address lock based hash table based on chaining. Hop-scotch hashing [7] guarantees constant lookup operations. It is a lock based openaddress technique which combines linear probing with the cuckoo hashing tech-nique. Initial work on lock free hashing was done in [13] which used chaining.The lock free version of cuckoo hashing was designed in [14]. The algorithmallowed mutating operations to operate concurrently with query ones and re-quired only single word compare-and-swap primitives. They used a two-roundquery protocol enhanced with a logical clock technique to ensure correctness.Pioneering work was done for parallel hashing in GPU by Alcantara et.al. [2].They used cuckoo hashing on the GPU for faster lookup and update operations.Each thread handled a separate query and used GPU atomic operations to pre-vent race conditions while probing for hash table slots. This design is a part ofthe CUDPP [3] library, which is a data parallel library of common algorithms inthe GPU. The work in [10] presented the Stadium Hashing (Stash) techniquewhich is a cuckoo hash design and scalable to large hash tables. It removes therestriction of maintaining the hash table wholly on the limited GPU memory bystoring container buckets in the host memory as well. It used a compact datastructure named ticket-board separate from hash table buckets maintained inthe GPU memory which guided all the operations on the hash tables.
3 Proposed Heterogeneous Hash Tables
In this section, we give an overview of the basic design of our hash tables andtheir memory layout across both the devices (Figure 1). The primary goal of our
1 In this paper, by devices we mean the CPU and it’s connected GPU.

4 Ziaul Choudhury, Suresh Purini
hash tables is to support faster operations on recently accessed keys similar tothe working-set structure. Unlike previous works the size and scalability of ourhash tables is not restricted by the limited GPU memory. The GPU is used as acache to store the most frequently accessed keys (hot data). These key-value pairsare processed in parallel by all the GPU threads. The search and update queriesare bundled into batches of size B before processing. We intuitively expect thatevery key k with ω(k) ≤ cM where M is the size of GPU global memory and0 < c ≤ 1 is some constant, is available in the GPU. The value of c depends onthe key-value pair record size.
All the key-value pairs in our heterogeneous hash tables are partitioned be-tween a list and a CPU based hash table. The list is implemented using an arrayresiding in the unified memory. Unified memory is an abstracted form of memorythat can be accessed by both the devices without any explicit data transfers [1].The support for unified memory is provided with CUDA 6.0 onwards. Internallythis memory is first allocated on the GPU. When the CPU accesses an addressin this memory, a GPU memory block containing the requested memory is trans-ferred to the CPU by the underlying CUDA framework implicitly. The key-valuepairs stored in the list are arranged from the most recently to the least recentlyaccessed pair in the left to right order respectively. The size of the list is Mand has three sections: an active middle area which contains all the key-valuepairs belonging to the list and empty left and right areas of size B each. Thequery vector is first processed by the GPU and then by the CPU. After boththe devices have processed the query vector it is copied to the left section of thelist in unified memory. A reorganize operation now arranges the key-value pairsof the list in the MRU order. This reorganization will be explained later in thepaper. The MRU list may contain more than the allowed number of key-valuepairs. The overflow keys accumulate in the empty right most area of the list afterthe reorganization step. These overflow keys are the oldest in the GPU memoryand will be accommodated in the CPU memory during successive operations onthe hash tables.
The rest of the key-value pairs which are old enough and thus can not beaccommodated in the MRU list due to size constraints, are maintained in theCPU hash table. The keys in the CPU are not maintained in the MRU order.The architecture of CPU hash table is different for all the designs and willbe described in the later sections. Each element in the query vector called aquery element contains a key-value pair. The rightmost three bits in the key arereserved. The first two bits identify the operation being carried out with the key;i.e. a search, insert or delete. The last bit is set if the key-value pair is presentin the GPU and vice-versa (Figure 1). The next three sections describe the hashtable designs in detail.
3.1 A Spliced Hash Table
A spliced hash table (S-hash) is the simplest of our designs where a standardGPU hash table from the CUDPP library is fused together with a serial CPU hashtable from the C++ Boost [16] library, within the framework described in the

Heterogeneous Hash Tables 5
Figure 1: The left figure shows the structure of a query element. The figure on theright shows the overall structure of the hash tables. The value part in the query vectoris omitted for simplification.
previous section. The GPU hash table (CUDPP hash) is separate from the MRUlist and is maintained as a separate data structure in the GPU memory. Allthe keys that belong to the MRU list are also present in the CUDPP hash. TheCUDPP hash processes search and update queries in batches. The CUDPP hash andthe Boost hash communicate through the MRU list in the unified memory. By”communicate” we mean, the overflow keys in the MRU list which also lies in theCUDPP hash are removed from the GPU memory and are added to the CPUBoost hash during successive operations. Recall that the MRU list contains Mslots. To identify the position of a key in the MRU list logM bits are storedalong with the value part. These position bits link a key-value pair in the CUDPP
hash to its location in a specific slot of the MRU list.
Operations: The operations are bundled in a query vector first and sent tothe CUDPP hash for processing. The working set bit is set for each insert(key)
operation in a query element. The CUDPP hash can not handle mixed operations.Hence the query elements with search operations are separated from the deleteoperations before processing. Each GPU thread handles an individual queryelement. For a search query, if the key is found in the CUDPP hash, the position bitslocated in the value field are read and the working set bit situated at the locationof the key in the MRU list is set to 0 and the working set bit corresponding tothe key-value pair in the query element is set to 1. Delete queries are handledby first removing the key-value pair from the CUDPP hash and simultaneouslyfrom the MRU list by setting the working set bit situated at the location of thekey to 0. Also the working set bit in the query element is left unset for a deleteoperation.
The search and delete queries that could not be serviced by the GPU aresent to the CPU. The CPU takes one query element at a time and executesthe corresponding operation on the Boost hash. The setting of the working setbit in the query element is done as before. The query vector is now copied tothe leftmost section in the MRU list. This copying can be avoided if the queryvector is placed in this section of the MRU list at the beginning only. To prevent
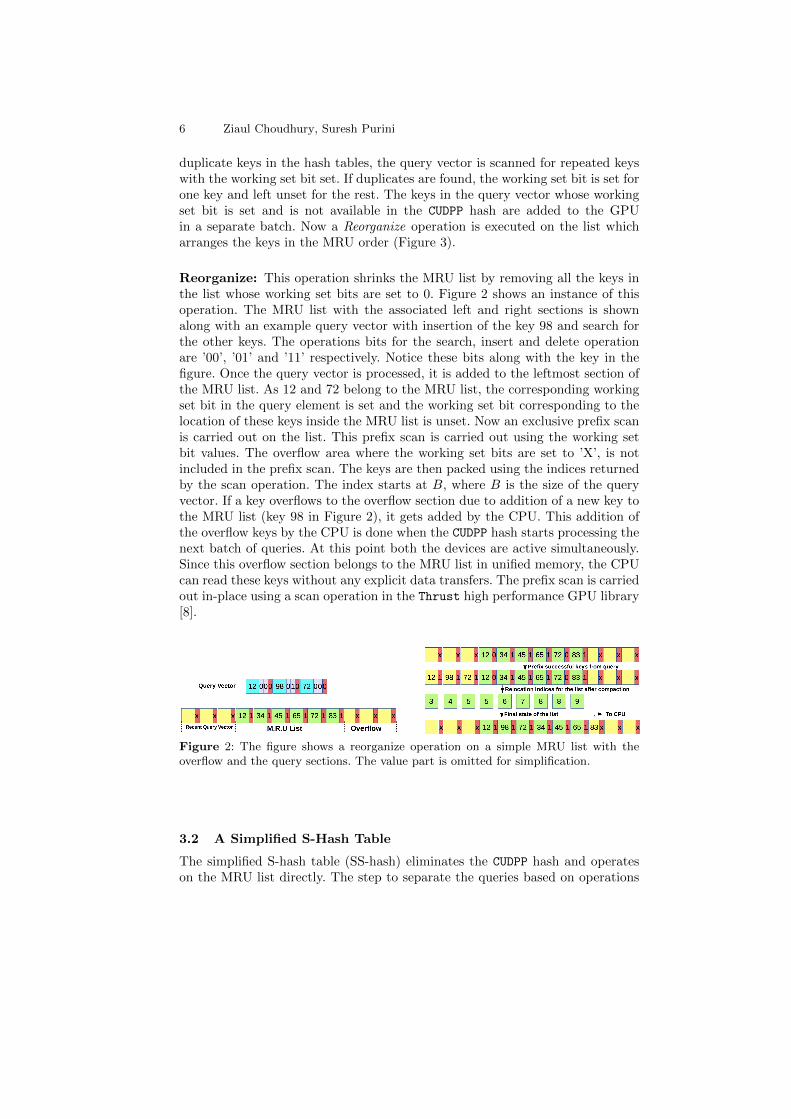
6 Ziaul Choudhury, Suresh Purini
duplicate keys in the hash tables, the query vector is scanned for repeated keyswith the working set bit set. If duplicates are found, the working set bit is set forone key and left unset for the rest. The keys in the query vector whose workingset bit is set and is not available in the CUDPP hash are added to the GPUin a separate batch. Now a Reorganize operation is executed on the list whicharranges the keys in the MRU order (Figure 3).
Reorganize: This operation shrinks the MRU list by removing all the keys inthe list whose working set bits are set to 0. Figure 2 shows an instance of thisoperation. The MRU list with the associated left and right sections is shownalong with an example query vector with insertion of the key 98 and search forthe other keys. The operations bits for the search, insert and delete operationare ’00’, ’01’ and ’11’ respectively. Notice these bits along with the key in thefigure. Once the query vector is processed, it is added to the leftmost section ofthe MRU list. As 12 and 72 belong to the MRU list, the corresponding workingset bit in the query element is set and the working set bit corresponding to thelocation of these keys inside the MRU list is unset. Now an exclusive prefix scanis carried out on the list. This prefix scan is carried out using the working setbit values. The overflow area where the working set bits are set to ’X’, is notincluded in the prefix scan. The keys are then packed using the indices returnedby the scan operation. The index starts at B, where B is the size of the queryvector. If a key overflows to the overflow section due to addition of a new key tothe MRU list (key 98 in Figure 2), it gets added by the CPU. This addition ofthe overflow keys by the CPU is done when the CUDPP hash starts processing thenext batch of queries. At this point both the devices are active simultaneously.Since this overflow section belongs to the MRU list in unified memory, the CPUcan read these keys without any explicit data transfers. The prefix scan is carriedout in-place using a scan operation in the Thrust high performance GPU library[8].
Figure 2: The figure shows a reorganize operation on a simple MRU list with theoverflow and the query sections. The value part is omitted for simplification.
3.2 A Simplified S-Hash Table
The simplified S-hash table (SS-hash) eliminates the CUDPP hash and operateson the MRU list directly. The step to separate the queries based on operations

Heterogeneous Hash Tables 7
is no longer necessary as the GPU now handles mixed operations together inone batch. The algorithm for maintaining the MRU list in the GPU remains thesame. The only difference is the replacement of the CUDPP hash with our MRUlist processing logic described below (Figure 3).
MRU List Processing: After the query vector is filled with query elements,a GPU kernel is launched. The thread configuration of the kernel is adjusted tolaunch W warps, where W equals the size of the active middle section in theMRU list. A warp is assigned a single MRU list element. Each block in the kernelloads a copy of the query vector in its shared memory. The ith warp processes thej × 32 + ith key in the MRU list, here j is the index of the block containing thewarp and each block has a maximum capacity of 32 warps. The warp reads theassigned key in the list and all the threads in the warp linearly scan the queryvector in shared memory for the key. If a thread in the warp finds a match, itfirst reads the operations bits to identify if it is a search or a delete operation.For a successful search operation, a thread sets the working set bit of the key inthe query vector and unsets the corresponding bit in the MRU list. The threaduses the copy of the query vector in the global memory for this step. This bitmanipulation is done using the bit-wise OR/AND primitives. For a successfuldelete, the key-value pair along with the working set bit in the MRU list is setto 0. The working set bit in the query vector is left unset. The success of a con-current search for the same key that is getting deleted is determined by whetherthe search read the key before the delete started modifying the bits in the key-value pair. Insert operations need not be processed as they will be taken care bythe reorganize step that was described before. This is a pretty straightforwardcode without any optimization. Listed below are some optmizations which areintrinsic to our algorithm and some others which are incorporated with minormodifications.
– Memory Bank conflicts: Bank conflicts within a block occur when a fewthreads within a warp read the same shared memory location. In our algo-rithm all the warp threads read adjacent memory locations of the sharedmemory therefore preventing bank conflicts.
– Global Memory coalescing: Coalescing happens when all the threadsfrom a warp read successive global memory locations. Consequently all theread requests are served by a single memory transaction. In our algorithmall the warp threads read a single global memory location so the scope ofcoalescing reads is lost. As an optimization, before all the warps in a blockstarts reading keys from the MRU list, warp 0 in each block reads in a setof contiguous keys from the MRU list and places them in a shared memorybuffer. After this the warps, including warp 0, starts executing and fetchingthe keys from this buffer instead of the MRU list.
– Warp Serialization: If the threads from two different warps read the sameshared memory location, the two warps are scheduled one after another onthe respective SM. There is a high probability for this to happen as allthe warps within a block scan the query vector linearly starting from the

8 Ziaul Choudhury, Suresh Purini
beginning. To reduce this probability each warp chooses a random locationin the query vector to start the scan from and wrap around in case it overflows the size of the query vector.
– Launch configuration: The number of warps, thereby blocks, launched canbe reduced if more work is assigned to a single warp. Instead of processinga single key from the MRU list, each warp can pick up a constant numberof keys to look for inside the query vector.
– Redundant work: There might be scenarios where all the query elementsare serviced by a very small fraction of the warps while the majority of thewarps do redundant work of simply reading the query vector and the keysbefore expiring. To combat this issue, each warp on successfully processinga query decrements an global atomic counter initialized to B. Now a warponly starts its execution cycle if the value of this counter is greater than 0.
In this design, the Boost hash is replaced by a lock free cuckoo hash from [14].The overflow keys are now added in parallel by individual CPU threads to theCPU hash table.
Figure 3: The overall design of the S-hash and SS-hash tables.
3.3 A Cache Partitioned SS-hash Table
In this section, the focus is shifted to the CPU hash table design. The lockfree cuckoo hash is replaced by our own implementation in the SS-hash table.The developed hash table is optimized for multi-core caches using the techniqueof partitioning, hence we call it CPSS hash table. The work in [12] designed ashared memory hash table for multi-core machines (CPHASH), by partition-ing the table across the caches of cores and using message passing to transfersearch/insert/delete operations to a partition. Each partition was handled bya separate thread on a core. We design our hash table along similar lines. Thehash table processes queries in batches and operates in a rippling fashion duringquery processing.
Our hash table is implemented using a circular array. The array housing thehash table is partitioned into P different partitions, P is the number of CPUthreads launched. In each partition P[i], a fixed number of buffer slots, R[i], are
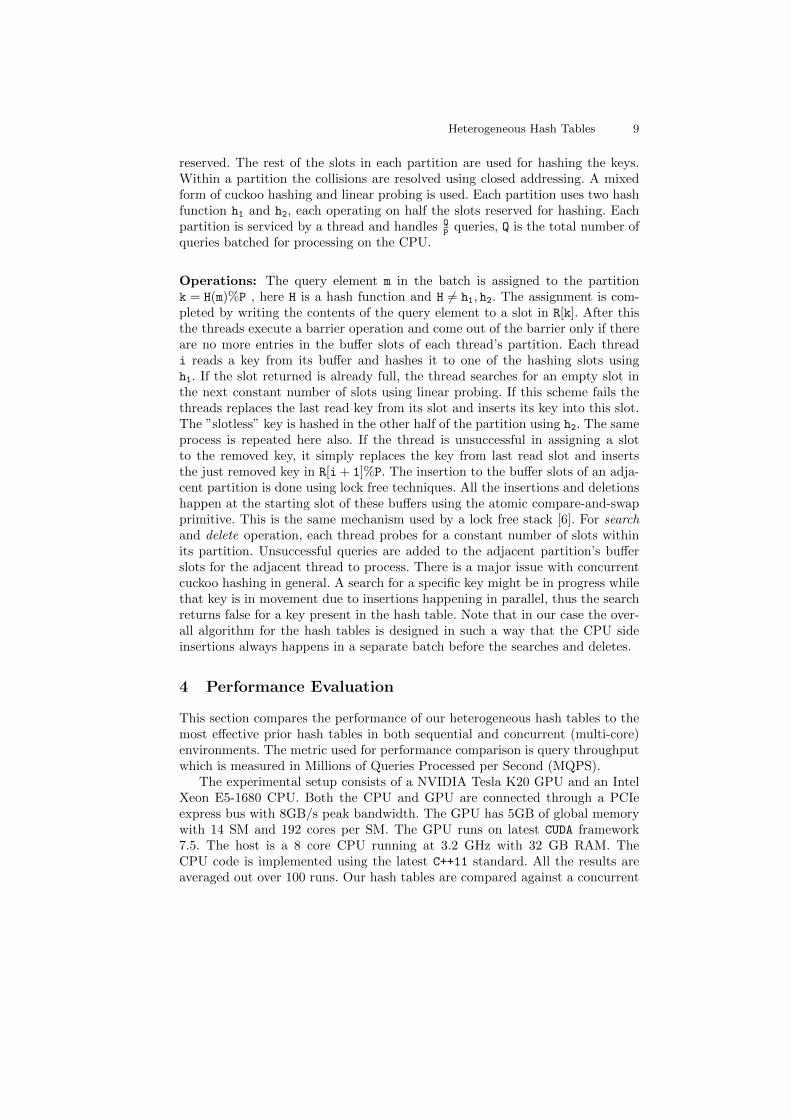
Heterogeneous Hash Tables 9
reserved. The rest of the slots in each partition are used for hashing the keys.Within a partition the collisions are resolved using closed addressing. A mixedform of cuckoo hashing and linear probing is used. Each partition uses two hashfunction h1 and h2, each operating on half the slots reserved for hashing. Eachpartition is serviced by a thread and handles Q
Pqueries, Q is the total number of
queries batched for processing on the CPU.
Operations: The query element m in the batch is assigned to the partitionk = H(m)%P , here H is a hash function and H 6= h1, h2. The assignment is com-pleted by writing the contents of the query element to a slot in R[k]. After thisthe threads execute a barrier operation and come out of the barrier only if thereare no more entries in the buffer slots of each thread’s partition. Each threadi reads a key from its buffer and hashes it to one of the hashing slots usingh1. If the slot returned is already full, the thread searches for an empty slot inthe next constant number of slots using linear probing. If this scheme fails thethreads replaces the last read key from its slot and inserts its key into this slot.The ”slotless” key is hashed in the other half of the partition using h2. The sameprocess is repeated here also. If the thread is unsuccessful in assigning a slotto the removed key, it simply replaces the key from last read slot and insertsthe just removed key in R[i + 1]%P. The insertion to the buffer slots of an adja-cent partition is done using lock free techniques. All the insertions and deletionshappen at the starting slot of these buffers using the atomic compare-and-swapprimitive. This is the same mechanism used by a lock free stack [6]. For searchand delete operation, each thread probes for a constant number of slots withinits partition. Unsuccessful queries are added to the adjacent partition’s bufferslots for the adjacent thread to process. There is a major issue with concurrentcuckoo hashing in general. A search for a specific key might be in progress whilethat key is in movement due to insertions happening in parallel, thus the searchreturns false for a key present in the hash table. Note that in our case the over-all algorithm for the hash tables is designed in such a way that the CPU sideinsertions always happens in a separate batch before the searches and deletes.
4 Performance Evaluation
This section compares the performance of our heterogeneous hash tables to themost effective prior hash tables in both sequential and concurrent (multi-core)environments. The metric used for performance comparison is query throughputwhich is measured in Millions of Queries Processed per Second (MQPS).
The experimental setup consists of a NVIDIA Tesla K20 GPU and an IntelXeon E5-1680 CPU. Both the CPU and GPU are connected through a PCIeexpress bus with 8GB/s peak bandwidth. The GPU has 5GB of global memorywith 14 SM and 192 cores per SM. The GPU runs on latest CUDA framework7.5. The host is a 8 core CPU running at 3.2 GHz with 32 GB RAM. TheCPU code is implemented using the latest C++11 standard. All the results areaveraged out over 100 runs. Our hash tables are compared against a concurrent

10 Ziaul Choudhury, Suresh Purini
Figure 4: The query throughput of the heterogeneous hash tables on different keyaccess distributions and query mixes.
lock free cuckoo hash implementation (LF-Cuckoo) from [14] and a serial hashtable from the Boost library. For completeness we also compared the resultswith Lea’s concurrent locked (LL) hash table.
4.1 Query performance
We use micro-benchmarks similar to the works in [7],[14]. Each experiment usesthe same data set of 64 bit key-value pairs for all the hash tables. The results werecollected by setting up the hash tables densities (load factor) close to 90%(0.9).Figure 4 compares the query throughput of the hash tables on 10M queries.All the hash tables are filled with 64M key-value pairs initially. The results areshown for two types of query mixes, one has a higher percentage of search queriesand the other has more update operations. Two types of key access patterns aresimulated for the search and delete queries. A Uniform distribution generatesthe queries at random from the data set while a Gaussian distribution generatesqueries where a fraction of the keys are queried more than the others. Thestandard deviation of the distribution is set such that 20% of the keys havehigher access frequency. As each warp in the GPU processes a single MRU listelement, it is treated as a single GPU thread in the plots, i.e. the value of xfor the number of GPU threads is actually 32 × x. The number of {GPU, CPU}threads is varied linearly from {32, 4} to {1024, 128}. The size of the MRU listis fixed at 1M key-value pairs and each query vector has 8K entries. The Boost
hash being a serial structure always operates with a single CPU thread.

Heterogeneous Hash Tables 11
Figure 5: The cache misses/query comparison for the hash tables.
As can be seen in Figure 4, for search dominated uniform key access patternsthe heterogeneous hash tables outperforms the Boost hash and Lea’s hash andthe throughput scales with the increasing number of threads. Altough our hashtables have lesser query throughput compared to the lock free cuckoo hash. Forthe insert dominated case, the heterogeneous hash tables outperforms all theother hash tables. The reason is the simplified insert operation where the simplereorganize operation inserts the keys into the MRU list and thereby to the hashtables. The CPU only handles the overflow inserts which have less probabilityof occurrence. For the Gaussian distribution case, our hash tables outperformedthe others by a significant margin. They can process 10 times more queriescompared to the Boost hash and 5 times more compared to the lock free cuckoohash. The frequently accessed keys are always processed on the GPU. The CPUonly processes the unprocessed queries in the query vector and the overflow keys.The probability of CPU doing work is less, as most of the queries are satisfiedby the GPU without generating any overflow. Figure 5 shows the cache missesper query for the Uniform and the Gaussian distribution case. The CPSS hashhas fewer number of cache misses compared to the Boost hash and the lockfree cuckoo hash. As the GPU has a primitive cache hierarchy and most of thememory optimizations has already been taken care of, only the CPU cache missesare reported. In the Gaussian distribution case the CPSS hash performs muchbetter compared to the other case as most of the queries are resolved by theGPU itself and the CPU has less work to do.
4.2 Structural Analysis
The experiments in this section are carried out on the CPSS hash to find out thereasons for the speed up that was reported earlier. In Figure 6 the number ofqueries were varied with {1024, 128} threads in total. The other parameters aresame as before. As can be seen, for the uniform scenarios half the time is spenton memory copies. These cover both DeviceToHost or HostToDevice implicitmemory transfers. These memory transfers were captured with the help of theCUDA profiler. In the Gaussian distribution case the GPU performs most of thework with minimum memory transfer overhead and hence the expected speed

12 Ziaul Choudhury, Suresh Purini
Figure 6: The top two graphs show the time split of the CPU,GPU and memory trans-fers for processing different number of queries under different key access distribution.The bottom graphs show the variance of the query throughput with the size of theMRU list and the query vector respectively.
up is achieved. As can be seen in Figure 6 the maximum throughput is achievedwhen our hash tables are configured with MRU list and query vector size of 1Mand 8K respectively. With increasing size of the MRU list and the query vector,the time spent by the GPU in the Reorganize operation and the time for theDeviceToHost memory transfers increases. This is the reason for the diminishingquery throughput at higher values of these parameters.
5 Conclusion
In this work, we proposed a set of heterogeneous working-set hash tables whoselayout spans across GPU and CPU memories, where the GPU handles the mostfrequently accessed keys. The hash tables operates without any explicit datatransfers between the devices. This concept can be extended to any set of inter-connected devices with varying computational powers where the most frequentlyaccessed keys lies on the fastest device and so on. For non-uniform key access dis-tributions, our hash tables outperformed all the others in query throughput. Inour future work, we plan to investigate the challenges involved in using multipleaccelerators including GPUs and FPGAs. We envisage that maintaining a globalMRU list spanning across all the devices could be computationally expensive.So suitable approximations that give the right trade-off have to be made.
Heterogeneous Hash Tables 13
References
1. NVIDIA CUDA Compute Unified Device Architecture - Programming Guide, 2007.2. D. A. F. Alcantara. Efficient Hash Tables on the Gpu. PhD thesis, Davis, CA,
USA, 2011. AAI3482095.3. Y. Allusse, P. Horain, A. Agarwal, and C. Saipriyadarshan. GpuCV: A GPU-
accelerated framework for image processing and computer vision. In Advancesin Visual Computing, volume 5359 of Lecture Notes in Computer Science, pages430–439. Springer, Dec. 2008.
4. M. Bdoiu, R. Cole, E. D. Demaine, and J. Iacono. A unified access bound oncomparison-based dynamic dictionaries. Theor. Comput. Sci., 382(2):86–96, Aug.2007.
5. M. Daga and M. Nutter. Exploiting coarse-grained parallelism in b+ tree searcheson an apu. In Proceedings of the 2012 SC Companion: High Performance Comput-ing, Networking Storage and Analysis, SCC ’12, pages 240–247, Washington, DC,USA, 2012. IEEE Computer Society.
6. D. Hendler, N. Shavit, and L. Yerushalmi. A scalable lock-free stack algorithm. InProceedings of the Sixteenth Annual ACM Symposium on Parallelism in Algorithmsand Architectures, SPAA ’04, pages 206–215, New York, NY, USA, 2004. ACM.
7. M. Herlihy, N. Shavit, and M. Tzafrir. Hopscotch hashing. In 22nd Intl. Symp. onDistributed Computing, 2008.
8. J. Hoberock and N. Bell. Thrust: A parallel template library, 2010. Version 1.7.0.9. M. Kelly and A. Breslow. Quad-tree construction on the gpu: A hybrid cpu-gpu
approach. Retrieved June13, 2011.10. F. Khorasani, M. E. Belviranli, R. Gupta, and L. N. Bhuyan. Stadium hashing:
Scalable and flexible hashing on gpus. 2015.11. D. Lea. Hash table util.concurrent.ConcurrentHashMap, revision 1.3, in JSR-166,
the proposed Java Concurrency Package.12. Z. Metreveli, N. Zeldovich, and M. F. Kaashoek. Cphash: A cache-partitioned hash
table. SIGPLAN Not., 47(8):319–320, Feb. 2012.13. M. M. Michael. High performance dynamic lock-free hash tables and list-based sets.
In Proceedings of the Fourteenth Annual ACM Symposium on Parallel Algorithmsand Architectures, SPAA ’02, pages 73–82, New York, NY, USA, 2002. ACM.
14. N. Nguyen and P. Tsigas. Lock-free cuckoo hashing. In Distributed ComputingSystems (ICDCS), 2014 IEEE 34th International Conference on, pages 627–636.IEEE, 2014.
15. R. Pagh and F. F. Rodler. Cuckoo hashing. J. Algorithms, 51(2):122–144, May2004.
16. B. Schling. The Boost C++ Libraries. XML Press, 2011.17. D. D. Sleator and R. E. Tarjan. Self-adjusting binary search trees. J. ACM,
32(3):652–686, July 1985.

A Safe and Tight Estimation of the Worst-Case Execution
Time of Dynamically Scheduled Parallel Application
Petros Voudouris, Per Stenström, Risat Pathan
Chalmers University of Technology, Sweden {petrosv, per.stenstrom, risat}@chalmers.se
Abstract. Estimating a safe and tight upper bound on the Worst-Case Execu-
tion Time (WCET) of a parallel program is a major challenge for the design of
real-time systems. This paper, proposes for the first time, a framework to esti-
mate the WCET of dynamically scheduled parallel applications.
Assuming that the WCET can be safely estimated for a sequential task on a
multicore system, we model a parallel application using a directed acyclic
graph (DAG). The execution time of the entire application is computed using a
breadth-first scheduler that simulates non-preemptive execution of the nodes of
the DAG (called, the BFS scheduler). Experiments using Fibonacci application
from the Barcelona OpenMP Task Suite (BOTS) show that timing anomalies
are a major obstacle to estimate safely the WCET of parallel applications. To
avoid such anomalies, the estimated execution time of an application computed
under the simulation of BFS scheduler is multiplied by a constant factor to de-
rive a safe bound on WCET. Finally, an anomaly-free priority-based new
scheduling policy (called, the Lazy-BFS scheduler) is proposed to estimate
safely the WCET. Experimental results show that the bound on WCET comput-
ed using Lazy-BFS is not only safe but also 30% tighter than that computed for
BFS.
Keywords: parallel program; timing anomaly; time predictability
1 Introduction
There is an increasing demand for more advanced functions in today’s prevailing
embedded real-time systems like automotive and avionics. In addition to the embed-
ded domains, timeliness is also important in high-performance server applications, for
example, to guarantee a bounded response time in the light of increasing number of
clients and their processing requests. The need to satisfy such increasing computing
demands both in the embedded and in the high-performance domains requires more
powerful processing platform. Contemporary multicore processors provide such com-
puting power. The main challenge to ensure timing predictability and maximizing
throughput is to come up with techniques to exploit parallel multicore architectures.
Although sequential programming has been the primary paradigm to implement
tasks of hard real-time applications [2], such a paradigm limits the extent to which a
parallel multicore architecture can be exploited (according to Amdahl’s law [3]). On

the other hand, the HPC community has developed several parallel programming
models for task parallelism (e.g., Cilk [4]) and for data parallelism (e.g., OpenMp
loop [5]). Under parallel programming models, a classical sequential program is im-
plemented as a collection of parallel tasks that can execute in parallel on different
cores. The quest for more performance has recently attracted parallel programming
models for the design of real-time applications [6, 7]. While the HPC domain is main-
ly concerned about average throughput, the design of real-time system is primarily
concerned with the worst-case behavior. The blending of high-performance and real-
time computing poses a new challenge: how the worst-case timing behavior of a par-
allel application can be analyzed?
Scheduling algorithms play one of the most important roles in determining wheth-
er timing constraints of an application are met or not. The timing analysis of real-time
scheduling algorithms often assumes that the worst-case execution time (WCET) of
each application’s task is known [1]. If WCET of a task is not estimated safely, then
the outcome of schedulability analysis may be erroneous, and could result in cata-
strophic consequences for hard real-time applications. The estimation of the WCET
needs to be also tight in order to avoid over-provisioning of computing resources.
The tasks of a parallel application are scheduled either statically or dynamically.
Static scheduling binds (offline) each task on a particular core while dynamic sched-
uling allows a task to execute on any core. Recently, there have been several works on
WCET estimation for statically scheduled parallel applications under simplistic as-
sumptions, for example: the number of tasks is smaller than the number of available
cores or the maximum number of tasks is two [8, 9, 10]. Such limitations may con-
strain the programmer to exploit higher inter-task level parallelism and, hence, limits
the performance. In addition, a task assigned to a core, which is already highly load-
ed, may need to await execution while other cores of the platform may be idle; hence,
contributing to load imbalance.
While the approaches proposed in [8, 9, 10] are inspiring, the limitations of static
scheduling motivate us to investigate the problem of estimating the WCET of dynam-
ically scheduled parallel application on multicores. To the best of our knowledge, this
paper proposes, for the first time, a framework for estimating WCET of a dynamically
scheduled parallel application on multicore. The proposed framework is applied to
Fibonacci application from the BOTS [11].
This paper makes the following contributions. First, a methodology to model a
parallel application is proposed. The model captures information regarding what code
units can execute in parallel and what must execute sequentially so as to establish the
WCET of parallel applications. Second, we identify timing anomalies triggered by
dynamically scheduling tasks. Third, we contribute with new scheduling policies
under which timing anomalies can be avoided. Finally, experimental results are pre-
sented to show the tightness by which WCET can be estimated using the proposed
scheduling algorithms using Fibonacci from BOTS.
The rest of this paper is organized as follows: Section 2 presents our assumed sys-
tem model. From this, we identify in Section 3 timing anomalies challenging WCET
estimation. A systematic methodology to model parallel applications and the design
of a runtime simulator are presented in Section 4. Section 5 then presents our pro-

posed scheduling algorithms (BFS, Lazy-BFS) for the run-time system. Our experi-
mental results are presented in Section 6. Related work is presented in Section 7 be-
fore concluding in Section 8.
2 Timing Anomalies
The estimated WCET of an individual task is an upper bound on the WCET mean-
ing it is safe. A task during runtime may take less than its estimated WCET. The
overall execution time of a dynamically scheduled parallel application may increase
when some tasks take less than their WCETs, which is known as execution-time-
based timing anomaly [20]. An example of such an anomaly is demonstrated in Fig-
ure 1. The Cu value beside each node is the WCET of the corresponding task in Figure
1. The DAG is executed based on non-preemptive BFS on M=2 cores.
For example, consider the DAG and the schedule on the left-hand side of Figure 1.
The execution time of the application is 9. Consider the case when node B does not
execute for 3 time units but finishes after 1 unit of execution and all other nodes take
their WCET. The DAG and the schedule in such case are shown on the right-hand
side of Figure 1. The execution time of the application is 10. In other words, the over-
all execution time of the application is increased when node B takes less than its
WCET. This example demonstrates an execution-time-based timing anomaly.
Spawn-Based Timing Anomaly. Execution-time-based timing anomaly made us
curious to find scenarios that can result in other types of timing anomalies. In this
process, we find a new type of timing anomaly that we call spawn-based timing
anomaly. In parallel programming, a parallel task may be generated based on condi-
tional statements, for example, depending on specific value of some variable.
Figure 1. The DAG on the left when executed on two cores has execution time is 9 (schedule
on the left). If node B takes 1 time units (the DAG on the right-hand side), the execution time is
10 on two cores. BFS is used in both cases.
A node that is generated based on some conditional statement is called a conditional
node which may not be always present in the DAG if, for example, values of input
changes. A spawn-based timing anomaly occurs if a relatively fewer number of nodes
A
CA=1
C CC=2
E CE=2
F CF=5
B CB=1
G CG=1
D CD=2
C CC=2
E CE=2
F CF=5
B CB=3
G CG=1
D CD=2
A CA=1
A
C
B
F
D E G
1 2 3 4 5 6 7 8 9 10
Processors
P0
P1
Time A
C
B F D
E
G
1 2 3 4 5 6 7 8 9 10
Time
Processors
P0
P1
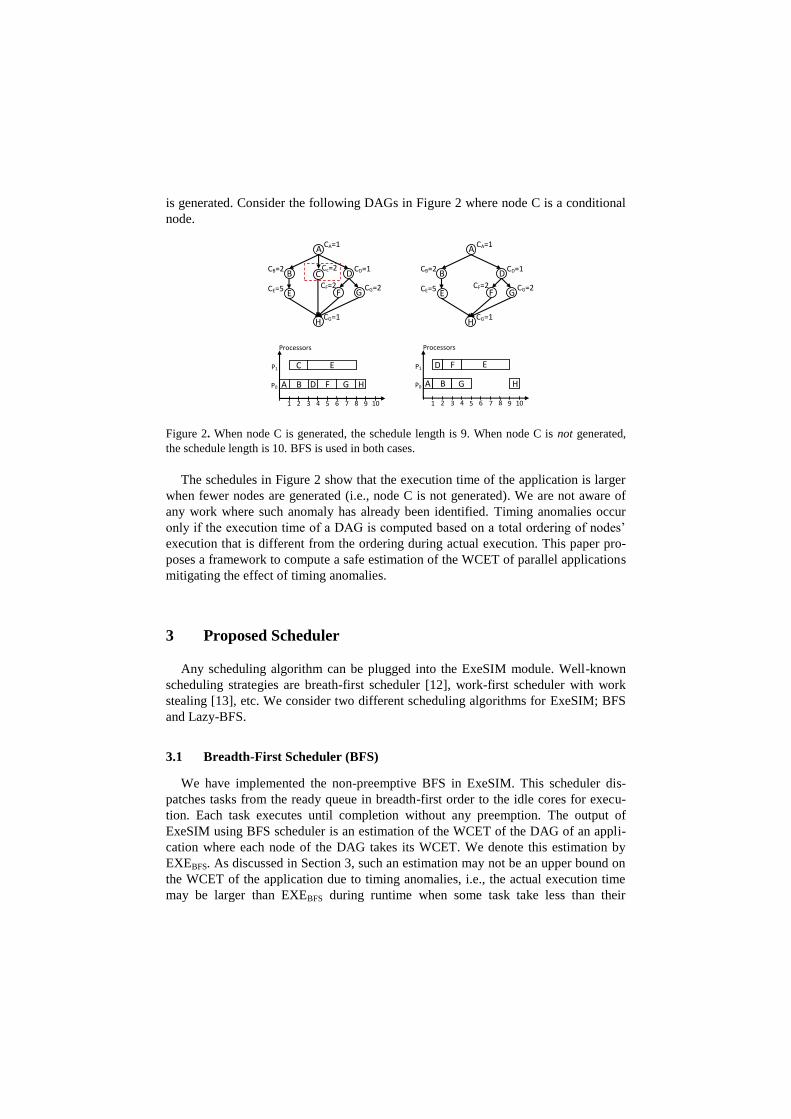
is generated. Consider the following DAGs in Figure 2 where node C is a conditional
node.
Figure 2. When node C is generated, the schedule length is 9. When node C is not generated,
the schedule length is 10. BFS is used in both cases.
The schedules in Figure 2 show that the execution time of the application is larger
when fewer nodes are generated (i.e., node C is not generated). We are not aware of
any work where such anomaly has already been identified. Timing anomalies occur
only if the execution time of a DAG is computed based on a total ordering of nodes’
execution that is different from the ordering during actual execution. This paper pro-
poses a framework to compute a safe estimation of the WCET of parallel applications
mitigating the effect of timing anomalies.
3 Proposed Scheduler
Any scheduling algorithm can be plugged into the ExeSIM module. Well-known
scheduling strategies are breath-first scheduler [12], work-first scheduler with work
stealing [13], etc. We consider two different scheduling algorithms for ExeSIM; BFS
and Lazy-BFS.
3.1 Breadth-First Scheduler (BFS)
We have implemented the non-preemptive BFS in ExeSIM. This scheduler dis-
patches tasks from the ready queue in breadth-first order to the idle cores for execu-
tion. Each task executes until completion without any preemption. The output of
ExeSIM using BFS scheduler is an estimation of the WCET of the DAG of an appli-
cation where each node of the DAG takes its WCET. We denote this estimation by
EXEBFS. As discussed in Section 3, such an estimation may not be an upper bound on
the WCET of the application due to timing anomalies, i.e., the actual execution time
may be larger than EXEBFS during runtime when some task take less than their
A
CA=1
C Cc=2
D CD=1
B CB=2
E CE=5
H CG=1
F CF=2
G CG=2
A CA=1
D CD=1
B CB=2
E CE=5
H CG=1
F CF=2
G CG=2
A
C
B F D
E
G
1 2 3 4 5 6 7 8 9 10
Processors
P0
P1
H A B
F D E
1 2 3 4 5 6 7 8 9 10
Processors
P0
P1
H G
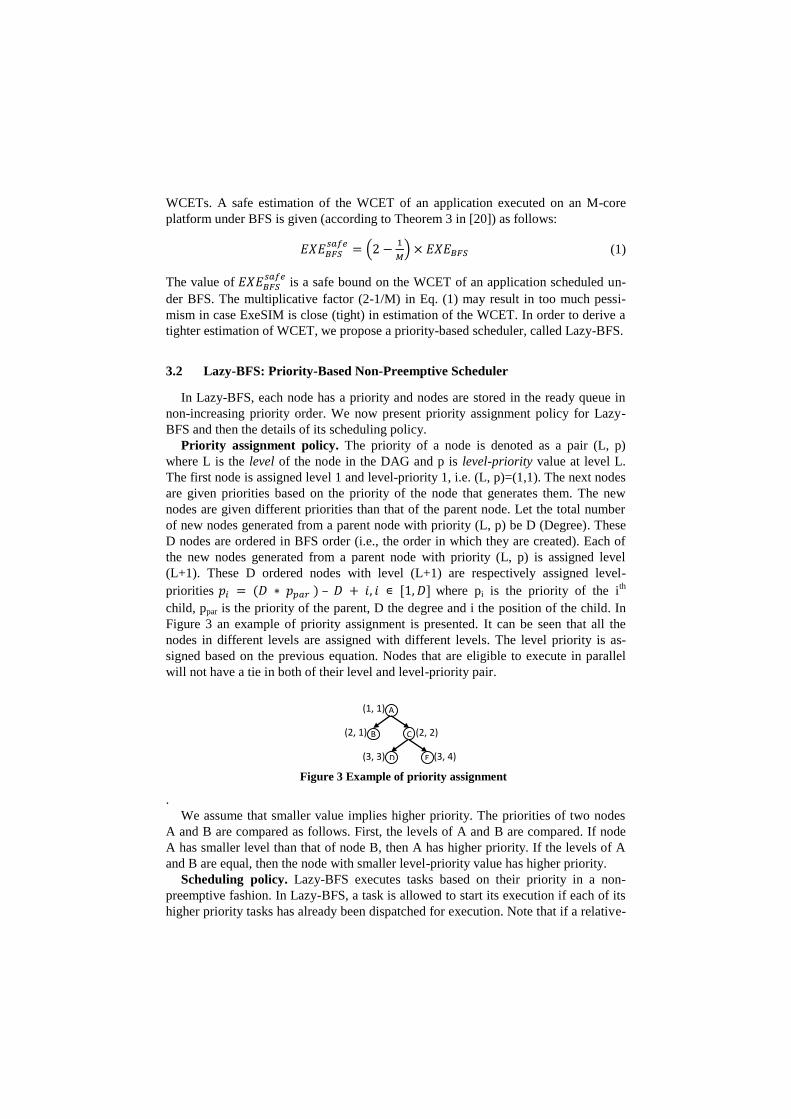
WCETs. A safe estimation of the WCET of an application executed on an M-core
platform under BFS is given (according to Theorem 3 in [20]) as follows:
(1)
The value of
is a safe bound on the WCET of an application scheduled un-
der BFS. The multiplicative factor (2-1/M) in Eq. (1) may result in too much pessi-
mism in case ExeSIM is close (tight) in estimation of the WCET. In order to derive a
tighter estimation of WCET, we propose a priority-based scheduler, called Lazy-BFS.
3.2 Lazy-BFS: Priority-Based Non-Preemptive Scheduler
In Lazy-BFS, each node has a priority and nodes are stored in the ready queue in
non-increasing priority order. We now present priority assignment policy for Lazy-
BFS and then the details of its scheduling policy.
Priority assignment policy. The priority of a node is denoted as a pair (L, p)
where L is the level of the node in the DAG and p is level-priority value at level L.
The first node is assigned level 1 and level-priority 1, i.e. (L, p)=(1,1). The next nodes
are given priorities based on the priority of the node that generates them. The new
nodes are given different priorities than that of the parent node. Let the total number
of new nodes generated from a parent node with priority (L, p) be D (Degree). These
D nodes are ordered in BFS order (i.e., the order in which they are created). Each of
the new nodes generated from a parent node with priority (L, p) is assigned level
(L+1). These D ordered nodes with level (L+1) are respectively assigned level-
priorities – where pi is the priority of the ith
child, ppar is the priority of the parent, D the degree and i the position of the child. In
Figure 3 an example of priority assignment is presented. It can be seen that all the
nodes in different levels are assigned with different levels. The level priority is as-
signed based on the previous equation. Nodes that are eligible to execute in parallel
will not have a tie in both of their level and level-priority pair.
.
We assume that smaller value implies higher priority. The priorities of two nodes
A and B are compared as follows. First, the levels of A and B are compared. If node
A has smaller level than that of node B, then A has higher priority. If the levels of A
and B are equal, then the node with smaller level-priority value has higher priority.
Scheduling policy. Lazy-BFS executes tasks based on their priority in a non-
preemptive fashion. In Lazy-BFS, a task is allowed to start its execution if each of its
higher priority tasks has already been dispatched for execution. Note that if a relative-
Figure 3 Example of priority assignment
(1, 1)
(2, 1) (2, 2)
(3, 3) (3, 4)
A
B C
D E

ly higher priority task is not generated yet, a relatively lower priority task, which may
be in the ready queue, cannot start its execution even if some core is idle. This ensures
that tasks are executed strictly in their decreasing priority order. The policy is non-
greedy (lazy) in the sense that ready task may not be executed even if a core is idle.
We may have a situation where some higher priority task would not be created (e.g.,
due to conditional spawn) while a relatively lower priority task waits in the ready
queue. This may create a deadlock situation. We avoid deadlock as follows: if all
cores become idle, then the highest priority task from the ready queue is dispatched
for execution even if some of its (non-existent) higher-priority task is not yet dis-
patched for execution.
Whenever a new task starts execution, the priority of that task is stored in variable
(Llowest, plowest) in the runtime system. If multiple tasks are ready to execute in the
ready queue, Lazy-BFS starts executing the highest priority-task with priority (L, p)
non-preemptively on an idle core if one of the two following conditions are satisfied:
(C1) If at least one core is busy when (Llowest, plowest) = (L, p-1), then each of the
tasks having priorities higher than (L, p) have either finished execution or are current-
ly in execution. In such case, the highest-priority ready task with priority (L, p) is
allocated to the idle core for execution. We also set (Llowest, plowest) = (L,p) to specify
that the lowest-priority task that is already given a core has priority (L,p).
(C2) If all the cores become idle, then the highest-priority ready task with priority
(L, p) is allocated to the idle core for execution. We also set (Llowest, plowest)=(L,p).
4 Analysis Framework
We consider a multicore platform with M identical cores such that each core has a
(normalized) speed 1. We consider a time-predicable multicore architecture [15, 23]
such that an upper bound on time to access any shared resource, for example, memory
controllers [16], cache [17, 18], inter-connection network [19] is known.
We focus on parallel applications assuming a task-based dataflow parallel pro-
gramming model (e.g. Cilk [4], OpenMP [5]). A parallel application is modeled as a
directed acyclic graph (DAG) denoted by G = (V, E) where V (the set of nodes) is the
set of tasks and E (the set of edges) is the set of dependencies between tasks. If there
is an edge from node ui V to node uk V, then the edge specifies that execution of
task uk can start only after execution of task ui completes.
We assume that the WCET of each node of the DAG is known (please see [10]
where such an approach is proposed). The WCET of a node u V is denoted as Cu.
The WCET of each node includes any synchronization delay due to critical sections
(please see [21] that proposes time-predictable synchronization primitives). The over-
heads related to scheduling decisions and managements of tasks in the ready queue
have been incorporated in the WCET of the corresponding task.
In addition to the occurrences of timing anomalies, another major challenge in ana-
lyzing a dynamically scheduled parallel program is the many possible execution inter-
leavings of different parallel nodes. We present a methodology to model the structure
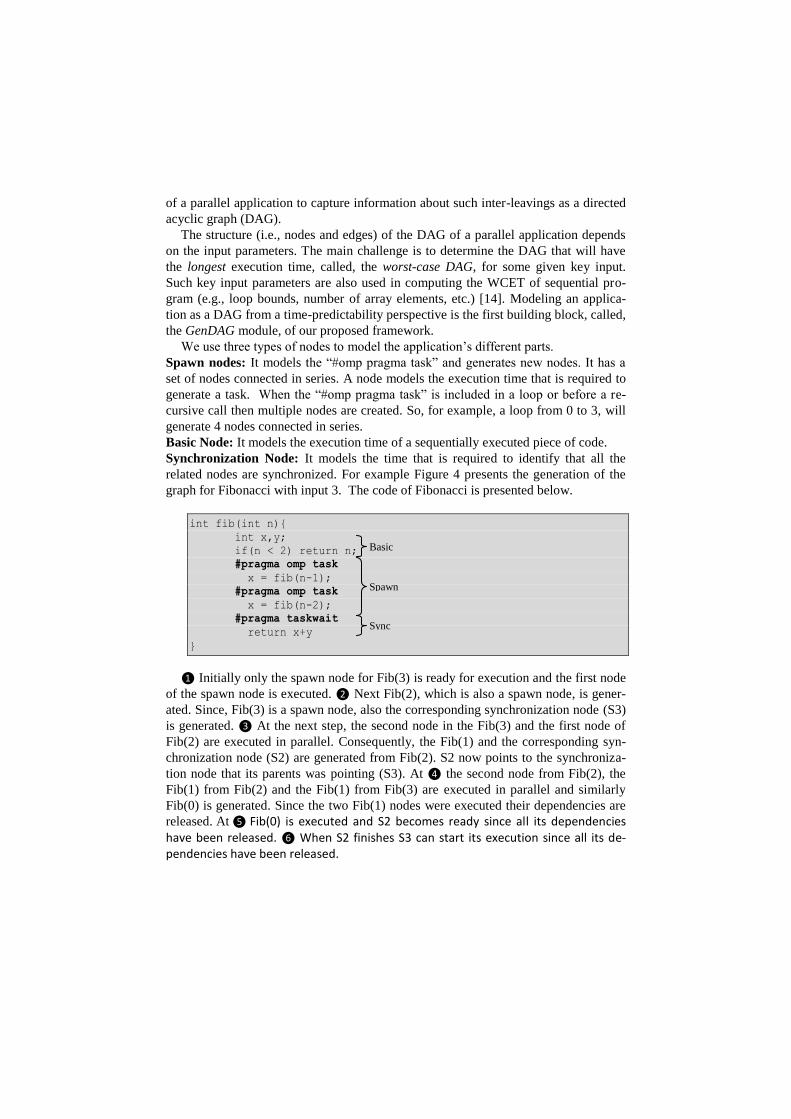
of a parallel application to capture information about such inter-leavings as a directed
acyclic graph (DAG).
The structure (i.e., nodes and edges) of the DAG of a parallel application depends
on the input parameters. The main challenge is to determine the DAG that will have
the longest execution time, called, the worst-case DAG, for some given key input.
Such key input parameters are also used in computing the WCET of sequential pro-
gram (e.g., loop bounds, number of array elements, etc.) [14]. Modeling an applica-
tion as a DAG from a time-predictability perspective is the first building block, called,
the GenDAG module, of our proposed framework.
We use three types of nodes to model the application’s different parts.
Spawn nodes: It models the “#omp pragma task” and generates new nodes. It has a
set of nodes connected in series. A node models the execution time that is required to
generate a task. When the “#omp pragma task” is included in a loop or before a re-
cursive call then multiple nodes are created. So, for example, a loop from 0 to 3, will
generate 4 nodes connected in series.
Basic Node: It models the execution time of a sequentially executed piece of code.
Synchronization Node: It models the time that is required to identify that all the
related nodes are synchronized. For example Figure 4 presents the generation of the
graph for Fibonacci with input 3. The code of Fibonacci is presented below.
int fib(int n){
int x,y;
if(n < 2) return n;
#pragma omp task
x = fib(n-1);
#pragma omp task
x = fib(n-2);
#pragma taskwait
return x+y
}
❶ Initially only the spawn node for Fib(3) is ready for execution and the first node
of the spawn node is executed. ❷ Next Fib(2), which is also a spawn node, is gener-
ated. Since, Fib(3) is a spawn node, also the corresponding synchronization node (S3)
is generated. ❸ At the next step, the second node in the Fib(3) and the first node of
Fib(2) are executed in parallel. Consequently, the Fib(1) and the corresponding syn-
chronization node (S2) are generated from Fib(2). S2 now points to the synchroniza-
tion node that its parents was pointing (S3). At ❹ the second node from Fib(2), the
Fib(1) from Fib(2) and the Fib(1) from Fib(3) are executed in parallel and similarly
Fib(0) is generated. Since the two Fib(1) nodes were executed their dependencies are
released. At ❺ Fib(0) is executed and S2 becomes ready since all its dependencies have been released. ❻ When S2 finishes S3 can start its execution since all its de-pendencies have been released.
Basic
Spawn
Sync

The second building block of our proposed framework is the DAG execution simu-
lator called, the ExeSIM module. The purpose of this module is to simulate the execu-
tion of the worst-case DAG to find the WCET of parallel applications under some
scheduling policy. Throughput-oriented run-time systems have various sources of
time unpredictability, for example, random work stealing. We implement the ExeSIM
module from scratch to avoid such sources of timing unpredictability. ExeSIM is an
event-based simulator that mimics the execution of the tasks of a parallel application.
The input to ExeSIM is the root node of the worst-case DAG of an application and the
output is the execution time of the entire application. In Figure 5 is presented an ab-
stract view of the simulator. The GenDag module inserts new ready nodes to the
ready queue. Based on the scheduling policy and the available processors the appro-
priate nodes are selected for execution. The results are feedback to GenDag to pro-
gress the execution of application.
Figure 5 Abstract view of ExeSim simulator.
Scheduling Policy
ExSim HW Status
Execute
Choose ready nodes
Available processors
New Nodes
Progress Application
GenDAG
INPUT
Ready Q
WCET
❻ ❼ Spawn node Basic node Sync node
Dependency
Generated
Release
Dependency
Finished
❶ Fib(3) ❷ Fib(3)
Fib(2)
S3
Fib(1)
Fib(1)
S2
S3
❸ Fib(3)
Fib(2)
❹
Fib(1)
Fib(1)
S2
S3
Fib(3)
Fib(2)
❺
Fib(1)
Fib(1)
S2
S3
Fib(3)
Fib(2) Fib(1)
Fib(1)
S2
S3
Fib(3)
Fib(2) Fib(1)
Fib(1)
S2
S3
Fib(3)
Fib(2)
Figure 4 Example of graph generation for Fibonacci 3

5 Experiments
The code of Fibonacci from BOTS is analyzed to generate its worst-case DAGs
based on GenDAG module. Recall that we assume that the WCET of each individual
node is known. The WCET of each spawn, sync, and basic node is assumed to 300,
100 and 400 time units, respectively.
We computed the WCET of each application using ExeSIM considering variation
in input size (denoted by n), number of available cores (denoted by M), and schedul-
ing policies (BFS or Lazy-BFS). Since ExeSIM is implemented as a sequential pro-
gram, currently it is capable of handling small inputs. It is expected that the experi-
mental results for large input and other applications from BOTS will follow similar
trends presented here. In execution-time-based timing anomaly, some nodes of the
DAG take less than their WCETs. To capture such behavior, we consider two addi-
tional parameters: pN and pW that are defined as follows.
Parameter pN ranges in [0, 1] and represents the percentage of nodes of a DAG for
which the “actual” execution time is less than their WCETs. A node that takes smaller
execution time than its WCET is called an “anomaly-critical” node. Parameter pW
captures the actual execution time of an anomaly-critical node as the percentage of its
WCET. These two new parameters pN and pW are used as follows.
When a new node is generated by the GenDAG module, a random number using
some built-in function rand() in the range [0,1] is generated. If rand() is larger than
pN, then the new node’s actual execution time is set to its WCET; otherwise, the new
node’s actual execution time is set to pW times its WCET. For example, assume that
the WCET of a new node is 20. Let pN=0.3 and pW=90% for some experiment. If
rand() generates 0.75, then the new node executes for 20 time units that is equal to its
WCET because 0.75 > pN=0.3. If rand() is 0.15, then the node’s execution time is set
to (pW 20)=(90% 20)=18 time units.
The ExeSIM simulator determines the execution time of the entire application
based on the actual execution time of each node. If the computed execution time of
the application is larger than the estimated WCET for a specific scheduling policy,
then a timing anomaly is detected for that scheduling policy.
Each experiment is characterized by four parameters (n, M, pN, pW). We consid-
ered 20 different values of pN {0.05, 0.1, …, 1.0} and pW=98%. For some given
values of n and M, we compute the execution time 10.000 times for BFS. At each
value of pN for some given n and M, the percentage of cases where the computed
execution time is larger than the computed WCET, an anomaly is detected. This per-
centage of 10.000 executions is the “percentage of timing anomaly”.
The results are presented in Figure 5 for Fibonacci with input n= 10, 11, 12, and13
considering M = 4, 8 and 16 cores. The x-axis in the graphs Figure 5 represents the
percentage of anomaly-critical node (pN) and the y-axis represents the percentage of
timing anomalies under BFS. It is evident that for all input parameters and number of
cores, BFS suffers from timing anomalies. In summary, timing anomalies are frequent
and we need mechanism to mitigate them.
A safe bound using BFS is given in Eq. (1). The estimation of the WCET under
Lazy-BFS is safe by construction since timing anomalies cannot occur in Lazy-BFS.
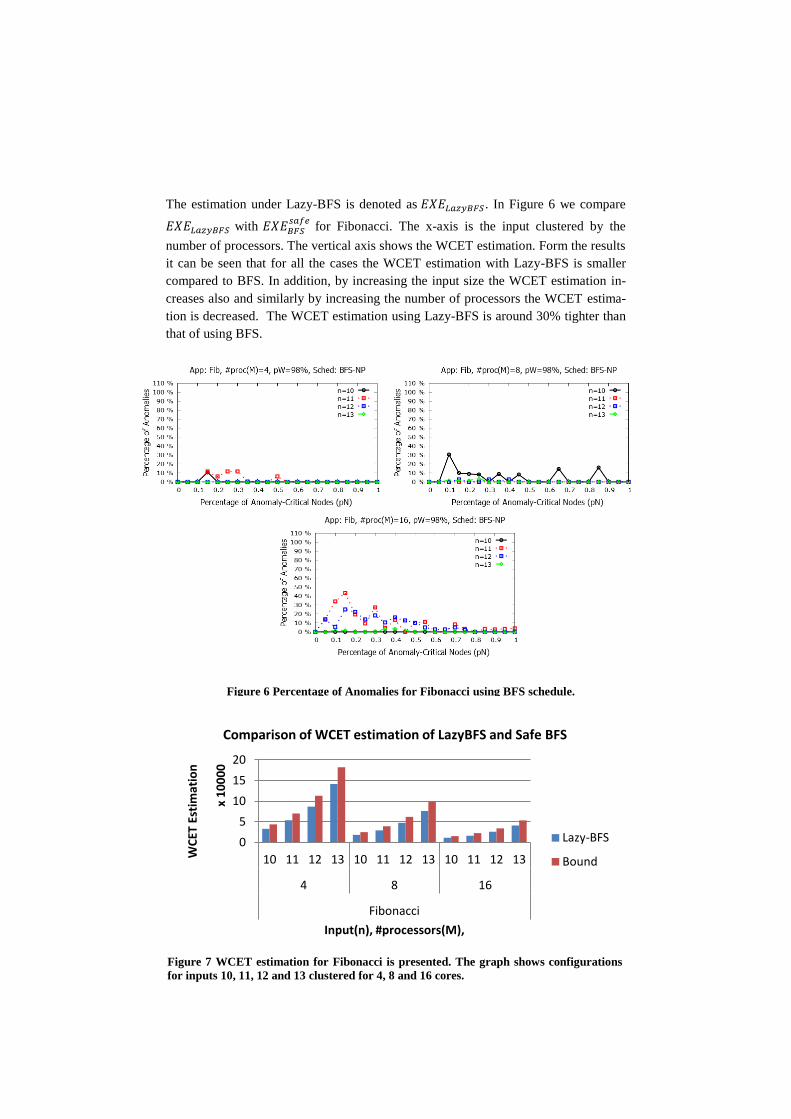
The estimation under Lazy-BFS is denoted as . In Figure 6 we compare
with
for Fibonacci. The x-axis is the input clustered by the
number of processors. The vertical axis shows the WCET estimation. Form the results
it can be seen that for all the cases the WCET estimation with Lazy-BFS is smaller
compared to BFS. In addition, by increasing the input size the WCET estimation in-
creases also and similarly by increasing the number of processors the WCET estima-
tion is decreased. The WCET estimation using Lazy-BFS is around 30% tighter than
that of using BFS.
\
Figure 7 WCET estimation for Fibonacci is presented. The graph shows configurations
for inputs 10, 11, 12 and 13 clustered for 4, 8 and 16 cores.
0
5
10
15
20
10 11 12 13 10 11 12 13 10 11 12 13
4 8 16
Fibonacci
WC
ET E
stim
atio
n
x 1
00
00
Input(n), #processors(M),
Comparison of WCET estimation of LazyBFS and Safe BFS
Lazy-BFS
Bound
Figure 6 Percentage of Anomalies for Fibonacci using BFS schedule.
6 Related Work
A parallel program is relatively more complex to analyze than a sequential pro-
gram due to many possible inter-leavings of the threads. Recently, the design of many
time-predictable hardware has been proposed by many researchers [15, 23]. In such
an architecture, the upper bound on accessing a shared hardware resource is known
(predictable). Time-predictable hardware is increasingly receiving attractions in ana-
lyzing timing behavior of parallel programs [8, 9, 10, 21, 22]. Model checking is used
in [22] by modeling spinlocks, private and shared caches to derive the WCET of small
parallel program. However, the approach in [22] suffers from state space explosion
for higher number of parallel tasks.
The work in [8] considers computing WCET of a hard real-time parallel 3D multigrid
solver running on a time-predictable MERASA multicore processor. Similar to our
approach, [8] also considers dividing the code in parts that can execute in parallel.
The main challenge addressed in [8] is to estimate an upper bound on delay due to
synchronization. Ozaktas et al. [9] also proposed techniques to compute an upper
bound on stall time due to synchronization. The work in [10] proposed an approach to
compute WCET of parallel application where sequential tasks execute on different
cores and they communicate via messages. The main idea in [10] is that the entire
application is analyzed using a graph that connects the control-flow graphs of each
task using edges used to model communication channel across threads. However,
these works [8, 9, 10] assume that (i) the number of threads is no larger than the num-
ber of cores, and (ii) each thread is statically assigned to one core. There exists, to the
best of our knowledge, no work that considers computing the WCET of a dynamically
scheduled parallel application.
7 Conclusion
This paper proposes a framework to compute the WCET of a dynamically scheduled
parallel application. The framework has two major modules: GenDAG and ExeSIM.
The GenDAG module is used to model a parallel application as a DAG. The ExeSIM
is an event based simulator designed from scratch to avoid any timing-
unpredictability feature often found in throughput-oriented runtime systems.
It has been shown that even if the runtime system and hardware is time predicta-
ble, execution-based timing anomalies can occur in BFS. A safe margin is added to
the estimation of BFS to mitigate the effect of timing anomalies. The Lazy-BFS
scheduler is free from any timing anomalies (i.e., safe) and around 30% tighter in
estimating the WCET compared to the safe estimation of BFS.

8 References
[1] R.I. Davis and A. Burns, “A Survey of Hard Real-Time Scheduling for Multiprocessor Systems”, ACM Computing Surveys, 43(4), 2011.
[2] A. Burns and A. Wellings, “Real-Time Systems and Programming Languages”, 4th ed., Addison Wesley Longmain, Reading, MA, 2009.
[3] Gene M. Amdahl, “Validity of the single processor approach to achieving large scale computing capabilities”, in Proc. of AFIPS, 1967.
[4] Robert D. Blumofe and Charles E. Leiserson; “Scheduling multithreaded computations by work stealing”; Journal of the ACM, 46(5):720–748, September 1999.
[5] Openmp application program interface. Version 4.0, Jul 2013.
[6] A. Saifullah, D. Ferry, J. Li, K. Agrawal, C. Lu, C. Gill, “Parallel real-time scheduling of DAGs”, IEEE Trans. on Parallel and Distributed Systems; 25(12); 2014
[7] K. Lakshmanan, S. Kato, and R. R. Rajkumar, "Scheduling parallel real-time tasks on multi-core processors," in Proc. of RTSS, 2010.
[8] Christine Rochange et al., “WCET Analysis of a Parallel 3D Multigrid Solver Executed on the MERASA Multi-core” in Proc of the WCET, 2010.
[9] H. Ozaktas et al. “Automatic wcet analysis of real-time parallel applications”, in Proc. of the WCET, 2013.
[10] Dumitru Potop-Butucaru and Isabelle Puaut, “Integrated Worst-Case Execution Time Estimation of Multicore Applications”, in Proc. of WCET Analysis, 2013.
[11] Alejandro Duran, Xavier Teruel, Roger Ferrer, Xavier Martorell, and Eduard Ayguade, “Barcelona OpenMP Tasks Suite: A Set of Benchmarks Targeting the Exploitation of Task Parallelism in OpenMP”, In Proc. of ICPP, 2009.
[12] Girija J. Narlikar, “Scheduling threads for low space requirement and good locality”, Proc. of the symposium on Parallel algorithms and architectures, 1999.
[13] Matteo Frigo , Charles E. Leiserson , Keith H. Randall, The implementation of the Cilk-5 multithreaded language, Proc. of conference on Programming language design and implementation, 1998.
[14] Reinhard Wilhelm et al “The worst-case execution-time problem—overview of methods and survey of tools.” ACM Trans. Embed. Comput. Syst. 7(3), 2008.
[15] Marco Paolieri, Eduardo Quiñones, Francisco J. Cazorla, Guillem Bernat, and Mateo Valero. Hardware support for WCET analysis of hard real-time multicore systems. In Proc. of ISCA, 2009.
[16] J. Staschulat, S. Schliecker M. Ivers, R. Ernst, “Analysis of Memory Latencies in Multi-Processor Systems” In proc of WCET, 2007.
[17] R. Mancuso, R. Dudko, E. Betti, M. Cesati, M. Caccamo, and R. Pellizzoni, "Real-time cache management framework for multi-core architectures", in Proc. RTAS, 2013.
[18] Damien Hardy, Thomas Piquet, and Isabelle Puaut. Using Bypass to Tighten WCET Estimates for Multi-Core Processors with Shared Instruction Caches, Proc of RTSS, 2009.
[19] Jakob Rosén, Alexandru Andrei, Petru Eles, and Zebo Peng. Bus Access Optimization for Predictable Implementation of Real-Time Applications on Multiprocessor Systems-on-Chip. In Proc. of the RTSS, 2007.
[20] R. L. Graham. Bounds on multiprocessing timing anomalies. SIAM Journal of Applied Mathematics, 17(2), 1969.
[21] Wolf, J.; Gerdes, M.; luge, F.; hrig, S.; Mische, J.; Metzlaff, S.; Rochange, C.; Cass , H.; Sainrat, P.; Ungerer, T., "RTOS Support for Parallel Execution of Hard Real-Time Applications on the MERASA Multi-core Processor," Proc. of the ISORC, 2010
[22] Andreas Gustavsson, Andreas Ermedahl, Björn Lisper, and Paul Pettersson. Towards WCET analysis of multicore architectures using UPPAAL. Proc. of WCET, 2010.
[23] Martin Schoeberl. Time-predictable computer architecture. EURASIP J. Embedded Syst. 2009.


![[Advantech] PAC SW Multiprog Tutorial step by step](https://img.dokumen.tips/doc/110x75/5876dbcf1a28ab1d238b6f47/advantech-pac-sw-multiprog-tutorial-step-by-step.jpg)