Embed Size (px)
Citation preview

i
N A S A T E C H N I C A L
M E M O R A N D U M
MULTIPLE-ORIFICE LIQUID INJECTION INTO HYPERSONIC AIR STREAMS A N D APPLICATION TO RAM C-I11 FLIGHT
N A T I O N A L A E R O N A U T I C S A N D S P A C E A D M I N I S T R A T I O N W A S H I N G T O N , 0. C. FEBRUARY 1972
https://ntrs.nasa.gov/search.jsp?R=19720008294 2018-06-21T18:51:38+00:00Z

ERRATA
NASA Technical Memorandum X-2486
MULTIPLE-ORIFICE LIQUID INJECTION INTO HYPERSONIC AIRSTREAMS AND APPLICATION
TO RAM C-III FLIGHT
By William L. Weaver February 1972
Page 19, table I: The sixth item under "Nozzle patterns" for the flat-plate model should read as follows:
Page 30, figure 7(b): The upper left photograph was inadvertently printed upside down. A corrected page 30 is attached.
Pages 33 and 35, figures lO(a) and lO(c): The two photographs on the right of each page of figures were inadvertently printed interchanged. Corrected pages 33 and 35 are attached.
Page 45, figure 14(f): The first equation in the notation under the top three photographs should be changed from qrn = 16.3 kN/m2 to g = 16.3 kN/m2.
03
Issued October 1972
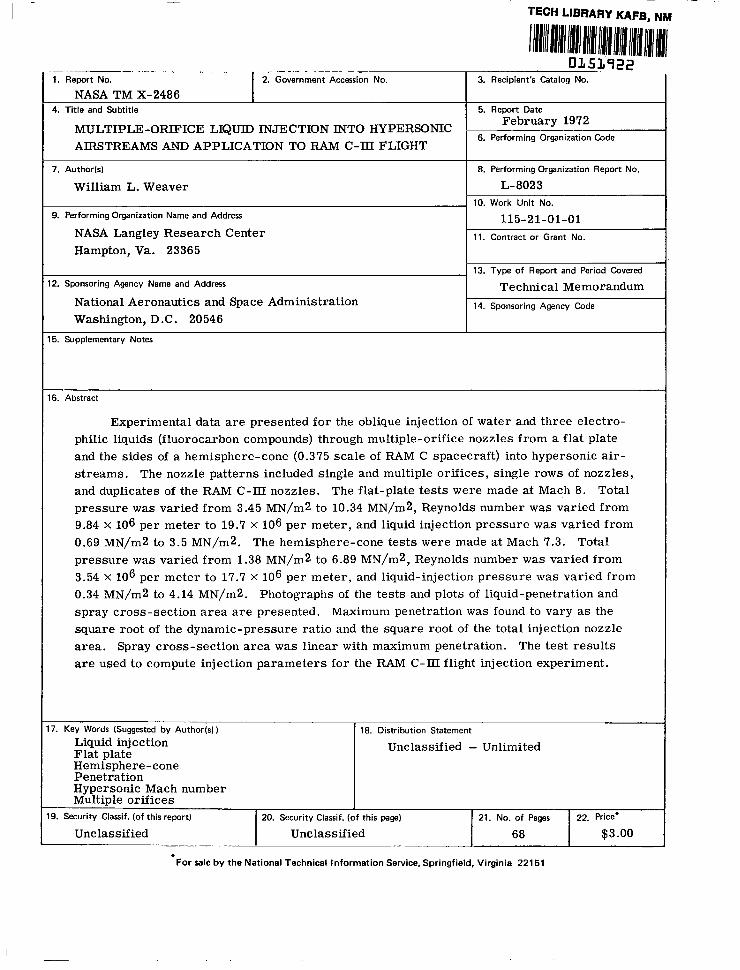
TECH LIBRARY KAFB, NM
1. Report No. 3. Recipient's Catalog No. 2. Government Accession No. NASA TM X-2486
4. Title and Subtitle I 5. Report Date
MULTIPLE-ORIFICE LIQUID INJECTION INTO HYPERSONIC I AIRSTREAMS AND APPLICATION TO RAM C-IKI FLIGHT I
February 1972 6. Performing Organization Code
7. Author(s1 8. Performing Organization Report No.
William L. Weaver L-8023 10. Work Unit No.
9. Performing Organization Name and Address 115-21-01-01 NASA Langley Research Center Hampton, Va. 23365
11. Contract or Grant No.
13. Type of Report and Period Covered 2. Sponsoring Agency Name and Address Technical Memorandum
National Aeronautics and Space Administration Washington, D .C. 20546
14. Sponsoring Agency Code
5. Supplementary Notes
6. Abstract
Experimental data are presented for the oblique injection of water and three electro- philic liquids (fluorocarbon compounds) through multiple-orifice nozzles from a flat plate and the sides of a hemisphere-cone (0.375 scale of RAM C spacecraft) into hypersonic air- streams. The nozzle patterns included single and multiple orifices, single rows of nozzles, and duplicates of the RAM C-III nozzles. The flat-plate tests were made at Mach 8. Total pressure was var ied f rom 3.45 MN/m2 to 10.34 MN/m2, Reynolds number was varied from 9.84 X 10⁶ per meter to 19.7 X 10⁶ per meter, and liquid injection pressure was varied from 0.69 MN/m2 to 3.5 MN/m2. The hemisphere-cone tests were made at Mach 7.3. Total pressure was varied from 1.38 MN/m2 to 6.89 MN/m2, Reynolds number was varied from 3.54 X lo6 per meter to 17.7 X 10⁶ per meter, and l iquid-injection pressure was varied from 0.34 MN/m2 to 4.14 MN/m2. Photographs of the tests and plots of liquid-penetration and spray cross-section area are presented. Maximum penetration was found to vary as the square root of the dynamic-pressure ratio and the square root of the total injection nozzle area. Spray cross-section area was linear with maximum penetration. The test results are used to compute injection parameters for the RAM C-JII flight injection experiment.
7. Key Words (Suggested by Author(s) ) -
I 18. Distribution Statement Liquid injection Flat plate Hemisphere-cone Penetration HvDersonic Mach number
Unclassified - Unlimited
Mxltiple orifices ~
9. Security Classif. (of this report) 20. Security Classif. (of this page) 1 2 1 . NO. of Pages I 22. Price'
Unclassified I Unclassified $3.00 68 -. . - .~
For sale by the National Technical Information Service, Springfield, Virginia 22151

I
MULTIPLE-ORIFICE LIQUlD INJECTION
INTO HYPERSONIC AIRSTREAMS AND APPLICATION
TO RAM C-III FLIGHT
By William L. Weaver Langley Research Center
SUMMARY
Experimental data are presented for the oblique injection of water and three electro- philic liquids (fluorocarbon compounds) through multiple-orifice nozzles from a flat plate and the sides of a hemisphere-cone (0.375 scale of RAM C spacecraft) into hypersonic air- streams. The nozzle patterns included single and multiple orifices, single rows of noz- zles, and duplicates of the RAM C-III nozzles. The flat-plate tests were made at Mach 8. Total pressure was varied from 3.45 MN/m2 to 10.34 MN/m2, Reynolds number was varied from 9.84 x 10⁶ per meter to 19.7 x 10⁶ per meter, and liquid injection pressure was varied from 0.69 MN/m2 to 3.5 MN/m2. The hemkphere-cone tests were made at Mach 7.3. Total pressure was varied from 1.38 MN/m2 to 6.89 MN/m2, Reynolds num- ber was varied from 3.54 X 10⁶ per meter to 17.7 X 10⁶ per meter, and liquid-injection pressure was varied from 0.34 MN/m2 to 4.14 MN/m2. Photographs of the tests and plots of liquid-penetration and spray cross-section area are presented. Maximum pene- tration w a s found to vary as the square root of the dynamic-pressure ratio and the square root of the total injection nozzle area. Spray cross-section area was linear with maxi- mum penetration. The test results are used to compute injection parameters for the RAM C-III flight injection experiment.
INTRODUCTION
Project RAM (Radio Attenuation Measurements) at the Langley Research Center has, for several years, studied the problem of radio-frequency signal blackout produced by ionization surrounding a spacecraft during high-speed entry into the earth's atmosphere. Four flight experiments, which were flown on Scout vehicles from Wallops Island, Virginia, have been conducted during this program to investigate liquid injection as a technique for reducing radio-signal attenuation caused by this entry plasma. Results from the first three flight experiments are reported in references 1 to 3, and preliminary results from the fourth (RAM C-III) are reported in reference 4.

Most of the liquid injection studies prior to RAM have investigated the case of single-orifice injection into two-dimensional airflow (refs. 5 to 10, for example). The RAM flight experiments have investigated the case of multiple-orifice liquid injection into the flow fields of blunt bodies, and several wind-tunnel injection studies have been con- ducted to provide the injection data required in the flight-experiment design and in the analyses of the flight data. The studies of references 2 and 11 included tests with scale models of the GT-3 and RAM B-11 spacecraft, and the study of reference 12 included tests in which the model and injection nozzles were scaled to the ram C-I flight hardware. D,ata from reference 12 and from the C-I flight indicated some areas in which changes in the nozzle design could improve injection performance; consequently further studies were carried out prior to the flight of the RAM C-III experiment. The first of these studies (reported in ref. 13) showed an increase in penetration due to jet shielding (first reported in ref. 12) fo r up to three orifices in a row on a flat plate. Reference 13 showed also that the point of maximum penetration is moved rearward when the orifices are angled down- stream from the normal, a fact that led to angling the nozzles downstream for RAM C-HI, reducing the possibility of shock disturbance by the jets near the injection site.
In the studies of the current report, water and fluorocarbons were injected from multiple-orifice-nozzle patterns on a flat-plate model and the sides of a hemisphere- cone. The nozzles tested on the hemisphere-cone included duplicates of those flown on RAM C-III, and the data were used in conjunction with flight-measured data to infer flight injection parameters.
Most of the liquid-injection studies continue to investigate the case of single-orifice injection from a flat plate (refs. 14 to 16, for example). In reference 15 liquid penetration for single-orifice injection from a flat plate w a s correlated by an expression which indi- cated a Mach number effect; but a Mach number independent parameter can be obtained by transformation that is basically the same as that which correlates the penetration data of references 12 and 13 and this report. The agreement shown in reference 12 between water-spray trajectories measured with single-orifice injection from a hemisphere-cone and trajectories computed by the equations of reference 16 is now believed to be fortuitous.
SYMBOLS
*j
AS spray cross-section area
total jet or nozzle area
a slope of line for nondimensional penetration
orifice discharge coefficient (see eq. (1))
2

De
Dj
dj
h
M
mj
mj *
n
P
x,y
x' ,Y'
AY
a
P
equivalent orifice diameter (see eq. (5))
measured orifice diameter
effective orifice diameter, CjDj
altitude
Mach number
liquid flow rate (one side only for hemisphere-cone)
liquid f l u x , mj/As (one side only for hemisphere-cone)
number of orifices (one side only for hemisphere-cone)
pressure
dynamic pressure
equivalent local dynamic pressure
Pj V j
P J L jet-to-free-stream dynamic-pressure ratio, -
2
velocity
axes defined in figure 5
axes defined in figure 27
maximum liquid penetration (defined in fig. 5)
injection angle (defined in fig. 5)
liquid or gas density
Y specific-heat ratio
3

Subscripts :
j liquid o r jet
L local airstream
02 free s t ream
fP flat plate
hc hemisphere cone
I line intercept (see eq. (2) and table III)
TEST FACILITIES, APPARATUS, AND METHODS
Wind Tunnels
The flat-plate model tests were conducted in the Langley Mach 8 variable-density tunnel. This is a blowdown tunnel capable of operating at total pressures up to 20.20 MN/m2 and total temperatures up to 840' K. A description of this facility is given in reference 17. In the current tests, the free-stream total pressure was varied between 3.45 MN/m2 and 10.34 MN/m2, Reynolds number was varied between 9.84 X lo6 per meter and 19.7 X 10⁶ per meter, and the temperature was varied between 640° K and 810° K.
The hemisphere-cone model tests were conducted in the Ames 3.5-foot hypersonic wind tunnel. This is a variable-density blowdown tunnel capable of operating at nominal Mach numbers of 5 , 7, and 10, total pressures up to 13.55 MN/m2, and temperatures up to 1170' K. A brief description of this facility is given in reference 18. The current tests were conducted at a Mach number of 7.3. Free-stream total pressure was varied between 1.38 MN/m2 and 6.89 MN/m2; Reynolds number was varied between 3.54 X 10⁶ per meter and 17.7 X 10⁶ per meter; and temperature was constant at 830° K.
Models and Injection Nozzles
A sketch of the stainless-steel flat-plate model and the nozzle assembly tested in the Langley Mach 8 tunnel is shown in figure 1, and a sketch of the stainless-steel hemisphere-cone model and nozzle-disk assemblies for the Ames tests is shown in figure 2. The nozzle assembly for the flat-plate model was built into the plate and inter- faced with the plenum. The assembly was built to receive the same nozzle inserts as those for the hemisphere-cone which are shown in figure 2(b).
4

The hemisphere-cone model had a 5.715-cm-radius hemisphere nose which faired into the go half-angle cone. This is a 0.375-scale model of the RAM C spacecraft and is similar to the test model of reference 12. The wedge fins simulated the external configu- ration of the electrostatic and fixed bias probes which were used on the spacecraft to mea- sure electron and ion densities. The nozzle disks interfaced with the plenum and were built to receive the nozzle inserts from their bottom sides.
A complete list of the nozzle patterns tested on both models, along with other perti- nent information, is given in table I. The number in the open circles denotes the number of orifices in that nozzle, and the solid circles denote plugged nozzles.
Injection Systems and Test Procedures
Injection pressure for the hemisphere-cone tests was provided by a high-pressure gaseous nitrogen source. Pressure was monitored at the regulator and by a transducer in the plenum, and temperature was monitored by a thermocouple in the plenum. For a tunnel test run, a s e t of injection pressures was preselected and the regulator was se t at the first pressure required. After the tunnel reached steady-state operating conditions, the liquid control valve was opened by a remote switch. When steady-state liquid flow was established, photographic equipment w a s operated, and liquid temperature, pressure, and flow rate were recorded. When all data required had been taken for the first injec- tion pressure, the control valve was closed, the regulator was adjusted to a new pressure, and the liquid-injection procedure was repeated.
The pressure system and instrumentation for the flat-plate tests were basically the same as that for the hemisphere-cone tests. The test procedures were also the same except that only one injection pressure was used during each test run.
Photographic Techniques
In the flat-plate tests scattered-light and schlieren photographs were made of the injection in the vertical plane. A coordinate system for making measurements from the scattered-light photographs was established prior to the tests by photographing a grid card which was placed along the center line perpendicular to the flat plate. The camera was mounted rigidly and was not moved during the tests. The lateral cross section of the spray was recorded by a third camera which was mounted at an angle to the plate. A narrow slit of high-intensity light was used to illuminate the spray cross section. A pho- tograph of a grid card mounted in the proper position and orientation permitted determi- nation of the area of the liquid cross section from the photographs. A schematic of the liquid spray and photographs illustrating the two types of photographs from which measure- ments were made in the flat-plate tests are shown in figure 3. Further details on the pho- tographic techniques used can be found in reference 13.
5

In the hemisphere-cone tests scattered-light and schlieren cameras were positioned so that their focal axes were normal to and at the same height as the model center line. The image of the entire model was recorded so that measurements of liquid spray could be scaled directly by the proper model-to-image factors.
Liquids
The four liquids tested are listed along with some of their physical properties in table TI. The three fluorocarbon compounds are all electrophilic, which means they have a n affinity for the capture of electrons. They are all produced commercially. These are the same four liquids used in the tests of reference 13, and water and the Freon E-3 were the liquids tested in the RAM C-Il l flight experiment.
DATA REDUCTION
Liquid Velocity
The initial liquid velocity was required in the analysis of the penetration data. Velocity was computed by the following relationship:
Using this expression is equivalent to treating the less-than-ideal liquid flow from an ori- fice as resulting from a reduction in velocity. Some investigators have treated the flow reduction as resulting from a reduction in the cross-section area of the orifice. It will be seen that this is the case for the study of reference 15. The nozzle-discharge coefficients for most of the nozzle patterns tested were determined by calibration prior to the tests. Figure 4 shows plots of the discharge coefficients for several typical nozzle patterns. For the few nozzles for which no calibrations were made, a value of 0.75 was used for the dis- charge coefficients.
Photographic Measurements
Measurements of maximum liquid (or spray) penetration and measurements of the spray-trajectory coordinates were made from the scattered-light photographs in the flat- plate tests. A grid photograph mentioned earlier was used for these measurements. A grid photograph was also used to measure the spray cross section from the cross-section photographs. The coordinate system and nomenclature used are illustrated in figure 5.
Measurements of maximum liquid penetration were made from the scattered-light photographs in the hemisphere-cone tests. Note that in the sketch of figure 5 maximum penetration measurements are normal to the surface of the cone. In a few cases, no
6
scattered-light photograph was available, and maximum penetration was measured from the schlieren photographs. Figure 6 shows that maximum-penetration measurements from the scattered-light photographs are, on the average, 16 percent greater than those from the schlieren photographs; so when the schlieren photographs were used, the mea- sured values of penetration were multiplied by the factor 1.16.
RESULTS AND DISCUSSION
Treatment and Presentation of Data
Representative photographs are presented for tests with each nozzle pattern for both models. The penetration data are plotted against fi. In some cases the maximum pene- tration is nondimensionalized by the total area of the injection nozzles. Lines are faired through all the data; and, whereas the maximum penetration would actually go to zero at
= 0, some faired lines have nonzero intercepts at fi = 0. The equations for the lines of nondimensional maximum penetration are given in table III along with other pertinent information. This equation has the form
- = a 6 + rlAJ AY
The reference figure refers to the figure wh [ere the nondimen sional line is shown.
Single-Orifice Data
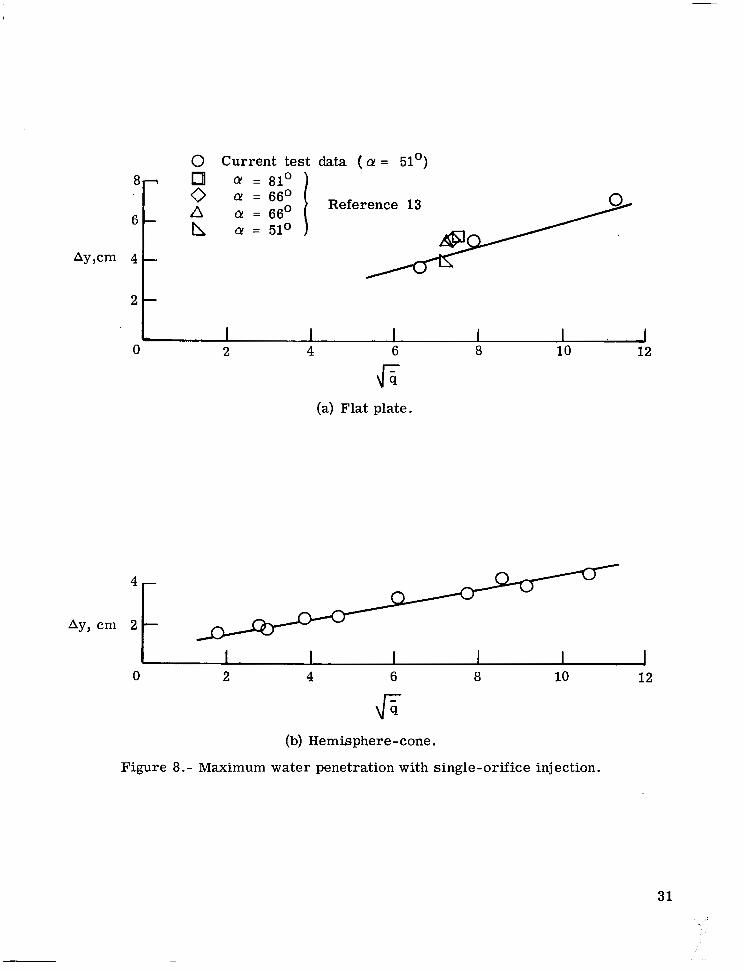
Tests were run only with water injection from a single 0.0508 cm-diameter orifice for both the flat-plate and hemisphere-cone models. Photographs of these tests a r e shown in figure 7. Plots of the maximum-water-penetration data are shown in figure 8. The plots include data from the single-orifice investigation of reference 13. The flat-plate data are also used for the more general correlation of maximum penetration for injection from single nozzles; these data are covered in the next section.
In the tests of reference 15, several liquids were injected from single orifices on a flat plate. The penetration y at a distance x = 150dj downstream from the injection site was found to be correlated by the parameter
The authors of reference 15 showed that this parameter also correlated single-orifice penetration data from other tests at different Mach numbers. They thus concluded that penetration was dependent on Mach number and that this parameter accounted for the
7

effect. Substituting the relationships
pj 2 3 = 1. p . (v j ')2
into equation (3) and transforming reduces the correlation to approximately
Thus the apparent Mach number effect was primarily due to a change in dynamic pressure with Mach number at a constant value of static pressure. This parameter has the same basic form as that which is used to correlate all the data in the current paper.
The tests of reference 16 were all run with normal and upstream liquid injection; however the authors did not restrict the application of the spray-trajectory equations which they developed to this set of injection angles. Figure 9 shows comparisons of mea- sured spray trajectories with spray trajectories computed by the equations of refer- ence 16. One comparison is for data from the current tests and one is from the data of reference 13. It can be seen that in both cases the equations underpredict the spray pen- etration even though the basic shape is predicted. It should be noted that the measure- ments of penetration used in reference 16 to develop these equations were based on spray trajectories which extended, on an average, of only about 5 cm downstream of the injec- tion site. The same is true of the data of reference 15. It can be seen from the photo- graphs (fig. 7) and the trajectory plots (fig. 9) that the spray trajectories are not fully developed at these downstream distances in the current tests. Another possible reason for the disagreement could be the large differences in the dynamic pressures between the current tests and those of reference 16.
Single-Nozzle Data
All of the single-nozzle tests were made with water. Test nozzles for the hemisphere-cone model consisted of one, three, five, or seven orifices of 0.0508 cm diameter. The flat-plate-model nozzles consisted of five o r seven orifices of 0.0254 cm diameter and of one, three, five or seven orifices of 0.0508 cm diameter. Photographs of single-nozzle injection tests are presented in figure 10.
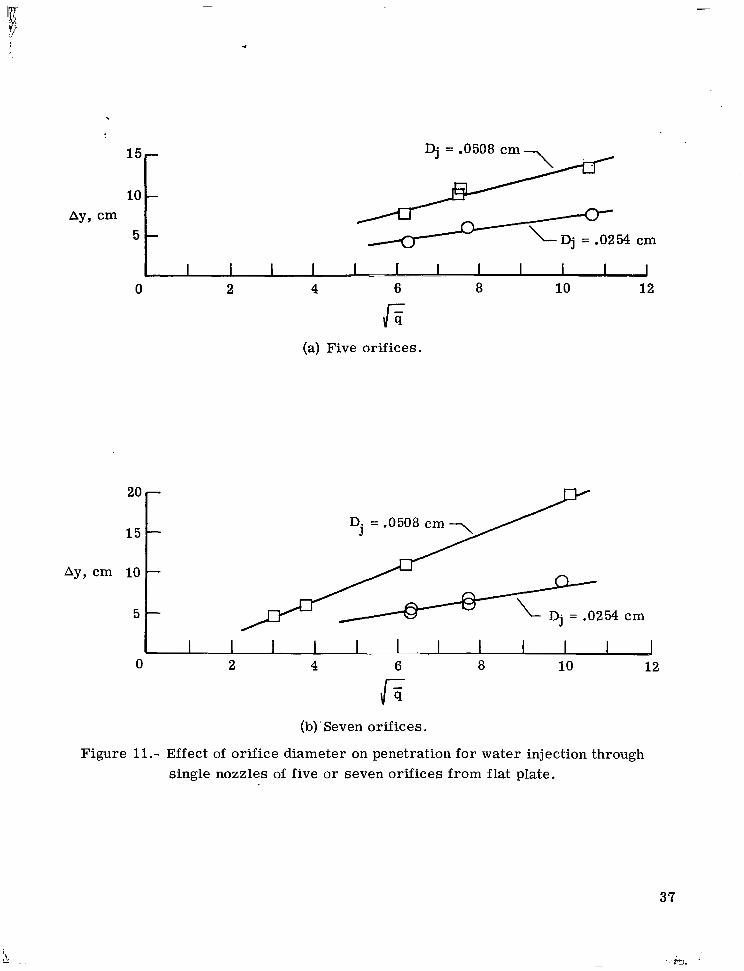
Penetration data.- Figure lO(a) shows photographic comparisons of injection with two different orifice diameters in different nozzles. The effect of doubling the orifice

diameter has a significant effect on penetration. Figure 11 shows the maximum penetra- tion data for these tests. These data also help constitute the more general correlation of maximum penetration for single nozzles to be discussed below.
Figures 10(b) and 1O(c) show the effect of increasing the number of orifices in a nozzle for the flat-plate tests and the hemisphere-cone tests for 0.0508 cm-diameter ori- fices. There is a clearly observed effect on penetration for tests with both models when or i f ices are added to a nozzle. This may not seem to be a surprising result; however multiple-orifice data obtained in reference 2 indicated that penetration was a function of the diameter of one orifice only and did not depend on the number of orifices. The larger spacing between orifices in the tests of reference 2 may have been a factor in the apparent disagreement of that data with the data of this report. The increased penetration due to an increase in orifice number in a nozzle significantly influenced the injection-experiment design for RAM C-III.
The correlation of the nondimensional maximum penetration data for the single noz- z les is shown in figure 12. The penetration is seen to be a function of the square root of the total injection nozzle area Aj . Thus the penetration is proportional to an equivalent orifice diameter
This is consistent with the data of reference 15 which also shows the penetration from a single orifice to be proportional to the orifice diameter. The flat-plate correlation includes data with the clusters of 0.0254 and 0.0508 cm-diameter orifices.
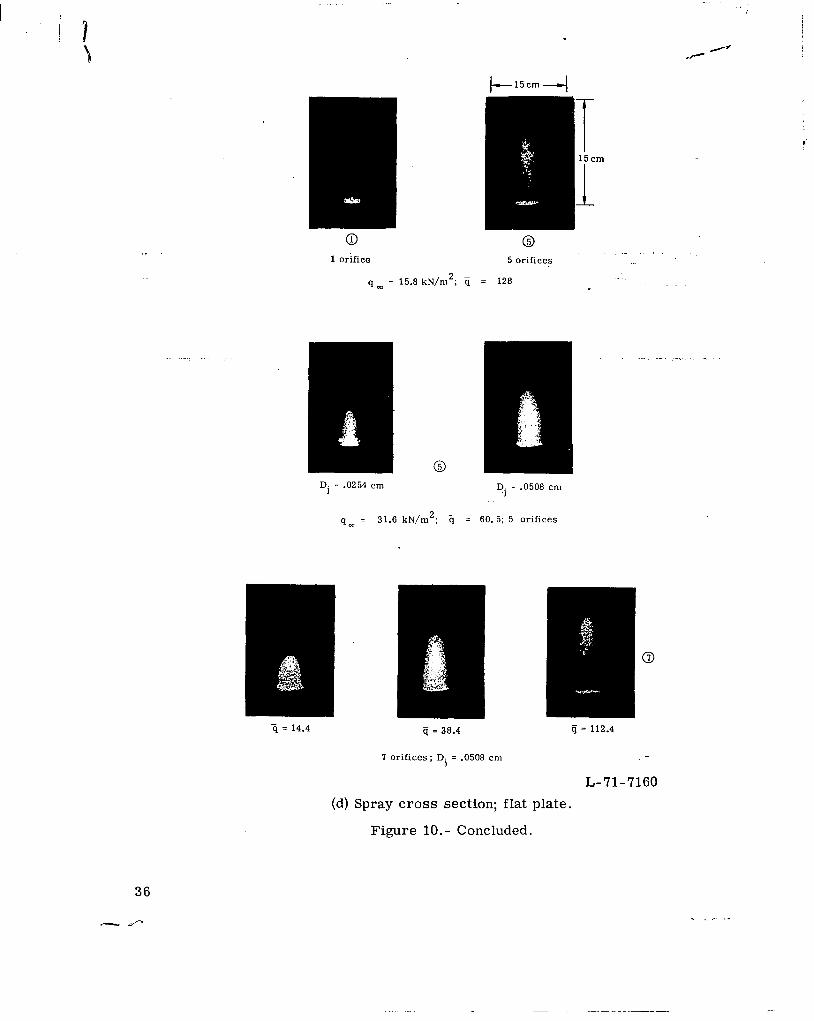
Spray cross-section data.- Figure 10(d) shows some photographic comparisons of the effects of various factors on the spray cross-section area, and figure 13 shows the correlation of the measured spray cross-section area with the maximum penetration. The plotted cross-section data reflect the effects illustrated in the photographs. The average lateral spreading of the spray is approximately constant with penetration for each of the three sets of data plotted (see also the dynamic-pressure-ratio effect photographs of fig. 10(d)) and increases with injection nozzle area to that of a cluster of three 0.0508 cm-diameter orifices.
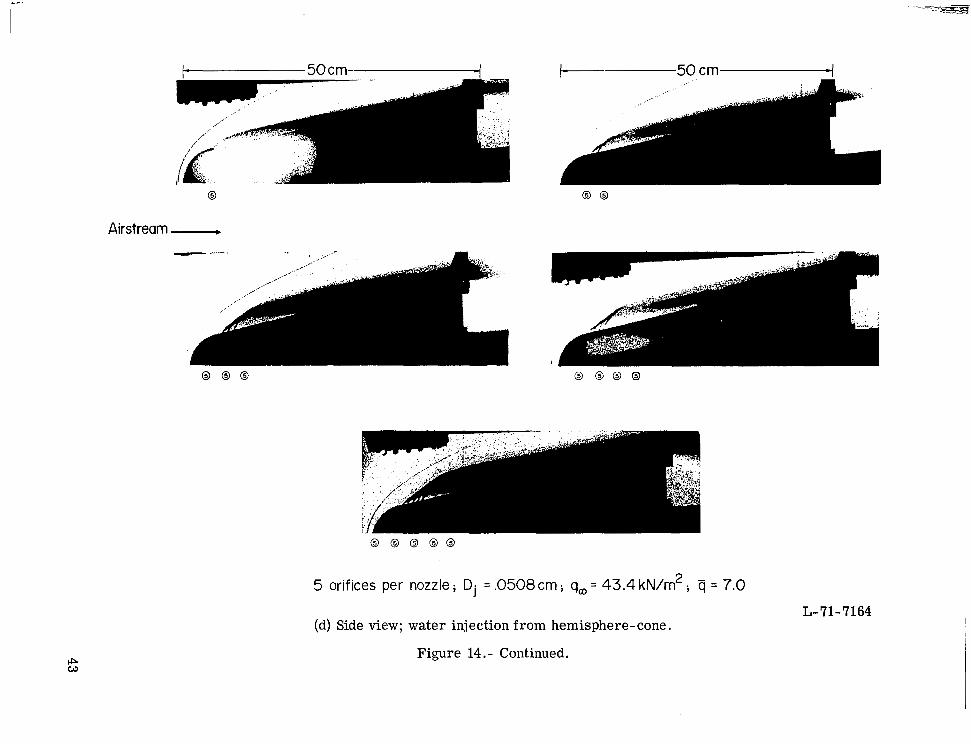
Data With Single Rows of Nozzles
The flat-plate model tests included several different combinations of in-line nozzles. (See table I.) The hemisphere-cone model tests were all made with water injection from nozzles of five orifices each with all orifices 0.0508 cm diameter. Figure 14 shows pho- tographs of the in-line nozzle tests. It can be seen in figure 2(b) that there is a difference in spacing of the nozzles between disks 1 and 2. A comparison of injection from three
9

nozzles using the two disks is shown in figure 14(a). It was concluded that this difference in nozzle spacing does not have a significant effect on penetration.
Penetration data.- An increase in penetration for downstream nozzles can be seen in most of the photographs of figures 14(a) to 14(d). This increase in penetration due to jet shielding was first reported in reference 12, and it was shown in reference 13 to extend two orifices downstream from the first orifice for four different combinations of injection angles. Reference 15, however, concluded that normal injection from two in-line orifices produced the same penetration as that of a single orifice.
The correlations of nondimensional maximum liquid penetration are presented in figure 15. The water-injection data with the flat plate (excluding the row of three single orifices) are in very good agreement with the correlation of the single-nozzle water- injection data of figure 12(a). The penetration data for the Freon E-3 injection is diffi- cult to interpret, and extrapolation of the Freon E-3 penetration data to nozzles of larger orifices and/or to other classes of nozzles should be made with caution.
The penetration correlation for water injection from the hemisphere-cone is in fair agreement with the correlation obtained for single nozzles. (See fig. 12(b).) The equa- tions representing the correlation lines are summarized in table III.
Spray cross-section data.- Some photographs of the cross sections of the liquid spray for both water and Freon E-3 are shown in figure 14(e) and figure 14(f), respectively. Plots of As versus Ay are shown in figure 16. The solid triangles represent penetra- tion heights taken from the cross-section photographs and are not points of maximum pen- etration. The data indicate that spray cross-section area is approximately linear with maximum penetration. The extrapolated lines which fit these data however have nonzero values of penetration at As = 0, and thus extrapolation of the data should be made with caution.
Data With RAM C-111 Nozzles
Figure 17 shows photographic comparisons of the injection tests with the four RAM C-III nozzles at one test condition. The low-flow water and low-flow Freon E-3 nozzles both have about the same penetration, and the high-flow water nozzle is seen to have greater penetration than the high-flow Freon E-3 nozzle. An interesting point is the apparent thinning out of the Freon E-3 in the high-flow photograph and its near disappear- ance in the low-flow photograph. Shock interaction between the main bowshock and that produced by the water can be seen in the high-flow water photograph. The maximum pen- etration data for these nozzle tests are shown in figure 18.
10

Data With Nozzle Pat terns 1 to 4 for Hemisphere-Cone Tests
Figure 19 shows photographs of injection tests with nozzle patterns 1 to 4, and fig- u re 20 presents maximum-penetration data showing the effects of several factors on pen- etration for nozzle patterns 1 and 2.
In figure 19(a) photographic comparisons of injection with different liquids are pre- sented. Freon E-3 is seen to penetrate about the same as FC-43 at the same test condi- tions, and water is seen to penetrate a greater distance than Freon E-3. Figures 20(a) and 20(b) show that the maximum penetration of water is greater than that of the fluoro- carbons for two different orifice diameters in nozzle pattern 1.
The photographs of figure 19(b) show the effect of orifice diameter for injection of water and fluorocarbons from nozzle pattern 1 and for injection of water from nozzle pat- t e rn 2. The difference in maximum penetration due to orifice diameter can be seen for three different cases in figures 20(c), 20(d), and 20(e).
The photographs of figure 19(c) show the effects of adding orifices to nozzles for two different cases. Figures 20(f) and 20(g) show the increase in penetration due to increasing the number of orifices in each nozzle for two different orifice diameters.
Comparison of Flat-Plate Data With Hemisphere-Cone Data
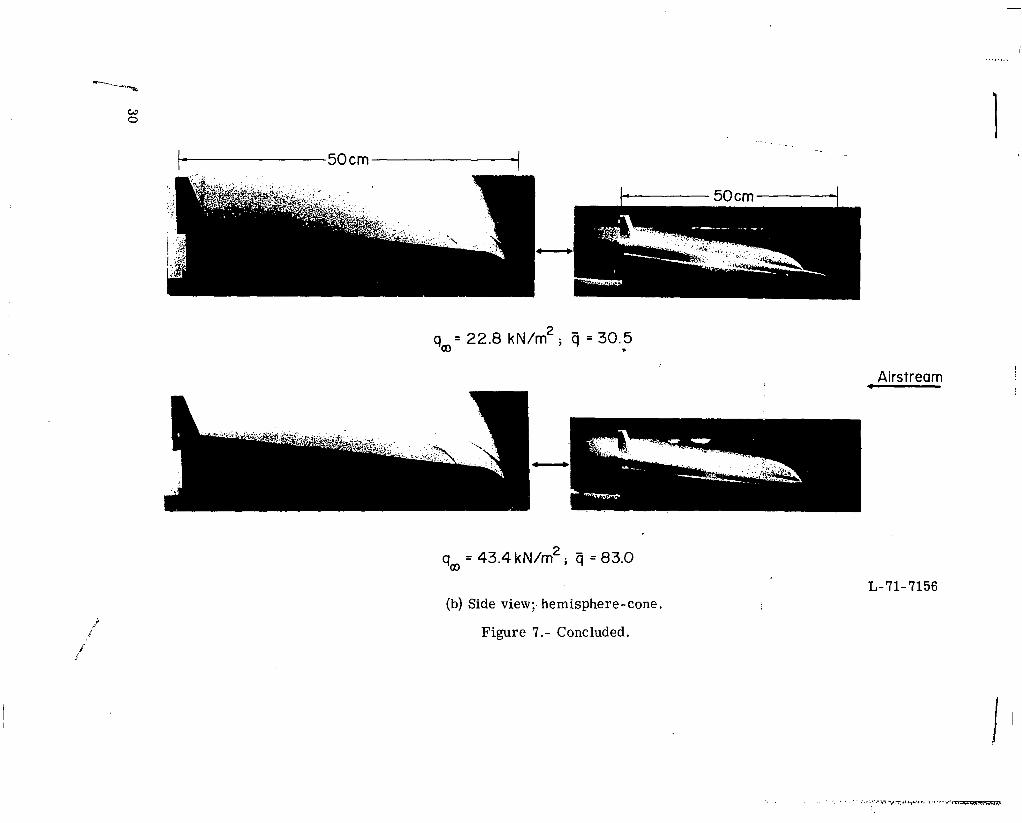
The schlieren photographs of injection from the flat plate generally indicate an unsteady flow pattern once the liquid has begun to break up. Figure 10(b) demonstrates this effect quite clearly. The schlieren photographs of reference 14 also show this unsteady condition in the flow pattern. The schlieren photographs of injection with the hemisphere-cone indicate a more stable flow pattern (see fig. lO(c), for example); this may be due to less resolution, however, since the photographs for the hemisphere-cone nozzles cover a much greater portion of the spray trajectories. Another interesting observation is that in a few cases the scattered-light photographs of injection from the hemisphere-cone indicate that very little liquid is present near the surface of the model just aft of the injection site. This point is demonstrated in the photographs of figure 7(b) and, to a lesser degree, in those of figure 19(b); whereas, the scattered-light photographs of injection from the flat plate show (in almost all cases) that liquid exists on the model surface.
Comparison of maximum penetration between the flat-plate tests and the hemisphere- cone tests can be seen in figure 8 . Unfortunately all the data for the flat-plate tests were for values of penetration above 3 cm; whereas the hemisphere-cone data extends from about 2 cm to about 4 cm. Comparisons of the nondimensionalized penetration between
11

the flat-plate and hemisphere-cone tests can be seen in figure 12 (single nozzles) and in figure 15 (rows of in-line nozzles). The equations of the lines representing these data plots are given in table III. The intercepts of these lines are all zero except for the line which represents the data for the single nozzles on a flat plate. This intercept is -2.5 (see table III).
From table III the line-slope ratio for single nozzles is
afp= 1.39 "hc
and the line-slope ratio for in-line nozzles is
afP ahc - = 1.47
which gives an average line-slope ratio as follows:
afP -. -= 1.43 \/2 ahc
Equation (8) states that the equivalent dynamic pressure influencing penetration in the flow field of the hemisphere-cone is about twice the pressure for the flat plate at the same free-stream conditions. Thus, for comparison on the basis of fl, the following relationships can be used:
Note that (q is not the actual local dynamic pressure at any point in the flow field, but is only an equivalent value. The local dynamic pressure as used in reference 12 was the actual value at the injection site and was approximately equal to one-half the free- stream value. It is concluded that the extrapolation of liquid-penetration data to cases of different geometry or flow conditions requires a knowledge of the relation between the flow condition for the two test cases.
, L,e!hc
COMPUTATIONS OF RAM C-III FLIGHT INJECTION PARAMETERS
The RAM C - m flight experiment was launched from Wallops Island on a four-stage Scout rocket September 30, 1970. A photograph of the rocket and the spacecraft is shown in figure 21, along with a sketch of the spacecraft (15.24 cm-radius hemisphere faired
12
with go cone) and its final stage motor. The spacecraft was boosted to an apogee of 230 km and the final stage motor accelerated the spacecraft to a speed of 7.3 km/sec at an altitude of 137 km. One of the main objectives of the experiment was to compare the effectiveness of an electrophilic liquid with that of water in alleviating radio blackout. Water and the fluorocarbon compound (Freon E-3) were each injected separately through two different nozzles located just aft of the hemisphere-cone junction over an altitude range from 84.8 km to 37.5 km. A more detailed description of the injection experiment is given in reference 4, and data from the experiment are presented. In the current paper the results from the liquid-injection tests reported in earlier sections are used to com- pute some of the important injection parameters for the RAM C-111 flight experiment.
Liquid-Injection Velocity and Flow Rate
The liquid-injection pressure which was measured in flight is shown in figure 22, and these values were used to compute the liquid-injection velocity by equation (1) at the beginning of each injection pulse. The computed velocity is shown in figure 23, along with an illustration of an injection cycle. The flight nozzle discharge coefficients are shown in figure 24. The difference in velocity between the two liquids at about the same injec- tion pressure is due primarily to the difference in densities of the two liquids. (See table 11.)
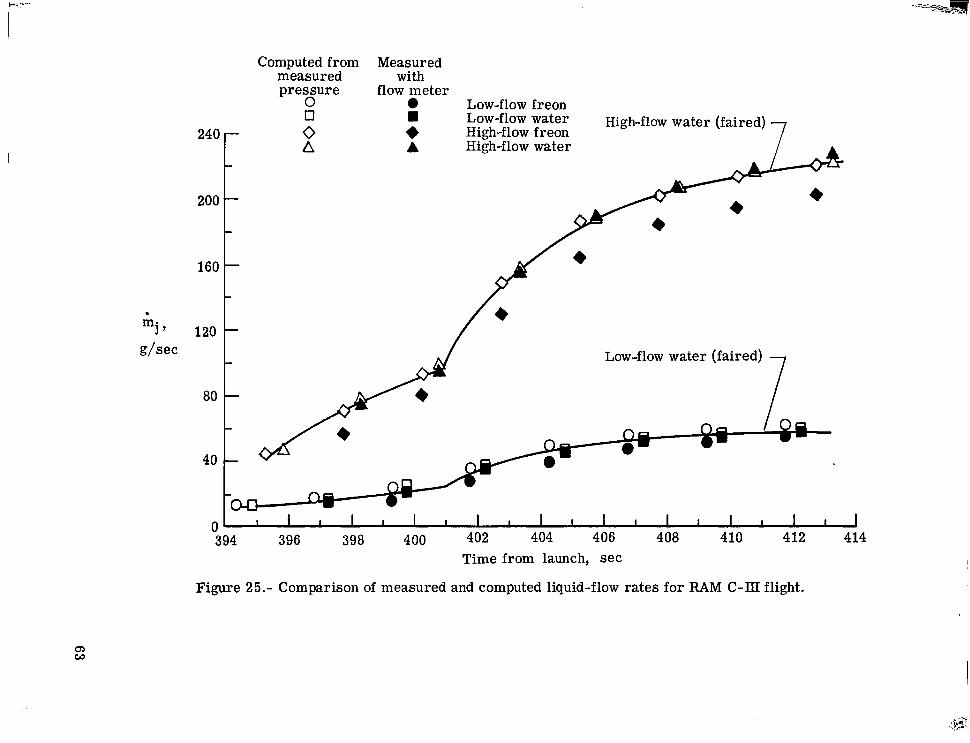
The liquid-flow rates were measured in flight, and the measured values are com- pared with computed values at the beginning of each injection pulse in figure 25. The flow rates were computed by the relation
It can be seen that the measured and computed flow ra tes a re in good agreement, except that the measured flow rates from the high-flow Freon E-3 nozzle a r e about 10 percent lower than the computed rates.
Nozzle Patterns
The flight nozzle patterns were nearly the same as for the test RAM C-III nozzle patterns in the number of nozzles, orifice diameter and number of orifices per nozzle, and the injection angle (a! = 51'). Figure 26 compares the nozzle spacing for the test and flight nozzle patterns. It can be seen that the largest difference is for the high-flow-water nozzle pattern. It was shown previously in the section on in-line nozzles that the differ- ence in spacing between nozzles on disks 1 and 2 did not have a significant effect on pene- tration. Jet shielding is the predominant factor in penetration with the in-line nozzles, and it is assumed that the differences in spacing between nozzles for the FUM C-III test and flight nozzle patterns was insignificant.
13

Local Dynamic P res su re
A comparison of theoretically determined local dynamic pressure adjacent to the injection nozzles was made between the hemisphere-cone test model and the flight space- craft. A typical comparison is shown in figure 27. Lines of constant dynamic pressure are plotted in the flow field adjacent to the injection nozzles at similar values of free- stream dynamic pressure. This comparison suggests that the injected liquid in flight will traverse a dynamic-pressure flow regime similar to that in the flow field of the test model at the same free-stream dynamic pressure. Thus it was assumed that the pene- tration data obtained in the hemisphere-cone tests with the RAM C-m nozzles could be extrapolated directly to flight at all altitudes on the basis of @.
Liquid Penetration and Flow Flux
The entry altitude and velocity of the RAM C-III spacecraft which covers the period of liquid injection are shown in figure 28. Values from these curves were used to com- pute the free-stream dynamic pressure by the equation
where the density has been corrected for the temperature measured the day of the entry flight.
Values of H were computed at the beginning of each injection pulse using the values of qo3 computed by equation (12) and the values of Vj from figure 23. A plot of fl is shown in figure 29. These values are used with figure 18 (penetration data for RAM C-III nozzles) to determine values of maximum liquid penetration during flight.
The liquid flow flux, which is a measure of the amount of liquid flowing through a unit a r e a in the flow field in unit time, is computed by the following expression:
"s .The computed values of mj given in figure 25 were used in this computation. No data were available on the spray cross-section area for injection from a hemisphere-cone, and the values required for this parameter were taken from the flat-plate test data. Fig- u re s 13 and 16 were used to infer As as a function of Ay. The work of reference 19 has indicated that there may be diffusion of the fluorocarbon in the blunt-body flow field, and the inferred values of the Freon E-3 flow flux may be conservative. A composite plot of the inferred liquid penetration, flow rate, and flow flux is given in figure 30.
The penetration is seen to rise gradually to a peak value at an altitude of about 55 km and then to decrease because of a rapid increase in free-stream dynamic pressure. The liquid-flow rates f rom all nozzles are seen to increase during most of the injection period,
14

but the increase is very slight during the last three injection cycles. The liquid flux, however, is seen to increase most rapidly during the last few cycles, due primarily to the decrease in spray cross-section area which results from the decrease in liquid penetration.
CONCLUDING REMARKS
Experimental data are presented for the oblique injection of water and three elec- trophilic liquids through multiple-orifice nozzles from a flat plate and the sides of a hemisphere-cone (0.375 scale of RAM C spacecraft) into hypersonic airstreams. Pho- tographs of the tests and correlation plots of the maximum liquid penetration and the liquid-spray cross sections are presented. The data reflect the following conclusions:
(1) Maximum liquid penetration increases as the square root of the jet-to-free- stream dynamic-pressure ratio for all nozzles tested.
(2) Penetration obtained with single-orifice water injection from the flat plate was underpredicted by the correlations of earlier investigations.
(3) Maximum liquid penetration increases with the number of orifices in a nozzle,
(4) Maximum penetration is increased due to jet shielding for at least four nozzles downstream from the first nozzle.
(5) Penetration for single nozzles and single rows of nozzles increases as the square root of the total injection nozzle area.
(6) Water penetrates farther than does fluorocarbon.
(7) Liquid-spray cross-section area for injection from the flat plate increases linearly with maximum penetration.
(8) Comparisons of maximum penetration between the flat-plate and hemisphere- cone tests indicate that the effective airstream dynamic pressure influencing penetration in the hemisphere-cone flow field was about twice that of the free stream.
The test results were used to compute post-flight injection parameters for the RAM C-III flight experiment. The following results were obtained:
(1) The similarity of the test-model flow field with that of the spacecraft flow field in flight indicates that penetration can be predicted on the basis of in-flight jet-to-free- stream dynamic-pressure ratio.
(2) Penetration was about the same for the two low-flow water nozzles but it was greater for the high-flow water nozzle than for the high-flow Freon E-3 nozzle. The greatest penetration occurred at about 55 km altitude and then decreased because of the rapid increase in the flight dynamic pressure.
15

(3) Flow rates generally increased during injection, but the increase was small after 50 km because of the tapering off of injection pressure.
(4) Liquid fluxes increased continually during injection, but the greatest increase was near the end of injection when the spray cross section was decreasing rapidly.
Langley Research Center, National Aeronautics and Space Administration,
Hampton, Va., December 23, 1971.
16
REFERENCES
1. Cuddihy, William F.; Beckwith, Ivan E .; and Schroeder, Lyle C. (With appendix A by Ivan E. Beckwith, Dennis M. Bushnell, and James L. Hunt; appendix B by Ivan E. Beckwith and Sadie P. Livingston; and appendix C by Ivan E. Beckwith): Flight Test and Analysis of a Method for Reducing Ratio Attenuation During Hypersonic Flight. NASA TM X-1331, 1967.
2. Beckwith, Ivan E.; Bushnell, Dennis M.; and Huffman, Jarrett K.: Investigation of Water Injection on Models of Gemini Vehicle and Resulting Predictions for GT-3 Reentry Communications Experiment. NASA TM X-1200, 1966.
3. Akey, Norman D.; and Cross, Aubrey E. (With appendix A by Thomas G. Campbell; appendix B by Fred B. Beck; and appendix C by W. Linwood Jones, Jr.): Radio Blackout Alleviation and Plasma Diagnostic Results From a 25,000 Foot Per Second Blunt-Body Reentry. NASA TN D-5615, 1970.
4. Schroeder, Lyle C.: Flight Measurements at 25 000 Feet Per Second of Blackout Alleviation by Water and Electrophilic Injection. The Entry Plasma Sheath and Its Effects on Space Vehicle Electromagnetic Systems, Vol. II, NASA SP-253, 1971, pp. 77-100.
5. Ingebo, Robert D.; and Foster, Hampton H.: Drop-Size Distribution for Crosscurrent Breakup of Liquid Jets in Airstreams. NACA TN 4087, 1957.
6. Weiss, Malcolm A.; and Worsham, Charles H.: Atomization in High Velocity Air- s t reams. ARS J., vol. 29, no. 4, Apr. 1959, pp. 252-259.
7. Bitron, Moshe D.: Atomization of Liquids by Supersonic Air Jets. Ind. Eng. Chem., vol. 47, no. 1, 1955, pp. 23-28.
8. Chelko, Louis J.: Penetration of Liquid Jets Into a High-Velocity Air Stream. NACA RM E50F21, 1950.
9. Ingebo, Robert D.: Study of Pressure Effects on Vaporization Rate of Drops in Gas Streams. NACA TN 2850, 1953.
10. Shapiro, A. H.; Wadleigh, K. R.; Gavril, B. D.; and Fowle, A. A.: The Aerothermo- pressor - A Device for Improving the Performance of a Gas-Turbine Power Plant. Trans. ASME,.vol. 78, no. 3, Apr. 1956, pp. 617-653.
11. Beckwith, Ivan E.; and Huffman, Jarrett K.: Injection and Distribution of Liquids in the Flow Fields of Blunt Shapes at Hypersonic Speeds. NASA TM X-989, 1964.
12. Weaver, William L.; and Hinson, William F.: Water Injection From a go Hemisphere- Cone Into a Hypersonic Airstream. NASA T N D-5739, 1970.
17

13. Hinson, William F.; Gooderum, Paul B.; and Bushnell, Dennis M.: Experimental Investigation of Multiple-Jet Liquid Injection Into Hypersonic Flow. NASA TN D- 5861, 1970.
14. Hill, D. E.: Penetration of a Liquid Jet Injected Into a Gas Stream. Rep. SM-47782 (Rev.), Douglas Missile & Space Systems Div., Oct. 1965.
15. Kolpin, M. A.; Horn, K. P.; and Reichenback, R. E.: Study of Penetration of a Liquid Injectant Into a Supersonic Flow. AIAA J., vol. 6, no. 5, May 1968, pp. 853-858.
16. Catton, I.; Hill, D. E.; and McRae, R. P.: Study of Liquid Jet Penetration in a Hyper- sonic Stream. AIAA J., vol. 6, no. 11, Nov. 1968, pp. 2084-2089.
17. Schaefer, William T., Jr .: Characteristics of Major Active Wind TunneIs at the Langley Research Center. NASA TM X-1130, 1965.
18. Hopkins, Edward J.; Rubesin, Morris W.; Inouye, Mamoru; Keener, Earl R.; Mateer, George C.; and Polek, Thomas E.: Summary and Correlation of Skin Friction and Heat-Transfer Data for a Hypersonic Turbulent Boundary Layer on Simple Shapes. NASA TN D-5089, 1969.
19. Kurzius, Shelby C.; and Raab, Fredrik H.: Vaporization and Decomposition Kinetics of Candidate Re-Entry Blackout Suppressants in Low Pressure Flames. NASA CR-1330, 1969.
18

TABLE I.- TEST NOZZLES AND PERTINENT INFORMATION
Flat-plate model Hemisphere-cone model -
Disk Dj > cm 1 Liquid tested 1 Dj I
cm 1 Liquid tested Nozzle patterns (a)
Single orifice
Single nozzles of 5 or 7 orifices
Single nozzles of 1, 3, 5, or 7 orifices
8 orifices pe; nbzzle)
000... - 0 0 0 0 0 8 7000... 000000 oo0..0 0..0.0 0.00.0 0.0..0
Si l e rows of 2 4 or 6 nozzles
Nozzle patterns
1
1 - 0.0508 Water
0.0508 Water I or 7 orifices Single nozzles of 1, 3, 5
I (5 orifices wr nozzle) Single rows of 1, 2, o r 3 nozzles 1 0.0508 I Water
I (5 orifices w r nozzle) Single rows of 4 or 5 nozzles 2
lo.. RAM C-Ill (low flow) 1
- 2
- 1
0.0508 Water 0.0508 Water I
0.0508 I Water j0000. RAM C-III (high flow)
0.0508 Fluorocarbon
0.0508 Fluorocarbon 1
0.0508 Fluorocarbon 1 0.0254, 0.0508 Water, Fluorocarbon
aNumber in circle denotes number of orifices in nozzle. Solid circle denotes nozzle is plugged.
Nozzle pattern 2:
000 000 000
00. a.. 00.
00. 0.0 00.
Nozzle pattern 3:
Nozzle pattern 4:
1 Water D.0254,0.0508
0.0508 Water, Fluorocarbon 2
1 0.0508 Water
aNumber in circle denotes number of orifices in nozzle. Solid circle denotes nozzle is plugged.

/Identification Formula
H20
31
i
TABLE II.- LIQUID PROPERTIES AT 298O K
Surface tension Heat of Relative atomized Relative evaporative lifetime of atomized vaporization, mean droplet size k J / k mean droplet size "_
997 1 3173
1720 I 320
1880 j 40
1770 ' 4000 2."" L
'0.894 1 0.0720 1
2.2 1 .0142 I "_ 4.9 1 .0160 69.84 .4 5
1.45 ' ~ .0148 1 88.24 j .45
I
I I
1 1 ""
I .026
.031 ~
aUsed in RAM C-III flight experiment.

I
Model
TABLE ID.- EQUATIONS FOR LINES OF NONDIMENSIONAL MAXIMUM PENETRATION
Flat plate Hemisphere-cone Flat plate Flat plate .
Flat plate Hemisphere-cone
Nozzle patterns
Single nozzles of 1, 3 , 5, or 7 Single nozzles of 3, 5, or 7 In-line nozzles
In- line nozzles In-line nozzles
Reference i Liquid figure
12(a)
Water 1 5 ( 4
Water 15(d
Water 12 (b)
Water
1503) Water 15(a) Fluorocarbon
T C n i
D.0254, 0.0508 .0508 ,0508 .0508 .0254 .0508
- 13.2 9.5
13.1 14.9
5.5 8.9 -
T -2.5 0 0 7.5
27.5 0

03 03
r
Q- -
15.11
I
Side I l c w
Figure 1.- Flat-plate test model. (All dimensions in cm.)

48.58 i
4-
1 L, 15' Hall-angle wedge
(a) Test model.
Figure 2.- Hemisphere-cone test model and nozzle-disk assemblies. (All dimensions in cm.)

/ 5.715
st
"-
a 0. I
6.06 12.1
(b) Nozzle-disk assemblies.
Figure 2.- Concluded.
24

Spray. cross section
Flow - Injection 'site Flat plate
(a) Schematic of spray.
Scattered light Cross section
L-71-7154 (b) Spray photographs.
Figure 3 .- Illustrations of photographic techniques used in flat-plate tests.
25

Symbol 0
0 A c1 n n n I7 0 0
Nozzle Liquid
0 W a t e r 0 W a t e r 0 W a t e r 0 W a t e r 00 W a t e r 000 Wate r
0000 Wate r 0 0 0 0 0 @ W a t e r RAM C-III Fluorocarbon
Pa t t e rn 1 Fluorocarbon
RAM cm Low flow Fluorocarbon
High flow
I I 0 1 2 . 3 4 5
Pj , MN/m 2
(a) Hemisphere-cone model.
(b) Flat-plate model.
Figure 4.- Nozzle discharge coefficients. D. J = 0.0508 cm.
26

Spray outer limit 7 (A,) (Spray cross section) \
Ay (Maximum penetration)
/ Injection nozzles cone surface
(a) Maximum penetration and spray cross section.
Y
Spray outer limit (x, Y 1 - Flat-plate surface
X
(b) Spray coordinates for single-orifice injection.
Figure 5.- Coordinates and nomenclature.
27

1:
1(
1
6
4
2
0
Average of data
Line of perfect agreement
2 4 6 8 10 Penetration from schlieren photograph, cm
Figure 6.- Comparison of maximum penetration determined from two types of photographs in hemisphere-cone tests.
28

". . .I . - . . . . . . . .
= 15.8 kN/m2 ;. 7 j = 128
qW = 31.6 kN/rn2; 7 j = 62
g = 47.4 kN/m ; q = 44 2 -
L-71-7155 (a) Side view; flat plate.
Figure 7.- Photographs of water injection with single orifice.
I
q = 22.8 kN/m2; tj = 30.5 al
Airstream
q = 43.4 kN/m2; = 83.0 al
(b) Side view;. hemisphere-cone.
Figure 7.- Concluded.
L-71-7156
0 Current test data ( Q! = 51') a = 81'
0 CY = 66' A Q! = 66' h Q! = 51' I Reference 13
dn
Ay,cm 4 t 1 I I I
0 2 4 6 8 10 12
fi (a) Flat plate.
I I I 1 I 1 I 0 2 4 6 8 10 12
(b) Hemisphere-cone.
Figure 8.- Maximum water penetration with single-orifice injection.
3 1

- Eq. (19') ref. 16
"r -0- Measured
I I I I I I I I 0 4 8 12 16
x, cm
(a) Current data; S = 128; CY = 51°.
61-
4-
2 p -0- * - " O - 0
4 8 12 16 x, cm
(b) Data of reference 13; = 50; a! = 81°.
Figure 9.- Comparisons of measured and computed water-spray trajectories for single orifice on flat plate.
32

D. = .02 54 cm D = .0508 cm J j
5 or i f ices
W W
Airs t ream
D. = .0254 cm J
Dj = .0508 cm
7 orif ices
L-71-7157 (a) Side view; flat plate; effect of orifice diameter; qm s 47.4 kN/m2;: iq = 39.7.
Figure 10.- Photographs of water injection from single nozzles.

1 orifice
Airstream - 3 orifices
5 orifices
7 orifices
L-71-7158 (b) Side view; flat plate; effect of number of orifices;
Dj = 0.0508 cm; q, = 31.6 kN/m2; Q = 60.5.
Figure 10. - Continued.

.,... ,,.,
0 I orifice
0 3 orifices
Airstream 1 I
0 7orif ices
L-71-7159 (c) Side view; hemisphere-cone; effect of number of orifices; Dj = 0.0508 cm; q = 22.8 kN/m2; = 30.5.
Figure 10. - Continued. co
. . . -. . . . .
0 1 orifice
0 5 orifices
. . .
D. = .0254 crn 1 D . = .0508 c m
J
q, = 31.6 kN/rn2; Q = 60. 5; 5 orifices
, .” .:.. ~. . .
2 = 14.4 Q = 38.4
7 orif ices; D. = .0508 cm 1
a = 112.4
L-71-7160 (d) Spray cross section; flat plate.
Figure 10. - Concluded.
// Dj = .0254 cm
0 2 4 6 8 10 12
6 (a) Five orifices.
20 -
15
- Ay, cm 10
-
5 -
I I I I I l l I I I I I 0 2 4 6 8 10 12
6 (b)'Seven orifices.
Figure 11.- Effect of orifice diameter on penetration for water injection through single nozzles of five or seven orifices from flat plate.

125
100
5 75t 25 501 5 7 5 -
50 -
25 -
I I 1 I 1 I I I 1 I 1 I 0 2 4 6 8 10 12
E (a) Flat plate; five o r seven orifices for D- = 0.0254 cm; one, three, five, or
seven orifices for Dj = 0.0508 cm. J
75
0 2 4 6 10 12
(b) Hemisphere-cone; three, five, o r seven orifices; Dj = 0.0508 cm.
Figure 12.- Correlation of nondimensional maximum water penetration with single nozzles,
38

lo r 8
6 AY, c m
4
I I I 1 I 1 I I I 0 10 20 30 40 50
As, ern2
~ ~.
0 Nozzles of 3, 5, 7 or i f ices: Di = .0508 cm
10
8
AY, cm
J
1 2
l4 F - - -
I 1 1 1 1 1 I I 1 I I I I 0 10 20 30 40 50 60 70
~~ ~
A , c m 2 S
Figure 13.- Maximum water penetration versus spray cross-section area for single nozzles on flat plate.
39
I

N
L-71-7161 (a) Side view; water; effect of nozzle spacing.
Figure 14.- Photographs of liquid injection with single rows of nozzles.

00 0 0 0
Airstream -
q, = 41.4 kN/m2; Q = 20.3; D. = .0508 cm 1
(b) Side view; water injection from flat plate.
Figure 14.- Continued.
L- 71- 7162

qm = 16.3 kN/m2; = 5.2 ; D. = .0254 cm 1
Nozzle pattern effect
Airs t ream m-b
e _. . .
@ 0 @ @ ; Dj = .0254 cm @ 0 @ @ ; Dj = .0508 cm
q, = 47.4 kN/m2 ; ij = 4.5
Effect of nozzle pattern and orifice diameter
ij = 27.4 = 61.2
0 0 @ 0 ; Dj = .0254 cm
Dynamic-pressure ratio effect
L-71-7163 (c) Side view; Freon E-3 injection from flat plate.
Figure 14.- Continued.
" 5 0 cm-
0
Airstream - 0 0
5 orifices per nozzle; Dj = . 0 5 0 8 c m j qa= 43.4 kN/m 2 - ; q = 7.0
L-71-7164 (d) Side view; water injection from hemisphere-cone.
Figure 14.- Continued.

I 11111111 I
15cm 4
000 0000 q = 47.4 kN/m2; 4 = 20.3 ; D. J = .0508 cm
Nozzle pattern effect
I q = 23.0 q = 47.4 S = 57.6
@ @ @ ; Dj = ,0508 cm
Dynamic-pressure ra t io effect
L-71-7165 (e) Water-spray cross section; flat plate.
Figure 14. - Continued.
44

- 1 - if- - G L k N + k r ; q = 27.4; D. = .0254 cm 9, J
Nozzle pattern effect
- q = 20.3 - q = 61.3
@ 0 @ @ ; D~ = .0254 cm
Dynamic-pressure ratio effect
(f) Freon E-3 spray cross section; flat plate.
Figure 14.- Concluded.
L-71-7166
45

0 0 0 0 0 0 - 0 (9 0 0 8 0 0 - 0
I I I I I I I I J
J4 0 2 4 6 8
Freon E-3 injection
150 r
I 1 I I 1 I I I J 0 2 4 6 8
E Water injection
(a) Flat plate; water and Freon E-3 injection.
Figure 15.- Correlation of nondimensional maximum liquid penetration with single rows of in-line nozzles.
46

; I
75
50
25
0 2 4 6 8 10
(b) Hemisphere-cone; water injection. One, two, three, four, or five nozzles; five orifices per nozzle; Dj = 0.0508 cm.
Figure 15. - Concluded.
47
I

1 I I I I I 1 I I I 0 10 20 30 40 50 60 70
(a) Freon E-3 injection; Dj = 0.0254 cm.
:I Ay, cm 6
2 ‘t I I I I I I I I I I I I I J
10 20 30 40 50 60 70 0
As ¶ cm 2
(b) Water injection; Dj = 0.0508 cm.
Figure 16.- Maximum liquid penetration versus spray cross-section area for in-line nozzles on flat plate.
48

0 0 0 0 0
Water nozzle patterns Airstream -

0 0 0 0 Dj = .0508 cm
0 1 2 3 4 5 6 7 8
@ Dj = 0.0508 cm
8-
6.
4 -
0 1 2 3 4 5 6 7 8
Jg (a) Water-injection nozzle patterns.
Figure 18.- Maximum penetration for RAM C-III nozzles.
50

0 0 0 Dj = .0508 cm
Ay,cm 4
2 :I Dj = .0508 cm
0 1 2 3 4 5 6 8
JC
(b) Freon E-3 injection nozzle patterns.
Figure 18.- Concluded.
51

FC-43 Freon E-3
Nozzle pattern I q,=22.8 kN/m2; Zj = 12.3
I-c-43 Water
Nozzle pattern 3; q, = 43.4 kN/m2 Zj = 38.6
L-71-7168 (a) Comparisons with different liquids; Dj = 0.0508 cm.
Figure 19.- Photographs of injection with nozzle patterns 1 to 4.

t=- 50 cm -4
Freon E-3; Dj = .0508cm A
Nozzle pattern I ; q,= 22.8 kN/mZ; ii = 38.8
Nozzle pattern 2; qm=22.8 kN/rn2 ; ij = 20.5 ; Water
L-71-7169 (b) Comparisons with two different orifice diameters.
Figure 19.- Continued.
P

t"-------------- 50cm _I
Nozzle pattern I; ij = 12.7 Nozzle pattern 2; tj =9.7 $ $1 q,= 43.4kN/m2 pj = .86 MN/m2
+----"----Ocrn------"-J Airstream c"--
Nozzle pattern 3 0 0 0
Nozzle pattern 4
q,= 43.4 kN/m2 ; 7j = 17.0
L-71-7170 (c) Comparisons with different numbers of orifices per nozzle; water.
Figure 19.- Concluded.

12
Ay, cm 8
4
0
FC-75)
~~ I I I I I I 0 2 4 6 8 10 12 -
J: (a) Effect of liquid; nozzle pattern 1; Dj = 0.0508 cm.
12
*Y, em
0 2 4 6 8 10 12
(b) Effect of liquid; nozzle pattern 1; Dj = 0.0254 cm.
Figure 20.- Comparison plots of maximum penetration for nozzle patterns 1 and 2.
55

0 2 8 10
6 (c) Effect of orifice diameter; nozzle pattern 1; water.
12
0 2 4 6 a 10
(d) Effect of orifice diameter; nozzle pattern 1; Freon E-3, FC-43, FC-75.
Figure 20.- Continued.
12
56

(e) Effect of orifice diameter; nozzle pattern 2; water.
Figure 20.- Continued.
57

Nozzle pattern 2
Nozzle pattern 1
0 2 4 6 a 10 12
G (f) Effect of number of orifices per nozzle; water; Dj = 0.0508 cm.
I I I 0 2 4 6 8 10 12
7
J q
(g) Effect of number of orifices per nozzle; water; Dj = 0.0254 cm.
Figure 20.- Concluded.
58

c c & ...
Figure 21.- Boost vehicle and spacecraft for RAM C-IlI flight.
59

. . . . . . ._ . " -
3 High-range transducer
2
1
0
I I I I I I I I I I I I 1 I I I 386 390 394 3 98 402 406 410 4 14 418
Time from launch, sec
Figure 22.- Liquid-injection pressure measured on RAM C-III flight.
60

2ol 10
0 Freon E-3, low flow 0 Water, low flow
T Low-flow water (faired)
0 Freon E-3, high flow A Water, high flow
Low-flow freon O O O A 0 1
0 1 2 3
I I I I I I I I I I I sec 3 94 3 98 4 02 406 410 414 Injection sequence
Time from launch, sec
Figure 23.- Computed liquid-injection velocity for the RAM C-III flight experiment.

0 Low flow El High flow
1.0 r Water nozzles
I I I I 1 I
O r Freon E-3 nozzles
I I I I I 1 0 1 2 3
P j , MN/m 2
Figure 24.- RAM C-III flight injection nozzles discharge coefficients.
62
Computed from Measured measured with pressure flow meter
0 0 0
Low-flow freon Low-flow water High-flow water (faired)
A A High-flow water 240 r 0 + High-flow freon
-
200 - -
160 -
-
120 - - Low-flow water (faired)
80 -
0 I I I I 1 I I I I 1 I I I I I I I I I 1 394 396 398 4 00 402 404 406 4 08 410 412 414
Time from launch, sec
Figure 25.- Comparison of measured and computed liquid-flow rates for RAM C-III flight.
Q, I W

Low-flow water
High-flow water
Airstream-
L 1 . 0 4 4
Low-flow Freon E-3
High-flow Freon E-3
Figure 26.- Comparisons of nozzle spacing for RAM C-III tests and flight nozzles. All dimensions in centimeters; numbers in circles denote orifices.

I
Figure 27.-
"r Coordinates
Open symbols - tests: q, = 43.4 kN/m2
Solid symbols - flight: q, = 50.0 kN/m2; h = 45.72 km
qL, kN/m2
143.6
95.8
47.9
3 5.9
- 23.9
0- 2 4 6 8 10 12
x', cm
Lines of constant dynamic pressure in flow fields of hemisphere- cone test model and flight spacecraft.

Altitude, km
Velocity, km/sec
90
80
70
60
50
40
30
tl -7 I I I I I I I I I I I I I I I I
386 390 3 94 398 4 02 4 06 410 4 14 418
Time f rom launch, sec
Figure 28.- RAM C-111 entry altitude and velocity.

10
Low-flow water (faired)
n
0 Freon E-3, low flow 0 Water, low flow 0 Freon E-3, high flow A Water, high flow
3 390 3 94 3 98 4 02 4 06 410 414
I I I I I I I I I I , On j
Time from launch, sec
Figure 29.- RAM C-III penetration correlation parameter.

Water low flow Freon, Low flow
Water, high flow Freon: high flow
AY, cm
High-flow water (faired)
0 0 0
0
0 0 0
0
. * m .
1 ' g/cm2- sec
14
12
IO
8
6
4
2
0 394 396 398 400 402 4 04 406 4 08 410 412 414
Time from launch, sec
I I I I I I I I I 75 70 6 5 60 55 50 45 40 35
Altitude, km
Figure 30.- RAM C-111 liquid penetration, flow rate, and flow flux.
68
NATIONAL AERONAUTICS AND SPACE ADMISTRATION - WASHINGTON, D.C. 20546
POSTAGE AND FEES PAID NATIONAL AERONAUTICS AND
SPACE ADMINISTRATION [ - a ] OFFICIAL BUSINESS PENALTY F O R PRIVATE USE S300
FIRST CLASS MAIL. -
0243 0 1 C2 IJL 0 1 720121 S00903DS 720401 DEPT OF THE AIR FORCE A F WEAPONS LAB (AFSC)
, TECH L I B R A B Y / V L O L / ATTM: E LOU BOWMAN, CHIEF K I R T L A N D AFB NM 87117
.. ~
- - "-z7S% ~. '
If Undeliverable (Section 158 Portal Manual) Do Not Return
"The aeronautical and space activities of the United States shall be conducted so as t o contribute . . . to the expansion of human knowl- edge of phenomena in the atntosphere and space. The Administration shall provide for the widest prncticable and appropriate dissemination of inforntation concerning its actifdies and the results thereof."
-NATIONAL AERONAUTICS AND SPACE ACT OF 1958
NASA SCIENTIFIC A N D TECHNICAL PUBLICATIONS
TECHNICAL REPORTS: Scientific and technical information considered important, complete, and a lasting contribution to existing knowledge.
TECHNICAL NOTES: Information less broad in scope but nevertheless of importance as a contribution to existing knowledge.
TECHNICAL MEMORANDUMS: Information receiving limited distribution because of preliminary data, security classifica- tion, or other reasons.
TECHNICAL TRANSLATIONS: Information published in a foreign language considered to merit NASA distribution in English.
SPECIAL PUBLICATIONS: Information derived from or of value to NASA activities. Publications include conference prpceedings, monographs, data compilations, handbooks, sourcebooks, and special bibliographies.
TECHNOLOGY UTILIZATION PUBLICATIONS: Information on technology used by NASA that may be of particular
CONTRACTOR REPORTS: Scientific and technical information generated under a NASA Technology Utilization R~~~~~~ and contract or grant and considered an important contribution to existing knowledge.
interest in commercial and other non-aerospace applications. Publications include Tech Briefs,
Technology Surveys.
Details on the availability of these publications may be obtained from:
SCIENTIFIC AND TECHNICAL INFORMATION OFFICE
NATIONAL AERONAUTICS AND SPACE ADMINISTRATION Washington, D.C. 40546