Embed Size (px)
Citation preview

WhitePape
r
MULTIPHASE LEVEL MEASUREMENT
Improving level control in desalters to aid in use of opportunity crudes
32
Fig.1 Berthold´s EmulsionSENS resulting density profile
Refineries are a complex set of various operating units
designed to process crude oil into refined products
such as gasoline, diesel, jet fuels and feedstocks for
thousands of different products that people use every
day. In order to maximize operating margins, refiners
rely on pushing the units to maximum throughput. To
do this safely and effectively, they must have very good
control of the process. Some processes in the refinery
industry are a challenge for even the best and most
experienced engineers. As Lord Kelvin once said, “If
you cannot measure it, you cannot improve it.” and
H. James Harrington expanding that thought to say
“Measurement is the first step that leads to control
and eventually to improvement. If you can’t mea-
sure something, you can’t understand it. If you can’t
understand it, you can’t control it. If you can’t cont-
rol it, you can’t improve it.” These statements apply
directly to today’s refinery industry where in order to
maximize margins, a plant must be able to produce
more with existing equipment. To safely and efficiently
control your process, you need to be able to reliably
measure various parameters throughout the refinery.
One of these processes that can greatly influence the
refineries profit margins is the desalter.
How can we get the most out of our existing desal-
ter? We can ensure that the grids are working to their
fullest and that the maximum volume is being utilized
in the vessel to increase residence time, ensuring maxi-
mum desalting of the oil (Lobo, Kremer, & Cornelius,
2010, slide 23). To ensure that we can achieve this
greatest efficiency, control of the interface level beco-
mes crucial. When we talk about interface level, this
is a misnomer, since there isn’t really a defined level
between the crude oil and water/brine. There is instead
a transition zone where the fluid slowly changes from
crude to water/brine. This transition zone is both unde-
fined and under certain circumstances can vary greatly
in height (emulsion thickness, see Fig. 2).
When interface level is checked by sampling, you will
see a variation in amount of oil and water mixed toge-
ther at different elevations. Many refiners use sam-
pling as their primary method of interface level control
in the desalter, due to the lack of confidence in the
current technology used. Various technologies have
different issues with reliably measuring and thereby
controlling the interface level. As refiners try to meet
various national, local, and corporate standards, the
sampling method itself causes safety risks and envi-
ronmental impact concerns. What is done with the
fluid that must be flushed from the sample lines? With
environmental regulations, this oily water has to be
collected and treated. How long do you flush the lines?
The time it takes to flush line can lead to more fluids
that must be collected and treated as well as errors
if the line is not flushed long enough. How to limit
human error? One person might determine the sample
to be all oil whereas another person might determine
the sample to be an emulsion. Then, there are safe-
ty concerns, these include raising the temperature to
300 °F / 150°C to assist with the separation of the
water and salts from the oil. Therefore, sample lines
must have coolers to prevent the potential burns to the
person taking the sample and with refiners integrating
petrochemicals, more benzene can be present causing
an inhalation issue.
With all the other processes in the refinery, the desalter
is one that is often overlooked since it is a relatively
simple process. Its main purpose is to separate the salts
and minerals from the oil, so they do not get carried
over into the other operating parts of the refinery. You
do not need to be a corrosion expert to understand
that salts are very harmful to metals in the processing
units. These salts and minerals can cause other issues
besides corrosion such as fouling of heat exchangers
and furnace tubes, deactivation of downstream cata-
lysts and decrease furnace efficiencies. When trying
to operate a desalter, one must constantly evaluate
different parameters, each with a specific effect on
the performance of the desalter. These parameters are,
for example, mix value setting, wash water (rate and
quality), chemical feed (type and rate), operating tem-
peratures and electrostatic grid voltages. While trying
to control these parameters to operate the desalter
in such a manner as to maximize the effectiveness of
the vessel, one must be able to maintain control of
the level so that the level does not get to high or too
low. In the meantime, countries and local regulatory
bodies are also applying strict demands to the quality
of the brine/water leaving the desalters, giving opera-
tors more challenges.
In the market today with all the opportunity crudes
that are available, it is important to know how the dif-
ferent crude oils react when mixed together to ensure
compatibility. If oils are mixed that are not compatible,
they could form emulsions that are very difficult to
break (Garrett, Rattanakhambay, Robbins, Wunder, &
Yeung, 2016, p. 1). When this happens in the desalter,
knowing not only the brine water level is important,
but also the top of the emulsion layer to ensure proper
desalter operation. There are several technologies that
are used to measure the water level in the desalter:
■ differential pressure (DP)
■ RF absorption probes
■ nuclear density profile systems
These can be placed into two basic categories: direct
and indirect measurement technologies, with all of
them falling into the direct measurement category
except the nuclear density profile systems. The direct
measurement devices measure a physical characteris-
tic of the fluids (dielectric constant (dK), capacitance,
weight, etc.) by directly contacting process fluids. Each
one of these technologies have their advantages and
disadvantages. These technologies work very well
when there is a defined interface between the two
fluids, but due to the operational characteristics of the
desalter, there might not be a defined interface but a
graduation of densities as the fluids separate. When
this graduation of densities occur, the nuclear density
profile system is the best option. The nuclear option
will provide the user with a density profile of the des-
alter so that the levels of water and emulsion can be
determined, monitored and controlled. In this paper
we will briefly explain how DP, RF absorption probes
and nuclear density profiler systems measure the inter-
face level in the desalter and some of the issues that
each technology may have.
Introduction Optimize existing desalters

54
Differential Pressure
DP is an economical way of measuring levels in tanks
and vessels and it is the second most common use of
pressure measurement behind flow measurements. DP
levels use Pascal law to determine level by relating the
level, pressure and density of the fluid, simply stated,
P = ρ * h, where P = pressure (pascals, Pa), ρ = density
of fluid (kg/m³) and h = height of the column of fluid
(meters, m). You can solve for h by rearranging Pascal
law, h = P / ρ (Meribout, Al Naamany & Al Busaidi,
2011, p. 2). For example, a tank with 2 m of water will
exert a pressure of 2000 mmH2O or 0.196 bar. If the
fluid was kerosene with a density of 0.82 spg, the pres-
sure exerted will be 1640 mmH2O or 0.161 bar. As you
can see the density of the fluid has a great influence on
the pressure. If this was a level application calibrated
on water to measure a 2 m span and the process fluid
changed to kerosene with a density of 0.82 spg, the
error of the level output at 50% level would be 9%,
or the output would read 41% but actual level would
be 50%.
The errors are more complicated for DP levels when
trying to measure interface levels in vessels especially if
emulsions are present. The difference in pressure being
measured is the difference in pressure exerted by the
vessel full of the higher density fluid and the vessel full
of the lower density fluid. Since two fluids are being
measured, the error can be compounded if both fluid
densities change. Another point that can cause issue
with the DP level measurement is the height of the
emulsion. Figure 2 (top) shows level with a relative-
ly small transition zone and Figure 2 (below) shows
a level with a larger transition zone. Emulsion is not
the true word to use in the case of the desalter since
emulsion implies a fluid of consistent density, but here
we use this term to describe the transition zone from
clear oil to clear brine. This zone is actually a gradient
change in density from the lighter density fluid to the
heavier density fluid. The DP level will only measure
the average density across the full span of measure-
ment and cannot tell the operator if the level output is
the bottom of this emulsion, the middle or top of the
emulsion height.
The fourth detector may be installed on the water/
brine outlet to measure the amount of hydrocarbon
that is potentially being discharged from the desalter
with the water/brine (Agar Corp, 2018). The RF ener-
gy absorption probes are calibrated in the range of
0% to 100% water. The probes measure how much
RF energy is absorbed by the material surrounding it.
Water absorbs more RF energy than the oil. The RF
energy detectors are reference devices, meaning that
they must be calibrated with oil and water to measure
the difference in the amount of energy that is being
absorbed. This can lead to some erroneous readings if
a refiner changes the crude slate that is being refined
since different crudes will absorb different amount of
RF energy. For example, if the RF energy probes are
calibrated on 26 API oil and water to obtain 0% to
100% water, and the crude is switched to 16 API, the
RF energy probes can be reading 15% - 20% water
even in 100% crude oil. This is due to the fact that
the 16 API oil absorbs more of the RF energy than the
26 API oil, therefore, to ensure proper operation of
the desalter the device needs to be recalibrate. Some
other issues that can cause errors in the measure-
ment is the probe coating and only measuring the RF
energy absorption of the coating and not the mate-
rial around the probe. In this case, the probes must
be removed and cleaned to restore proper operation.
As shown in Figure 3 desalter can acquire with large
amounts of buildup.
Fig.3 Inside of a desalter with large amounts of buildup
The RF energy absorption probe (controller) measures
in one localized area and only provides information
at that specific elevation. This can be used for control
of the interface level in a separator if the emulsion
stays relatively small. If the emulsion layer were to
grow inside the vessel the operator would be blind to
this change until other issues occur since the control
point RF energy absorption probe might not detect
any change. For example, if the control point is set
at 50% water and the “emulsion” bands grows from
75 mm to 300 mm, the RF probe can still be reading
50% water but now the top of the emulsion band is
150 mm higher in the vessel than what is being indica-
ted by the RF probe. This is also true of the bottom of
the emulsion band, which is now 150 mm lower than
indicated. Figure 4 shows different transition zones, all
of these levels could measure 50% water even though
the top of the emulsion is at different heights.
RF Absorption
Another type of measurement technology that is com-
monly used in desalters is the RF absorption probe.
These RF probes and the nuclear density profiling sys-
tems have a similar basis of measurement, which is
the absorption of energy. One is the absorption of RF
energy and the other is the absorption of gamma ener-
gy. The RF energy absorption is based on the dielectric
constant (dK) of the fluid and the gamma absorption
is based on the material density. Beyond this common
principle, they differ greatly. The RF energy detectors
are normally used in an arrangement of two to four
probes. The minimum detectors required is two, one
mounted approximately 12 inches below the grids to
serve as a high-level switch and to control the injection
of chemical. Another detector mounted at an angle to
serve as the control for the water/brine outlet in order
to control the height of the interface. Two other detec-
tors may be used but are optional. A third could be
used in the bottom of the desalter to act as a low-level
switch and/or to help monitor for mud buildup in the
bottom of the vessel.
Fig.2 Different emulsion thicknesses in the vessel
Fig.4 Use of RF absorption probes in vessel with different emulsion heights

76
Operating companies are starting to rely more on nuclear density profile systems since they can give the operators a view into the desalter itself. A larger global refiner once stated “I understand the nuclear density profiler system is more expensive to install but I know it works a 100% of the time no matter what type of crude we are processing, whereas the other techno-logies might only operate correctly 85% of the time. This 15% difference cost us more than the price of the nuclear density profile system.” There has been a trend in the large major oil refiners to rely more on nuclear density profile systems due to this reasoning. Nuclear Density Profiler uses radioactive sources and a radiation-based detector to measure density of fluids inside the vessels at various elevations in order to pro-vide the user with a density profile of the fluids inside the vessel as they separate. The density is measured by the amount of radiation being sensed by the detector. The amount of radiation that is absorbed is constant, predictable and directly proportional to the density of the process fluid. This makes the measurement of the fluid density very reliable.The basic principle of a radiometric based density gauge is that materials atte-nuate radiation at a given rate and this attenuation of radiation can be calculated by Lambert-Beers law (I = 1- e-μρt). The change in the amount of radiation from a radioactive source can then be used to calcula-te the density of the fluid that is between the source and detector. This change in the amount of radiation to the detector is measured and then converted to a density value for each elevation. Therefore, operator can basically see the transitions zones in real time as the water/brine separates from the oil.
Different ArrangementsThere are several types of density profiling systems, all of them have their advantages and disadvantages but all work on the same basic principle stated above. There are four types of arrangements of radiometric density profilers. The main difference between them is the orientation of radioactive sources and detectors. They are listed as follows:■ Internal sources and internal detectors■ Internal sources and external detectors■ One internal source and external detectors■ One external source and external detectors
Nuclear Density Profiling Systems
Internal sources and internal detectorsSources and detectors are located inside the vessel mounted in dip tubes or wells (see Figure 5). Each detector has its own source and the density is mea-sured at each of these elevations to provide the end-user a density profile. This type of profiler typically uses Am-241 as the radioactive source and the source is loaded into the source well by a qualified radiation worker. Am-241 is a lower energy gamma emitter and is therefore very sensitive to small changes in density, but also requires a very short process path (typically not more than 75 mm, this means buildup can be an issue). Buildup can be an issue since the prcoess path is small and a small layer of build is a large percent of the measurement span. For example, if the source and detector wells have 10 mm of buildup, that would equate to 26% of the process being measured would be buildup and not process fluids. Also due to the lower gamma energy, the source and detector wells need to be made out of Titanium, since it has a lower density than steel. Carbon steel attenuated too much of the gamma energy, therefore not enough energy is left in order to make a useful measurement of den-sity. Since the detectors are inside the vessel, cooling is needed for the electronics if the process is heated.
Thus a person with basic radiation safety training can safely insert or retract the sources back into the hol-der and lock them out for vessel entry during main-tenance. The energy of Cs-137 is higher than that of Am-241, this allows for the use of standard material such as carbon steel, stainless steel or monel. The process path is also large, typically from 450 mm to
Fig.7 One internal source and external detectors
One internal source and external detectorsA single source is placed inside the vessel and an array of detectors are mounted outside the vessel (see Figure 7). The detectors use an advance algorithm in additional PLC or controller, to determine the density at each ele-vation depending upon the density of the elevation below and/or above its physical location. Source used is Cs-137, each single source is limited to approximately 1200 mm span. The source has a source holder moun-ted on top of the dry well and can be safely retracted by an individual with basic radiation safety training and locked out for vessel entry. If longer span is desired, this can be achieved by using multiple inserting dry wells incl. sources along the length of the vessel.
Fig.8 External source and external detectors
One external source and external detectorsA single source is place outside the vessel and an array of detectors are mounted above and below the mounted source (see Figure 8). The detectors measure the amount of radiation that is scattered back to the detectors instead of the amount of radiation that is absorbed. The detectors then use an advance algo-rithm to calculate the density at each elevation using densities of the elevations above and/or below.
Internal sources and external detectorsAn example of this arrangement is Berthold’s EmulsionSENS. Sources are mounted inside the vessel inside a dry well or dip tube (see Figure 6). The sources used can be Cs-137 or Co-60. The shield, used to safe-ly house the radioactive capsules when not inserted into in the vessel, is mounted on top of the dry well.
Fig.5 Internal sources and internal detectors
Fig.6 Internal sources and external detectors
650 mm. Sources and detectors are either aligned at the same elevation or staggered to allow detectors to measure the average density between the elevation of two sources. Detectors are mounted outside of the vessel and can be mounted inside a collimator ensuring that the detector is receiving maximum gamma energy from the source directly across from it to provide the highest accuracy in the density measurement. When the detector is used without a collimator, the detec-tors can detect small changes in density between the mounted elevations in order to provide a more accu-rate level reading. Each detector has its own source or is mounted in between the sources and the density is measured at each of these elevations to provide the end-user a density profile. The drywell can be curved to conform to the vessel wall to ensure nearly the same process path at each elevation to provide the proper resolution. With the correct process path, buildup on either the well or vessel wall has a negligible effect on the density output. For example, if the process path is 600 mm, and there is 10 mm buildup on both the vessel and dry well, only about 3% of the process path is affected. If the buildup has density of 950 kg/m³ and the fluid has a density of 920 kg/m³, the error in the density reading would only be 0.9 kg/m³ (0.3% error if the process span was 700-1000 kg/m³) therefore recalibration would not be required. Since detectors are mounted outside the vessel, no cooling is needed for electronics and maintenance is easy.

98
Berthold’s multiphase level measurement system EmulsionSENS consists of radiometric density devices at different elevations through the measurement span (see arrangement “internal sources and external detec-tors” Figure 1 and Figure 6) and optional evaluation units LB 478. Such an arrangement allows accurate measurement of the density at each of these positi-ons and provides a density profile of the fluids as they separate inside the vessel. This difference in density of the fluids is the main principle of the separation vessel. The density is calculated in each individual detector and then sent to the DCS via 4..20 mA HART, which can then be used to display the density profile on main operators screen on the DCS. By means of an algo-rithm implemented in the evaluation unit LB 478, inter-face levels can be calculated from the measured densi-ty values. Therefore the density values of the individual detectors are sent to the evaluation unit LB 478 and the calculated interface levels are then transmitted to the DCS via a 4..20 mA signal. This calculated interface level can then be used for automatic control of the water/brine outlet valve. This ensures redundant signal transmission to the DCS. In addition to the calculation, the evaluation unit is also used for numerical and gra-phical display of both density and level values. This allows the operator to see where the top of the emul-sion is located as well as the bottom of the emulsion. Figure 9 shows the break points between clear oil, emulsions and water due to their different densities.
Fig.9 Example of a density profile
Improving Level Control
EmulsionSENS
Refiners have experienced a reduction in upsets in the desalters from 2 – 6 upsets a year to none for the two years when operating with a nuclear density profiling system. The main reason for this reduction of upsets is the ability to provide automatic control. The brine outlet valve is normal controlled manually by the ope-rator and small changes in valve setting can take up to 6 – 7 hours to obtain the full level change caused by the valve setting change. This long lag time from setting change to actual level change tends to lead to level being increased too high or too low (large level swings). Figure 10 shows a weeklong trend of an inter-nal sources and external detectors arrangement with manual adjustement of the water outlet valve.
Fig.10 Typical density curve with manual adjustment of water outlet
The vertical axis has the density of each detector as a specific elevation above the bottom of the vessel. This axis has been flipped in order to have the heavier density on the bottom so that the detectors that are mounted lower on the vessel are at the bottom of the
Fig.11 Typical density curve with automatic adjustment of water outlet
trend and the detectors mounted at the top would be at the top of the vertical axis. The horizontal axis is time, approximately one week. Towards the end of the second day all the densities readings start to increa-se, this indicates a increase in water/brine level in the vessel. During this condition, carryover of water, salts and minerals can occur. The operator makes a manual adjustment to the water outlet control valve and level returns to a normal state. But again at the beginning of day 4 and the middle of day six, the top densities start to increase, showing an increase in water/brine level. This is a normal condition in desalters when the water outlet valve is controlled in manual. After the system is placed in automatic control using the data from the internal sources and external detectors den-sity system, the water outlet valve is being continuous-
Knowing the level values allows for better control of the water outlet valve to ensure that water is neither getting too low nor too high inside the vessel. The density detectors can be calibrated in any density units,
References
Lobo, K., Kremer, L. & Cornelius, S. (2010, October 13) “Fundamentals of Desalter Operations” Presentation at NPRA. Retrieved from https://www.slideshare.net/leonar-doarboleda2/2010-npra-seminar-fundamentals-of-desal-ter-operation
Thornthwaite, P. (2018, Q3) “Opening the crude flexibility window: automation manages threats in real time”, Petro-leum Technology Quarterly, Hydrocarbon Publishing Com-pany. Retrieved from https://www.digitalrefining.com/article/1001548#.XTW_3HtCSUk
Pereira, J., Velasquez, I., Blanco, R., Sanchez, M., Pernalete, C., & Canelon, C. (2015) Chapter 4 “Crude Oil Desalting Process”, In V. Patel (Ed.), Advances in Petrochemical. IntechOpen Limited, London, UK. Retrieved from https://www.intechopen.com/books/advances-in-petrochemicals/crude-oil-desalting-process
Meribout, M., Al Naamany, A., & Al Busaidi, K. (2011) Chapter 10 “Interface Layers Detection in Oil Field Tanks: A Critical Review”, In P. Vizureanu (Ed.), Expert Systems for
Human, Materials and Automation, IntechOpen Limited, London, UK. Retrieved from https://www.intechopen.com/books/expert-systems-for-human-materials-and-automa-tion/interface-layers-detection-in-oil-field-tanks-a-critical-re-view
Garrett, T., Rattanakhambay, Q., Robbins, N., Wunder, M., & Yeung, T. (2016 Q1) “The challenges of Crude Blending – Part 1”, Petroleum Technology Quarterly, Hydrocarbon Publishing Company. Retrieved from https://www.digitalre-fining.com/article/1001216#.XTXAEXtCSUk
Garrett, T., Christensen, P., Vukovich, W., & Yeung, T. (2016 Q2) “The challenges of Crude Blending – Part 2”, Petroleum Technology Quarterly, Hydrocarbon Publishing Company. Retrieved from https://www.digitalrefining.com/article/1001276#.XTXANXtCSUk
Agar Corp (2018). Note 3: Desalter Interface Control, Retrieved from https://www.agarcorp.com/wp-content/uploads/2018/12/Desalter_12132018.pdf
typically kg/m³ or SPG. When using the EmulsionSENS on a desalter and the refiner changes from 26 API crude to 16 API crude no changes in calibration or configuration is required. Due to heavier density crude oil a lower amount of radiation is measured at the top density detectors but the amount of radiation at the bottom of the range (water/brine) will be the same since the density of the fluid is the same.
ly adjusted to maintain proper control and therefore minimize the risk of having salt, water and mineral carryover (see Figure 11). This information is not only useful to the operators to control proper level, it is also useful to the chemical treatment companies since it allows them to monitor the effectiveness of chemical treatment. Some refiners are seeing an increase in the use of chemicals to try to manage the emulsions in the desalter. It is not uncom-mon to see an increase from about 3 ppm of demul-sifiers added to about 35 ppm. The cost for chemicals which removes a specific element i.e. Iron is typically about 3 – 5 €/kg.If a refinery is 270.000 barrels a day (B/D), at 3 ppm the chemical cost is 436 € per day or 159,200 € annually. At 35 ppm the chemical cost would be 5,100 € a day or 1,857,300 € a year, an increase of almost 1.7 million Euros a year. When using the nuclear density profiling system, reducing the chemical usage by 25% (from 35 ppm to 26 ppm) can have a savings of approxima-tely 500,000 € a year. In addition to the reduction of upsets and the chemical savings, a refiner can greatly increase the reliability of downstream equipment of the desalters by severely limiting the amount of corro-sion caused by salt carryover and extending the life of catalyst by increasing the efficiency of the desalter. All in all, the profitability of a refiner can be significantly increased.
11
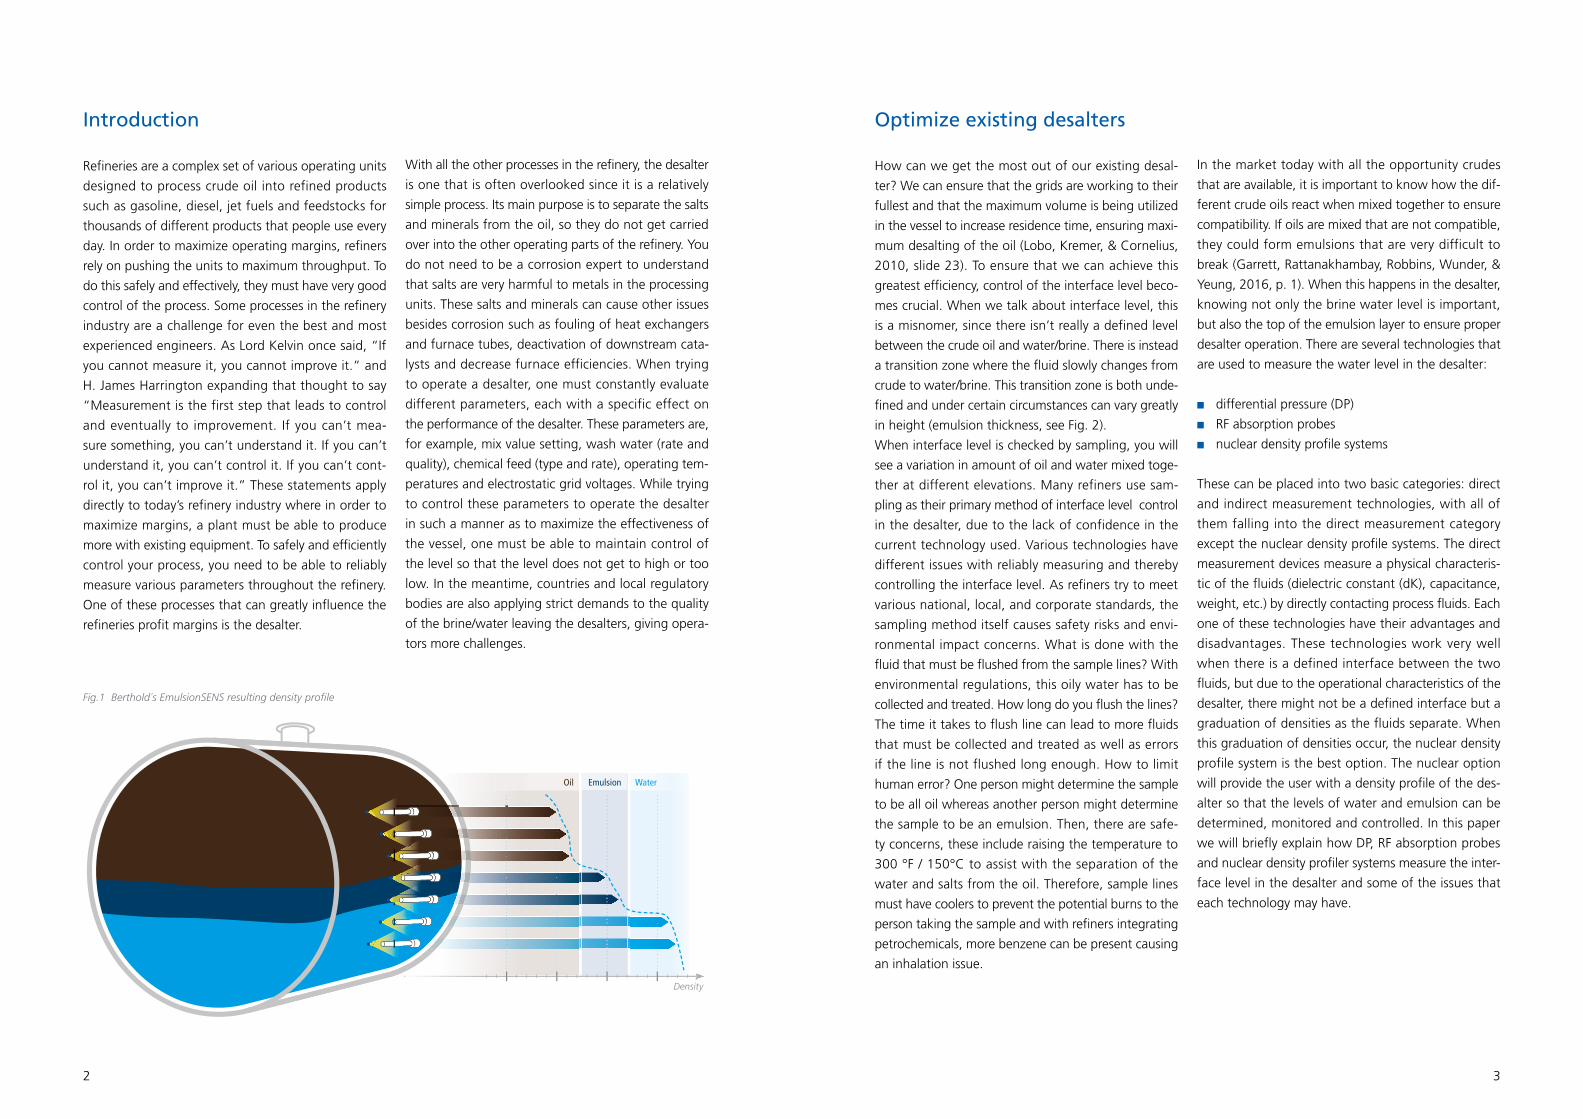
Outstanding long-term stability
A reliable measurement is vital for the operation of a process and is therefore, our highest priority. Berthold’s detectors operate consitantly irrespective of changes in ambient tem-perature. Even drastic temperature shifts, e.g. from winter to summer don’t influence the measurement drift. Due to various patented technologies for detector stabilization and the use of cosmic radiation as an external reference source, the detectors output has an accuracy of under 0.001% per °C temperature change. Apart from employing these cutting-edge technologies in our detectors Berthold is also the only supplier that compensates degradation caused by natural aging. The result: many years of operation without the need for recalibration or maintenance and a measurement that you can
absolutely rely on!
Protected against X-Ray interference (XIP, RID)
Non-destructive testing e.g. for weld inspections can become really distressing if nothing is done to protect the radiometric measurement against interfering radiation. Every Berthold detector employs the X-ray Interference Protection (XIP), whereby the system is able to detect interference. As a result the measurement value is locked before a false level signal can be communicated. By no means are Berthold detectors harmed by the excessive radiation and automatically return to normal operation after the disturbance is over.By employing Berthold‘s unique Co-60 rod sources in combination with our patented Radiation Interference Discrimination (RID) feature, it is even possible to continue the mea-surement despite non-destructive testing is being carried out. This secures a safe process and makes you indepentant from actions that might even occur in neighboring plants.
Minimal source activity
Berthold detectors are highly sensitive to gamma radiation. With a scintillation crystal of 150 x 150 mm the SuperSENS is the most sensitive detector on the market. Due to their excellent efficiency the detectors can be operated with very low source activities, which is important for our customer’s HSE programme and also a major cost saving factor. In fact Berthold detectors can be retrofitted on existing measurements where the source
has become too weak to work with the current detector.
SIL2 / SIL 3 certified
The SENSseries LB 480 detectors are certified for use in SIL2 applications. Even SIL3 is achieved with homogenous redundancy. The certificate covers all measurement applica-tions, from high level or low level alarms to continuous level and density measurement. Thus safe operation of critical processes is guaranteed.
COMMITTED TO TECHNOLOGICAL LEADERSHIP
SIL 2 EXSIL 3

Whi
tepa
per
MPL
M-D
esal
ters
· D
C00
588P
R2 ·
Rev.
01 ·
08-2
020
Berthold Technologies GmbH & Co. KG
Calmbacher Straße 22 · 75323 Bad Wildbad · Germany +49 7081 1770 · [email protected] · www.berthold.com
THE EXPERTS IN MEASUREMENT TECHNOLOGY
Berthold Technologies stands for excellent know-how, high quality and reliability. The customer is always the focus of our solution. We know our business! Using our varied product portfolio, our enormous specialized knowledge and extensive experience, we develop suitable solutions together with our customers for new, individual measurement tasks in a wide variety of industries and applications. Berthold Technologies is specialised in radiometric process measurements for 70 years. This is our core competence with state-of-the-art and cutting edge products and solutions covering a vast range of industries and applications.
We are here for you – worldwide!The engineers and service technicians from Berthold Technologies are wherever you need them. Our global network assures you fast and above all competent and skilled assistance in case of need. No matter where you are, our highly qualified experts and specialists are ready and waiting and will be with you in no time at all with the ideal solution for even the most difficult measurement task.