Embed Size (px)
Citation preview

Multimodal approach to the evaluation of diffuse neuroinflammation
in multiple sclerosis using positron emission tomography and diffusion
tensor imaging
Svetlana Bezukladova 41319
Master’s thesis
Åbo Akademi University
Turku PET centre
11.09.2018
Master’s degree of Biomedical Imaging
In vivo & Clinical Imaging
Credits: 45 ECTS
Supervisors:
1: Eero Rissanen, MD, PhD
2: Laura Airas, MD, PhD, Professor of
Neuroimmunology

ii
Dedicated to my mother

iii
ÅBO AKADEMI UNIVERSITY
Faculty of Science and Engineering
Biomedical Imaging
SVETLANA BEZUKLADOVA:
Multimodal approach to the evaluation of diffuse neuroinflammation in multiple
sclerosis using positron emission tomography and diffusion tensor imaging
Master’s thesis, 73 pp.
In Vivo & Clinical Imaging
September 2018
Neuroinflammation, neurodegeneration and demyelination of brain, spinal cord and
optic nerves are attributed to multiple sclerosis (MS) pathogenesis. Conventional
magnetic resonance imaging (MRI) is mainly used for evaluation of inflammatory
activity and diffuse atrophy in diagnosis and follow-up in MS. Diffusion tensor imaging
(DTI) implementation makes it possible to reveal microstructural alterations in normal
appearing white matter tracts, undetectable in conventional MRI. Positron emission
tomography (PET) in vivo molecular imaging of activated microglia with translocator
protein (TSPO) binding radioligand, provide additional information on the
inflammatory activity in normal appearing white matter (NAWM) as well as in the
differentiation between the chronic active and inactive MS lesion type. Combination of
both imaging modalities will enable a better understanding of MS pathology and can
possibly contribute to the prediction of a progressive course of the disease.
The aim of this research was to evaluate structural and molecular brain changes using
combined MR and PET in vivo imaging techniques in MS patients compared to healthy
controls (HC), with correlational analyses of DTI data to TSPO-PET radioligand
binding. The data of 55 MS patients with both RRMS (n = 40) and SPMS (n = 15)
disease types and 15 healthy subjects were acquired from previously performed MS
imaging studies in Turku PET Centre.
KEYWORDS: Multiple sclerosis, diffusion tensor imaging, PET, MRI, disease
progression

iv
TABLE OF CONTENTS
1 REVIEW OF LITERATURE ................................................................................. 1
1.1 Multiple sclerosis .............................................................................................. 1
1.1.1 Epidemiology ................................................................................................ 1
1.1.2 Diagnosis and course of the disease .............................................................. 1
1.1.3 Disease mechanisms ..................................................................................... 4
1.1.4 Role of microglia in MS................................................................................ 5
1.1.5 MS treatment ................................................................................................. 7
1.2 Imaging of multiple sclerosis ............................................................................ 9
1.2.1 Conventional magnetic resonance imaging (MRI) ....................................... 9
1.2.2 Diffusion tensor imaging (DTI) .................................................................. 10
1.2.2.1 Physical basis and the principle of DTI .............................................. 10
1.2.2.2 Biological basis of diffusion in the brain ............................................ 12
1.2.3 Positron emission tomography .................................................................... 14
1.2.3.1 Physical basis of PET imaging............................................................ 14
1.2.3.2 Imaging microglia with PET ............................................................... 17
2 AIMS OF THE STUDY ........................................................................................ 19
3 METHODS ............................................................................................................. 20
3.1 Participants ...................................................................................................... 20
3.2 MRI/DTI data acquisition ............................................................................... 21
3.2.1 Pre-processing of the data ........................................................................... 23
3.2.2 DTI analysis ................................................................................................ 24
3.3 PET radioligand production and image acquisition ........................................ 26
3.3.1 Modelling of [11C](R)-PK11195 image data .............................................. 26
3.4 Statistical methods .......................................................................................... 27
3.4.1 Tract-Based Spatial Statistics...................................................................... 27

v
3.4.2 Voxel-wise image analysis .......................................................................... 28
4 RESULTS ............................................................................................................... 29
4.1 Demographical and clinical characteristics ..................................................... 29
4.2 DTI in MS patients and healthy controls ........................................................ 32
4.2.1 DTI abnormalities more pronounced in SPMS ........................................... 32
4.2.2 Diffuse abnormalities in segmented NAWM of patients at the age of risk
for progression ......................................................................................................... 34
4.2.3 Diffusion tensor imaging in treatment response assessment....................... 37
4.2.4 Lesion load affects DTI ............................................................................... 40
4.3 PET/DTI correlational analyses ...................................................................... 42
4.3.1 Decreased tract integrity and increased microglial activation in NAWM is
associated with disability ......................................................................................... 42
4.3.2 Increased microglial activation in NAWM is associated with structural
white matter changes ............................................................................................... 44
4.3.3 Voxel-wise image analysis of PET/DTI data .............................................. 48
5 DISCUSSION ......................................................................................................... 49
5.1 Summary of the main findings ........................................................................ 50
5.2 Methodological considerations and data interpretation .................................. 51
5.3 DTI in Multiple Sclerosis ................................................................................ 53
5.3.1 Cingulum bundle and WM structural alteration.......................................... 55
5.4 Increased microglial activation and axonal disintegrity in NAWM as a disease
predictor ....................................................................................................................... 57
5.5 Combination of complementary techniques in MS imaging........................... 58
6 CONCLUSIONS .................................................................................................... 59
7 ACKNOLEDGMENTS ......................................................................................... 60
8 REFERENCES....................................................................................................... 61

Svetlana Bezukladova
1
REVIEW OF LITERATURE
1.1 Multiple sclerosis
Multiple sclerosis (MS) is a common progressive inflammatory and neurodegenerative
disease of the central nervous system (CNS), affecting approximately 2.3 million people
worldwide (Browne et al., 2014). Typically, MS starts between the second and fourth
life decade, progressing over time. Autoimmune in its nature, it begins with
inflammatory chain reaction, when peripheral autoreactive immune cells migrate into
the CNS and attack the myelin structures, forming focal inflammatory lesions.
Development of sclerotic lesions in brain, spinal cord, optic nerves, and attributed to it
chronic neuroinflammation and neurodegeneration, therefore leading to the
accumulation of physical and cognitive impairment.
1.1.1 Epidemiology
The aetiology of MS is not yet fully understood, but multiple genetic (Baranzini and
Oksenberg, 2017) and environmental risk factors (O’Gorman et al., 2012) i.e. hereditary
predisposition, immunological and hormonal changes and their interactions are believed
to contribute to the disease development. Geographical location and incidence rate also
display a link: regions farther from the equator are in a high-risk group for disease
onset. Low sun exposure at higher latitudes is likely to cause vitamin D deficiency, that
is a one of the risk factors for MS (Kočovská et al., 2017). Other risk factors include
smoking, viral infections (EBV, human herpes virus) and microbiome composition
(Olsson et al., 2016; Tremlett and Waubant, 2017).
1.1.2 Diagnosis and course of the disease
There is no single diagnostic test for MS today, therefore clinical assessment, including
magnetic resonance imaging (MRI) and spinal fluid analysis used to support the
diagnosis. MRI visualize brain white matter abnormalities and mainly employed for
diagnosis and follow-up of the disease. Cerebral fluid analysis investigates the
immunoglobulin (IgG) level and is an additional diagnostic test used to support the
demyelinating nature of the neurological condition. Nevertheless, clinical symptoms
and course of the disease are heterogeneous among the MS patients, thus standardized

Svetlana Bezukladova
2
guideline for diagnosis have been proposed. The gold standard for MS is the revised
McDonald criteria (Thompson et al., 2018), based on the concept that lesions appear in
different CNS parts, i.e. disseminate in space (DIS), and accumulate within years i.e.
disseminate in time (DIT). The first clinical episode with neurological symptoms and
sign of demyelination referred to as clinically isolated syndrome (CIS). It is usually
isolated in time and space (i.e. monophasic and monofocal). Long-term risk of transition
from CIS to clinically definite MS (CDMS) is very high, with 60-80% for subjects with
abnormal MRI onset, and about 20% for subjects without present lesions (Miller et al.,
2012). Several prognostic factors were named that predict the transition: number,
volume and site of lesions, notably contrast-enhancing, brain atrophy, serum anti-MOG
and anti-MBP antibodies and evoked potential test findings (Bergamaschi, 2007).
As the disease progresses, patient with more than two relapses and clinical evidence of
newly formed lesions meet diagnostic criteria for relapsing-remitting MS form. RRMS
form is the most common among the patients and associated with repeating attacks or
periodic neurological symptoms with partial or complete recovery. Symptoms may
include weakness of the lower or upper limbs, numbness or tingling, bowel and urinary
disturbance, loss of coordination, blurred vision. Most of the RRMS patients (50-60%)
eventually enter a secondary progressive phase (SPMS), when worsening of clinical
condition of the patient, independent of relapses, lead to permanent disability.

Svetlana Bezukladova
3
It has been shown that disease advance associates with age: median age of MS patients
with risk of converting to the secondary progressive phase of the disease is at 40-55
years, with median time to a secondary progression of 20 years (Koch et al., 2010).
The SPMS diagnosis cannot be defined at once, as the accumulation of neurological
deficit is often slow and ambiguous. Therefore, evaluation of the neurological
impairment of the patient is done according Kurtzke Expanded Disability Status Scale
(EDSS) (John F.Kurtzke, 1983). This method provides a scale from 0 to 10 with 0.5
steps, where 0 correspond to no disability and 10 - to death of the patient due to MS.
EDSS include Functional Systems (FS), graded separately (Table 1).
Table 1. Expanded disability status scale in the evaluation of clinical disability in MS
(modified from Kurtzke et al 1983).
EDSS Definition
0.0 Normal neurologic exam (all grade 0 in FS)
1.0 No disability, minimal signs in one FS (one FS grade 1)
1.5 No disability, minimal signs in more than one FS (more than one FS grade 1)
2.0 Minimal disability in one FS (one FS grade 2, others 0 or 1)
2.5 Minimal disability in two FS (two FS grade 2, others 0 or 1)
3.0 Moderate disability in one FS (one FS grade 3, others 0 or 1), or mild disability
in three or four FS (three/four FS grade 2, others 0 or 1) though fully
ambulatory
3.5 Fully ambulatory but with moderate disability in one FS (one grade 3) and one
or two FS grade 2; or two FS grade 3; or five FS grade 2 (others 0 or 1)
4.0 Fully ambulatory without aid or rest for walk 500 meters; self-sufficient, up
and about some 12 hours a day despite relatively severe disability consisting of
one FS grade 4 (others 0 or l), or combinations of lesser grades exceeding
limits of previous steps
4.5 Fully ambulatory without aid or rest for walk 300 meters; up and about much
of the day, able to work a full day, may otherwise have some limitation of full
activity or require minimal assistance; characterized by relatively severe
disability, usually consisting of one FS grade 4 (others 0 or 1) or combinations
of lesser grades exceeding limits of previous steps
5.0 Ambulatory without aid or rest for walk 200 meters; disability severe enough
to impair full daily activities. Usual FS equivalents are one grade 5 alone,
others 0 or 1; or combinations of lesser grades usually exceeding specifications
for step 4.0.)
5.5 Ambulatory without aid or rest for walk 100 meters; disability severe enough
to preclude full daily activities
6.0 Intermittent or unilateral constant assistance (cane, crutch, or brace) required to
walk about 100 meters with or without resting

Svetlana Bezukladova
4
6.5 Constant bilateral assistance (canes, crutches, or braces) required to walk about
20 meters without resting
7.0 Unable to walk beyond about 5 meters even with aid, essentially restricted to
wheelchair; wheels self in standard wheelchair and transfers alone; up and
about in w/c some 12 hours a day
7.5 Unable to take more than a few steps; restricted to wheelchair; may need aid in
transfer; wheels self but cannot carry on in standard wheelchair a full day; may
require motorized wheelchair
8.0 Essentially restricted to bed or chair or perambulated in wheelchair but may be
out of bed itself much of the day; retains many self-care functions
8.5 Essentially restricted to bed much of the day; has some effective use of arm(s);
retains some self-care functions
9.0 Helpless bed patient; can communicate and eat
9.5 Totally helpless bed patient; unable to communicate effectively or eat/swallow
10.0 Death due to MS
1.1.3 Disease mechanisms
Neuroinflammation and neurodegeneration are both attributed to MS pathology, but it is
still remained unknown what is the driving force of the disease progression. Animal and
immunological studies showed that the early stage of the disease is mainly associated
with peripheral immune activity, whereas progressive stage is manifested by immune
reaction within CNS (reviewed in Friese et al., 2014; Baecher-Allan et al., 2018).
Chronic inflammation, myelin loss, neuronal and axonal degeneration lead to the
formation of sclerotic scar or plaque, that is the hallmark of MS pathology. The
consequence of myelin loss is in disruption of axon saltatory conduction and electric
signal propagation, resulting in physiological symptoms as numbness, tingling,
paraesthesia and dysfunction of organ systems.
Multiple sclerosis is considered as an autoimmune disease caused by a breakdown of
control mechanisms, regulating self-reactive lymphocytes. Current model of disease
mechanism suggests that initial activation of peripheral lymphocytes is the first step in
pathological MS cascade, followed by proliferation of T-cells and their migration across
the blood brain barrier (BBB) into the CNS. By secretion of pro-inflammatory
cytokines (TNF, IFN) and chemokines, activated T-cells contribute to BBB
disruption and entering into CNS. Invading across the barrier, they auto-react on
presented in the CNS self-antigens e.g. myelin, therefore promoting the recruitment of
other inflammatory cells: macrophages, cytotoxic T-cells and B-cells. Consequently,

Svetlana Bezukladova
5
accumulation of T- and B lymphocytes driving the immune response further, through
recruitment of microglia and macrophages in the brain parenchyma (Hemmer et al.,
2015).
Activated microglia and macrophages attribute to chronic inflammation through
secretion of neurotoxins – reactive oxygen and nitrogen species, glutamate and
chemotactic cytokines, that evokes an oxidative stress and leads to mitochondrial
dysfunction and oligodendrocyte damage (Correale, 2014). In turn, imbalance of
glutamate leads to increase of Ca2+ and Na2+ concentration, causing neuronal apoptosis
and necrosis, resulting in neuroaxonal injury (Paling et al., 2013). Beside activated
microglia, reactive astrocytes have been also considered to play role in a progression
mechanism. Like microglia, activated astrocytes have been suspected in secretion of
pro-inflammatory cytokines, chemokines, reactive oxygen and nitrogen species,
therefore causing oxidative stress and contributing to neural tissue damage (Ponath et
al., 2018).
B cells are another potential candidate in MS progression, playing its role by antigen
representation, antibodies secretion and production of abnormal pro-inflammatory
interleukin ratios (Amit et al., 2010). All aforementioned factors, together with
excessive secretion of tumour necrosis factor (TNF), unequivocally contribute to
injury of neuronal structures. Lymphoid structures containing B-, T- and plasma cells
are often found in the close proximity to meningeal space of majority SPMS patients
(Barbara et al., 2006), forming a complex of cell population within CNS, independent
from peripheral immune activity (Magliozzi et al., 2007). It has been shown that the
presence of ectopic follicle-like structure associated with increased cortical atrophy and
cortical demyelination, lower median age at disease onset, time to disease progression
and increased clinical disability in SPMS patients (Magliozzi et al., 2007; Howell et al.,
2011).
1.1.4 Role of microglia in MS
This study is focused on the event of chronic microglial activation during the CNS
neuroinflammation, that is considered to be a key-factor in MS progression. Microglia
are the resident immune cells of the CNS, present at a low level in a healthy brain and
responsible for its homeostatic regulation. Together with macrophages, microglia have a
number of functions, important for CNS maintenance, for example involvement in

Svetlana Bezukladova
6
synaptic plasticity in the adult brain, innate immunity, neuronal programmed cell death
(Bogie et al., 2014).
Homeostatic microglia cells survey the brain parenchyma, detecting the pathogens or
the signaling from the apoptotic cells. Dependent on a molecular signaling factors from
injury or pathogen invasion, ramified microglia can either proliferate into reactive pro-
inflammatory (M1) phagocytic phenotype, or to an alternatively activated (or M2) anti-
inflammatory type (Boche et al., 2013).
Figure 2. Microglia activation patterns. Th1/Th2/Th17 stands for the T helper cells, T
reg is the regulatory T cell (Modified from Pacheco et al., 2012).
The pro-inflammatory “activated” microglia accumulate at the site of injury,
phagocytosing cellular debris of the damaged cells, or killing the potential pathogens.
Beside the phagocytosis, activated microglia secrete and release inflammatory factors,
such as cytokines and cytotoxic substances, therefore promoting oxidative stress, that
can cause the collateral damage to the adjacent cells. During the episode (or attack), the
activated microglia stimulate the recruitment of monocytes from the peripheral
bloodstream and their infiltration into the CNS. The inflammatory monocytes and
activated microglia at the lesion site in turn reactivate the infiltration of autoagressive T-
cells into the CNS, that considered to sustain the chronic inflammatory reaction in MS.
On the other hand, the protective M2 cells phenotype contribute to potential tissue
repair, by expressing anti-inflammatory and immune-regulatory mediators. Animal
studies of experimental autoimmune encephalomyelitis (EAE) model of multiple

Svetlana Bezukladova
7
sclerosis showed, that imbalance towards pro-inflammatory (M1-like) macrophages
and microglia activation patterns induce relapse occurrence (Mikita et al., 2011). This
finding suggests that imbalance in M1/M2 macrophages/microglia equilibrium might be
a key element in the chronic inflammatory process in progressive MS.
In early MS, monocyte-derived macrophages, microglia and anti-inflammatory myelin-
laden foamy macrophages are often abundantly present in the active demyelinating
lesions and may play a neuroprotective role by stimulating remyelination. However, in
chronic active lesions the microglia and macrophages are concentrated around the
sclerotic tissue, at the edge of the lesion site (Frischer et al., 2015). These lesions are
called “the smoldering” plaques, and often found during the progressive MS phase (Dal-
Bianco et al., 2017). Activated microglia is also found in the absence of the lesions,
throughout the normal appearing white and grey matter (Seewann et al., 2009; Haider et
al., 2014). The presence of diffused activated microglia in non-lesional brain matter
may precede the new lesions formation and have been considered as progression
predictor (Kutzelnigg et al., 2005). In fact, activated microglia can be detected with
TSPO-PET imaging (Banati, 2002) or quantitative susceptibility mapping (QSM)
modality (Gillen et al., 2018).
1.1.5 MS treatment
There are several defined types of MS today: 85% of people with MS has a relapsing-
remitting form of the disease onset, following with transitioning to a secondary
progressive form. About 10% are diagnosed with primary-progressive (PPMS) form
onset, characterized with insidious worsening symptoms without relapses (Goldenberg,
2012). All forms have different underlying pathophysiology and hence need to be
treated in appropriate to disease type way.
Current MS therapies only provide modulation of the immune system or immune
suppression for patients in the early stage of the disease, reducing the inflammatory
activity and delaying the disease progression. Disease modifying treatment (DMT) is
believed to be the most effective during the early, inflammatory MS phase, when EDSS
has not yet reached the score of 3. This EDSS status has been considered as the starting
point of accumulation of irreversible neurodegeneration (Leray et al., 2010).
Unfortunately, there is no curative treatment available for MS today and no treatment
Svetlana Bezukladova
8
available to slow down the disease at its secondary-progressive stage (Costello et al.,
2014).
Two longitudinal sub-studies in this thesis investigated disease modifying treatment
effect on MS, including fingolimod (Gilenya) and natalizumab (Tysabri).
Fingolimod, or FTY720, is the oral immunomodulatory drug, which targets
sphingosine-1-phospate (S1P) receptors, that results in suppression of T cells migration
into the CNS, promotes oligodendrocyte survival, causes astrocytes migration and plays
role in neurogenesis (Chun and Hartung, 2010; Dev et al., 2008). Fingolimod treatment
resulted in a lower relapses rate, reduction in brain volume loss and favourable brain
MRI outcome in RRMS patients in Phase III clinical trials (De Stefano et al., 2017,
2016), however only 25% of progression rate reduction was shown in FREEDOMS-II
trial (Gajofatto et al., 2015).
Natalizumab is a humanized monoclonal antibody, 4-integrin antagonist, considered
as a second-line treatment against highly-active RRMS form. The action mechanism of
natalizumab is in the inhibition of lymphocyte migration into the CNS, by binding to
α4β1-integrin and blocking vascular-cell adhesion molecules interaction. Several
studies, including Phase III trials (Polman et al., 2006; McCormack, 2013) showed
significantly reduced relapse rate and risk of progression in RRMS patients, compared
with placebo group. Moreover, treatment resulted in reduced number of new T2-
hyperintense and T1-hypointense lesions, and also reduced the volume of both T2 and
T1-lesions (Miller et al., 2003; Piehl et al., 2011). Despite positive outcomes,
natalizumab treatment resulted in adverse events such as headache, fatigue, urinary tract
infection among the most common, and showed the risk of developing progressive
multifocal leukoencephalopathy (PML), when exposure to drug lasted longer than 2
years (Bloomgren et al., 2012).
Since natalizumab prevents lymphocytes trafficking into the CNS, it has been
hypothesized whether natalizumab treatment might be beneficial for progressive MS by
reducing the chronic intrathecal inflammation and number of pro-inflammatory
cytokines (Sellebjerg et al., 2016). According Christensen and Cadavid (Romme
Christensen et al., 2014; Cadavid et al., 2013), short-term natalizumab studies showed a
promising potential in SPMS treatment, with improvement in Timed 25-Foot Walk
(T25FW) and magnetization transfer ratios in NAWM and cerebral cortex of
progressive MS patients. Natalizumab efficacy in reduction of disability progression in

Svetlana Bezukladova
9
advanced SPMS had been under 2 years investigation in ASCEND trial, but
controversially with previous short-term studies, it did not show delay in disease
progression, but showed the improved 9-Hole Peg test (9HPT) results (Hartung et al.,
2017).
1.2 Imaging of multiple sclerosis
Imaging of multiple sclerosis in the clinical setting is often restricted to a conventional
MRI (cMRI) modality, that only capable to identify the sclerotic plaques and brain
atrophy, allowing to monitor the disease evolution. Contrast enhancement (e.g.
gadolinium) allows to detect the acute lesions in T1-weighted images (Filippi, 2000).
However, the gadolinium uptake is restricted only to an active MS phase, when the
BBB is not intact (Soon et al., 2007), moreover, the gadolinium itself may cause the
potential adverse effects (Dillman et al., 2007). Unfortunately, cMRI not able to detect
the diffuse pathological changes or the metabolic changes of the brain.
To overcome the limitations of cMRI, the combination of both PET and DTI imaging
modalities may enable a better understanding of hidden MS pathology, not visible using
conventional MRI. Diffusion tensor imaging is a sensitive marker for assessment of
pathology related structural alterations in the brain (Alexander et al., 2007). On the
other hand, quantification of microglial activation with translocator protein binding
radioligand [11C](R)-PK11195 positron emission tomography (PET) allows the
measurement of neuroinflammation in vivo (Debruyne et al., 2003; Vivash and O'Brien,
2016).
1.2.1 Conventional magnetic resonance imaging (MRI)
Conventional MRI has become a powerful tool in the clinical routine of MS diagnosis
and disease activity follow up (Filippi and Rocca, 2007). In the clinical setting, T1- and
T2- weighted imaging with a contrast agent application and fluid-attenuated inversion
recovery (FLAIR) are generally included in MR imaging protocol. T1-weighted brain
imaging is mainly used to identify the pathological changes, while T2-weighted
sequence has shown a better differentiation between grey matter (GM) and white matter
(WM), and considerably improved structural tissue resolution. FLAIR sequence allows
to detect pathological changes in the areas, affected by cerebrospinal fluid (CSF)
artifacts (periventricular region), or by partial volume effects (gray/white matter

Svetlana Bezukladova
10
junction, brain stem) (De Coene et al., 1992). Despite being a cornerstone in detecting
brain structural abnormality, conventional MRI imaging protocol is not able to access
the brain’s complex axonal architecture.
Several MRI-based techniques, including magnetization transfer ratio (MTR) imaging,
quantitative susceptibility mapping (QSM), proton 1H-MR spectroscopy and diffusion
weighted imaging (DWI) has sufficiently improved the ability to evaluate the disease
burden. This study is focused on diffusion weighted imaging, and consequently
diffusion tensor imaging, that is a sensitive tool for a non-invasive visualization of
axonal organization of the brain.
1.2.2 Diffusion tensor imaging (DTI)
Diffusion tensor imaging has become a powerful MR imaging tool in diagnostic
applications in the last decade. It has been widely used in surgical interventions of brain
tumours (Pujol et al., 2015), detection of ischemia (Fragata et al., 2017) and traumatic
brain injury (Hulkower et al., 2013). Pathological processes and ageing can affect the
brain tissue integrity, at the same time the diffusion of water molecules is highly
sensitive to changes in the cells microstructure. With implementation of DTI technique,
it is possible to interpret the measured diffusivities and diffusion anisotropy, thereby
revealing the brain matter alterations at the cellular level.
1.2.2.1 Physical basis and the principle of DTI
Diffusion weighted imaging is an MR based technique. Measurement of the MR signal
attenuation, caused by the movement of water molecules is the principal application of
DTI (Alexander et al., 2007).
DTI uses magnetic properties of the most abundant (55-75%) (Popkin and Rosenberg,
2011) in the human body water molecules, that consist of two hydrogen and oxygen
atoms. The hydrogen nuclei, consisting from protons and neutrons, have a net positive
charge and a characteristic motion, producing a small angular momentum. When human
body is placed inside of the magnet and high magnetic field (B0) is applied, the nuclear
spins are aligned parallel (low-energy state) and anti-parallel (high-energy state) to the
external field, creating a net magnetic moment M. When a radio frequency (RF) is
shortly applied, perpendicular to the magnetic field B0, it causes the absorption of
energy by low-energy state nuclei, so the net magnetic momentum is changed. The

Svetlana Bezukladova
11
hydrogen nuclei best absorb energy with a specific “resonance frequency”, that
dependent on the magnetic field strength. The resonance frequency (or Larmor
frequency ) can be derived from the Larmor equation (1):
= * B0, (1)
where is the gyromagnetic ratio constant;
(1H) = 2.675 × 10⁸ rad/s/T or 42.58 MHz/T
Switching off the RF signal causing the anti-parallel nuclei to realign back, parallel to
B0, by the relaxation process. The energy, emitted during the relaxation, induce a
voltage, that can be detected by a conductive receiver coil, placed around the object.
The signal intensity is then reconstructed by Fourier transform to obtain a three-
dimensional grey-scale magnetic resonance image (Guy and Ffytche, 2005).
Localizing the MR signal at the specific region of the interest require using the gradient
coils, that produce the linear magnetic field inhomogeneities. Gradients can be applied
in three dimensions Gx, Gy, Gz by controlling the strength and polarity. Different brain
areas have various proton density, that define the slower/faster rate of the relaxation,
therefore producing higher or lower MR signal intensity. To detect the movement of
water molecules within the cellular structures and reconstruct this, as a signal within the
voxel of diffusion-weighted images, several gradient directions have to be applied. The
diffusion-encoding gradient can be represented as 3D vector q, oriented in the direction
of diffusion and having a length, proportional to the gradient strength:
q = * * Gdiff, (2)
where is the duration of the diffusion-encoding gradient, Gdiff is the diffusion gradient
strength, is the gyromagnetic ratio constant;
The diffusion weighting can be expressed as a b value (b q2 * T), that proportional to
the diffusion time interval, multiplied to the squared strength of the gradient (Hagmann
et al., 2006).
Mathematical model, called “tensor”, which defines the shape of the 3D ellipsoid, is
used to measure the diffusion anisotropy. At least 6 gradient directions of linear
inhomogeneous magnetic fields are required to obtain the signal, needed for the tensor

Svetlana Bezukladova
12
reconstruction. The six parameters, such as the length of the longest (λ1), middle (λ2)
and shortest (λ3) axes or “eigenvalues”, and three-unit vectors or “eigenvectors” v1, v2,
and v3, describe the axes orientation in space (Figure 3). The “diffusion ellipsoid”
represents directions of the diffusivities: parallel to the white matter tracts, or axial
diffusivity (AD), and perpendicular to the fibers, or radial diffusivity, RD = (λ2+λ3)/2.
The mean diffusivity (MD) is an average value of all three eigenvalues, that defines the
mean-squared displacement of water molecules within the voxel, reflecting the
magnitude of diffusion independent of anisotropy, MD = (λ1+λ2+λ3)/3 (Le Bihan et al.,
2001). Another important parameter widely used in DTI is the fractional anisotropy
(FA), enable to quantify the preferential diffusion directionality along WM tracts.
Figure 3. Parameters defining the tensor model A) eigenvalues, B) eigenvectors.
(Modified from Mori, 2007).
The isotropic diffusion model represents an ideal sphere shape with FA value of 0,
whilst FA value of 1 stands for anisotropic diffusion and can be visualized as an
ellipsoid (Figure 4). At least 20 gradient directions are necessary for FA estimation, and
minimum 30 sampling orientations are required for robust tensor reconstruction and
calculation of mean diffusivity (Jones, 2004).
1.2.2.2 Biological basis of diffusion in the brain
Anatomical regions of the brain are defined by different microstructural organization,
that in turn interpret the movement of water molecules. The biological sources of the
anisotropy are the axonal membranes and the cytoskeleton, containing the
neurofilaments and microtubules. The myelin sheath can prevent the diffusion in the
direction, perpendicular to the axon (Winston, 2012). In the brain, CSF diffusion within
the ventricles is not restricted by the presence of the cells, therefore it is high and

Svetlana Bezukladova
13
isotropic, i.e. directionally independent. On the contrary, the grey matter region,
represented by the cell bodies, has slow and isotropic diffusion, while axonal
organization of white matter determine the anisotropic and high diffusivity (Figure 4).
Figure 4. Water diffusion within the brain regions.
Demyelination and axonal injury are the pathological features of multiple sclerosis,
resulting in loss of highly organized fibers structure and myelin integrity (Lassmann et
al., 2001). As a result, water molecules diffusion in the damaged area is no more
hindered in the parallel and perpendicular directions to the tracts. Several studies have
demonstrated the FA reduction and increase in MD in white matter, NAWM and
lesions, visible in T2-weighted MRI in MS, compared to healthy controls (Symms et al.,
2004; Werring, 2000; Castriota-Scanderbeg et al., 2003; Kim et al., 2017; Roosendaal et
al., 2009). The greater increase in diffusivity often indicating disorganization of the
fibers, correlated with disease duration and was more prominent in the advanced phase
of the disease (Scanderbeg et al., 2000). RD change suggested the demyelination
patterns within the lesions and in non-lesional tissue (Klistorner et al., 2016, 2015;
Roosendaal et al., 2009). Altered AD is attributed to axonal loss, that takes place in
acute MS lesion and progresses over time. Associations between reduced tract integrity
and EDSS have also been found (Harrison et al., 2013; Onu et al., 2012; Ciccarelli et
al., 2001).
CSF
Isotropic
High diffusivity
White matter
Anisotropic
High diffusivity
Grey matter
Isotropic
Low diffusivity
Svetlana Bezukladova
14
However, the interpretation of change in diffusion should be done carefully, as the
diffusion tensor is an oversimplified model of the diffusion in the biological tissues. The
acquisition artifacts and low SNR, issues with fiber crossing/merging, and the presence
of more than one fiber in a voxel may produce the misleading results (Wheeler-
Kingshott and Cercignani, 2009). To overcome the limitations of the ellipsoid diffusion
tensor model, several advanced DTI techniques with complex models CHARMED
(Assaf and Basser, 2005) and NODDI (Zhang et al., 2012) have been developed.
1.2.3 Positron emission tomography
Positron emission tomography is a non-invasive, specific and highly sensitive nuclear
medicine imaging, that can be used for evaluation of metabolic changes within the
body. PET imaging has been utilized in the preclinical research and human studies,
related to oncology, cardiology, neurodegenerative and psychiatric diseases (Salata and
Singh, 2017; Nandu et al., 2018; Slifstein and Abi-Dargham, 2017; Cerami et al., 2017).
Subsequently, it has become an important tool in the detecting of brain
neuroinflammation in the last decade (Dupont et al., 2017; Airas et al., 2018). This
imaging technique is able to visualize the hidden pathological changes in vivo,
contributing to the understanding of disease pathogenesis.
1.2.3.1 Physical basis of PET imaging
Positron emission tomography utilize the detection of radioactivity from the
radiopharmaceutical, administered intravenously into the human body, where it binds
and interacts with specific targets in a tissue, therefore providing quantitative measure
of metabolic and cellular activity.
Principally, the PET tracer is composed of radioactive isotope, produced by the proton
accelerator, or cyclotron. The radionuclides of interest (11C, 18F, 15O, 13N) are
biologically presented elements, that makes them directly applicable to animal and
human studies. The forementioned radioisotopes have a short half-life (Miller et al.,
2008), corresponding to the timescale of the studied biological event, thus reducing the
long-term risks, caused by the ionizing radiation and providing quick biodistribution
from the target. The next step of the compound synthesis is the internalization of the
radionuclide into a specific molecular structure (vehicle, ligand), that binds to a
corresponding target within the tissue. The radiotracer is required to have a
pharmaceutical quality, before being administered to a patient, thus the compound is

Svetlana Bezukladova
15
purified, formulated, sterilized and undergo quality assurance control. Following
intravenous administration, the unstable radioisotope decays with positron (+)
radiation, colliding with surrounded electrons in the tissue. Consequently, PET is based
on detection of the annihilation coincidence (ACD) of the two opposed 511 keV -rays,
emitted in a result of positron-electron annihilation in the medium (human body).
Figure 5. Schematic representation of PET signal acquisition.
(https://www.hamamatsu.com/jp/en/technology/innovation/pet/index.html)
The ionizing radiation is detected and measured by the highly sensitive gamma camera,
placed around the subject. Gamma camera imaging is often performed in two types -
static or dynamic, with dynamic imaging involves the acquisition of series of planar
images with varying distribution activity of radiopharmaceutical. Upon acquisition, the
raw data is reconstructed with Fourier transform and filtered-back projection, followed
by correction for scattering and attenuation (Zanzonico, 2012). The radioligand binding
count per voxel is proportional to activity concentration and quantified in terms of SUV
(standardized uptake value):
SUV = 𝑀𝐵𝑞 /𝑐𝑚3𝑜𝑓𝑡𝑖𝑠𝑠𝑢𝑒
𝑀𝐵𝑞 𝑖𝑛𝑗𝑒𝑐𝑡𝑒𝑑/𝑔𝑚 𝑏𝑜𝑑𝑦 𝑚𝑎𝑠𝑠 (3)

Svetlana Bezukladova
16
However, the SUV measurement does not allow the pharmacokinetic modelling of
neuroreceptor binding, therefore the kinetic modelling, such as Logan plot, have been
utilized. The Logan plot calculates the neuroreceptor binding in a target tissue as the
distribution volume ratio (DVR), that is the proportion of the distribution volume (DV)
in target region to the DV in a reference region (free of specific binding). Therefore,
radioligand kinetics can be measured with a 2-tissue compartments model, utilizing the
calculation of non-metabolized tracer in the plasma as the function of time, or time
activity curve (TAC).
Figure 6. Two tissue compartmental model for TSPO imaging. K1 and k2 represent rate
constants for radioligand transport from plasma to tissue and vice versa; k3 and k4 are
the constant rates between the free and specific binding compartments. Modified from
(Turkheimer et al., 2007)
To reconstruct the TAC, repeated arterial blood samples are taken during the dynamic
PET imaging. DVR can be calculated with the equation (Logan et al., 1990):
DVR =
K1
k2∗(1+
k3
k4)
K′1
k′2
= 1 + k3
k4= 1 +
Bmax
Kd= 1 + 𝐵𝑃, K1/k2 = K’1/k’2 (4)
where BP is the binding potential , Bmax is the receptor availability, Kd is the equilibrium
dissociation constant, K1, k2, k3, k4, K’1, k’2 are the rate constants between the
compartments of target and reference tissues.
In order to avoid the unpleasant for the patient blood sampling during the imaging, the
reference-based Logan plot methodology have been developed (Logan et al., 1996). In

Svetlana Bezukladova
17
reference region modelling, the curve is derived from the ROI (region of interest) with a
low radioligand binding (e.g. HC gray matter). The supervised clustering algorithm
(Turkheimer et al., 2007) have been implemented for automated creation of the
reference region and combined with a reference region modelling for robust quantitative
assessment of PET imaging.
1.2.3.2 Imaging microglia with PET
PET represents a unique tool for molecular imaging of neuroinflammation, contributing
to in vivo investigation of the brain pathological processes. Microglia activation have
been linked to a several neurodegenerative diseases, including multiple sclerosis (Bogie
et al., 2014), Alzheimer’s disease (AD) (Mosher and Wyss-Coray, 2014) and
Parkinson’s disease (PD) (Moehle and West, 2015). Consequently, PET imaging allows
for in vivo detection of microglial and macrophages activation (Banati et al., 2002),
reactive astrocytosis (Gulyás et al., 2011; Tronel et al., 2017) and can potentially be
translated from animal to human studies for myelin content detection (Stankoff et al.,
2006; Wang et al., 2009).
Various radioligands have been developed for the imaging of neuroinflammation in
humans, but translocator protein binding radioactive tracers have been stated as the
most prominent ones (Vivash and OBrien, 2016). [11C](R)-PK11195 or ([N-methyl-
11C]-1-(2-chlorophenyl)-N-(1-methylpropyl)-3-isoquinolinecarboxamide is the most
used highly selective TSPO radioligand up to date (Liu et al., 2014), although numerous
2nd generation TSPO radioligands have been developed and studied (Colasanti et al.,
2014; Takano et al., 2013; Poutiainen et al., 2016). TSPO is the 18 kDa translocator
protein, formerly called as the peripheral benzodiazepine receptor (BPR) (Papadopoulos
et al., 2006), located primarily in the outer mitochondrial membrane and present in a
low level of glial cells of the heathy brain. In response to neuronal injury, TSPO is over-
expressed in microglia and astrocytes (Chen and Guilarte, 2006; Lavisse et al., 2012),
thus being a sensitive probe to target neuroinflammation (Rupprecht et al., 2010).
In vivo and post-mortem immunohistochemical human studies showed that TSPO is
upregulated in brain pathological conditions in MS, AD, PD and ALS (amyotrophic
lateral sclerosis), Huntington disease (HD), frontotemporal dementia, ischemic stroke
and encephalitis (reviewed in Cerami et al., 2017; Cosenza-nashat et al., 2009; Kannan
et al., 2009). Increased specific [11C]PK11195 binding, quantitatively evaluated as

Svetlana Bezukladova
18
binding potential (BP) or distribution volume ratio (DVR), has been detected in NAWM
and perilesional WM areas in SPMS patients, compared to RRMS or HC, and was
associated with a high concentration of activated microglia at the lesions periphery
(Politis et al., 2012; Rissanen et al., 2014; Debruyne et al., 2003).
Figure 7. Imaging microglia with [11C]PK11195 PET radioligand. (Modified from
Venneti et al., 2013).
Despite being considered as a gold standard among TSPO-ligands, [11C]PK11195 have
several limitations: high lipophilicity causing a non-specific binding (Shah et al., 1994),
low signal-to-noise ratio (Kobayashi et al., 2018), low bioavailability and binding to
blood cells and plasma proteins (Turkheimer et al., 2015).
A previous study in our research group was performed on MS patients in early RRMS
(n = 10) and late SPMS disease stage (n = 10), with comparison to a healthy control
group (n = 17). The MS cohort showed a significant association of reduced FA in
NAWM with disability and age. Also, increased [11C]PK11195 binding in NAWM
showed a correlation with brain atrophy, reduced FA in NAWM and increased lesion
volume (Rissanen et al., 2018).

Svetlana Bezukladova
19
2 AIMS OF THE STUDY
To further substantiate previously acquired results, a larger group size was studied (n =
55), covering the full spectrum of disease progression (RRMS: n = 15, RRMS close to
progressive stage conversion: n = 25, SPMS: n = 15), with comparison to a sex and age-
matched control group. In addition, four DTI parameters were investigated in the whole
and segmented NAWM, compared to PET findings.
Hypothesis: Microglial activation associates with normal appearing white matter
structural damage in multiple sclerosis.
The main aim of the study was to evaluate structural and molecular brain changes in the
pooled MS patients’ cohort, using combined DT-MR and PET imaging with
comparison to healthy controls, and:
1) Perform DTI analysis in the whole NAWM and segmented NAWM of MS
cohort, to evaluate differences in DTI abnormalities between MS subtypes
compared to HC;
2) Evaluate the possible correlations of [11C]PK11195 PET binding to white matter
tracts integrity in MS;
3) Evaluate the possibility of treatment response assessment with DTI analysis in
MS.

Svetlana Bezukladova
20
3 METHODS
3.1 Participants
The imaging data was acquired from the “KADEPET-RRMS” and “KADEPET-SPMS”
substudies, already carried out as part of the “Imaging CNS adenosine receptor
expression in patients with Multiple sclerosis, Huntington’s disease and Parkinson’s
disease using positron emission tomography (KADEPET) research project. In addition,
baseline data from the ongoing study named “Role of microglia in the pathogenesis of
progressive multiple sclerosis (PROMS)” was utilised. All of the forementioned studies
have previously been approved by the Ethics Committee of the Hospital District of
Southwest Finland. All study subjects had given their written, informed consent before
entering the study.
The KADEPET-RRMS project has provided data for 10 RRMS patients, 28-53 years
old. DTI with 64 gradient directions have been acquired at baseline, 2 and 6 months
from the initiation of fingolimod treatment. The TSPO-PET imaging results of this
cohort have already been reported earlier (Sucksdorff et al., 2017).
KADEPET-SPMS study included 20 patients, 29-64 years old, with both SPMS (n =
15) and RRMS (n = 5) types of MS. 6 SPMS patients and 4 RRMS patients were
initiated on natalizumab treatment after the baseline imaging, whereas 10 patients (9
SPMS and 1 RRMS) without any disease modifying treatment served as a negative
control group. [11C]PK11195 PET and 33 directions DTI imaging were performed at
baseline and after one year for all patients. A separate manuscript describing the TSPO-
PET imaging data in this project is being prepared.
PROMS is an ongoing project evaluating disease progression, that include baseline
imaging with TSPO-PET, MRI with DTI and clinical evaluation, and yearly follow-up
with MR-imaging and clinical evaluation up to 5 years. All patients have been on
different DMTs at the baseline imaging. Three patients were taking Tecfidera (dimethyl
fumarate), 5 patients were on Gilenya treatment (fingolimod), 4 patients had Rebif 44
mikrog treatment (interferon beta 1-a s.c.), 4 patients received Copaxone (glatiramer
acetate), 2 were on Aubagio (teriflunomide) and other 2 on Avonex (interferon beta 1-a,
i.m.) treatment, while the rest of the patients (n = 5) had no treatment. PROMS study

Svetlana Bezukladova
21
imaging protocol included [11C]PK11195 imaging and 64 gradient directions DTI for 25
RRMS patients, aged 40-60 years and 10 healthy controls, 21-52 years old. It is worth
noting that MS patients in this age group are in the risk of converting to the secondary
progressive phase of the disease, since the average age for the onset of the disease
progression is at the age of 50 years (Koch et al., 2010).
In addition, to complement the age matching of the control group to the fore mentioned
MS subgroups, four healthy controls, 48-58 years old were also included from NIMS-
PET project and one healthy subject, 52 years old, from VAMI project.
Pooled treated cohort (total n = 45) i.e. KADEPET-RRMS (n = 10) at 6 months,
KADEPET-SPMS (n = 10) at 1 year, PROMS (n = 25) at baseline (immunomodulatory
treatment in use at the time of imaging) and pooled untreated cohort (total n = 30) e.g.
KADEPET-RRMS (n = 10) at baseline, KADEPET-SPMS (n = 20) at baseline
(immunomodulatory treatment not in use at the time of imaging), were used to evaluate
potential DTI parameter changes in the normal appearing white matter, in comparison to
healthy controls, and in comparison to microglial activation evaluated with TSPO-PET.
Pooled cohort, including 55 MS patients, i.e. KADEPET-RRMS (n = 10) and
KADEPET-SPMS (n = 20) at baseline imaging, plus PROMS (n = 25), was used to
evaluate association between structural integrity and microglial activation in NAWM.
3.2 MRI/DTI data acquisition
Magnetic resonance imaging in all substudies was performed with 3T MRI Phillips
Ingenuity (Philips Healthcare, Cleveland, OH) scanner using a SENSE head coil.
Acquisition parameters of all substudies are shown in Table 2.
Table 2. MRI acquisition parameters used in KADEPET-RRMS, KADEPET-SPMS,
PROMS, NIMS and VAMI substudies.

Svetlana Bezukladova
22
DT
I se
quen
ce
63 g
radie
nt
dir
ecti
on
s, b
0 =
1
(b0 =
4 f
or
VA
MI
subst
udy
)
b-v
alue
= 1
000 s
mm
-2
TR
/TE
= 9
500/1
20 m
s
FO
V =
256 x
256 m
m
Spat
ial
reso
luti
on 2
x2x2 m
m
Acq
uis
itio
n m
atri
x 1
28x128 m
m
Fli
p a
ngle
= 9
0
Acc
eler
atio
n f
acto
r 2
33 g
radie
nt
dir
ecti
ons,
b0 =
1
b-v
alue
= 1
000 s
mm
-2
TR
/TE
= 9
500/1
20 m
s
FO
V =
256 x
256 m
m
Spat
ial
reso
luti
on 2
x2x2 m
m
Acq
uis
itio
n m
atri
x 1
28x128 m
m
Fli
p a
ngle
= 9
0
Acc
eler
atio
n f
acto
r 2
3D
FL
AIR
VIS
TA
TE
/TR
/TI=
337/8
000/2
400 m
s
TE
/TR
/TI
=
125/1
0000/2
800 m
s
Axia
l T
2-w
eighte
d
sequen
ce
TR
/TE
= 3
756/8
0 m
s
TR
/TE
= 3
000/8
0 m
s
3D
T1-w
eighte
d s
equen
ce
TR
= 8
.1m
s
TE
= 3
.7 m
s
FO
V =
256 m
m x
256 m
m
Spat
ial
reso
luti
on =
1x1x1 m
m
Acq
uis
itio
n m
atri
x 2
56 x
256m
m
Fli
p a
ngle
= 7
TR
= 8
.2 m
s
TE
= 3
.7 m
s
FO
V =
240 x
260 x
180 m
m
Spat
ial
reso
luti
on =
1x1x1 m
m
Acq
uis
itio
n m
atri
x 2
40 x
240m
m
Fli
p a
ngle
= 7
Su
bst
ud
y
MR
I p
ara
mete
rs
KA
DE
PE
T-R
RM
S
PR
OM
S
NIM
S
VA
MI
KA
DE
PE
T-S
PM
S

Svetlana Bezukladova
23
3.2.1 Pre-processing of the data
The raw MRI and DWI data was downloaded in DICOM format and converted to
NIFTI format with dcm2nii converter tool (Li et al., 2016). The lesions at the each time
point were identified with Lesion Segmentation Toolbox in SPM8 (The Wellcome Trust
Centre for Neuroimaging, Institute of Neurology, University College London) (Schmidt
et al., 2012), and then manually corrected slice by slice in FLAIR and T1-weighted
images. The T1 image was filled with the resulting lesion masks, following with
segmentation of grey and white matter with Freesurfer 6.0 software
(http://surfer.nmr.mgh.harvard.edu/). The segmentation processing consisted of
intensity normalization, skull-stripping, transformation into Talairach space and
cortical/subcortical structure segmentation. T1 and segmented WM and GM volumes
were then co-registered to MNI (Montreal Neurologic Institute) ICBM152_T1
stereotaxic space template (Mazziotta et al., 2001). To create a NAWM mask, T2
hyperintense lesions were excluded from WM mask by segmentation with Lesion
Segmentation Tool (Figure 8). The binary NAWM mask also excluded the deep GM,
temporomedial regions, and cerebellum.
Figure 8. NAWM mask (blue) with excluded T2 lesions (yellow) overlapped with T1-
weighted image (slice coordinates X = 77, Y = 109, Z = 77).
Six NAWM regions (deep WM, cingulate, frontal, temporal, occipital, parietal) were
derived with Freesurfer atlas-based method, by parcellation of the subcortical WM
(Salat et al., 2009) and excluded corresponding T2 hyperintense lesions (Figure 9).
Sagittal Coronal Axial

Svetlana Bezukladova
24
Figure 9. WM parcellation identified six ROIs: frontal WM (yellow), parietal WM
(blue), temporal WM (red), occipital WM (dark blue), cingulate WM (green), deep WM
(purple). Segmented lesions are shown in white.
The T2 lesion load was measured in the whole NAWM and segmented NAWM of the
three study groups. It was investigated whether the lesion burden affects the diffusion in
the white matter. Normalized lesion burden was calculated in each of the segmented
WM region by dividing the lesion volume in each segmented WM to the volume of the
associated region i.e. normalized lesion burden in segmented WM = lesion volume
within ROI / volume of ROI.
3.2.2 DTI analysis
The raw data was checked for artefacts with ExploreDTI v4.8.6 software
(http://www.exploredti.com) quality assessment tool and DTIPrep 1.2.7 software
(https://www.nitrc.org/projects/dtiprep/) (Oguz et al., 2014). Subjects with a large
number of artefacts (Figure 10) were excluded from further DTI analysis.
Sagittal Coronal Axial

Svetlana Bezukladova
25
Figure 10. Inter-slice and intra-slice intensity artefact in sagittal and coronal planes of
DWI data. LR (left-right), SI (superior-inferior), AP (anterior-posterior).
DWI data was pre-processed with ExploreDTI for motion, eddy current (EC) and
EPI/susceptibility induced distortion correction (Leemans and Jones, 2009). First, the
headers of T1 and DWI files were adjusted with “Flip/permute dimensions of *nii files”
plugin, then T1 image was masked with plugin “Mask 3D *nii files” with kernel size 3
and threshold of 0.02. To run the non-rigid EPI correction, diffusion tensor tensor
estimation method was set to RESTORE (robust estimation of tensors by outlier
rejection) approach (Chang et al., 2005), for both native and transformed data (T1-
weighted image was specified as a transformation space). The image type for
registration was specified as FA. The number of resolutions was set to 4 and
deformation axes were constrained to the anterior-posterior direction.
Figure 11. Diffusion tensor map with color-coded diffusion directions (right), fused
with T1 sagittal image (left). LR (left-right), SI (superior-inferior), AP (anterior-
posterior).

Svetlana Bezukladova
26
After pre-processing, four maps of interest (FA, MD, AD, RD) were reconstructed from
the diffusion tensor map and co-registered in statistical parametric mapping (SPM8) to
corresponding T1-weighted image in MNI152 space.
3.3 PET radioligand production and image acquisition
[11C]CO2 radioisotope with 20.4 minutes half-life was in-house (PET centre) produced
with 18MeV proton bombardment of 14N in cyclotron. The 11C was produced in-situ
into 11CO2 via hot atom processes. [11C]CO2 was first converted to [11C]CH4, directed
through iodine reactor, and then further converted to [11C]CH3I through the gas phase
method. [11C]CH3I, released by heat and sweep gas, delivered into the reaction solution,
containing precursor for PK11195, and then underwent HPLC (high performance liquid
chromatography) purification and reformulated into ready-to-inject dose. Dynamic 60
minutes [11C]PK11195-PET imaging was performed with ECAT HRRT scanner (CTI,
Siemens Medical Solutions, Knoxville, TN, USA) with an intrinsic spatial resolution of
2.5 mm. Restriction of head movements during the scan was achieved by using
individual thermoplastic head mask. Previous to the radioligand injection, the
attenuation correction scan was performed with single photon transmission scanning
using 137Cs point source. The radioligand was administered intravenously, the target
dose being 500 MBq. The injected doses were not significantly different between study
groups (data not shown).
3.3.1 Modelling of [11C](R)-PK11195 image data
All of the data from three study cohorts and healthy control group was processed in the
following way. PET images were reconstructed using 17 time frames (total of 3600
seconds) as described previously (Rissanen, 2015). The head movement between the
frames were corrected by realigning the dynamic PET images in SPM8 software, after
which the PET sum images were calculated from the dynamic PET images. Individual
PET sum images were co-registered to 3D T1 MR images and then all data was resliced
to 1 mm voxel size. Finally, for each patient, the PET sum images from the subsequent
sessions were co-registered to the first session’s (baseline) PET image.
For evaluating [11C]PK11195 binding, seven regions of interest (ROI) were defined
using Freesurfer software in global NAWM and six WM subregions: deep WM,

Svetlana Bezukladova
27
cingulate, frontal, temporal, occipital and parietal WM, excluding lesional WM (i.e. MS
plaques visible in FLAIR and T1 MRI sequences), segmented with LST.
Specific TSPO-PET radioligand binding was quantified as the distribution volume ratio
(DVR), using Logan plot with reference tissue input. The gray matter reference region
devoid of specific binding was extracted with the supervised cluster algorithm (SVCA)
(SuperPK software, King’s College, London, UK) with four predefined kinetic tissue
classes for normal GM, normal WM, vasculature and high specific binding.
The reference tissue–input Logan method, with a 20- to 60-min time interval, was
applied to the regional TACs using the SVCA gray reference input. Additionally, the
modelling was performed in voxel level, where parametric maps of specific binding
(measured as DVR) were calculated from the dynamic PET images, by using simplified
reference tissue model (Gunn et al., 1997) with the clustered reference tissue input.
3.4 Statistical methods
The statistical analyses of DT-MR, PET imaging and clinical parameters were
performed with RStudio software (version 1.1.419). The normality distribution of the
data was evaluated with the Shapiro-Wilk test and checked visually with density and Q-
Q plots. The nonparametric Mann–Whitney U test was chosen to evaluate the group
differences of non-normally distributed data and in groups with low number of the
subjects. Student’s t-test was chosen to test for age difference between groups. Pairwise
repeated measurements (e.g. baseline – follow up) were performed with Wilcoxon
signed-rank test. The correlational analyses between variables of interest were analysed
with Spearman nonparametric correlation test. P value of less than 0.05 was considered
statistically significant for all analyses.
3.4.1 Tract-Based Spatial Statistics
Tract-Based Spatial Statistics (TBSS) analysis was performed using standard TBSS
pipeline (Smith et al., 2006). First, FA/MD/AD/RD maps, generated in ExploreDTI,
were reoriented to the FSL’s standard space using an FSL command “fslreorient2std”.
The TBSS pipeline consisted of 4 steps, including the data pre-processing (e.g.
removing brain-edge artefacts and zeroing the end slices), registering all the data to a
common 1x1x1 mm FMRIB58_FA template using nonlinear registration. The next step

Svetlana Bezukladova
28
involved the affine transformation of all subjects’ data to the 1x1x1mm MNI152
standard space, followed by merging all the images to a single 4D image file.
Thereafter, the average of all registered individual maps generated the mean cross-
subject image (e.g. mean_FA), and this was then fed into skeletonization program to
create a mean skeleton (e.g. mean_FA_skeleton), that represents main fiber tracts. The
mean FA skeleton was thresholded with value of 0.2 to exclude the areas with high
inter-subject variability. The last step in the pipeline included the alignment of each
subject’s FA map onto the mean skeleton, by creating a skeleton “distance map”. This
was done by searching the highest local FA value in the area perpendicular to the
skeleton tract, and then assigning this value to the corresponding skeleton point. As a
result, the pipeline creates a 4D image file, ready for voxel wise statistics analysis.
The same transformations were applied to the MD, AD and RD diffusivity maps.
To identify the DTI parameters differences between the patients and controls at the
voxel level, the voxel wise statistical analysis was performed on skeletonized FA
(MD/AD/RD) data. For all TBSS analyses, permutations-based statistics with 210 (for
group size n = 10) random permutations, performed by FSL randomize program
(Winkler et al., 2014), and threshold-free cluster enhancement (TFCE) (Smith and
Nichols, 2009) were used to obtain the significant differences between two groups.
TFCE score was thresholded at the value of p < 0.05, correcting for multiple
comparisons by controlling over family-wise error (FWE) rate.
3.4.2 Voxel-wise image analysis
Voxelwise Pearson’s correlations were calculated in MATLAB between normalized FA
and DVR images of 54 MS patients (1 subject was excluded from analysis due to large
number of artifacts in raw DWI image). Parametric images were smoothed with 8mm
FWHM (full width at half maximum) filter for noise and normalization compensation.
The resulting p values were corrected for false discovery rate (FDR) using significance
level p < 0.05, showing statistically significant clusters of voxels in normal appearing
white matter, having negative correlation between FA and TSPO-binding.
Svetlana Bezukladova
29
4 RESULTS
4.1 Demographical and clinical characteristics
Description of the demographical and clinical data is summarized in Table 3. The mean
age of the groups at baseline and at follow up imaging sessions was not statistically
significantly different from the mean age of the healthy control group. The patients in
KADEPET-SPMS and PROMS groups were older than patients in KADEPET-RRMS
group, that is expected for SPMS patients (n = 15, mean age 50.3 ± 9.19 years, p =
0.048) and patients who are in the risk group of progression (n = 25, mean age 47.6 ±
3.99 years, p = 0.029), as those patients have longer disease duration (15.7 ± 6.98 years,
p = 0.006 and 13.6 ± 6.44 years, p = 0.022 respectively), compared to the RRMS
patients (n = 10, mean age 42.4 ± 9.4 years) with disease duration of 8.4 ± 3.8 years.
The sex ratio was similar for the four groups. As expected, the EDSS of SPMS patients
(n =15) at the baseline imaging was higher, EDSS = 4.87 ± 1.33, than the EDSS of
relapsing-remitting patients (total n = 40) at the baseline, EDSS = 2.8 ± 0.94, p =
2.285e-05 (data not shown).
The grey matter cortex volume (p = 0.028), T2 (p = 0.154) and T1 hypointense lesion
load (p = 0.125) showed a trend without statistical significance to decrease after 1 year
of natalizumab treatment of 10 MS patients in KADEPET-SPMS group. However, the
EDSS of treated MS patients in KADEPET-SPMS group increased from 3.5 ± 1.51 to
3.8 ± 1.41, p = 0.014 (data not shown). Meanwhile, there were no significant changes in
the T2 lesion, NAWM or grey matter volumes during the 6 months after initiation of
fingolimod treatment in KADEPET-RRMS group. Additionally, the EDSS showed a
trend to decrease after 6 months of fingolimod treatment, from EDSS 2.7 ± 0.53 to
EDSS 2.6 ± 0.72, p = 0.28.
Follow-up data of PROMS group was not available at the moment of conducting this
project.
Table 3. Demographical and clinical MRI parameters of three study cohorts and healthy
controls, expressed as mean values with standard deviation, except stated.

Svetlana Bezukladova
30
KADEPET-
RRMS
KADEPET-SPMS PROMS Healthy
controls
Number of
subjects
10 20 25 15
Gender 9F, 1M 12F, 8M 19F, 6M 9F, 6M
Age (years) 42.4 ± 9.4 48.3 ± 9.8 47.6 ± 3.99 42.5 ± 11.83
Disease duration
(years)
8.4 ± 3.8 13.75 ± 7.1 13.6 ± 6.44 N/A
MS subtype 10 RRMS 15 SPMS +
5 RRMS
25 RRMS N/A
EDSS baseline
follow up
2.7 ± 0.54
2.6 ± 0.72
4.3 ± 1.59
4.5 ± 1.64
2.9 ± 1.04
N/A
N/A
N/A
NAWM (cm3)
baseline
follow up
447.2 ± 56.4
444.8 ± 56.6
435.6 ± 63.8
434 ± 65.1
453.8 ± 66.3
N/A
497.3 ± 35.5 *
N/A
GM ctx (cm3)
baseline
follow up
423.6 ± 38.2
423.9 ± 39.1
438.8 ± 43.1
429.6 ± 44.9
433.6 ± 35.5
N/A
490.2 ± 58.5*
N/A
T2 lesion load
(cm3) **
baseline
follow up
4.1 (2.58-46.79)
4.1 (2.57-53.26)
17.7 (3.91-70.12)
16.2 (2.08-63.33)
6.7 (0.48-35.24)
N/A
N/A
T1 hypointense
lesion load (cm3)
**
baseline
follow up
3.2 (2.22-33.53)
3.1 (2.28-40.83)
16.7 (3.19-67.89)
14.8 (1.65-61.32)
3.3 (0.23-20.78)
N/A
N/A
* Data available for 10 HC only
Data available for 24 patients only
** Expressed as median (IQR) values

Svetlana Bezukladova
31
Table 3a. Extension to table 3, with additional demographical and clinical MRI
parameters of KADEPET-SPMS substudy, expressed as mean values with standard
deviation.
KADEPET-SPMS
Number of subjects 20
Gender 8F, 7M 4F, 1M
Age (years) 50.3 ± 9.19 42.0 ± 9.66
Disease duration
(years)
15.7 ± 6.98 7.9 ± 3.15
MS subtype 15 SPMS 5 RRMS
EDSS baseline
follow up
4.87 ± 1.33
5.1 ± 1.42
2.5 ± 0.79
2.7 ± 0.67
Table 4. Demographical and clinical MRI parameters of pooled cohorts, treated (n = 45)
and untreated (n = 30), expressed as mean values with standard deviation.
Pooled treated cohort Pooled untreated cohort
Number of subjects 45 30
Patients pooled
from subtudies
KADEPET-RRMS (n =10) at 6
months follow up
KADEPET-SPMS (n =10) at 1
year follow up
PROMS (n = 25)
KADEPET-RRMS (n =10)
at baseline
KADEPET-SPMS (n =10) at
baseline
Gender 34F, 11M
21F, 9M
Age (years) 47.1 ± 7.10 46.4 ± 9.91
Disease duration
(years)
12.6 ± 6.87
11.4 ± 6.96
MS subtype 6 SPMS, 39 RRMS
15 SPMS, 15 RRMS
EDSS 3.0 ± 1.14
3.75 ± 1.52

Svetlana Bezukladova
32
4.2 DTI in MS patients and healthy controls
DTI analysis in the whole NAWM and segmented NAWM was done for each of the
study groups and for two pooled cohorts, the pooled treated cohort (n = 45) and pooled
non-treated cohort (n = 30), compared to healthy control group.
4.2.1 DTI abnormalities more pronounced in SPMS
Diffusion parameters were significantly altered in NAWM and segmented WM
(temporal, occipital and cingulate WM) of SPMS patients (n = 15), compared to RRMS
patients (data available only for n = 4), and healthy controls (n = 15) in KADEPET-
SPMS group. Fractional anisotropy was significantly reduced (p = 0.02), while radial
diffusivity had a trend to increase (p = 0.06) in NAWM of SPMS patients at baseline
imaging, compared to healthy controls (Figure 12).
Figure 12. DTI parameters alteration in NAWM of SPMS (n =15) and RRMS (n = 4)
patients at baseline imaging in the KADEPET-SPMS cohort compared to HC (n =15).
FA MD
AD RD

Svetlana Bezukladova
33
DTI analysis of segmented NAWM in KADEPET-SPMS group showed significant
abnormalities in temporal, occipital and cingulate WM areas of progressive patients at
baseline imaging, compared to healthy controls (Figure 13).
Fractional anisotropy was significantly decreased in temporal (p = 0.03), occipital and
cingulate WM areas (p = 0.001 and p = 0.004 respectively), whereas significant increase
was seen in occipital (p = 0.054) and cingulate (p = 0.002) WM for mean diffusivity
(MD), in cingulate WM (p = 0.053) for diffusion along the tracts (AD), and in occipital
and cingulate WM regions (p = 0.008 and p = 0.003 respectively) for radial diffusivity.
Figure 13. FA, MD, AD and RD diffusion parameters of SPMS patients (n = 15) of the
KADEPET-SPMS cohort were more abnormal in temporal (TMP), occipital (OCC) and
cingulate (CIN) white matter areas at baseline imaging, compared to healthy controls (n
= 15). FRO = frontal, PAR = parietal, TPM = temporal, OCC = occipital, CIN =
cingulate, DWM = deep white matter.

Svetlana Bezukladova
34
4.2.2 Diffuse abnormalities in segmented NAWM of patients at the age of risk
for progression
DTI analysis in PROMS study showed significant alterations of diffusion in segmented
NAWM, but not in the whole NAWM. Occipital, cingulate and deep WM areas were
the most affected (Figure 14).
Figure 14. Diffusion parameters abnormalities in segmented NAWM of MS patients (n
= 25) in PROMS study compared to healthy controls (n = 15).
All diffusivities (MD/AD/RD) were significantly higher in cingulate (p < 0.05 for
MD/AD and p < 0.01 for RD) and deep WM (p < 0.01), while FA was significantly
decreased in occipital and cingulate WM area (p = 0.012 and p = 0.014 respectively),
compared to HC. Additionally, radial diffusivity showed a higher mean value close to
significance (p = 0.09) in occipital WM, compared to HC.
Similar to PROMS, DTI analysis in KADEPET-RRMS study showed significant
alterations of diffusion in segmented cingulate NAWM of 10 RRMS patients at the

Svetlana Bezukladova
35
baseline imaging, compared to healthy controls, but not in the whole NAWM (Figure
15).
Figure 15. Altered diffusion parameters (FA/MD/RD) in cingulate white matter of
RRMS patients (n = 10) in KADEPET-RRMS substudy at baseline imaging, compared
to healthy controls (n = 15).
Even though the patients in this group are in the earlier disease stage with mean disease
duration of 8.4 ± 3.8 years, the normal appearing cingulate white matter showed
significant structural alterations. Fractional anisotropy was significantly decreased (p =
0.03), while mean and radial diffusivities were increased in cingulate WM (p = 0.057
and p = 0.045 respectively), compared to healthy group.
Additionally, DTI analyses were performed in the whole NAWM and in segmented
NAWM of pooled cohorts, untreated (n = 30), shown in Figure 16, and treated (n = 45),
compared to healthy control group (n = 15).

Svetlana Bezukladova
36
Figure 16. Diffusion parameter abnormalities in segmented NAWM of MS patients in
the pooled untreated MS-cohort (n = 30) compared to healthy controls (n = 15).
No significant differences in diffusion parameters (FA/MD/AD/RD) were found in the
whole NAWM of pooled untreated cohort, compared to HC. In segmented NAWM, FA
was decreased in occipital and cingulate areas (p = 0.02 and p = 0.006 respectively),
MD was increased in cingulate area (p = 0.009), while RD was increased in cingulate
WM (p = 0.01). Additionally, radial diffusivity showed a higher mean value, close to
significance in occipital WM (p = 0.07), compared to HC.
Similarly, to untreated cohort, treated pooled cohort (n = 45) did not show significant
differences in diffusion parameters in the whole NAWM, compared to HC (n = 15),
data not shown. However, in segmented NAWM, FA was significantly decreased in
cingulate WM (p = 0.03) and in occipital WM at the level of p = 0.057, while MD and
mean RD were significantly increased in cingulate WM (p = 0.03 and p = 0.025
respectively).

Svetlana Bezukladova
37
4.2.3 Diffusion tensor imaging in treatment response assessment
Diffusion analysis was performed in the longitudinal KADEPET-RRMS (n =10) study
using fingolimod treatment. As shown in previous section, the diffusion parameters
(FA, MD and RD) were significantly altered in cingulate WM of 10 RRMS subjects in
KADEPET_RRMS study at the baseline imaging, compared to healthy controls. At
follow up imaging after 6 months of fingolimod initiation no significant differences
were anymore found in the cingulate WM of MS patients, compared to HC. In addition,
significant increase in FA (p = 0.02) and decrease in RD (p = 0.04) were found in
cingulate WM at the follow up imaging, compared to baseline among the RRMS
patients. Fractional anisotropy showed a trend to increase in the deep white matter (p =
0.08), while the mean axial diffusivity was slightly, but not significantly, higher in
temporal and deep white matter (p = 0.08 and p = 0.07 respectively) at the follow up
imaging, compared to baseline.
Figure 17. Diffusion parameters change in segmented NAWM of RRMS patients after 6
months fingolimod treatment.

Svetlana Bezukladova
38
TBSS analysis, using TFCE approach and n = 210 random permutations and FWE
correction, showed that 17.8 % of NAWM skeleton voxels of RRMS subjects had
significantly decreased FA (p < 0.05) at baseline imaging, compared to HC (Figure 18
a). This number decreased to 3.15 % of voxels (p < 0.05) after 6 months of fingolimod
treatment, compared to HC (Figure 18 b). TBSS analysis was also performed for
repeated measurements BL - FU, using paired t-test with TFCE approach and n = 1024
random permutations, uncorrected for FWE. Extent of 11.7% voxels, placed mainly in
cingulum, genu and splenium of corpus callosum (CC) showed increased FA (p < 0.05)
at the follow up imaging, compared to the baseline imaging (Figure 18 c).
Figure 18. TBSS analysis shows a significant reduction (p < 0.05, FWE) in voxels
extent with decreased FA after 6 months of fingolimod treatment, compared to HC,
where a) baseline imaging, b) imaging at 6 months. Red arrows show voxels with
significantly decreased FA at follow up imaging, compared to HC. Repeated measures
(image c) show the extent of voxels with significantly increased FA (p < 0.05, FWE
uncorrected) at follow up. The background image is a standard MNI152_T1_1mm
template, the mean FA skeleton is shown in green. a, b: coronal slice is at X = 77,
a)
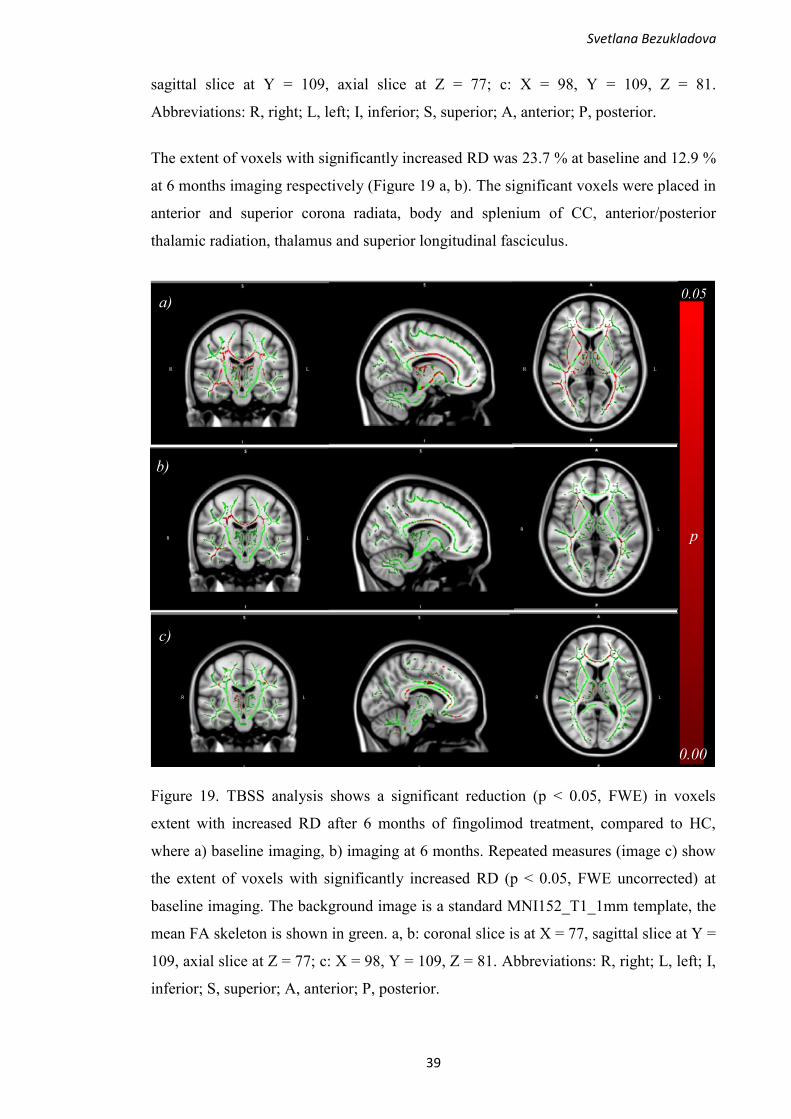
Svetlana Bezukladova
39
sagittal slice at Y = 109, axial slice at Z = 77; c: X = 98, Y = 109, Z = 81.
Abbreviations: R, right; L, left; I, inferior; S, superior; A, anterior; P, posterior.
The extent of voxels with significantly increased RD was 23.7 % at baseline and 12.9 %
at 6 months imaging respectively (Figure 19 a, b). The significant voxels were placed in
anterior and superior corona radiata, body and splenium of CC, anterior/posterior
thalamic radiation, thalamus and superior longitudinal fasciculus.
Figure 19. TBSS analysis shows a significant reduction (p < 0.05, FWE) in voxels
extent with increased RD after 6 months of fingolimod treatment, compared to HC,
where a) baseline imaging, b) imaging at 6 months. Repeated measures (image c) show
the extent of voxels with significantly increased RD (p < 0.05, FWE uncorrected) at
baseline imaging. The background image is a standard MNI152_T1_1mm template, the
mean FA skeleton is shown in green. a, b: coronal slice is at X = 77, sagittal slice at Y =
109, axial slice at Z = 77; c: X = 98, Y = 109, Z = 81. Abbreviations: R, right; L, left; I,
inferior; S, superior; A, anterior; P, posterior.
R L R L
a) 0.05
0.00
R L
R L
b)
c)
R L R L
p

Svetlana Bezukladova
40
The repeated measures between baseline and follow up showed the 7.57 % extent of
voxels with significantly increased RD (p < 0.05, FWE uncorrected) at baseline
imaging, mainly located in cingulum, thalamus, genu and splenium of CC (Figure 19 c).
In addition, extent of voxels with increased MD lowered moderately from 24.6% to
20.7% (p < 0.05, FWE corrected) at baseline and follow up imaging respectively.
Voxels with significantly increased MD, compared to HC were placed in splenium,
genu, body of CC, superior longitudinal fasciculus, anterior and posterior thalamic
radiation, superior corona radiata, corticospinal tract, thalamus, cingulum
(hippocampus) and sagittal stratum (data not shown). Furthermore, axial diffusivity was
increased in 16.8% of voxels (p < 0.05, FWE corrected) at baseline imaging, compared
to healthy subjects. This number slightly increased to 19.1% at follow up imaging (p <
0.05, FWE corrected), with voxels placed in body, genu, splenium of CC, cingulum,
anterior thalamic radiation, superior longitudinal fasciculus, sagittal stratum and all
parts of corona radiata (data not shown).
Diffusion tensor imaging analysis was also performed in KADEPET-SPMS group,
treated with natalizumab (n = 10). Six SPMS and four RRMS patients were imaged at
the baseline and after 1 year of treatment initiation. No statistically significant
differences for all DTI parameters (FA/MD/AD/RD) in the whole NAWM and
segmented NAWM were found.
4.2.4 Lesion load affects DTI
Correlational analyses were performed between FA/MD/AD/RD values in each
segmented WM and normalized lesion burden in corresponding WM region.
Lesion load (visible in T2 MRI sequence) in KADEPET-RRMS substudy was measured
for 10 RRMS patients at baseline, normalized lesion burden was calculated according
the method stated in chapter 3.2.1. Significant correlations between the normalized
lesion burden and DTI parameters in the surrounding NAWM were found in three WM
regions: temporal, cingulate and deep WM (Table 5).
Table 5. Correlations between lesion burden and DTI parameters in WM ROIs of 10
RRMS patients in KADEPET-RRMS group at baseline imaging, (expressed as p-
values, Spearman rho). Statistically significant at the level p < 0.05.

Svetlana Bezukladova
41
Lesion burden in segmented WM of RRMS patients (n = 10) at baseline imaging
DTI parameter
Frontal Parietal Temporal Occipital Cingulate Deep WM
FA p = 0.31
rho = -0.35
p = 0.58
rho = -0.2
p = 0.03
rho = -0.70
p = 0.104
rho = -0.55
p = 0.002
rho = -0.86
p = 0.63
rho = -0.17
MD
p = 0.47
rho = 0.26
p = 0.279
rho = 0.38
p = 0.01
rho = 0.73
p = 0.279
rho = 0.38
p = 0.002
rho = 0.86
p = 0.01
rho = 0.75
AD
p = 0.01
rho = 0.75
p = 0.20
rho = 0.44
p = 0.6
rho = 0.18
p = 0.76
rho = 0.11
p = 0.29
rho = 0.37
p = 0.049
rho = 0.65
RD
p = 0.22
rho = 0.42
p = 0.24
rho = 0.41
p = 0.01
rho = 0.77
p = 0.16
rho = 0.48
p = 0.004
rho = 0.84
p = 0.01
rho = 0.75
T2 lesion load in KADEPET-SPMS substudy was measured at baseline imaging for 15
SPMS patients. Normalized lesion burden was correlated to corresponding DTI
parameters in segmented WM regions. DTI parameters in the NAWM of all segmented
WM regions showed association to lesion burden in the corresponding WM segments
(Table 6).
Table 6. Correlations between lesion burden and DTI parameters in WM ROIs of SPMS
patients (n = 15) in KADEPET-SPMS group at baseline imaging, (expressed as p-
values, Spearman rho). Statistically significant at the level p < 0.05.
Lesion burden in segmented WM of SPMS patients (n=15) at baseline imaging
DTI parameter
Frontal Parietal Temporal Occipital Cingulate Deep WM
FA p = 0.004
rho = -0.7
p = 0.004
rho = -0.71
p = 0.0005
rho = -0.8
p = 0.001
rho = -0.76
p < 2.2 e-16
rho = -0.88
p = 0.01
rho = -0.65
MD
p = 0.0095
rho = 0.78
p = 0.052
rho = 0.51
p = 0.003
rho = 0.72
p = 0.004
rho = 0.70
p = 0.001
rho = 0.77
p = 0.0006
rho = 0.79
AD
p = 0.0001
rho = 0.83
p = 0.11
rho = 0.43
p = 0.052
rho = 0.51
p = 0.25
rho = 0.32
p = 0.10
rho = 0.44
p = 0.037
rho = 0.54
RD
p = 0.0005
rho = 0.78
p = 0.02
rho = 0.6
p = 0.002
rho = 0.72
p = 0.0005
rho = 0.78
p = 0.0002
rho = 0.82
p = 0.0006
rho = 0.79

Svetlana Bezukladova
42
PROMS study also showed significant correlations between lesion burden in each of the
segmented WM and NAWM diffusion parameters (Table 7).
Table 7. Correlations between lesion burden and DTI parameters in WM ROIs in
PROMS group (n = 25) at baseline imaging, (expressed as p-values, Spearman rho).
Statistically significant at the level p < 0.05.
Lesion burden in segmented WM of RRMS patients, close to progression (n=25)
DTI parameter
Frontal Parietal Temporal Occipital Cingulate Deep WM
FA p = 0.12
rho = -0.31
p = 0.06
rho = -0.37
p = 0.002
rho = -0.59
p = 0.02
rho = -0.45
p = 0.003
rho = -0.56
p = 0.01
rho = -0.48
MD
p = 0.01
rho = 0.46
p = 0.045
rho = 0.40
p = 0.002
rho = 0.58
p = 0.07
rho = 0.36
p = 0.003
rho = 0.56
p = 0.003
rho = 0.56
AD
p = 0.02
rho = 0.45
p = 0.048
rho = 0.40
p = 0.004
rho = 0.56
p = 0.11
rho = 0.33
p = 0.003
rho = 0.57
p = 0.003
rho = 0.57
RD
p = 0.03
rho = 0.42
p = 0.026
rho = 0.44
p = 0.001
rho = 0.61
p = 0.04
rho = 0.41
p = 0.006
rho = 0.53
p = 0.006
rho = 0.53
4.3 PET/DTI correlational analyses
Correlational analyses of DTI parameters to TSPO radioligand binding were performed
to evaluate structural and molecular brain changes and their relation to clinical disability
in MS, using combined in vivo magnetic resonance (MR) and PET imaging in MS
patients compared to healthy controls (HC).
4.3.1 Decreased tract integrity and increased microglial activation in NAWM is
associated with disability
Correlational analyses of DTI parameters in NAWM to disability status, evaluated with
EDSS, were done for the pooled cohort from three study groups (n = 55). The analysis
showed association of decreased WM integrity to disability, more pronounced in SPMS
patients (Figure 20).

Svetlana Bezukladova
43
Figure 20. Correlation of diffusion parameters to disability in MS patients (n = 55). The
correlations are visualized with linear regression lines and Spearman’s rho.
Corresponding Pearson coefficients are R = - 0.44 (p = 0.0007) for FA, R = 0.38 (p =
0.004) for MD, R = 0.28 (p = 0.03) for AD, R = 0.41 (p = 0.0002) for RD, statistically
significant at the level of p < 0.05.
TSPO radioligand binding in NAWM was measured for 55 MS patients, with
correlational analysis to evaluated with EDSS physical impairment. As a result,
increased microglial activation in NAWM associated with higher clinical disability
status in MS (Figure 21).
r = 0.29
p = 0.03 r = 0.51
p = 8.07e-05
r = 0.46
p =0.0003
r = -0.51
p = 8.84e-05

Svetlana Bezukladova
44
Figure 21. Correlation of TSPO radioligand binding in NAWM, expressed as DVR, to
disability status scale of 55 MS patients. The correlation is visualized with linear
regression line and Spearman’s rho. Corresponding Pearson correlation is 0.36 (p =
0.007), statistically significant at the level of p < 0.01.
4.3.2 Increased microglial activation in NAWM is associated with structural
white matter changes
Based on results from the previous section it was of interest to investigate the relation
between the microglial activation and white matter integrity in MS patients. DTI
analysis and TSPO-PET binding evaluation was performed in NAWM and segmented
NAWM of 55 MS patients. Patients from KADEPET-RRMS and KADEPET-SPMS
were included for the analysis at baseline imaging in absence of any treatment, while
patients from PROMS study had different treatment at the baseline imaging.
Correlational analyses showed an association between microglial activation and
structural abnormalities in NAWM of 55 MS patients (Figure 22). The correlational
analyses were also performed in segmented NAWM (data not shown). The associations
were found between all diffusion parameters (decreased FA and increased MD/AD/RD)
and increased microglial activation in temporal WM (p < 0.01 for all Spearman
correlations), and between decreased FA and increased TSPO-binding in deep WM (p =
0.017, Spearman’s rho = - 0.32).
r = 0.37
p = 0.005

Svetlana Bezukladova
45
Figure 22. Reduced WM tract integrity is associated with increased TSPO binding in
NAWM of 55 MS patients. TSPO radioligand binding expressed as DVR. The
correlations are visualized with linear regression lines and Spearman’s rho.
Corresponding Pearson coefficients are R = - 0.36 (p = 0.007) for FA, R = 0.38 (p =
0.004) for MD, R = 0.34 (p = 0.01) for AD, R = 0.39 (p = 0.002) for RD, statistically
significant at the level of p < 0.05.
r = -0.3
p = 0.029
r = 0.32
p = 0.01
r = 0.28
p = 0.03
r = 0.34
p = 0.01

Svetlana Bezukladova
46
The correlational analyses between DTI parameters and TSPO binding in segmented
NAWM were also performed separately for groups with treatment at imaging (n = 45)
and without treatment (n = 30). Correlational analyses between FA and TSPO binding
in both treated and untreated pooled cohorts are shown in Figures 23, 25.
Figure 23. Increased microglial activation is associated with decreased fractional
anisotropy in temporal (TMP) and deep WM (dWM) regions in MS patients without
treatment at imaging (n = 30). The correlations are visualized with linear regression
lines and Spearman’s rho. Corresponding Pearson coefficients are R = - 0.33 (p = 0.07)
for temporal WM, R = - 0.32 (p = 0.08) for deep WM.
Additionally, associations between increased mean and radial diffusivities and increased
microglial activation were found in temporal WM in non-treated pooled cohort (p =
0.058, Spearman’s rho = 0.35 for MD; p = 0.039, Spearman’s rho = 0.38 for RD), data
not shown.
SPMS patients (n = 15) showed higher microglial activation in four segmented WM
regions: frontal, parietal, temporal and cingulate, compared to RRMS patients (n = 15),
Figure 24.
r = - 0.37
p = 0.04
r = - 0.35
p = 0.06

Svetlana Bezukladova
47
Figure 24. TSPO-binding increased in frontal, parietal, temporal and cingulate WM
regions in SPMS (n = 15), compared to RRMS patients (n = 15) in pooled untreated
cohort. Boxplots visualized with median values and Wilcoxon rank sum test,
statistically significant at the level of p < 0.05.
The correlational analyses for patients with treatment at imaging showed significant
negative correlation between FA and TSPO binding in parietal (PAR), temporal (TMP),
occipital (OCC) and deep (dWM) WM regions (Figure 25).
In addition, positive correlations were found between increased MD/RD and TSPO
binding in temporal and occipital WM regions in pooled cohort with treatment at
imaging (data not shown). For mean diffusivity associations were found in temporal
WM, (p = 0.049, r = 0.29), and in deep WM (p = 0.052, r = 0.29). Similarly, positive
correlations were found for radial diffusivity in temporal and deep WM (p = 0.052, r =
0.29 and p = 0.037, r = 0.31 respectively). Correlations are expressed as p-values,
Spearman rho and statistically significant at the level p < 0.05.

Svetlana Bezukladova
48
Figure 25. Increased microglial activation is associated with decreased fractional
anisotropy in parietal, temporal, occipital and deep WM regions in MS patients with
treatment at imaging (n = 45). The correlations are visualized with linear regression
lines and Spearman’s rho. Corresponding Pearson coefficients are R = - 0.27 (p = 0.07)
for parietal WM, R = - 0.37 (p = 0.01) for temporal WM, R = - 0.33 (p = 0.02) for
occipital WM and R = - 0.3 (p = 0.05) for deep WM.
4.3.3 Voxel-wise image analysis of PET/DTI data
Correlational groupwise analysis between FA values and TSPO binding in NAWM was
performed at voxel level with FDR correction for multiple comparisons for pooled data
of MS cohort (n = 54), one patient was excluded due to DTI data artifacts (Figure 26).
The voxel wise analysis showed wide spread focal areas of white matter, where
decreased FA correlated significantly with increased TSPO binding as a sign of
increased microglial activity. However, it was not feasible to perform corresponding
correlational analyses among healthy controls for comparison due to low number of
subjects in the control group (n =15).
r = - 0.32
p = 0.03
r = - 0.3
p = 0.039
r = - 0.3
p = 0.04
r = - 0.29
p = 0.04

Svetlana Bezukladova
49
Figure 26. Decreased fractional anisotropy is associated with increased microglial
activation in NAWM of pooled MS cohort (n = 54). Correlational voxel-wise analysis
FDR corrected for multiple comparisons. Significant clusters were found within
superior longitudinal fasciculus, corticospinal tract, cingulate gyrus, corona radiata and
forceps minor, and also within thalamic radiation and thalamus, L = left, R = right.
L R
r

Svetlana Bezukladova
50
5 DISCUSSION
5.1 Summary of the main findings
This study evaluated structural and molecular brain changes using combined MR and
PET in vivo imaging techniques in 55 MS patients with both RRMS (n = 40) and SPMS
(n = 15) disease types, compared to 15 healthy controls. Altered DTI parameters
(decreased FA and increased MD, AD, RD) in NAWM and segmented NAWM
(temporal, occipital, cingulate WM), with the most affected region being cingulate
white matter, indicate on microstructural damage without visible changes in
conventional MRI. Microstructural changes were more pronounced in SPMS than in
RRMS patients. White matter disintegrity was also found in segmented WM (occipital,
cingulate and deep WM) of patients at the age of risk for progression of the disease.
It was also investigated, whether the lesion load affects diffusion in regional NAWM.
The cohort of SPMS patients showed the highest lesion burden with significant
correlations to altered DTI parameters in all segmented WM regions. Lesion load extent
was smaller in patients from PROMS study, compared to SPMS patients. RRMS
patients, that are in the earlier disease stage (KADEPET-RRMS study), had the smallest
lesion load extent.
Additionally, DTI showed a sensitivity to detect microstructural changes and change in
diffusion within tracts after treatment initiation. The acquired diffusion parameters
suggest structural improvement (increase in mean FA and decrease in mean RD values)
in cingulate WM after 6 months of fingolimod treatment. TBSS voxel-wise analysis
results also indicated on improvement of microstructural integrity after 6 months of
Fingolimod treatment.
PET/DTI correlational analyses showed an association between decreased tract integrity
and increased microglial activation in NAWM, which also associated with clinical
disability.

Svetlana Bezukladova
51
5.2 Methodological considerations and data interpretation
The main methodological consideration for DTI analysis is in MRI sequence design,
that ought to be suitable for each individual project. The MR imaging should be
performed on same MRI scanner with identical protocol, with design optimization and
MR imaging time does not exceed 1 hour. Short acquisition time helps to reduce
possible head motion artifacts and contributes to patient’s comfort. To reduce the scan
and readout time, EPI and SENSE approaches can be utilized. The good compromise
between acquisition time and image quality is DTI sequence with 30 - 64 gradients
(Jones, 2004) and one b = 0 image acquired for each 5-10 high b-images (e.g.
1000s/mm2). The spatial resolution is also important for DTI image quality, therefore 2-
2.5 mm isotropic voxels are recommended (Soares et al., 2013).
Quality control and data preprocessing are another important steps in DTI analysis.
Eddy current induced distortions and EPI susceptibility distortions, together with
motion artefacts, signal dropouts and geometric deformations are potential artefacts in
acquired DWI images. Thus, raw data have to be examined for potential artefacts and
exclude the corrupted data or problematic gradients prior to tensor estimation. Several
approaches e.g. Explore DTI RESTORE, or 3D Slicer software can be used for outliers’
detection.
Diffusion tensor imaging showed sensitivity to detect microstructural changes in white
matter of MS patients, appearing normal on conventional MRI. This methodology has
been utilized in several MS studies (Kim et al., 2017; Roosendaal et al., 2009; Onu et
al., 2012; Harrison et al., 2013; Ontaneda et al., 2017). DTI is an advantageous MRI
technique: it can be a part of MRI imaging protocol, widely utilized in clinical routine,
it is a non-radiative and safe imaging modality. Despite all positive aspects, DTI is
rather an approximate technique, therefore the analysis results have to be interpreted
carefully. DW-MRI measurements reflect the amount of water molecules diffusion
within white matter tracts, that might be hindered by cell membrane, myelin sheath and
cell cytoskeleton. The detection of water molecules movement is averaged over the
voxel and restricted to movement along the axis of the applied gradient, therefore the
interpretation of change in signal by tensor-derived measures can be ambiguous. It is
known that water molecules movement along the main fiber orientation is reflected by
axial diffusivity and represented by the principal eigenvalue of the tensor. Similarly,
radial diffusivity describes the movement perpendicular to the fiber. The relation

Svetlana Bezukladova
52
between these two measures can be expressed as fractional anisotropy, therefore change
in one of them e.g. decrease in myelination, that lead to increase in RD, should also
reflect the change in FA (decrease in anisotropy in that case). All four parameters of the
tensor are related to each other; therefore, it is inaccurate to draw conclusions about
microstructural changes based only on one parameter change. All four tensor-derived
parameters (FA/MD/AD/RD) should be used for precise interpretation of fiber
microstructural architecture. Yet the complex axonal organization e.g. crossing fibers,
fiber diameter and density might complicate the explication of DTI-derived metrics
(Jones et al., 2013).
One of the diffusion tensor model drawbacks is in Gaussian assumption of anisotropic
diffusion, that do not consider diffusion’s directional dependence and axonal
compartmentalization. To overcome the limitations of this model, other robust
approaches have been proposed: high angular resolution diffusion imaging (HARDI),
including diffusion kurtosis imaging (DKI) (Steven et al., 2014) and Q-ball imaging
(Tuch, 2004), or previously mentioned NODDI and CHARMED models. These
advanced DTI methods might improve the output of informative DTI metrics, precisely
reflecting changes in axonal microstructure and underlying processes.
Methodological consideration of TBSS analysis is in failure of family-wise error
correction for repeated measures. Direct comparison between baseline and follow up for
all DTI parameters did not survive family-wise error correction for multiple
comparisons. By applying a stringent p-value < 0.001, as recommended by (Woo et al.,
2014), almost all significant voxels (p < 0.05, FWE uncorrected) were lost.
Consequently, the repeated measures results obtained by TBSS have to be interpreted
carefully.
Another main consideration of this study is in pooled cohort, included both 35 patients
in absence of immunomodulatory treatment at the time of imaging (KADEPET-RRMS,
n = 10, KADEPET-SPMS, n = 20, PROMS, n = 5) and also 20 patients who were on
various DMTs (PROMS substudy). Because the patients from PROMS study are in the
risk to SPMS conversion, disease modifying treatment at that stage of the disease can
only suppress inflammatory cells migration into CNS, and reduce annualized relapse
late, but likely not be able to significantly influence on WM structural integrity.
Currently only three longitudinal studies, investigating fingolimod and natalizumab
treatment effect on white matter structural changes with DTI analysis approach have

Svetlana Bezukladova
53
been published (Wiebenga et al., 2016; Senda et al., 2016; Gurevich et al., 2018). Since
this study was a retrospectively performed pooling of existing data from different
substudies with both DTI and TSPO imaging, carried out over the years, therefore the
imaging data was a little heterogenous in DTI sequences (i.e. 33 gradient directions in
KADEPET-SPMS study, compared to 64 gradient directions in other studies).
However, the study by Lebel et al., 2012 did not observe statistically significant
differences in FA and MD diffusion parameters in DTI data, performed with 30 and 60
gradient directions protocols. Unfortunately, it was not possible to make the study
design beforehand, but this aspect would be taken into consideration for the future
projects.
In addition, the main methodological consideration of TSPO-PET imaging is the
inability to distinguish between M1 and M2 activated microglia phenotypes. Together
with microglia, TSPO can be expressed by activated astrocytes and infiltrating
mononuclear phagocytes. As an alternative to TSPO targeting radioligands, imaging
with novel [11C]SMW139 radioligand targeting P2X7 receptor, expressed by pro-
inflammatory M1-type microglia, has been proposed (Janssen et al., 2018).
5.3 DTI in Multiple Sclerosis
The hypothesis on MS evolution states that progression results from chronic
inflammation trapped within CNS, associated with spread demyelination and axonal
injury, as a consequence of mitochondrial dysfunction, chronic microglial activation,
extensive production of ROS and iron accumulation (Lassmann, 2018). Inflammation is
seen in all stages of the disease in chronic active MS lesions and adjacent areas e.g.
normal appearing white matter, with correlation between inflammation and axonal
injury (Frischer et al., 2009). Therefore, it is of importance to reveal diffuse
neuroinflammation and associated axonal damage in MS prior its progression phase.
The technical ability of detecting hidden white matter changes will contribute to
appropriate treatment planning and eventual prediction of disease progression.
Diffusion tensor imaging has been implemented in several MS studies, including in vivo
(Natarajan et al., 2013; Harrison et al., 2011; Rashid et al., 2008; Rissanen et al., 2018;
Harrison et al., 2013; Scanderbeg et al., 2000; Onu et al., 2012; Werring et al., 2001;
Kim et al., 2017; Klistorner et al., 2015; Olsson et al., 2016; Ge et al., 2004), post
mortem (Moll et al., 2011; Seewann et al., 2009) and longitudinal treatment studies

Svetlana Bezukladova
54
(Ontaneda et al., 2017; Fox et al., 2011; Wiebenga et al., 2016; Gurevich et al., 2018). It
has been shown that MS patients have reduced FA in white matter appearing normal on
cMRI, and increased radial diffusivity in the same regions (Roosendaal et al., 2009;
Ciccarelli et al., 2001). Findings of these studies suggest structural WM damage and
demyelination in several WM regions, including corpus callosum, inferior longitudinal
fasciculus, left corona radiata and optic radiation, with relation to disability and
cognitive impairment. This study agrees with previously reported findings, with TBSS
analysis identified white matter damage (decreased FA and increased RD) in identical
brain regions of MS patients.
Increased averaged water diffusion coefficient has been found in secondary-progressive
lesions, compared to lesions in RRMS phase in study by Scanderbeg et al., 2000, that
correlated with EDSS and disease duration. Additionally, increased ADC was found in
lesions and perilesional NAWM in study by Werring, 2000, therefore supporting the
hypothesis of lesions cause structural damage to adjacent normal appearing white
matter. Similarly, this study showed an association between lesion load and DTI
parameters alteration (increased diffusivities and decreased fractional anisotropy), that
may potentially explain that lesions can produce damage and axonal disintegration to
contralateral NAWM regions, that agrees with previously published literature.
Two previously published studies, involving 1 year fingolimod and natalizumab
longitudinal treatment (Gurevich et al., 2018; Wiebenga et al., 2016), showed a
sensitivity of DTI analysis to detect improvement in tracts’ microstructural integrity.
Similarly, diffusion tensor imaging analysis implemented in this study demonstrated an
ability to detect the changes in diffusion within tracts after 6 months Fingolimod
treatment. Despite the complexity in interpretation of TBSS repeated measures analysis,
results obtained by quantitative ROI analyses and voxel-wise analysis with comparison
to HC may indicate on improvement in microstructural white matter integrity in RRMS
patients after 6 months of fingolimod treatment with concomitantly unchanged cMRI
parameters. This indicates, that DTI could be used as a sensitive imaging biomarker in
longitudinal studies to evaluate treatment response in NAWM of MS patients in vivo.
In addition, DTI analysis showed sensitivity in detection of white matter structural
alterations in progressive MS patients and in patients with risk of progression, therefore
it can be used as a sensitive tool in predicting disease progression.

Svetlana Bezukladova
55
5.3.1 Cingulum bundle and WM structural alteration
DTI analysis in each study group showed significant change in DTI parameters in
cingulate WM region. The cingulum bundle situated in the brain midline, on the
peripheral surface of the CC and runs from the frontal lobe around the rostrum and genu
of the corpus callosum, envelops ventrally around the splenium, continuing to the
parahippocampal gyrus (Figure 27).
Figure 27. Tractography of the right cingulum bundle, sagittal view.
However, the parcellation method used was not very precise anatomically, as it assigned
the rostral part of the corpus callosum, including rostrum, genu, splenium and isthmus
of CC (Figure 28, white arrow) to cingulate WM area (Figure 28, shown in green).
Sagittal Coronal Axial

Svetlana Bezukladova
56
Figure 28. WM segmentation: frontal WM (yellow), parietal WM (blue), temporal WM
(red), occipital WM (dark blue), cingulate WM (green), deep WM (purple).
Therefore, when interpreting mean values change in cingulate WM, we might have to
consider that this area partially includes CC. It is important to note, TBSS analysis
showed most of the voxels with significantly altered DTI metrics placed in callosal area.
Another reason of cingulate WM being the most affected is the high lesion burden
within and around corpus callosum and adjacent to it periventricular area. The majority
of the lesions in pooled MS patients’ cohort located in the deep WM area (Figure 28,
shown in purple), including the lateral part of the corpus callosum (Figure 28, white
arrow) and periventricular area. Several studies showed correlation between regional
lesion load and DTI metrics of the corresponding regions in corpus callosum (Simon et
al., 2000; Ciccarelli et al., 2003). The propagation of structural changes can be
potentially explained by fiber connectivity and spreading of smouldering plaques with
activated microglia along the tracts. Callosal fibers connect frontal, parietal and
occipital cerebral lobes, while cingulum bundle has connections with frontal, parietal
and medial temporal lobe, including anterior and lateral dorsal thalamic nuclei (Bubb et
al., 2018). The evidence of MS pathology involvement in the limbic system, that
include the cingulum bundle, and high frequency of lesions throughout the limbic tracts
has been reported previously (Sahin et al., 2016). It supports the hypothesis that focal
lesions can cause the transection of axons and lead to Wallerian degeneration, resulting
in axonal injury and loss in CC and adjacent WM areas.
Additionally, few studies demonstrated thalamic involvement in MS, with evidence of
FA reduction in thalamus (Mesaros et al., 2011; Deppe et al., 2016) that may predict
disease evolution and may contribute to cognitive decline and disability in MS. The
common hypothesis is that focal lesions in thalamocortical projections can damage
surrounding WM, therefore leading to thalamus atrophy and neuronal loss (Minagar et
al., 2013; Vercellino et al., 2009). Results of the voxel-wise correlational analysis in this
study demonstrated DTI pathology (reduced FA) in thalami and thalamic radiation of 55
MS patients, associated with increased microglial activation, and therefore support the
results in previously published literature on thalamic involvement in MS.
In chapters 4.2.1- 4.2.2 we can follow the disease evolution in the different substudies,
starting from the KADEPET-RRMS study patients with average disease duration of 8

Svetlana Bezukladova
57
years, who have been detected with structural changes in cingulate WM and callosal
area, whereas RRMS patients with more advanced disease from PROMS substudy with
mean disease duration of 13.6 years showed structural alterations in three WM regions:
deep, cingulate and occipital WM. SPMS patients from KADEPET-SPMS study with
mean time from disease onset of 15 years showed significantly decreased white matter
integrity in the whole NAWM and in segmented temporal, occipital, and cingulate WM,
compared to healthy controls. As expected, the lesion load in RRMS patients was
smaller, than in patients at progressive stage of the disease. It has been speculated,
whether the spread diffuse WM pathology, appearing normal in conventional MRI,
associates with increased lesion load (Werring, 2000; Vrenken et al., 2006). The
acquired results may indicate on relation between lesions extent and degree of
widespread diffuse pathology, that in turn disrupt the diffusion within white matter
tracts. Results in chapter 4.2.4 corroborate the hypothesis of influence of distant lesions
to cause Wallerian degeneration and contribute to microstructural changes throughout
MS evolution (Ciccarelli et al., 2003; Klistorner et al., 2015).
5.4 Increased microglial activation and axonal disintegrity in NAWM as
a disease predictor
Previous study from our research group showed correlation between increased
[11C]PK11195 binding and reduced FA in NAWM and in the perilesional area of
gadolinium-negative black holes of MS cohort included 9 SPMS and 10 RRMS patients
(Rissanen, 2015). This study showed positive correlation between increased microglial
activation and reduced FA in non-lesional WM, and negative correlations between high
TSPO-binding and increased diffusivities in NAWM of MS cohort, included 40 RRMS
and 15 SPMS subjects. This finding supports the hypothesis of association between
chronic microglial activation and diffuse axonal inflammation and damage of brain
white matter, appearing normal on cMRI.
In 4.3.2 the correlational analyses showed association between increased microglial
activation and decreased FA in segmented NAWM in pooled cohorts with and without
treatment at imaging. Analysis in the treated group showed four WM regions with
significant negative correlations between FA and NAWM DVR, that can be explained
by the bigger group size (n = 45), compared to the size of untreated group (n = 30).
Moreover, there was only 6 SPMS patients in the first group, therefore less variability in

Svetlana Bezukladova
58
FA and DVR values, compared to quite heterogenous FA/DVR values in untreated
group, included 15 SPMS patients.
Several studies, performed with in vivo TSPO-PET imaging, have revealed significantly
increased TSPO uptake in NAWM of SPMS patients, compared to HC. RRMS patients
have demonstrated moderate TSPO radioligand binding, compared to patients who are
in progressive disease stage (Rissanen et al., 2014; Debruyne et al., 2003; Giannetti et
al., 2015). TSPO-binding was significantly increased (results are shown in chapter
4.3.2) in segmented NAWM of SPMS patients (n = 15), compared to RRMS patients (n
= 15), that supports the hypothesis of widespread microglial activation in NAWM
during progressive MS phase, and agrees with the previously published literature.
Additionally, TSPO-PET imaging has been proposed as a prognostic marker for MS
progression, with several studies demonstrated an association between high TSPO-
uptake and faster disease progression, brain atrophy and disability (Rissanen et al.,
2018; Politis et al., 2012; reviewed in Airas et al., 2018). Similarly, this study found the
correlation between microglial activation and axonal disintegrity in NAWM of MS
patients, with association to disability. This finding supports the potential of PET
imaging to visualize hidden neuroinflammation in MS patients in vivo to monitor
disease progression.
5.5 Combination of complementary techniques in MS imaging
To my best knowledge, this is the first study evaluating diffuse structural and biological
(or pathological) changes in MS, utilizing DTI and PET complimentary imaging
modalities, and performed in a large pooled cohort (n = 55) with comparison to healthy
subjects (n = 15).
Multimodal brain imaging from the same individual has recently become a prospective
candidate in the neuroimaging field, and certainly has a great potential in the future.
Combination of complementary neuroimaging modalities allows a comprehensive
examination of brain structure and its function in vivo. Application of DTI and PET
imaging modalities for imaging of hidden neuroinflammation has revealed new insights
on the complexity of the MS disease.
The consolidation of advanced multimodal imaging techniques and increasing
understanding of the MS mechanism allows to follow-up thoroughly the disease

Svetlana Bezukladova
59
evolution and outcome of treatment methods, as well as to discover novel therapeutic
targets and imaging probes. In addition to PET molecular probes targeting
mitochondrial translocator protein for detection and monitoring of microglial and
astrocyte activation, novel PET imaging probes targeting myelin, nitric oxide synthase
(iNOS), cannabinoid (CB2), adenosine 2A and P2X7 receptors have been proposed
(reviewed in Högel et al., 2018). As an additional example of novel molecular probe,
detection of excessive iron accumulation in MS brain tissue, as a direct sign of
neurodegeneration is possible with application of MRI and quantitative susceptibility
mapping (Stüber et al., 2016), while biomarkers associated with neuroinflammation,
neurofilament light (Nfl) and glial fibrillary acidic protein (GFAP) can be detected in
blood serum of MS patients using the single molecule array (Simoa) technology
(Housley et al., 2015). Novel drug validation tool as a “disease-in-a-dish” using iPSC
(induced pluripotent stem cells) of MS patients will contribute to development of
personalised medicine therapeutic approach (Sayed et al., 2016). By accelerating the
neuroimaging solutions and application of multimodal imaging probes, researchers can
find a full concept of brain in disease and pave the path to effective MS treatment.
6 CONCLUSIONS
This study provides data on associations of DTI findings and measurement of microglia
activation in the NAWM of MS patients, and their dependence on the disease subtype.
These results help to gain access to further investigations of WM diffuse pathological
patterns revealing more accurate MS pathogenesis. It was evaluated whether diffusion
tensor imaging can be an extension to conventional MRI protocol in assessing MS
disease activity, applied in combination with TSPO PET imaging.
Future implementations of the study might be beneficial in revealing associations
between fiber connectivity and the spreading of smoldering lesions with activated
microglia. Combination of complimentary techniques such as DTI and PET imaging
might be used as a tool for predicting disease progression in MS patients.

Svetlana Bezukladova
60
7 ACKNOLEDGMENTS
This study was conducted in Turku PET Centre under the mentorship of Professor Dr.
Laura Airas and Dr. Eero Rissanen. I would like to express my deepest gratitude to my
supervisors for giving the opportunity to join the research group, for giving motivation
and encouragement throughout the last year. Without their patient guidance, valuable
support and assistance in keeping my progress on schedule it would not be possible to
conduct this project.
I would like to thank my group members: Jouni Tuisku for providing the scripts, giving
advices and helping with voxelwise analysis, and Markus Matilainen, who kindly
assisted me with the statistical analysis. I would like also to mention other colleagues
and thank Anna Vuorimaa, Marjo Nylund, Susanne Vainio, Heidi Högel, Imran
Waggan, Eero Polvinen, Marcus Sucksdorff and Francisco Lopez Picon, with whom I
have had a great pleasure to work and share a company at ECTRIMS congress in Berlin
and other events outside Turku PET Centre.
I wish to acknowledge a friendship that began in Turku, and to say thanks to my friend
Ciaran for helping not letting me give up, for all laughs and adventures we had.
I am also thankful to my best friends - Julia and Marina, who were always believing in
me and encouraging to follow my dreams. I am forever thankful to Enzo for all love and
support, positive mood, messages and phone calls, and for always being with me “in my
pocket”, when we were separated by 2500 km distance.
Finally, I wish to thank my parents –Vladimir and Svetlana, who have always been an
example of greatest love for me. I dedicate this thesis to my mother who left us
11.09.2004 after a long battle with MS.
Svetlana Bezukladova
September 2018, Turku

Svetlana Bezukladova
61
8 REFERENCES
Airas, L., M. Nylund, and E. Rissanen. 2018. Evaluation of microglial activation in multiple
sclerosis patients using positron emission tomography. Front. Neurol. 9:1–10.
doi:10.3389/fneur.2018.00181.
Alexander, A.L., J.E. Lee, M. Lazar, and A.S. Field. 2007. Diffusion tensor imaging of the
brain. Neurotherapeutics. 4:316–29. doi:10.1016/j.nurt.2007.05.011.
Amit, B., F. Lama, F. Boli, D.P. J., R. Aja, G. Christine, C.P. A., W. Emmanuelle, H.S. L., Z.
Jiameng, and S.C. H. 2010. Abnormal B‐cell cytokine responses a trigger of T‐cell–
mediated disease in MS? Ann. Neurol. 67:452–461. doi:10.1002/ana.21939.
Assaf, Y., and P.J. Basser. 2005. Composite hindered and restricted model of diffusion
(CHARMED) MR imaging of the human brain. Neuroimage. 27:48–58.
doi:10.1016/j.neuroimage.2005.03.042.
Baecher-Allan, C., B.J. Kaskow, and H.L. Weiner. 2018. Multiple Sclerosis: Mechanisms and
Immunotherapy. Neuron. 97:742–768. doi:10.1016/j.neuron.2018.01.021.
Banati, R.B. 2002. Visualising microglial activation in vivo. Glia. 40:206–217.
doi:10.1002/glia.10144.
Baranzini, S.E., and J.R. Oksenberg. 2017. The Genetics of Multiple Sclerosis: From 0 to 200 in
50 Years. Trends Genet. 33:960–970. doi:10.1016/j.tig.2017.09.004.
Barbara, S., R. Barbara, M. Roberta, S. Egidio, and A. Francesca. 2006. Detection of Ectopic B‐cell Follicles with Germinal Centers in the Meninges of Patients with Secondary
Progressive Multiple Sclerosis. Brain Pathol. 14:164–174. doi:10.1111/j.1750-
3639.2004.tb00049.x.
Bergamaschi, R. 2007. Prognostic Factors in Multiple Sclerosis. Int. Rev. Neurobiol. 79:423–
447. doi:10.1016/S0074-7742(07)79019-0.
Le Bihan, D., J.F. Mangin, C. Poupon, C. a Clark, S. Pappata, N. Molko, and H. Chabriat. 2001.
Diffusion tensor imaging: concepts and applications. J. Magn. Reson. Imaging. 13:534–46.
doi:10.1002/jmri.1076.
Bloomgren, G., S. Richman, C. Hotermans, M. Subramanyam, S. Goelz, A. Natarajan, S. Lee,
T. Plavina, J. V. Scanlon, A. Sandrock, and C. Bozic. 2012. Risk of Natalizumab-
Associated Progressive Multifocal Leukoencephalopathy. N. Engl. J. Med. 366:1870–
1880. doi:10.1056/NEJMoa1107829.
Boche, D., V.H. Perry, and J.A.R. Nicoll. 2013. Review: Activation patterns of microglia and
their identification in the human brain. Neuropathol. Appl. Neurobiol. 39:3–18.
doi:10.1111/nan.12011.
Bogie, J.F.J., P. Stinissen, and J.J.A. Hendriks. 2014. Macrophage subsets and microglia in
multiple sclerosis. Acta Neuropathol. 128:191–213. doi:10.1007/s00401-014-1310-2.
Browne, P., D. Chandraratna, C. Angood, H. Tremlett, C. Baker, B. V. Taylor, and A.J.
Thompson. 2014. Atlas of multiple sclerosis 2013: A growing global problem with
widespread inequity. Neurology. 83:1022–1024. doi:10.1212/WNL.0000000000000768.
Bubb, E.J., C. Metzler-baddeley, and J.P. Aggleton. 2018. The cingulum bundle : Anatomy ,

Svetlana Bezukladova
62
function , and dysfunction. Neurosci. Biobehav. Rev. 92:104–127.
Cadavid, D., S. Jurgensen, and S. Lee. 2013. Impact of Natalizumab on Ambulatory
Improvement in Secondary Progressive and Disabled Relapsing-Remitting Multiple
Sclerosis. PLoS One. 8. doi:10.1371/journal.pone.0053297.
Castriota-Scanderbeg, A., F. Fasano, G. Hagberg, U. Nocentini, M. Filippi, and C. Caltagirone.
2003. Coefficient Dav is more sensitive than fractional anisotropy in monitoring
progression of irreversible tissue damage in focal nonactive multiple sclerosis lesions. Am.
J. Neuroradiol. 24:663–670.
Cerami, C., L. Iaccarino, and D. Perani. 2017. Molecular imaging of neuroinflammation in
neurodegenerative dementias: The role of in vivo PET imaging. Int. J. Mol. Sci. 18.
doi:10.3390/ijms18050993.
Chang, L.C., D.K. Jones, and C. Pierpaoli. 2005. RESTORE: Robust estimation of tensors by
outlier rejection. Magn. Reson. Med. 53:1088–1095. doi:10.1002/mrm.20426.
Chen, M.-K., and T.R. Guilarte. 2006. Imaging the Peripheral Benzodiazepine Receptor
Response in Central Nervous System Demyelination and Remyelination. Toxicol. Sci.
91:532–539. doi:10.1093/toxsci/kfj172.
Chun, J., and H.P. Hartung. 2010. Mechanism of action of oral fingolimod (FTY720) in
multiple sclerosis. Clin. Neuropharmacol. 33:91–101.
doi:10.1097/WNF.0b013e3181cbf825.
Ciccarelli, O., D.J. Werring, G.J. Barker, C.M. Griffin, C.A.M. Wheeler-Kingshott, D.H. Miller,
and A.J. Thompson. 2003. A study of the mechanisms of normal-appearing white matter
damage in multiple sclerosis using diffusion tensor imaging: Evidence of Wallerian
degeneration. J. Neurol. 250:287–292. doi:10.1007/s00415-003-0992-5.
Ciccarelli, O., D.J. Werring, G.J. Barker, A.J. Thompson, and D.H. Miller. 2001. Investigation
of MS normal-appearing brain using diffusion tensor MRI with clinical correlations.
Neurology. 56:926–933.
De Coene, B., J. V. Hajnal, P. Gatehouse, D. Longmore, S.J. White, A. Oatridge, J.M. Pennock,
ian R. Young, and G.M. Bydder. 1992. MR of the Brain Using Fluid-Attenuated Inversion
Recovery (FLAIR) Pulse Sequences. Am. J. Neuroradiol. 13:1555–1564.
doi:10.1007/BF00588360.
Colasanti, A., Q. Guo, N. Muhlert, P. Giannetti, M. Onega, R.D. Newbould, O. Ciccarelli, S.
Rison, C. Thomas, R. Nicholas, P.A. Muraro, O. Malik, D.R. Owen, P. Piccini, R.N.
Gunn, E.A. Rabiner, and P.M. Matthews. 2014. In Vivo Assessment of Brain White
Matter Inflammation in Multiple Sclerosis with 18F-PBR111 PET. J. Nucl. Med. 55:1112–
1118. doi:10.2967/jnumed.113.135129.
Correale, J. 2014. The role of microglial activation in disease progression. Mult. Scler.
20:1288–1295. doi:10.1177/1352458514533230.
Cosenza-nashat, M., M. Zhao, H. Suh, J. Morgan, S. Morgello, S.C. Lee, and A. Einstein. 2009.
Expression of the TSPO of 18kDa by microglia, macrophages and astrocytes based on
immunohistochemical localization in abnormal human brain. 35:306–328.
doi:10.1111/j.1365-2990.2008.01006.x.Expression.
Costello, K., J. Halper, R. Kalb, L. Skutnik, and R. Rapp. 2014. The Use of Disease-Modifying
Therapies in Multiple Sclerosis, Principles and Current Evidence: A Consensus Paper by

Svetlana Bezukladova
63
the Multiple Sclerosis Coalition. 72 pp.
Dal-Bianco, A., G. Grabner, C. Kronnerwetter, M. Weber, R. Höftberger, T. Berger, E. Auff, F.
Leutmezer, S. Trattnig, H. Lassmann, F. Bagnato, and S. Hametner. 2017. Slow expansion
of multiple sclerosis iron rim lesions: pathology and 7 T magnetic resonance imaging.
Acta Neuropathol. 133:25–42. doi:10.1007/s00401-016-1636-z.
Debruyne, J.C., J. Versijpt, K.J. Van Laere, F. De Vos, J. Keppens, K. Strijckmans, E. Achten,
G. Slegers, R.A. Dierckx, J. Korf, and J.L. De Reuck. 2003. Pet visualization of microglia
in multiple sclerosis patients using [11C]PK11195. Eur. J. Neurol. 10:257–264.
doi:10.1046/j.1468-1331.2003.00571.x.
Deppe, M., J. Krämer, J.G. Tenberge, J. Marinell, W. Schwindt, K. Deppe, S. Groppa, H.
Wiendl, and S.G. Meuth. 2016. Early silent microstructural degeneration and atrophy of
the thalamocortical network in multiple sclerosis. Hum. Brain Mapp. 37:1866–1879.
doi:10.1002/hbm.23144.
Dev, K.K., F. Mullershausen, H. Mattes, R.R. Kuhn, G. Bilbe, D. Hoyer, and A. Mir. 2008.
Brain sphingosine-1-phosphate receptors: Implication for FTY720 in the treatment of
multiple sclerosis. Pharmacol. Ther. 117:77–93. doi:10.1016/j.pharmthera.2007.08.005.
Dillman, J.R., J.H. Ellis, R.H. Cohan, P.J. Strouse, and S.C. Jan. 2007. Frequency and severity
of acute allergic-like reactions to gadolinium-containing IV contrast media in children and
adults. Am. J. Roentgenol. 189:1533–1538. doi:10.2214/AJR.07.2554.
Dupont, A.-C., B. Largeau, M. Santiago Ribeiro, D. Guilloteau, C. Tronel, and N. Arlicot. 2017.
Translocator Protein-18 kDa (TSPO) Positron Emission Tomography (PET) Imaging and
Its Clinical Impact in Neurodegenerative Diseases. Int. J. Mol. Sci. 18:785.
doi:10.3390/ijms18040785.
Filippi, M. 2000. Enhanced magnetic resonance imaging in multiple sclerosis. Mult. Scler.
6:320–326. doi:10.1177/135245850000600505.
Filippi, M., and M.A. Rocca. 2007. Conventional MRI in multiple sclerosis. J. Neuroimaging.
17:3–9. doi:10.1111/j.1552-6569.2007.00129.x.
Fox, R.J., T. Cronin, J. Lin, X. Wang, K. Sakaie, D. Ontaneda, S.Y. Mahmoud, M.J. Lowe, and
M.D. Phillips. 2011. Measuring myelin repair and axonal loss with diffusion tensor
imaging. Am. J. Neuroradiol. 32:85–91. doi:10.3174/ajnr.A2238.
Fragata, I., M. Alves, A.L. Papoila, A.P. Nunes, P. Ferreira, N. Canto-Moreira, and P. Canhaõ.
2017. Early Prediction of Delayed Ischemia and Functional Outcome in Acute
Subarachnoid Hemorrhage: Role of Diffusion Tensor Imaging. Stroke.
doi:10.1161/STROKEAHA.117.016811.
Friese, M.A., B. Schattling, and L. Fugger. 2014. Mechanisms of neurodegeneration and axonal
dysfunction in multiple sclerosis. Nat. Rev. Neurol. 10:225–238.
doi:10.1038/nrneurol.2014.37.
Frischer, J.M., S. Bramow, A. Dal-Bianco, C.F. Lucchinetti, H. Rauschka, M. Schmidbauer, H.
Laursen, P.S. Sorensen, and H. Lassmann. 2009. The relation between inflammation and
neurodegeneration in multiple sclerosis brains. Brain. 132:1175–1189.
doi:10.1093/brain/awp070.
Frischer, J.M., S.D. Weigand, Y. Guo, N. Kale, J.E. Parisi, I. Pirko, J. Mandrekar, S. Bramow,
M. Imke, W. Bruck, H. Lassmann, and C.F. Lucchinetti. 2015. Clinical and Pathological

Svetlana Bezukladova
64
Insights into the Dynamic Nature of the White Matter Multiple Sclerosis Plaque. Ann
Neurol. 78:710–721. doi:doi:10.1002/ana.24497.
Gajofatto, A., M. Turatti, S. Monaco, and M.D. Benedetti. 2015. Clinical efficacy, safety, and
tolerability of fingolimod for the treatment of relapsing-remitting multiple sclerosis. Drug.
Healthc. Patient Saf. 7:157–167. doi:10.2147/DHPS.S69640.
Ge, Y., M. Law, G. Johnson, J. Herbert, J.S. Babb, L.J. Mannon, and R.I. Grossman. 2004.
Preferential occult injury of corpus callosum in multiple sclerosis measured by diffusion
tensor imaging. J. Magn. Reson. Imaging. 20:1–7. doi:10.1002/jmri.20083.
Giannetti, P., M. Politis, P. Su, F.E. Turkheimer, O. Malik, S. Keihaninejad, K. Wu, A.
Waldman, R. Reynolds, R. Nicholas, and P. Piccini. 2015. Increased PK11195-PET
binding in normal-appearing white matter in clinically isolated syndrome. Brain. 138:110–
119. doi:10.1093/brain/awu331.
Gillen, K.M., M. Mubarak, T.D. Nguyen, and D. Pitt. 2018. Significance and In Vivo Detection
of Iron-Laden Microglia in White Matter Multiple Sclerosis Lesions. Front. Immunol.
9:255. doi:10.3389/fimmu.2018.00255.
Goldenberg, M.M. 2012. Multiple sclerosis review. P T. 37:175–84.
doi:https://www.ncbi.nlm.nih.gov/pmc/articles/PMC3351877/.
Gulyás, B., E. Pavlova, P. Kása, K. Gulya, L. Bakota, S. Várszegi, É. Keller, M.C. Horváth, S.
Nag, I. Hermecz, K. Magyar, and C. Halldin. 2011. Activated MAO-B in the brain of
alzheimer patients, demonstrated by [11C]-l-deprenyl using whole hemisphere
autoradiography. Neurochem. Int. 58:60–68. doi:10.1016/j.neuint.2010.10.013.
Gunn, R.N., A.A. Lammertsma, and V.J. Cunningham. 1997. Parametric Imaging of Ligand-
Receptor Binding in PET Using a Simplified Reference Region Model. Neuroimage.
6:279–287.
Gurevich, M., R. Waknin, E. Stone, and A. Achiron. 2018. Fingolimod-improved axonal and
myelin integrity of white matter tracts associated with multiple sclerosis-related functional
impairments. CNS Neurosci. Ther. 24:412–419. doi:10.1111/cns.12796.
Guy, C., and D. Ffytche. 2005. An introduction to the principles of medical imaging. Revised
ed. D. ffytche, editor. Imperial College Press, London. 420 pp.
Hagmann, P., L. Jonasson, P. Maeder, J.-P. Thiran, V.J. Wedeen, and R. Meuli. 2006.
Understanding Diffusion MR Imaging Techniques: From Scalar Diffusion-weighted
Imaging to Diffusion Tensor Imaging and Beyond. RadioGraphics. 26:205–223.
doi:10.1148/rg.26si065510.
Haider, L., C. Simeonidou, G. Steinberger, S. Hametner, N. Grigoriadis, G. Deretzi, G.G.
Kovacs, A. Kutzelnigg, H. Lassmann, and J.M. Frischer. 2014. Multiple sclerosis deep
grey matter: The relation between demyelination, neurodegeneration, inflammation and
iron. J. Neurol. Neurosurg. Psychiatry. 85:1386–1395. doi:10.1136/jnnp-2014-307712.
Harrison, D.M., B. Caffo, N. Shiee, J. Farrell, P.-L. Bazin, S. Farrell, J. Ratchford, P. Calabresi,
and D. Reich. 2011. Longitudinal changes in diffusion tensor – based quantitative MRI in
multiple sclerosis. Neurology. 76:179–186.
doi:http://dx.doi.org/10.1212/WNL.0b013e318206ca61.
Harrison, D.M., N. Shiee, P.-L. Bazin, S.D. Newsome, J.N. Ratchford, D. Pham, P.A. Calabresi,
and D.S. Reich. 2013. Tract-specific quantitative MRI better correlates with disability than

Svetlana Bezukladova
65
conventional MRI in multiple sclerosis. J. Neurol. 260:397–406. doi:10.1007/s00415-012-
6638-8.
Hartung, H.-P., D. Arnold, M. Freedman, E. Havrdova, D. Jeffery, R. Kapoor, A. Miller, F.
Sellebjerg, H. Li, N. Lucas, D. Cadavid, N. Campbell, P.-R. Ho, and D. Steiner. 2017.
ASCEND Phase 3 Trial Open-Label Extension Study Results: Natalizumab May Delay
Disability Progression in Secondary Progressive Multiple Sclerosis (SPMS) (P5.330).
Neurology. 88.
Hemmer, B., M. Kerschensteiner, and T. Korn. 2015. Role of the innate and adaptive immune
responses in the course of multiple sclerosis. Lancet Neurol. 14:406–419.
doi:10.1016/S1474-4422(14)70305-9.
Högel, H., E. Rissanen, A. Vuorimaa, and L. Airas. 2018. Positron emission tomography
imaging in evaluation of MS pathology in vivo. 1–14. doi:10.1177/1352458518791680.
Housley, W.J., D. Pitt, and D.A. Hafler. 2015. Biomarkers in multiple sclerosis. Clin. Immunol.
161:51–58. doi:10.1016/j.clim.2015.06.015.
Howell, O.W., C.A. Reeves, R. Nicholas, D. Carassiti, B. Radotra, S.M. Gentleman, B. Serafini,
F. Aloisi, F. Roncaroli, R. Magliozzi, and R. Reynolds. 2011. Meningeal inflammation is
widespread and linked to cortical pathology in multiple sclerosis. Brain. 134:2755–2771.
doi:10.1093/brain/awr182.
Hulkower, M.B., D.B. Poliak, S.B. Rosenbaum, M.E. Zimmerman, and M.L. Lipton. 2013. A
decade of DTI in traumatic brain injury: 10 years and 100 articles later. Am. J.
Neuroradiol. doi:10.3174/ajnr.A3395.
Janssen, B., D.J. Vugts, S.M. Wilkinson, D. Ory, S. Chalon, J.J.M. Hoozemans, R.C. Schuit, W.
Beaino, E.J.M. Kooijman, J. Van Den Hoek, M. Chishty, A. Doméné, A. Van Der Perren,
A. Villa, A. Maggi, G.T. Molenaar, U. Funke, R. V. Shevchenko, V. Baekelandt, G.
Bormans, A.A. Lammertsma, M. Kassiou, and A.D. Windhorst. 2018. Identification of the
allosteric P2X7receptor antagonist [11C]SMW139 as a PET tracer of microglial
activation. Sci. Rep. 8:1–10. doi:10.1038/s41598-018-24814-0.
John F.Kurtzke. 1983. Rating neurologic impairment in multiple sclerosis: An expanded
disability status scale(EDSS). Neurology. 33:1444. doi:10.1212/WNL.33.11.1444.
Jones, D.K. 2004. The Effect of Gradient Sampling Schemes on Measures Derived from
Diffusion Tensor MRI: A Monte Carlo Study. Magn. Reson. Med. 51:807–815.
doi:10.1002/mrm.20033.
Jones, D.K., T.R. Knösche, and R. Turner. 2013. White matter integrity, fiber count, and other
fallacies: The do’s and don’ts of diffusion MRI. Neuroimage. 73:239–254.
doi:10.1016/j.neuroimage.2012.06.081.
Kannan, S., B. Balakrishnan, O. Muzik, R. Romero, and D. Chugani. 2009. Positron emission
tomography imaging of neuroinflammation. J Child Neurol. 24:1190–1199.
doi:10.1177/0883073809338063.
Kim, N.W., I.M. Chung, Y.S. Won, J. Lee, and J.G. Arnold. 2017. Diffusion tensor imaging of
normal-appearing white matter in patients with neuromyelitis optica spectrum disorder and
multiple sclerosis. Eur. J. Neurol. 24:1–55. doi:10.1111/ene.13321.
Klistorner, A., N. Vootakuru, C. Wang, C. Yiannikas, S.L. Graham, J. Parratt, R. Garrick, N.
Levin, L. Masters, J. Lagopoulos, and M.H. Barnett. 2015. Decoding diffusivity in

Svetlana Bezukladova
66
multiple sclerosis: Analysis of optic radiation lesional and non-lesional white matter. PLoS
One. 10:1–23. doi:10.1371/journal.pone.0122114.
Klistorner, A., C. Wang, V. Fofanova, M.H. Barnett, C. Yiannikas, J. Parratt, Y. You, and S.L.
Graham. 2016. Diffusivity in multiple sclerosis lesions: At the cutting edge? NeuroImage
Clin. 12:219–226. doi:10.1016/j.nicl.2016.07.003.
Kobayashi, M., T. Jiang, S. Telu, S.S. Zoghbi, R.N. Gunn, E.A. Rabiner, D.R. Owen, Q. Guo,
V.W. Pike, R.B. Innis, and M. Fujita. 2018. 11C-DPA-713 has much greater specific
binding to translocator protein 18 kDa (TSPO) in human brain than11C-(R)-PK11195. J.
Cereb. Blood Flow Metab. 38:393–403. doi:10.1177/0271678X17699223.
Koch, M., E. Kingwell, P. Rieckmann, H. Tremlett, and U.M.C. UBC MS Clinic Neurologists.
2010. The natural history of secondary progressive multiple sclerosis. J. Neurol.
Neurosurg. Psychiatry. 81:1039–43. doi:10.1136/jnnp.2010.208173.
Kočovská, E., F. Gaughran, A. Krivoy, and U.-C. Meier. 2017. Vitamin-D Deficiency As a
Potential Environmental Risk Factor in Multiple Sclerosis, Schizophrenia, and Autism.
Front. psychiatry. 8:47. doi:10.3389/fpsyt.2017.00047.
Kutzelnigg, A., C.F. Lucchinetti, C. Stadelmann, W. Brück, H. Rauschka, M. Bergmann, M.
Schmidbauer, J.E. Parisi, and H. Lassmann. 2005. Cortical demyelination and diffuse
white matter injury in multiple sclerosis. Brain. 128:2705–2712.
doi:10.1093/brain/awh641.
Lassmann, H. 2018. Multiple sclerosis pathology. Cold Spring Harb. Perspect. Med. 8:1–16.
doi:10.1101/cshperspect.a028936.
Lassmann, H., W. Brück, and C. Lucchinetti. 2001. Heterogeneity of multiple sclerosis
pathogenesis: Implications for diagnosis and therapy. Trends Mol. Med. 7:115–121.
doi:10.1016/S1471-4914(00)01909-2.
Lavisse, S., M. Guillermier, A.-S. Herard, F. Petit, M. Delahaye, N. Van Camp, L. Ben Haim,
V. Lebon, P. Remy, F. Dolle, T. Delzescaux, G. Bonvento, P. Hantraye, and C. Escartin.
2012. Reactive Astrocytes Overexpress TSPO and Are Detected by TSPO Positron
Emission Tomography Imaging. J. Neurosci. 32:10809–10818.
doi:10.1523/JNEUROSCI.1487-12.2012.
Lebel, C., T. Benner, and C. Beaulieu. 2012. Six is enough? Comparison of diffusion
parameters measured using six or more diffusion-encoding gradient directions with
deterministic tractography. Magn. Reson. Med. 68:474–483. doi:10.1002/mrm.23254.
Leemans, A., and D.K. Jones. 2009. The B-matrix must be rotated when correcting for subject
motion in DTI data. Magn. Reson. Med. 61:1336–1349. doi:10.1002/mrm.21890.
Leray, E., J. Yaouanq, E. Le Page, M. Coustans, D. Laplaud, J. Oger, and G. Edan. 2010.
Evidence for a two-stage disability progression in multiple sclerosis. Brain. 133:1900–
1913. doi:10.1093/brain/awq076.
Li, X., P.S. Morgan, J. Ashburner, J. Smith, and C. Rorden. 2016. The first step for
neuroimaging data analysis: DICOM to NIfTI conversion. J. Neurosci. Methods. 264:47–
56. doi:10.1016/j.jneumeth.2016.03.001.
Liu, G.J., R.J. Middleton, C.R. Hatty, W.W.Y. Kam, R. Chan, T. Pham, M. Harrison-Brown, E.
Dodson, K. Veale, and R.B. Banati. 2014. The 18 kDa translocator protein, microglia and
neuroinflammation. Brain Pathol. 24:631–653. doi:10.1111/bpa.12196.

Svetlana Bezukladova
67
Logan, J., J.S. Fowler, N.D. Volkow, A.P. Wolf, S.L. Dewey, D.J. Schlyer, R.R. Macgregor, R.
Hitzemann, B. Bendriem, S.J. Gatley, and D.R. Christman. 1990. Graphical Analysis of
Reversible Radioligand Binding from Time-Activity Measurements Applied to [N-11C-
methyl]-( - )-Cocaine PET Studies in Human Subjects. J. Cereb. Blood Flow Metab.
10:740–747.
Logan, J., J.S. Fowler, G.-J. Wang, Y.-S. Ding, and D.L. Alexoff. 1996. Distribution Volume
Ratios Without Blood Sampling from Graphical Analysis of PET Data. J. Cereb. Blood
Flow Metab. 16:834–840.
Magliozzi, R., O. Howell, A. Vora, B. Serafini, R. Nicholas, M. Puopolo, R. Reynolds, and F.
Aloisi. 2007. Meningeal B-cell follicles in secondary progressive multiple sclerosis
associate with early onset of disease and severe cortical pathology. Brain. 130:1089–1104.
doi:10.1093/brain/awm038.
Mazziotta, J., A. Toga, A. Evans, P. Fox, J. Lancaster, K. Zilles, R. Woods, T. Paus, G.
Simpson, B. Pike, C. Holmes, L. Collins, P. Thompson, D. MacDonald, M. Iacoboni, T.
Schormann, K. Amunts, N. Palomero-Gallagher, S. Geyer, L. Parsons, K. Narr, N. Kabani,
G.L. Goualher, D. Boomsma, T. Cannon, R. Kawashima, and B. Mazoyer. 2001. A
probabilistic atlas and reference system for the human brain: International Consortium for
Brain Mapping (ICBM). Philos. Trans. R. Soc. B Biol. Sci. 356:1293–1322.
doi:10.1098/rstb.2001.0915.
McCormack, P.L. 2013. Natalizumab: A review of its use in the management of relapsing-
remitting multiple sclerosis. Drugs. 73:1463–1481. doi:10.1007/s40265-013-0102-7.
Mesaros, S., M.A. Rocca, E. Pagani, M.P. Sormani, M. Petrolini, G. Comi, and M. Filippi.
2011. Thalamic damage predicts the evolution of primary-progressive multiple sclerosis at
5 years. Am. J. Neuroradiol. 32:1016–1020. doi:10.3174/ajnr.A2430.
Mikita, J., N. Dubourdieu-Cassagno, M.S. Deloire, A. Vekris, M. Biran, G. Raffard, B. Brochet,
M.H. Canron, J.M. Franconi, C. Boiziau, and K.G. Petry. 2011. Altered M1/M2 activation
patterns of monocytes in severe relapsing experimental rat model of multiple sclerosis.
Amelioration of clinical status by M2 activated monocyte administration. Mult. Scler. J.
17:2–15. doi:10.1177/1352458510379243.
Miller, D.H., D.T. Chard, and O. Ciccarelli. 2012. Clinically isolated syndromes. Lancet.
Neurol. 11:157–69. doi:10.1016/S1474-4422(11)70274-5.
Miller, D.H., O.A. Khan, W.A. Sheremata, L.D. Blumhardt, G.P.A. Rice, M.A. Libonati, A.J.
Willmer-Hulme, C.M. Dalton, K.A. Miszkiel, and P.W. O’Connor. 2003. A Controlled
Trial of Natalizumab for Relapsing Multiple Sclerosis. N. Engl. J. Med. 348:15–23.
doi:10.1056/NEJMoa020696.
Miller, P.W., N.J. Long, R. Vilar, and A.D. Gee. 2008. Imaging Methods Synthesis of 11 C , 18
F , 15 O , and 13 N Radiolabels for Positron Emission Tomography. Angew. Chem. Int.
47:8998–9033. doi:10.1002/anie.200800222.
Minagar, A., M.H. Barnett, R.H.B. Benedict, D. Pelletier, I. Pirko, M.A. Sahraian, E. Frohman,
and R. Zivadinov. 2013. The thalamus and multiple sclerosis: Modern views on
pathologic, imaging, and clinical aspects. Neurology. 80:210–219.
doi:10.1212/WNL.0b013e31827b910b.
Moehle, M.S., and A.B. West. 2015. M1 and M2 immune activation in Parkinson’s Disease:
Foe and ally? Neuroscience. doi:10.1016/j.neuroscience.2014.11.018.

Svetlana Bezukladova
68
Moll, N.M., A.M. Rietsch, S. Thomas, A.J. Ransohoff, J.C. Lee, R. Fox, A. Chang, R.M.
Ransohoff, and E. Fisher. 2011. Multiple sclerosis normal-appearing white matter:
Pathology-imaging correlations. Ann. Neurol. 70:764–773. doi:10.1002/ana.22521.
Mori, S. 2007. Principle of diffusion tensor imaging. In Introduction to Diffusion Tensor
Imaging. Elsevier B.V. 33–40.
Mosher, K.I., and T. Wyss-Coray. 2014. Microglial dysfunction in brain aging and Alzheimer’s
disease. Biochem. Pharmacol. doi:10.1016/j.bcp.2014.01.008.
Nandu, H., P. Y.Wen, and R. Y.Huang. 2018. Imaging in neuro-oncology. Ther Adv Neurol
Disord. 11:1–19. doi:https://doi.org/10.1177/1756286.
Natarajan, R., S. Hagman, X. Wu, U. Hakulinen, M. Raunio, M. Helminen, M. Rossi, P.
Dastidar, and I. Elovaara. 2013. Diffusion Tensor Imaging in NAWM and NADGM in MS
and CIS: Association with Candidate Biomarkers in Sera. Mult. Scler. Int.
doi:10.1155/2013/265259.
O’Gorman, C., R. Lucas, and B. Taylor. 2012. Environmental risk factors for multiple sclerosis:
A review with a focus on molecular mechanisms. Int. J. Mol. Sci. 13:11718–11752.
doi:10.3390/ijms130911718.
Oguz, I., M. Farzinfar, J. Matsui, F. Budin, Z. Liu, G. Gerig, H.J. Johnson, and M. Styner. 2014.
DTIPrep: quality control of diffusion-weighted images. Front. Neuroinform. 8:1–11.
doi:10.3389/fninf.2014.00004.
Olsson, T., L.F. Barcellos, and L. Alfredsson. 2016. Interactions between genetic, lifestyle and
environmental risk factors for multiple sclerosis. Nat. Rev. Neurol. 13:26–36.
doi:10.1038/nrneurol.2016.187.
Ontaneda, X.D., X.K. Sakaie, X.J. Lin, X.X.-F. Wang, X.M.J. Lowe, X.M.D. Phillips, and
X.R.J. Fox. 2017. Measuring Brain Tissue Integrity during 4 Years Using Diffusion
Tensor Imaging. AJNR Am J Neuroradiol. 38:31–38. doi:10.3174/ajnr.A4946.
Onu, M., A. Roceanu, U. Sboto-Frankenstein, R. Bendic, E. Tarta, F. Preoteasa, and O.
Bajenaru. 2012. Diffusion abnormality maps in demyelinating disease: Correlations with
clinical scores. Eur. J. Radiol. 81:e386–e391. doi:10.1016/j.ejrad.2011.12.014.
Pacheco, R., F. Contreras, and C. Prado. 2012. Cells, Molecules and Mechanisms Involved in
the Neuro-Immune Interaction. In Cell Interaction. S.J.T. Gowder, editor. IntechOpen.
139–166.
Paling, D., B.S. Solanky, F. Riemer, D.J. Tozer, C.A.M. Wheeler-Kingshott, R. Kapoor, X.
Golay, and D.H. Miller. 2013. Sodium accumulation is associated with disability and a
progressive course in multiple sclerosis. Brain. 136:2305–2317. doi:10.1093/brain/awt149.
Papadopoulos, V., M. Baraldi, T.R. Guilarte, T.B. Knudsen, J.J. Lacapère, P. Lindemann, M.D.
Norenberg, D. Nutt, A. Weizman, M.R. Zhang, and M. Gavish. 2006. Translocator protein
(18 kDa): new nomenclature for the peripheral-type benzodiazepine receptor based on its
structure and molecular function. Trends Pharmacol. Sci. 27:402–409.
doi:10.1016/j.tips.2006.06.005.
Piehl, F., C. Holmén, J. Hillert, and T. Olsson. 2011. Swedish natalizumab (Tysabri) multiple
sclerosis surveillance study. Neurol. Sci. 31:289–293. doi:10.1007/s10072-010-0345-y.
Politis, M., P. Giannetti, P. Su, F. Turkheimer, S. Keihaninejad, K. Wu, A. Waldman, O. Malik,

Svetlana Bezukladova
69
P.M. Matthews, R. Reynolds, R. Nicholas, and P. Piccini. 2012. Increased PK11195 PET
binding in the cortex of patients with MS correlates with disability. Neurology. 79:523–
530. doi:10.1212/WNL.0b013e3182635645.
Polman, C.H., P.W. O’Connor, E. Havrdova, H. Michael, K. Ludwig, D.H. Miller,
PhillipsTheodore, Lublin, G. Giovannoni, Wajgt, Toal, Lynn, Panzara, and Sandrock
Alfred. 2006. A Randomized, Placebo-controlled Trial of Natalizumab for Relapsing
Mulltiple Sclerosis. N. Engl. J. Med. 354:899–910. doi:10.1056/NEJMoa044397.
Ponath, G., C. Park, and D. Pitt. 2018. The Role of Astrocytes in Multiple Sclerosis. Front.
Immunol. 9:1–12. doi:10.3389/fimmu.2018.00217.
Popkin, B.M., and I.H. Rosenberg. 2011. Water, Hydration and Health. Nutr Rev. 68:439–458.
doi:10.1111/j.1753-4887.2010.00304.x.Water.
Poutiainen, P., M. Jaronen, F.J. Quintana, and A.-L. Brownell. 2016. Precision Medicine in
Multiple Sclerosis: Future of PET Imaging of Inflammation and Reactive Astrocytes.
Front. Mol. Neurosci. 9:1–23. doi:10.3389/fnmol.2016.00085.
Pujol, S., W. Wells, C. Pierpaoli, C. Brun, J. Gee, G. Cheng, B. Vemuri, O. Commowick, S.
Prima, A. Stamm, M. Goubran, A. Khan, T. Peters, P. Neher, K.H. Maier-Hein, Y. Shi, A.
Tristan-Vega, G. Veni, R. Whitaker, M. Styner, C.-F. Westin, S. Gouttard, I. Norton, L.
Chauvin, H. Mamata, G. Gerig, A. Nabavi, A. Golby, and R. Kikinis. 2015. The DTI
Challenge: Toward Standardized Evaluation of Diffusion Tensor Imaging Tractography
for Neurosurgery. J. Neuroimaging. 25:875–882. doi:10.1111/jon.12283.
Rashid, W., A. Hadjiprocopis, G. Davies, C. Griffin, D. Chard, M. Tiberio, D. Altmann, C.
Wheeler-Kingshott, D. Tozer, A. Thompson, and D.H. Miller. 2008. Longitudinal
evaluation of clinically early relapsing-remitting multiple sclerosis with diffusion tensor
imaging. J. Neurol. 255:390–397. doi:10.1007/s00415-008-0678-0.
Rissanen, E. 2015. Imaging neuroinflammation in progressive multiple sclerosis.
Rissanen, E., J. Tuisku, J. Rokka, T. Paavilainen, R. Parkkola, J.O. Rinne, and L. Airas. 2014.
In Vivo Detection of Diffuse Inflammation in Secondary Progressive Multiple Sclerosis
Using PET Imaging and the Radioligand 11C-PK11195. J. Nucl. Med. 55:939–944.
doi:10.2967/jnumed.113.131698.
Rissanen, E., J. Tuisku, T. Vahlberg, M. Sucksdorff, T. Paavilainen, R. Parkkola, J. Rokka, A.
Gerhard, R. Hinz, P.S. Talbot, J.O. Rinne, and L. Airas. 2018. Microglial activation ,
white matter tract damage , and disability in MS. Neurol Neuroimmunol Neuroinflamm.
5:1–10. doi:10.1212/NXI.0000000000000443.
Romme Christensen, J., R. Ratzer, L. Börnsen, M. Lyksborg, E. Garde, T.B. Dyrby, H.R.
Siebner, P.S. Sorensen, and F. Sellebjerg. 2014. Natalizumab in progressive MS. Results
of an open-label, phase 2A, proof-of-concept trial. Neurology. 82:1499 LP-1507.
Roosendaal, S.D., J.J.G. Geurts, H. Vrenken, H.E. Hulst, K.S. Cover, J.A. Castelijns, P.J.W.
Pouwels, and F. Barkhof. 2009. Regional DTI differences in multiple sclerosis patients.
Neuroimage. 44:1397–1403. doi:10.1016/j.neuroimage.2008.10.026.
Rupprecht, R., V. Papadopoulos, G. Rammes, T.C. Baghai, J. Fan, N. Akula, G. Groyer, D.
Adams, and M. Schumacher. 2010. Translocator protein (18 kDa) (TSPO) as a therapeutic
target for neurological and psychiatric disorders. Nat. Rev. Drug Discov. 9:971–988.
doi:10.1038/nrd3295.

Svetlana Bezukladova
70
Sahin, N., R. Selouan, C.E. Markowitz, E.R. Melhem, and M. Bilello. 2016. Limbic pathway
lesions in patients with multiple sclerosis. Acta radiol. 57:341–347.
doi:10.1177/0284185115578689.
Salat, D.H., D.N. Greve, J.L. Pacheco, B.T. Quinn, K. G.Helmer, R.L. Buckner, and B. Fischl.
2009. Regional White Matter Volume Differences in nondemented aging and Alzheimer’s
disease. Neuroimage. 44:1247–1258. doi:10.1016/j.neuroimage.2008.10.030.
Salata, B.M., and P. Singh. 2017. Role of Cardiac PET in Clinical Practice. Curr. Treat.
Options Cardiovasc. Med. 19. doi:10.1007/s11936-017-0591-x.
Sayed, N., C. Liu, and J.C. Wu. 2016. Translation of Human-Induced Pluripotent Stem Cells
from Clinical Trial in a Dish to Precision Medicine. J. Am. Coll. Cardiol. 67:2161–2176.
doi:10.1016/j.jacc.2016.01.083.
Scanderbeg, A.C., F. Tomaiuolo, U. Sabatini, U. Nocentini, M.G. Grasso, and C. Caltagirone.
2000. Demyelinating plaques in relapsing-remitting and secondary-progressive multiple
sclerosis: Assessment with diffusion MR imaging. Am. J. Neuroradiol. 21:862–868.
Schmidt, P., C. Gaser, M. Arsic, D. Buck, A. Förschler, A. Berthele, M. Hoshi, R. Ilg, V.J.
Schmid, C. Zimmer, B. Hemmer, and M. Mühlau. 2012. An automated tool for detection
of FLAIR-hyperintense white-matter lesions in Multiple Sclerosis. Neuroimage. 59:3774–
3783. doi:10.1016/j.neuroimage.2011.11.032.
Seewann, A., H. Vrenken, P. Valk, E.L.A. Blezer, D.L. Knol, J.A. Castelijns, C.H. Polman,
P.J.W. Pouwels, F. Barhhof, and J.J.G. Ceurts. 2009. Diffusely abnormal white matter in
chronic multiple sclerosis. Ann Neurol. 66:601–609.
Sellebjerg, F., D. Cadavid, D. Steiner, L.M. Villar, R. Reynolds, and D. Mikol. 2016. Exploring
potential mechanisms of action of natalizumab in secondary progressive multiple sclerosis.
Ther. Adv. Neurol. Disord. 9:31–43. doi:10.1177/1756285615615257.
Senda, J., H. Watanabe, K. Endo, K. Yasui, Y. Hawsegawa, N. Yoneyama, T. Tsuboi, K. Hara,
M. Ito, N. Atsuta, B. Epifanio, M. Katsuno, S. Naganawa, and G. Sobue. 2016. Active
brain changes after initiating fingolimod therapy in multiple sclerosis patients using
individual voxel-based analyses for diffusion tensor imaging. Nagoya J Med Sci. 78:455–
463. doi:10.18999/nagjms.78.4.455.
Shah, F., S.P. Hume, V.W. Pike, S. Ashworth, and J. Mcdermott. 1994. Synthesis of the
Enantiomers of [N-Methyl-C-11]Pk-11195 and Comparison of Their Behaviors as
Radioligands for Pk Binding-Sites in Rats. Nucl. Med. Biol. 21:573–581. doi:Doi
10.1016/0969-8051(94)90022-1.
Simon, J., R. Kinkel, L. Jacobs, and L. Bub. 2000. A Wallerian degeneration pattern in patients
at risk for MS. Neurology. 54:1155–1160.
Slifstein, M., and A. Abi-Dargham. 2017. Recent Developments in Molecular Brain Imaging of
Neuropsychiatric Disorders. Semin. Nucl. Med. 47:54–63.
doi:10.1053/j.semnuclmed.2016.09.002.
Smith, S.M., M. Jenkinson, H. Johansen-Berg, D. Rueckert, T.E. Nichols, C.E. Mackay, K.E.
Watkins, O. Ciccarelli, M.Z. Cader, P.M. Matthews, and T.E.J. Behrens. 2006. Tract based
spatial statistics: voxelwise analysis of multi-subjects diffusion data. Neuroimage.
31:1487–1505. doi:10.1016/j.neuroimage.2006.02.024.
Smith, S.M., and T.E. Nichols. 2009. Threshold-free cluster enhancement: Addressing problems

Svetlana Bezukladova
71
of smoothing, threshold dependence and localisation in cluster inference. Neuroimage.
44:83–98. doi:10.1016/j.neuroimage.2008.03.061.
Soares, J.M., P. Marques, V. Alves, and N. Sousa. 2013. A hitchhiker’s guide to diffusion
tensor imaging. Front. Neurosci. 7:1–14. doi:10.3389/fnins.2013.00031.
Soon, D., D.J. Tozer, D.R. Altmann, P.S. Tofts, and D.H. Miller. 2007. Quantification of subtle
blood-brain barrier disruption in non-enhancing lesions in multiple sclerosis: A study of
disease and lesion subtypes. Mult. Scler. 13:884–894. doi:10.1177/1352458507076970.
Stankoff, B., Y. Wang, M. Bottlaender, M.-S. Aigrot, F. Dolle, C. Wu, D. Feinstein, G.-F.
Huang, F. Semah, C.A. Mathis, W. Klunk, R.M. Gould, C. Lubetzki, and B. Zalc. 2006.
Imaging of CNS myelin by positron-emission tomography. Proc. Natl. Acad. Sci.
103:9304–9309. doi:10.1073/pnas.0600769103.
De Stefano, N., D.G. Silva, and M.H. Barnett. 2017. Effect of Fingolimod on Brain Volume
Loss in Patients with Multiple Sclerosis. CNS Drugs. 31:289–305. doi:10.1007/s40263-
017-0415-2.
De Stefano, N., D. Tomic, E.W. Radue, T. Sprenger, D.P. Meier, D. Häring, and M.P. Sormani.
2016. Effect of fingolimod on diffuse brain tissue damage in relapsing-remitting multiple
sclerosis patients. Mult. Scler. Relat. Disord. 7:98–101. doi:10.1016/j.msard.2016.03.017.
Steven, A.J., J. Zhuo, and E.R. Melhem. 2014. Diffusion kurtosis imaging: An emerging
technique for evaluating the microstructural environment of the brain. Am. J. Roentgenol.
202:26–33. doi:10.2214/AJR.13.11365.
Stüber, C., D. Pitt, and Y. Wang. 2016. Iron in multiple sclerosis and its noninvasive imaging
with quantitative susceptibility mapping. Int. J. Mol. Sci. 17. doi:10.3390/ijms17010100.
Sucksdorff, M., E. Rissanen, J. Tuisku, S. Nuutinen, T. Paavilainen, J. Rokka, J. Rinne, and L.
Airas. 2017. Evaluation of the Effect of Fingolimod Treatment on Microglial Activation
Using Serial PET Imaging in Multiple Sclerosis. J. Nucl. Med. 58:1646–1651.
doi:10.2967/jnumed.116.183020.
Symms, M., H.R. Jäger, K. Schmierer, and T.A. Yousry. 2004. A review of structural magnetic
resonance neuroimaging. J. Neurol. Neurosurg. Psychiatry. 75:1235–1244.
doi:10.1136/jnnp.2003.032714.
Takano, A., F. Piehl, J. Hillert, A. Varrone, S. Nag, B. Gulyas, P. Stenkrona, V.L. Villemagne,
C.C. Rowe, R. Macdonell, N.A. Tawil, T. Kucinski, T. Zimmermann, M. Schultze-
Mosgau, A. Thiele, A. Hoffmann, C. Halldin, N. Al Tawil, T. Kucinski, T. Zimmermann,
M. Schultze-Mosgau, A. Thiele, A. Hoffmann, and C. Halldin. 2013. In vivo TSPO
imaging in patients with multiple sclerosis: a brain PET study with [F-18]FEDAA1106.
Ejnmmi Res. 3:30. doi:10.1186/2191-219X-3-30.
Thompson, A.J., B.L. Banwell, F. Barkhof, W.M. Carroll, T. Coetzee, G. Comi, J. Correale, F.
Fazekas, M. Filippi, M.S. Freedman, K. Fujihara, S.L. Galetta, H.P. Hartung, L. Kappos,
F.D. Lublin, R.A. Marrie, A.E. Miller, D.H. Miller, X. Montalban, E.M. Mowry, P.S.
Sorensen, M. Tintoré, A.L. Traboulsee, M. Trojano, B.M.J. Uitdehaag, S. Vukusic, E.
Waubant, B.G. Weinshenker, S.C. Reingold, and J.A. Cohen. 2018. Diagnosis of multiple
sclerosis: 2017 revisions of the McDonald criteria. Lancet Neurol. 17:162–173.
doi:10.1016/S1474-4422(17)30470-2.
Tremlett, H., and E. Waubant. 2017. The multiple sclerosis microbiome? Ann. Transl. Med.
5:53. doi:10.21037/atm.2017.01.63.

Svetlana Bezukladova
72
Tronel, C., B. Largeau, M.J.S. Ribeiro, D. Guilloteau, A.C. Dupont, and N. Arlicot. 2017.
Molecular targets for PET imaging of activated microglia: The current situation and future
expectations. Int. J. Mol. Sci. 18. doi:10.3390/ijms18040802.
Tuch, D.S. 2004. Q-ball imaging. Magn. Reson. Med. 52:1358–1372. doi:10.1002/mrm.20279.
Turkheimer, F.E., P. Edison, N. Pavese, F. Roncaroli, A.N. Anderson, A. Hammers, A.
Gerhard, R. Hinz, Y.F. Tai, and D.J. Brooks. 2007. Reference and target region modeling
of [11C]-(R)-PK11195 brain studies. J. Nucl. Med. 48:158–167. doi:48/1/158 [pii].
Turkheimer, F.E., G. Rizzo, P.S. Bloomfield, O. Howes, P. Zanotti-Fregonara, A. Bertoldo, and
M. Veronese. 2015. The methodology of TSPO imaging with positron emission
tomography. Biochem. Soc. Trans. 43:586–592. doi:10.1042/BST20150058.
Venneti, S., B. Loprestil, and C. Wiley. 2013. Molecular imaging of microglia / macrophages in
the brain. Glia. 61:10–23. doi:10.1002/glia.22357.Molecular.
Vercellino, M., S. Masera, M. Lorenzatti, C. Condello, A. Merola, A. Mattioda, A. Tribolo, E.
Capello, G.L. Mancardi, R. Mutani, M.T. Giordana, and P. Cavalla. 2009. Demyelination,
inflammation, and neurodegeneration in multiple sclerosis deep gray matter. J.
Neuropathol. Exp. Neurol. 68:489–502. doi:10.1097/NEN.0b013e3181a19a5a.
Vivash, L., and T.J. OBrien. 2016. Imaging Microglial Activation with TSPO PET: Lighting Up
Neurologic Diseases? J. Nucl. Med. 57:165–168. doi:10.2967/jnumed.114.141713.
Vrenken, H., J.J.G. Geurts, D.L. Knol, C.H. Polman, J.A. Castelijns, P.J.W. Pouwels, and F.
Barkhof. 2006. Normal-appearing white matter changes vary with distance to lesions in
multiple sclerosis. Am. J. Neuroradiol. 27:2005–2011. doi:27/9/2005 [pii].
Wang, Y., C. Wu, A. V Caprariello, E. Somoza, W. Zhu, C. Wang, and R.H. Miller. 2009. In
Vivo Quantification of Myelin Changes in the Vertebrate Nervous System. 29:14663–
14669. doi:10.1523/JNEUROSCI.4082-08.2009.In.
Werring, D.J. 2000. The pathogenesis of lesions and normal-appearing white matter changes in
multiple sclerosis: A serial diffusion MRI study. Brain. 123:1667–1676.
doi:10.1093/brain/123.8.1667.
Werring, D.J., C.A. Clark, A.G. Droogan, G.J. Barker, D.H. Miller, and A.J. Thompson. 2001.
Water diffusion in elevated in widespread regions of normal-appearing white matter in
multiple sclerosis and correlates with diffusion in focal lesions. Mult. Scler. 7:83–89.
doi:10.1191/135245801678227586.
Wheeler-Kingshott, C.A.M., and M. Cercignani. 2009. About “axial” and “radial” diffusivities.
Magn. Reson. Med. 61:1255–1260. doi:10.1002/mrm.21965.
Wiebenga, O.T., M.M. Schoonheim, H.E. Hulst, G.J.A. Nagtegaal, E.M.M. Strijbis, M.D.
Steenwijk, C.H. Polman, P.J.W. Pouwels, F. Barkhof, and J.J.G. Geurts. 2016. White
matter diffusion changes during the first year of natalizumab treatment in relapsing-
remitting multiple sclerosis. Am. J. Neuroradiol. 37:1030–1037. doi:10.3174/ajnr.A4690.
Winkler, A.M., G.R. Ridgway, M.A. Webster, S.M. Smith, and T.E. Nichols. 2014. Permutation
inference for the general linear model. Neuroimage. 92:381–397.
doi:10.1016/j.neuroimage.2014.01.060.
Winston, G.P. 2012. The physical and biological basis of quantitative parameters derived from
diffusion MRI. Quant. Imaging Med. Surg. 2:254–65. doi:10.3978/j.issn.2223-

Svetlana Bezukladova
73
4292.2012.12.05.
Woo, C.W., A. Krishnan, and T.D. Wager. 2014. Cluster-extent based thresholding in fMRI
analyses: Pitfalls and recommendations. Neuroimage. 91:412–419.
doi:10.1016/j.neuroimage.2013.12.058.
Zanzonico, P. 2012. Principles of Nuclear Medicine Imaging : Planar , SPECT , PET , Multi-
modality , and Autoradiography Systems Principles of Nuclear Medicine Imaging : Planar
, SPECT , PET , Multi-modality , and Autoradiography Systems. Radiat. Res. 177:349–
364. doi:10.1667/RR2577.1.
Zhang, H., T. Schneider, C.A. Wheeler-Kingshott, and D.C. Alexander. 2012. NODDI:
Practical in vivo neurite orientation dispersion and density imaging of the human brain.
Neuroimage. 61:1000–1016. doi:10.1016/j.neuroimage.2012.03.072.