Embed Size (px)
Citation preview

Multilevel Monte Carlo Methodsfor American Options
Simon Gemmrich, PhD
Kellog College
University of Oxford
A thesis submitted in partial fulfillment of the MSc in
Mathematical Finance
November 19, 2012

To my wife Miriam and my son Jakob

Acknowledgements
It is a pleasure to thank my supervisor Prof. Mike Giles for pointing me
in the direction of this fun project and for his thorough help and guidance
while I was working on this thesis. This thesis would not have been
possible without him.
I thank my former employer d-fine GmbH for the opportunity to partici-
pate in the Oxford Math Finance programme.
Above all I thank my wife Miriam for her endless support.
ii

Contents
1 Introduction and scope 1
2 American options 3
2.1 Option basics . . . . . . . . . . . . . . . . . . . . . . . . . . . . . . . 3
2.2 Pricing models for American options . . . . . . . . . . . . . . . . . . 4
2.2.1 Free boundary formulation . . . . . . . . . . . . . . . . . . . . 5
2.2.2 Linear complementarity formulation . . . . . . . . . . . . . . . 6
2.2.3 Optimal stopping formulation . . . . . . . . . . . . . . . . . . 7
2.2.4 Stopping rules and parametric approximations . . . . . . . . . 8
2.3 Finite Difference θ-scheme for American options . . . . . . . . . . . . 10
2.4 The Longstaff-Schwartz algorithm . . . . . . . . . . . . . . . . . . . . 13
3 Multilevel Monte Carlo method 16
3.1 The setup . . . . . . . . . . . . . . . . . . . . . . . . . . . . . . . . . 16
3.2 Basic multilevel decomposition . . . . . . . . . . . . . . . . . . . . . . 17
3.3 Monte Carlo estimators . . . . . . . . . . . . . . . . . . . . . . . . . . 18
3.4 The multilevel algorithm . . . . . . . . . . . . . . . . . . . . . . . . . 19
3.5 Complexity and convergence theorem . . . . . . . . . . . . . . . . . . 19
4 Numerical implementation for an American put option under a pre-
set exercise strategy 22
4.1 Discretizing the SDE . . . . . . . . . . . . . . . . . . . . . . . . . . . 23
4.1.1 Exact path simulation for geometric Brownian motion . . . . . 23
4.2 Estimators for a given exercise strategy . . . . . . . . . . . . . . . . . 24
4.3 Numerical example . . . . . . . . . . . . . . . . . . . . . . . . . . . . 28
4.3.1 A brief aside on Brownian bridge construction and Brownian
interpolation . . . . . . . . . . . . . . . . . . . . . . . . . . . . 28
4.3.2 Equidistant time grids . . . . . . . . . . . . . . . . . . . . . . 29
4.3.3 Time discretization in transformed coordinates . . . . . . . . . 31
iii

5 Optimizing exercise strategies 35
5.1 Parametric forms for the exercise boundary of an American put option 36
5.2 Stochastic approximation . . . . . . . . . . . . . . . . . . . . . . . . . 38
5.3 The optimization algorithm . . . . . . . . . . . . . . . . . . . . . . . 42
5.4 Numerical examples . . . . . . . . . . . . . . . . . . . . . . . . . . . . 43
6 Conclusion 48
A MATLAB code 50
A.1 MLMCAmOp.m . . . . . . . . . . . . . . . . . . . . . . . . . . . . . . 50
A.2 MLMCAmOpLevelL.m . . . . . . . . . . . . . . . . . . . . . . . . . . 52
A.3 mlmc AmOp Test.m . . . . . . . . . . . . . . . . . . . . . . . . . . 57
Bibliography 60
iv

Chapter 1
Introduction and scope
The best mathematics is likeliterature - it brings a story to lifebefore your eyes and involves you init, intellectually and emotionally.
Herbert Ellis Robbins
The correct pricing of American style options is still an active field of research
within the quantitative finance world. Unlike for their European counterparts there
exist no general closed form solutions for the value of American put and call options.
Various approaches exist in the literature on how to solve the valuation prob-
lem for American options. They differ greatly in style and spirit. Some are based
on optimal stopping formulations. Others are based on partial differential equation
and free boundary formulations or are phrased as a linear complementarity prob-
lem. Some are purely numerical in nature and employ finite difference schemes or
binomial/trinomial tree methods. Others put more emphasis on the analytical work.
Some approaches end up working with integral equations, in which the early exercise
boundary features as an unknown. One of the most heavily used techniques is the
famous Longstaff-Schwartz algorithm, which is based on Monte Carlo ideas and which
tries to approximate the early exercise boundary by a least squares regression of the
continuation value onto a certain set of basis functions.
The aim of this thesis is to show how the ideas from multilevel Monte Carlo
(MLMC) methods can be used in the valuation of American options. The core idea is
to use and adapt the multilevel Monte Carlo method introduced in [Gil08] and [Gil]
to find the value of an American option under a given exercise rule and then optimize
over all exercise rules from a feasible set.
In the spirit of the above quote by H. E. Robbins we hope to tell a consistent story
and validate it through numerical tests. We work with simple test cases, for which
1

existing solution techniques will most likely outperform our new MLMC approach.
This thesis should be understood as a first step towards a new competitive pricing
algorithm for American options in cases where established finite difference and other
lattice methods fail. Ultimately, it should stand the test against other Monte Carlo
like methods such as the Longstaff-Schwartz approach. Heavy theorem proving and
a full numerical analysis are beyond the scope of this thesis.
The thesis is structured as follows. In Chapter 2 we review some of the known
facts and pricing approaches for American options, thereby setting the stage for the
underlying problem of this thesis. Chapter 3 then introduces the multilevel Monte
Carlo method by Giles and reviews some of its properties. Chapter 4 continues with
the numerical implementation and its intricacies. Finally, Chapter 5 first deals with
stochastic approximation algorithms and then ties the knot around the whole pricing
algorithm and applies the algorithm to several test cases.
2

Chapter 2
American options
In our view, however, derivativesare financial weapons of massdestruction, carrying dangers that,while now latent, are potentiallylethal.
Warren Buffet, 2002
In this chapter we list some well-known facts about American options and set the
stage for their numerical treatment by multilevel Monte Carlo methods.
We start by briefly discussing the necessary options jargon. Afterwards, we men-
tion the most common mathematical pricing frameworks for American options in-
cluding the optimal-stopping formulation on which our numerical algorithm is based.
Moreover, we discuss the finite difference θ-scheme and how it can be used to approx-
imate the price of an American option written on a single underlying. We will later
use the finite difference method to compute benchmark solutions against which we
hold our multilevel method. The chapter ends with a very brief presentation of the
famous Longstaff-Schwartz algorithm.
This chapter is by no means intended as an exhaustive treatment of option intri-
cacies. A nicely written account of option trading strategies is for example [Sin10].
2.1 Option basics
A financial option is a contract between two counterparties. On one side of the
contract there is the option holder (also called the owner of the option) and on the
other side of the contract there is the option seller (also called the writer of the option).
The option contract gives the option holder the right, but not the obligation, to buy
3

or sell an underlying asset for a specified price at a specific time. There is a variety
of option types with different properties.
If the option gives the owner the right to buy the underlying asset it is referred to
as a call option, if it gives the option holder the right to sell the underlying asset it
is called a put option. The predetermined price for the underlying asset is called the
strike price or simply the strike. The option holder buys the contract from the option
seller in exchange for an upfront payment, usually called the option premium. The
fair value of an option is derived from the value of the underlying asset and specific
option characteristics. One of the main characteristics of each option is its exercise
type. If the option can only be exercised on a single date the exercise type and the
option itself are called European, if it can be exercised on several dates the exercise
type and the option are classified as Bermudan and if the option can be exercised at
any time up until its final maturity, the exercise type and the option are referred to
as American.
If an American and a European option are identical except for their exercise
types, then the American option must be worth at least as much as its European
counterpart. After all, the holder of an American option can always choose not to
exercise before expiry, thereby limiting his rights to mimic the European option. A
simple no-arbitrage argument then guarantees that the American option is at least
as valuable as the European one. We note that the inequality here is not strict. The
value of an American call option written on an underlying without dividends turns
out to be equal to the value of the European counterpart.
Assuming that no arbitrage opportunities exist, an American option must always
be at least as valuable as its immediate payoff. Otherwise, an investor could simply
buy the option and exercise it immediately in clear violation of the no-arbitrage
assumption.
Basic options without any special features are classified as plain vanilla.
2.2 Pricing models for American options
The pricing and risk management of American options is still a field of ongoing
research, especially when considering options which are written on more than one
underlying asset. From a theoretical point of view, the pricing problem of an Amer-
ican option can be formulated in various ways. Some of the most common pricing
approaches are based on
• an optimal-stopping formulation,
4

• a dynamic programming formulation,
• a linear complementarity formulation or
• a moving boundary formulation.
The linear complementarity and the moving boundary formulations make use of the
associated partial differential equation and we briefly discuss them in sections 2.2.1
and 2.2.2.
Longstaff and Schwartz introduced their well-known pricing algorithm for Ameri-
can options in [LS01] based on a dynamic programming formulation. The Longstaff-
Schwartz algorithm uses a backward iteration where at every timestep the continua-
tion value of the option is approximated with a least squares fit against a set of basis
functions. We give a very brief introduction to the main ideas behind the Longstaff-
Schwartz algorithm in section 2.4.
Most tree based methods to approximate the value of an American option are also
based on backward iterations. Such methods are simple yet powerful pricing tools.
We will, however, not pursue any tree based methods in this thesis, but instead refer
the reader to [Gla04, 8.3] for detailed information.
With a Monte Carlo approach pricing and managing the risks of American deriva-
tives is far more involved than pricing and managing the risks of European options.
The added difficulty stems from the fact that it is a priori unclear when the option
holder will choose to exercise the option. Also Monte Carlo methods usually work
forward in time whereas most formulations for pricing American derivatives lend
themselves better to methods working backwards on the time scale.
The difference in value between an American derivative and its European equiv-
alent is referred to as the early exercise premium. In contrast to European options
there are generally no closed-form solutions for American option even for plain vanilla
instruments. The pricing of an American option is based on the assumption that a
rational option holder will choose to exercise his right optimally in some sense. Thus,
finding an optimal exercise strategy is at the core of pricing an American option.
Mathematically, this translates into the optimal stopping formulation discussed in
section 2.2.3.
2.2.1 Free boundary formulation
One way to phrase the American options pricing problem is as a free boundary prob-
lem. Here, we sketch this approach for a classical American put option.
5
At every point in time, depending on the current value of the underlying, it is
either optimal to exercise the option or to continue to hold it. Mathematically, the
(t, S) plane can be divided into a hold region (where it is optimal to hold the option)
and an exercise region (where it is optimal to exercise it). The barrier between those
two regions is called the optimal exercise boundary B∗(t).
Denote the fair value of the American put option by Pam and assume that the
underlying price process is a geometric Brownian motion. In this situation the hold
region lies above the exercise boundary B∗(t) in the (t, S) plane. Within the hold
region the value function Pam satisfies the Black-Scholes equation, i.e.
LBS [Pam] :=∂Pam∂t
+1
2σ2 S2 ∂
2Pam∂S2
+ r S∂Pam∂S
− r Pam = 0, (2.1)
where r and σ are the usual drift and volatility parameters from the geometric Brow-
nian motion SDE. At expiry T and along the optimal exercise boundary B∗(t) the
option is worth its payoff, i.e.
Pam(T, S) = max (K − S, 0) and Pam(t, B∗(t)) = max (K −B∗(t), 0) .
The transition between the two regions is smooth, in the sense of the so-called smooth
pasting condition
∂Pam∂S
(t, B∗(t)) = −1.
Since the optimal exercise boundary is not known a priori but must be computed
as part of the solution, the problem is much harder to solve than a simple boundary
value problem.
We note that the smooth pasting condition only holds for options whose payoff
is sufficiently smooth. It does not hold in the case of an American digital put for
example. Another point worth mentioning is that for more complicated American
derivatives the hold region might not be simply connected at all times. Overall,
free boundary problems are hard to solve numerically. We will not consider this
formulation any further.
2.2.2 Linear complementarity formulation
Another way to characterize the price of an American option is as the solution of a
linear complementarity formulation. In this formulation we are looking for a function
V (S, t) such that
LBS (V ) ≤ 0, V (S, t) ≥ P (S, t)
(V (S, t)− P (S, t)) LBS [V ] = 0
6

and
V (S, T ) = P (S, T ).
Here, P (S, t) denotes the payoff function of the option and the Black-Scholes operator
LBS is defined as in (2.1).
The linear complementarity formulation is the clever combination of several fea-
tures of an American option. Some of these can easily be argued heuristically. We
had already argued before that based on the no-arbitrage assumption the option must
be worth no less than its immediate payoff, i.e. V (S, t) ≥ P (S, t). Moreover, it is
clear that the option value coincides with its payoff value whenever it is optimal to
exercise. Also the terminal condition is clear from the definition of the option con-
tract. It can be shown that within the hold region of the option its price function
V (S, t) satisfies the Black Scholes equation. Combining these obeservations one ends
up with the linear complementarity formulation above.
2.2.3 Optimal stopping formulation
The last possible formulation of the pricing problem for American options which we
want to discuss is the optimal stopping formulation. It is at the heart of our multilevel
Monte Carlo approach.
Finding the fair value Vam of an American option contract is equivalent to solving
the following optimal-stopping-time problem (see for example [Gla04, chapter 8])
Vam = supτ∈T
E[e−
∫ τ0 r(u)duPτ (Sτ )
]. (2.2)
Here, the expectation is taken under the risk-neutral martingale measure. The in-
stantaneous short rate process r(t) is used to discount the payoff Pτ at time τ , and
the supremum in (2.2) is taken over all admissible stopping times τ ∈ T between
now and the final expiry of the option. For more exotic path-dependent options, e.g.
lookback options, the payoff in (2.2) could be dependent on the whole path history,
i.e. Pτ ({St : t ∈ [0, τ ]}), but for the purpose of this thesis we restrict ourselves to
(2.2). Also, for the sake of better readability, we will assume the short rate r to be
constant from now on.
To make (2.2) more explicit, we consider the special case of a classical American
put option struck at K on a single underlying S with price process St. If the under-
lying price process follows a geometric Brownian motion with interest rate r under
the risk-neutral martingale measure, then (2.2) reads
supτ∈T
E[e−τr max (K − Sτ , 0)
]. (2.3)
7

In case of a put option on a single underlying the hold and exercise regions are half
planes divided by the optimal exercise boundary B∗(t) and the supremum in (2.3) is
attained for an optimal stopping time τ ∗ of the form
τ ∗ = inf {t ≥ 0 : St ≤ B∗(t)} . (2.4)
Figure 2.1 illustrates the situation for a sample path which hits the optimal exercise
boundary.
0 0.1 0.2 0.3 0.4 0.5 0.6 0.7 0.8 0.9 10.65
0.7
0.75
0.8
0.85
0.9
0.95
1
1.05
1.1
1.15
t
exercise boundary
underlying price process
exercise region
hold region
Figure 2.1: hold and exercise region under a given exercise rule
2.2.4 Stopping rules and parametric approximations
The connection in (2.4) allows us to interchangeably formulate the pricing problem
either in terms of stopping times or in terms of exercise regions.
Note that any choice of a stopping time τ ∈ T will produce a (usually suboptimal)
value in the expectation from (2.2), i.e.
V (τ)am = E
[e−τ rPτ (Sτ )
]≤ Vam. (2.5)
8
If the optimal exercise region E∗ is known, then the optimal stopping time τ ∗ is
the first time that St enters the exercise region
τ ∗ = infτ∈T{t ≥ 0 : St ∈ E∗} , (2.6)
and the fair value of the option can be computed as a simple expected value according
to
V (τ∗)am = E
[e−τ
∗ rPτ∗ (Sτ∗)]
= Vam. (2.7)
The mapping implicit in (2.6) can be used to assign a stopping time to any given
”exercise region”. We can therefore think in terms of optimizing over exercise regions
(or boundaries) in order to find the value of an American option.
The appealing consequence is that given an exercise strategy (i.e. an exercise
region), we can simply use a forward Monte Carlo simulation of the underlying path
process, compute the payoff for each path and take an average to find the value of
the option under the chosen exercise strategy. We want to emphasize that most
numerical pricing algorithms for American options including the famous Longstaff-
Schwartz algorithm are based on backward iterations and that forward algorithms
are usually unsuited for the problem.
Suppose now that we can parametrize all feasible exercise regions Eθ by some
parameter θ ∈ Θ and denote by τ(θ) the stopping time associated with Eθ according
to the mapping presented in (2.6). The option value is then approximately equal to
Vam = supθ∈Θ
E[e−τ(θ) rPτ(θ)
(Sτ(θ)
)]. (2.8)
Note however, that the value computed in (2.8) is in general biased low because we
might not hit all feasible stopping times in our approximation. In other words, the
set τ(Θ) ⊂ T will in general be a proper subset of T and hence
Vam = supθ∈Θ
E[e−τ(θ) rPτ(θ)
(Sτ(θ)
)]≤ sup
τ∈TE[e−τ rPτ (Sτ )
]= Vam.
Nonetheless, Equation (2.8) is the foundation of our numerical approach.
For an American put option a lot is known about the optimal exercise boundary.
One of its main characteristics is its asymptotic behaviour close to the expiry date
of the option, where it clearly hits the strike. In fact, the optimal exercise boundary
of an American put option asymptotically approaches its strike level K displaying a
square root behaviour (see e.g. [KK98]), i.e.
B∗(t) ∼ K − c√T − t for T − t� 1 (2.9)
9

with an appropriate constant c. This asymptotic feature determines the choice of our
Monte Carlo time discretization in section 4.3.3. Even more importantly, it influences
our choice of a parametric family of feasible exercise boundaries in section 5.1, which
we use in the optimization problem (2.8) and the numerical examples in chapter 3.
2.3 Finite Difference θ-scheme for American op-
tions
In this section we recall the finite difference θ-scheme and how it can be used to
approximate the value of an American put option on a single underlying. We follow
the presentation in the Oxford lecture notes of Dr. Christoph Reisinger and will later
use the finite difference method as a benchmark solution against which we compare
our multilevel Monte Carlo approximations. This section is not supposed to be an
exhaustive treatment of the finite difference method.
First we consider a European put option on a single underlying with strike K and
time to maturity T . Its fair value V (S, t) solves the Black-Scholes equation
∂V
∂t+
1
2σ2 S2 ∂
2V
∂S2+ r S
∂V
∂S− r S = 0
on the domain (S, t) ∈ (0,∞)× (0, T ) and satisfies the terminal condition
V (S, T ) = max (K − S, 0) .
The finite difference scheme discretizes both the equation and its approximate
solution. It starts with the terminal condition at time t = T and moves backwards
in time towards t = 0 according to the discretized version of the partial differen-
tial equation. This only works on a bounded domain and hence we truncate the
computational domain in the space direction, i.e. we only consider the equation for
(S, t) ∈ (0, Smax) × (0, T ) with some upper bound Smax � K and prescribe an ap-
propriate boundary condition along Smax × (0, T ). For a put option this could for
example be zero Dirichlet data.
We subdivide the space direction into N + 1 equidistant grid points Si = i∆S for
i = 0, . . . , N and ∆S = Smax/N and the time direction into M + 1 equidistant grid
points tj = j∆t for j = 0, . . . ,M and ∆t = T/M , and use the notation V mn to refer
to the approximation to V (Sn, tm) on these grid points.
Next, we discretize the partial differential equation. This is done using the follow-
ing difference quotients for the spatial derivatives
∂V
∂S(Sn, tm) =
V (Sn+1, tm)− V (Sn−1, tm)
2∆S+O
((∆S)2
)10

and
∂2V
∂S2(Sn, tm) =
V (Sn+1, tm)− 2V (Sn, tm) + V (Sn−1, tm)
(∆S)2+O
((∆S)2
).
For the time derivative we choose between either a forward difference of the form
∂V
∂t(Sn, tm) =
V (Sn, tm+1)− V (Sn, tm)
∆t+O (∆t)
or a backward difference of the form
∂V
∂t(Sn, tm) =
V (Sn, tm)− V (Sn, tm−1)
∆t+O (∆t) .
Choosing the backward difference leads to the so-called explicit Euler scheme
V mn − V m−1
n
∆t+
1
2σ2 S2
n
V mn+1 − 2V m
n + V mn−1
(∆S)2+ r Sn
V mn+1 − V m
n−1
2∆S− r Sn = 0.
The scheme is called explicit because the solution vector V m−1n at time tm−1 is given
explicitly in terms of the previous iteration step, i.e.
V m−1n = Amn V
mn−1 +Bm
n Vmn + Cm
n Vmn+1
for the coefficients
Amn =1
2n2σ2∆t− 1
2nr∆t
Bmn = 1− n2σ2∆t− r∆t
Cmn =
1
2n2σ2∆t+
1
2nr∆t.
Alternatively, if we choose to approximate the time derivative using the forward
difference we end up with the so-called implicit Euler scheme
V m+1n − V m
n
∆t+
1
2σ2 S2
n
V mn+1 − 2V m
n + V mn−1
(∆S)2+ r Sn
V mn+1 − V m
n−1
2∆S− r Sn = 0.
This scheme is called implicit because at time step tm the new iterate is only given
implicitly and one needs to solve the following equation to advance
amn Vmn−1 + bmn V
mn + cmn V
mn+1 = V m+1
n .
Here, the coefficients are
amn = −1
2n2σ2∆t+
1
2nr∆t
bmn = 1 + n2σ2∆t+ r∆t
cmn = −1
2n2σ2∆t− 1
2nr∆t.
11
The explicit scheme is less costly in terms of computational effort, but requires
rather strict conditions on the size of the time step for it to be stable. The fully
implicit method is usually unconditionally stable. They both show first order conver-
gence with respect to the time discretization. One can keep the stability but improve
on the convergence properties by moving to the so-called θ-scheme.
The θ-scheme is a weighted average of the explicit and the implicit Euler scheme
with weight factor θ ∈ [0, 1], i.e.
amn Vm−1n−1 + bmn V
m−1n + cmn V
m−1n+1 = Amn V
mn−1 +Bm
n Vmn + Cm
n Vmn+1 (2.10)
with coefficients
Amn =1
2(1− θ) ∆t
(n2σ2 − nr
)Bmn = 1− (1− θ) ∆t
(n2σ2 + r
)Cmn =
1
2(1− θ) ∆t
(n2σ2 + nr
)amn = −1
2θ∆t
(n2σ2 − nr
)bmn = 1 + θ∆t
(n2σ2 + r
)cmn = −1
2θ∆t
(n2σ2 + nr
).
Alternatively, the procedure in (2.10) can be written in matrix form as
M1Vm−1 = M2V
m, (2.11)
where the matrices M1 and M2 are tridiagonal.
Note that in setting θ = 0 or θ = 1 one recovers the explicit or implicit schemes
from above. We usually work with θ = 1/2, a choice for which the method is called
the Crank-Nicolson scheme.
Recall, that in order to find the value of a European put, we start from the terminal
condition
VMn = max (K − Sn, 0)
and iterate backwards in time towards V0 using the θ-scheme (2.11).
An American option can be exercised at any time and thus it must always be worth
at least as much as its immediate payoff g. The immediate payoff of an American
put option is given by gn = max (K − Sn, 0). We incorporate this into the method
12
by dynamic programming and force the option value to be worth at least as much as
its immediate payoff at each iterate, i.e. we modify the algorithm towards
M1Vm−1 = M2V
m (2.12)
Vm−1 = max(g, Vm−1
). (2.13)
To be precise, this only approximates the value of a Bermudan option with possible
exercise date on each ti. In fact, the method has an O (∆t) bias when used to
approximate the value of an American option. For small ∆t this is still a good
approximation for the American case where exercising is possible on a continuous
time scale.
Although, using (2.12) and (2.13) might not the most effective way to price an
American option with a finite difference method, it suffices completely for our pur-
poses. For details on how to improve the scheme (e.g. by Rannacher time stepping)
we refer the reader to the Oxford lecture notes of Dr. Christoph Reisinger on finite
difference methods.
The finite difference method is a powerful pricing algorithm for American options
written on a single underlying. For models depending on multiple stochastic factors,
however, the computational cost of finite difference methods increases drastically to
the point where it becomes prohibitive.
2.4 The Longstaff-Schwartz algorithm
In this section we present the ideas behind the Longstaff-Schwartz algorithm. We
mainly follow the notation used in [Gla04]. The Longstaff-Schwartz algorithm is
used to approximate the value of Bermudan options. In the limit, i.e. for a growing
number of possible exercise dates with shrinking time difference between them, this
is a reasonable approximation for the pricing problem of American options.
Let us denote by Vi(x) the fair value of the option at time ti assuming it has
not been exercised previously. At maturity, this value is determined solely by the
payoff function hm(x). We are ultimately interested in V0(X0) and can get this value
according to the dynamic programming formulation
Vm(x) = hm(x)
Vi−1(x) = max{hi−1(x), E
[Di−1,iVi(x) |Xi−1 = x
]},
13

where Xi is the underlying price at time ti, hi(x) is the exercise value of the option
at time ti and Di−1,i denotes the discount factor for the interval [ti, ti+1]. If we set
Vi(x) = D0,i Vi(x)
hi(x) = D0,ihi(x),
with D0,i = D0,1D1,2 . . . Di−1,i, the formulation can be simplified to
Vm(x) = hm(x) (2.14)
Vi−1(x) = max {hi−1(x), E [Vi(x) |Xi−1 = x ]} . (2.15)
In a first step, the Longstaff-Schwartz algorithm iterates backwards in time to
approximate the continuation values Ci(x) = E [Vi+1(x) |Xi = x ] of the option. It
assumes that Ci(x) can be expanded in terms of an appropriate set of basis functions.
This is certainly true for each element of a Hilbert space because every Hilbert space
has a countable orthonormal basis. The chosen basis is then truncated to a finite
number, R + 1 say, basis functions and the algorithm works with
Ci(x) ≈ Ci(x) =R+1∑l=1
βl φl(x)
The corresponding coefficients βl are found by a least squares regression process,
namely by minimizing
E[(
E [Vi(Xi) |Xi−1 ]− Ci−1(Xi−1))2].
Taking the derivatives with respect to the βl and setting them to zero yields the
following matrix-vector equation
Bφ,φ β = BV,φ,
with
(Bφ,φ)r,s = E [φr(Xi−1)φs(Xi−1)] and (BV,φ)r = E [Vi(Xi)φr(Xi−1)] . (2.16)
In the numerical implementation the expected values in (2.16) are approximated as
Monte Carlo averages over N paths, for example
(Bφ,φ)r,s ≈1
N
N∑n=1
E[φr(X
(n)i−1)φs(X
(n)i−1)]. (2.17)
14

Once the approximate continuation values are known for each time step, the
Longstaff-Schwartz algorithm uses them in a second Monte Carlo step as a deci-
sion guidance on when to exercise. This is done as follows. Starting from expiry and
moving backwards, at each time step i the continuation value of the previous step is
compared to the immediate payoff hi−1(Xi−1). If the immediate payoff is higher than
the continuation value then the algorithm advances to Vi−1 = hi−1(Xi−1), otherwise
the algorithm takes Vi−1 = Vi.
In principle, one can use the first set of path simulations not only to approximate
the continuation values but also to produce an approximate value of the option.
However, this value might be biased high and hence the algorithm is usually split
into two parts. For the second part one can also choose to work forward in time
and stop each path at the first instance when its immediate payoff is higher than
the continuation value. This is more efficient than the backward iteration. For the
purposes of this thesis we will only cite some approximate values computed in the
original paper [LS01] and will not use our own implementation of the algorithm.
15
Chapter 3
Multilevel Monte Carlo method
Onions have layers. Ogres havelayers. Onions have layers. You getit? We both have layers.
Shrek
In this chapter we introduce the basic multilevel Monte Carlo method. We fol-
low the presentation and notation of the original papers [Gil08] and [Gil]. These
two papers started a series of research papers which have shown that the multilevel
Monte Carlo approach is a powerful way to reduce the computational cost in com-
parison to standard Monte Carlo methods when applied to various option pricing
problems. Among the published examples are plain vanilla European options, op-
tions with Asian payoff, digital options, lookback options as well as barrier options.
In [Gil09] the method has been successfully applied to European type basket options,
including lookback, Asian and barrier options. The theoretical analysis of the method
was originally only done for payoffs which are globally Lipschitz, although practical
numerical examples have shown good convergence properties also for digital options
for example. In [GHM09] the authors conduct a deeper numerical analysis of the
method.
3.1 The setup
We want to compute the value of a financial option, whose payoff P = f(St) is given
as a functional of the path of a stochastic process St. We assume that the evolution
of the stochastic process St is governed by the SDE
dSt = a(St, t)dt+ b(St, t)dWt, (3.1)
16
for the time interval 0 < t < T with given initial data S0 and given drift and volatility
terms a(St, t) and b(St, t). Throughout this thesis we will exclusively be working with
geometric Brownian motion, i.e. a(St, t) = rSt and b(St, t) = σSt for constant risk
free rate r and volatility factor σ. However, the multilevel Monte Carlo method is
not restricted to this case and hence we state (3.1) in its more general form.
The payoff of a classical European call option with strike K and expiry T , say,
is given by max (ST −K, 0). In this case the payoff is a simple function only of the
final state ST of the stochastic path. Other options can be highly path dependent,
for example the payoff of a knock-in barrier option naturally depends on the full path
St and not just its final state. Both cases are included in the above setup.
3.2 Basic multilevel decomposition
In order to approximate the value of such an option a standard Monte Carlo method
generates various discrete path simulations of (3.1) with a certain time step size,
evaluates the payoff for each of those paths and computes the expected value as
an average. The chosen step size strongly depends on the desired accuracy of the
computed solution. In fact, the smaller the step size the better the results.
Instead of sticking to one discretisation time step the multilevel Monte Carlo
method uses path simulations corresponding to various nested time grids. The idea
is to reduce the variance of the finest grid approximations using information from
coarser levels in a way that minimizes the overall computational cost.
To be more precise, suppose we are given different time discretisations with step
sizes hl = 2−lT for l = 0 . . . L. For any given Brownian path Wt we denote by P the
payoff of the option and by Pl its numerical approximation using a discretisation with
timestep hl. By linearity we can decompose the expected value on the finest level as
follows
E[PL] = E[P0] +L∑l=1
E[Pl − Pl−1]. (3.2)
In fact, the decomposition (3.2) can (and in our case will) be made a bit more general,
in the sense that the numerical approximation Pl does not need to be the same for
the correction terms E[Pl − Pl−1] and E[Pl+1 − Pl]. Instead, we distinguish between
two possibly different numerical approximations Pl,f and Pl,c with step size hl and
write
E[PL] = E[P0] +L∑l=1
E[Pl,f − Pl−1,c]. (3.3)
17
As long as Pl,f and Pl,c have identical expectation, i.e. E[Pl,f ] = E[Pl,c], the sum is
still telescoping and (3.3) is correct. The additional subscripts f and c were chosen
to resemble the labels fine and coarse for an approximation on any given level l > 0.
The multilevel Monte Carlo method is based on the decomposition in (3.3) and
independently evaluates each expected value on the right hand side of the equation
in a way that minimizes the total variance for a given computational cost. This is
done as follows.
3.3 Monte Carlo estimators
We denote by Y0 an estimator for E[P0] which is based on N0 sample paths. Similarly,
for l > 0 we denote by Yl independent estimators for E[Pl,f − Pl−1,c], each one using
Nl sample paths. The estimators Yl usually are computed as means taken over Nl
sample paths, i.e. for l > 0 the estimator has the form
Yl =1
Nl
Nl∑i=1
(P
(i)l,f − P
(i)l−1,c
). (3.4)
Here, the trick is that P(i)l,f and P
(i)l−1,c are constructed using different time steps but
the same Brownian path.
We combine the Yl and get the overall estimator
Y =L∑l=0
Yl (3.5)
for the option price. Note that Y is in fact a feasible estimator if the Yl are unbiased
because then we have
E[Y]
= E[Y0] +L∑l=1
E[Yl
]= E[P0] +
L∑l=1
E[Pl,f − Pl−1,c
]= E
[PL
].
Let us take a closer look at the mean squared error of the estimator Y .
E[(Y − E [P ]
)2]
= E[(Y − E
[Y])2]
+(E[Y]− E [P ]
)2
= E[(Y − E
[Y])2]
+(E[PL
]− E [P ]
)2
= V[Y]
+(E[PL
]− E [P ]
)2
. (3.6)
18

The first term in (3.6) is just the variance of Y and since all the Yl are independent
it can be written as
V[Y]
= V
[L∑l=0
Yl
]=
L∑l=0
V[Yl
]=
L∑l=0
N−1l Vl, (3.7)
where Vl is the variance of a single path for estimator Yl. Equation (3.7) is one of the
starting points of the multilevel algorithm as will be shown in section 3.5.
The second term in (3.6) corresponds to how well the payoff can be approximated
on the finest grid.
3.4 The multilevel algorithm
In this section we present the pseudocode for the actual multilevel algorithm as de-
scribed in the original paper [Gil08]. The original algorithm takes the desired accuracy
ε as an input and computes the required maximal level of refinement L on the fly.
This is done based on a heuristic convergence criterion, but has proven to be very
effective numerically in the multilevel Monte Carlo research literature.
1. Start with L = 0.
2. Estimate VL using an intial NL samples.
3. Define optimal Nl for l = 0, . . . , L.
4. Evaluate extra samples as needed for new Nl.
5. If L ≥ 2, test for convergence.
6. If L < 2 or not converged, set L = L+ 1 and go back to step 2.
The convergence test in step 5 is usually based on the following criterion
max
{1
2
∣∣∣YL−1
∣∣∣ , ∣∣∣YL∣∣∣} <ε√2.
3.5 Complexity and convergence theorem
In this section we first give a brief and somewhat handwavy explanation of the total
cost of the multilevel Monte Carlo algorithm to achieve a certain accuracy of order ε.
Then we cite the main theorem from [Gil08] which rigorously explains the convergence
and complexity of the multilevel Monte Carlo algorithm for various cases.
19

The Yl are constructed from Nl paths and the computational cost of each path
is proportional to h−1l . Hence, the cost of the combined estimator is proportional
to∑L
l=0Nlh−1l . As mentioned before, we want to minimize the variance in (3.7) for
a given cost, i.e. subject to the contraint∑L
l=0Nlh−1l ≡ Const. Treating Nl as a
continuous variable this minimization can easily be done using a Lagrange multi-
plier approach. As a result one finds that the variance is minimized if Nl is chosen
proportional to√Vlhl.
Assume now that the single variance Vl is of order O(hl) (this corresponds to
β = 1 in Theorem 3.5.1). By what we just saw, the optimal choice for Nl would then
also be of order O(hl). If one chooses Nl = O(ε−2 Lhl), the variance of Y will be
V[Y]
= O(ε2). If the weak convergence of the estimator is of order O(hL) = O(2−L)
on the finest level, then by choosing L = O( log(ε)log(2)
) we can make the second term in
(3.6) order O(ε2). Thus, for a total cost of
L∑l=0
Nlh−1l =
L∑l=0
O(ε−2 Lhl)h−1l = O(ε−2 L2) = O(ε−2 (log ε)2)
the mean squared error E[(Y − E [P ]
)2]
would be of order O(ε2). A standard Monte
Carlo method has a cost of O(ε−3) to achieve the same accuracy. And thus the mul-
tilevel Monte Carlo algorithm brings about a drastic improvement in computational
cost.
The full complexity and convergence properties of the multilevel Monte Carlo
method are generalized and summarized in Theorem 3.5.1.
Theorem 3.5.1 (see [Gil08]) Let P denote a functional of the solution of the SDE
(3.1) for a given Brownian path Wt, and let Pl denote the corresponding approximation
using a numerical discretisation with timestep hl = 2−lT .
If there exist independent estimators Yl based on Nl Monte Carlo samples, and
positive constants α ≥ 1/2, β, c1, c2, c3 such that
(i) |E[Pl − P ] | ≤ c1 hαl
(ii) E[Yl] =
{E[P0], l = 0
E[Pl − Pl−1], l > 0
(iii) V[Yl
]≤ c2N
−ll hβl
(iv) the computational complexity Cl of Yl is bounded by Cl ≤ c3Nl h−1l ,
20

then there exists a constant c4 such that for any ε < e−1 there are values L and Nl
for which the multilevel estimator Y =∑L
l=0 Yl has mean-square error with bound
MSE ≡ E[(Y − E [P ]
)2]< ε2,
with a computational complexity bound
C ≤
c4 ε
−2, β > 1
c4 ε−2 (log ε)2 , β = 1
c4 ε−2−(1−β)/α, 0 < β < 1.
21
Chapter 4
Numerical implementation for anAmerican put option under apreset exercise strategy
Any general method for pricingAmerican options by simulationrequires substantial computationaleffort
Paul Glasserman in [Gla04]
The estimators Yl used for the multilevel Monte Carlo method need to be con-
structed carefully in order to avoid the introduction of an undesired bias in the com-
puted solution. In (3.4) we have already given the general form of Yl. So far we have
not, however, described the numerical approximations Pl,c and Pl,f in any detail. In
general, these will depend on the type of application. Recall that they both should
be computed based on a time discretisation with step size hl. For a European call
option we could for example just simulate a path with this step size using an Euler-
Maruyama scheme and evaluate the payoff at the final timestep for both Pl,c and
Pl,f . It gets more complicated for path dependent options where the two quantities
no longer need to be identical. In a sense we have more information about the path
available to compute Pl,c than Pl,f , because we compute Pl,c at the same time as we
compute Pl+1,f , an approximation using a finer timestep. For the remainder of this
thesis we will now focus on the valuation of an American put option. In what follows
we will describe the construction of the corresponding estimators.
22

4.1 Discretizing the SDE
The discretization of the SDE (3.1) is crucial. Its convergence properties affect the
overall variance and therefore the overall convergence of the multilevel algorithm. In
fact, the chosen discretisation scheme for the simulated path strongly influences how
the discretised payoff function is constructed and therefore enters into Theorem 3.5.1
through the parameters α and β.
Suppose we are given a time discretisation of the interval [0, T ] into timesteps
0 = t0 < t1 < · · · < tN = T . The most intuitive way to discretize the scalar SDE
(3.1) is the Euler-Maruyama scheme
Sn+1 = Sn + a(Sn, tn) (tn+1 − tn) + b(Sn, tn)∆Wn, (4.1)
where the initial state S0 = S0 is known, and where Sn indicates the value of the
simulated path at time tn. Moreover, ∆Wn = Wtn+1 −Wtn is the Brownian incre-
ment between timesteps tn and tn+1. Under some weak smoothness conditions on the
functions a(S, t) and b(S, t) the Euler-Maruyama scheme is known to be weakly con-
vergent with order one and strongly convergent with order one half. A more refined
discretisation can in some cases be achieved using the so-called Milstein scheme. The
Milstein scheme approximates the scalar SDE (3.1) via
Sn+1 = Sn + a (tn+1 − tn) + b∆Wn +1
2b∂b
∂S
(∆W 2
n − (tn+1 − tn)), (4.2)
where S0 again is the inital state of the path, ∆Wn is the Brownian increment as
before and the functions a, b and ∂b∂S
are evaluated at (Sn, tn). The Milstein scheme
has strong and weak convergence order both equal to one.
4.1.1 Exact path simulation for geometric Brownian motion
Throughout this thesis we assume that the underlying price process is driven by
geometric Brownian motion, i.e. that the SDE (3.1) takes the form
dSt = r St dt + σ St dWt (4.3)
with constant r and σ. If we consider the process Xt = log(St), Ito’s lemma tells us
that
dXt =
(r − σ2
2
)dt+ σ dWt,
23
for which both the above discretisation schemes coincide and yield exact path values
at the discrete points, i.e.
Xn+1 = Xn +
(r − σ2
2
)(tn+1 − tn) + σ∆Wn
= X0 +
(r − σ2
2
) n∑i=0
(ti+1 − ti) + σ
n∑i=0
∆Wi
= X0 +
(r − σ2
2
)tn+1 + σWn+1
= X(tn+1).
For the purpose of this thesis we will take advantage of the logarithmic transformation
and simulate the path Xt (and thus St) exactly at the discrete points.
4.2 Estimators for a given exercise strategy
In what follows we will focus on the example of an American put option under a
specified exercise strategy.
Suppose we are given an exercise strategy in terms of the exercise region E . Ac-
cording to the mapping implied by (2.6) the exercise region translates into a stopping
time
τ = inf{t ≥ 0 : St ∈ E}.
We are interested in computing the value of an American put option under this
exercise strategy. This is equivalent to computing the expected value E [Pτ ], where
the discounted payoff function is
Pτ = e−r τ (K − Sτ )+1{τ<T} + e−r T (K − ST )+
1{τ≥T}. (4.4)
Here, the notation (K − Sτ )+ is used to denote max (K − Sτ , 0) and 1E is the indica-
tor function of the event E. Note that, in contrast to (2.2) and the equations based
thereon, in (4.4) we have incorporated the discount factor directly into Pτ .
For a given time grid 0 = t0 < t1 < . . . < tN = T and the corresponding discrete
path approximations {Si} the naive way to discretise the payoff Pτ would simply
check at each time step whether or not the exercise region has been reached, i.e. we
would work with τ = inf{ti : Si ∈ E}. But even if we can simulate the path values at
the discrete time steps exactly, this is rather inaccurate, because the path might cross
a barrier between two sample points even if the sample points suggest otherwise. So
24

convergence would be very slow. We follow an improved approach which is commonly
used in the framework of continuously monitored barriers.
In case of an American put on a single underlying the exercise region and the
hold region of the option are separated by a continuous function B(t), also called
the exercise boundary. In fact in this case, the hold region lies above B(t) and the
exercise region lies below.
We denote by pi the probability that the sample path drops below the exercise
boundary (i.e enters the exercise region) in the interval [ti, ti+1] conditioned on the
values of the sampled path Si and Si+1 at the interval end points, i.e.
pi = P(
St ≤ B(t)for some t ∈ [ti, ti+1]
| Si, Si+1
)Unfortunately, this probability can only be computed analytically for few special
boundary shapes. It can be computed, however, for a linear exercise boundary if
the stochastic process has constant drift and diffusion coefficients. If the exercise
boundary was in fact linear between ti and ti+1 with end values B(ti) and B(ti+1)
and if we modelled the sample path as a Brownian bridge with constant drift r Si
and constant diffusion coefficient σ Si in the interval [ti, ti+1], then the probability pi
would equal (see for example [Huh07] or [BN05])
exp
(−2 (Si −B(ti))
+ (Si+1 −B(ti+1))+
(ti+1 − ti)σ2 S2i
). (4.5)
For our application, however, we can do even better. The path process St follows
a geometric Brownian motion and as explained in section 4.1.1 we can simulate the
process Xt = log(St) exactly. Moreover, the drift(r − σ2
2
)and diffusion σ coefficients
of Xt are indeed constant. So instead of using (4.5), we compute the probability based
on the pathXt. This is possible because the logarithm is strictly increasing for positive
arguments. Hence, if the exercise boundary is positive on the subinterval [ti, ti+1] we
can write
pi = P(
St ≤ B(t)for some t ∈ [ti, ti+1]
| Si, Si+1
)= P
(Xt ≤ log (B(t))
for some t ∈ [ti, ti+1]| Xi = log(Si), Xi+1 = log(Si+1)
).
25

Consequently, if both B(ti) and B(ti+1) are positive, there holds
pi = exp
−2(
log(Si
)− log(B(ti))
)+ (log(Si+1
)− log(B(ti+1))
)+
(ti+1 − ti)σ2
= exp
−2(
log(Si
/B(ti)
)+ (log(Si+1
/B(ti+1)
)+
(ti+1 − ti)σ2
(4.6)
In using (4.6) the only potentially remaining source of error is if the exercise boundary
is not linear. And although this linearity assumption about the exercise boundary
will in most cases not be fullfilled we work with (4.6) as an approximate value for the
hitting probability in the interval [ti, ti+1].
Recall that we want to compute the expected value
E [Pτ ] = E[E[Pτ |{Si}
]].
Thus, we concentrate on the conditional expectation E[Pτ |{Si}
]. The first indicator
function in (4.4) can be split up by subintervals
1{τ<T} =N−1∑i=1
1{τ∈[ti,ti+1]}.
This enables us to approximate
Pτ =N−1∑i=1
exp (−r τ) (K − Sτ )+1{τ∈[ti,ti+1]} + e−r T (K − ST )+
1{τ≥T}
≈N−1∑i=1
exp (−r τi) (K − Sτi)+1{τ∈[ti,ti+1]} + e−r T (K − ST )+
1{τ≥T}
for some approximate value τi of the actual crossing time. In our implementation we
choose the interval midpoint τi = ti+ti+1
2. At the crossing point τi the path touches
the barrier and we implement
Sτi = B(τi) = b
(ti + ti+1
2
).
26

The conditional expectation can then be approximated by
E[Pτ |{Si}
]≈
N−1∑i=1
exp (−r τi) (K − Sτi)+ E
[1{τ∈[ti,ti+1]}|{Si}
]+ exp (−r T ) (K − ST )+ E
[1{τ≥T}|{Si}
]=
N−1∑i=1
exp (−r τi) (K − Sτi)+
(pi
i−1∏j=0
(1− pj)
)
+ exp (−r T ) (K − ST )+
(N−1∏j=0
(1− pj)
)(4.7)
The estimator Pl,f from Equation (3.3) is contructed according to (4.7) using the
probabilities pi according to (4.5).
For the coarse path estimator Pl,c we work with an additional idea used in [Gil]
for path dependent payoffs. Recall, that the estimator corresponds to a step size hl
and is computed at the same time as Pl+1,f . On the interval [ti, ti+1] of length hl
we simulate an additional midpoint Sn+ 12
based on a Brownian bridge construction.
The exact definition depends on the chosen time discretization and will be given in
sections 4.3.2 and 4.3.3. We then look at the two probabilities that the sample path
drops below the barrier on either side of the midpoint conditioned on the sampled
values, i.e.
exp
(−2 (Si −B(ti))
+ (Si+ 12−Bavg)
+
(ti+ 12− ti)σ2 S2
i
)(4.8)
and
exp
(−2 (Si+ 1
2−Bavg)
+(Si+1 −B(ti+1))+
(ti+1 − ti+ 12)σ2 S2
i
). (4.9)
The exact value of Bavg again depends on the chosen time discretization and will be
given along with the definition of Sn+ 12
in sections 4.3.2 and 4.3.3. In both probability
formulae there is a factor of Si in the denominator. This stems from the fact that the
underlying Brownian bridge is assumed to have the same volatility coefficient σ Si on
the entire interval [ti, ti+1]. As before, we can do better than this by moving to the
27

transformed path Xt = log(St). Instead of (4.8) and (4.9) we use
pi,1 = exp
−2(
log(Si
)− log(B(ti))
)+ (log(Si+ 1
2
)− log(Bavg)
)+
(ti+ 12− ti)σ2
(4.10)
pi,2 = exp
−2(
log(Si+ 1
2
)− log(Bavg)
)+ (log(Si+1
)− log(B(ti+1))
)+
(ti+1 − ti+ 12)σ2
.
(4.11)
The probability that the path crosses the exercise boundary in the entire interval
is now easily computed via
pi = (1− (1− pi,1) (1− pi,2)) . (4.12)
We construct the coarse estimator Pl,c according to (4.7) using the probabilities pi
from (4.12) .
4.3 Numerical example
As a numerical example we apply the algorithm to an American put option under the
exercise strategy given by the exercise boundary B(t) = K − 0.8√T − t. Our results
are presented in the spirit of [Gil08] and [Gil] and were obtained using the parameters
T = 1.0, K = 1.0, S0 = 1.0, r = 0.05 and σ = 0.2.
4.3.1 A brief aside on Brownian bridge construction andBrownian interpolation
Suppose Xt is a simple Brownian motion with drift µ and diffusion coefficient ρ, i.e.
dXt = µ dt+ ρ dWt =⇒ Xt = µ t+ ρWt.
Suppose further that we have sampled St at times t1 < t2, say Xt1 = a and Xt2 = b.
Then the conditional distribution of Xt at time t = t1 + λ (t2 − t1) for 0 < λ < 1 is
a normal distribution (see e.g. [Gla04]) with mean
a+t− t1t2 − t1
(b− a)
and variance
ρ2 (t2 − t) (t− t1)
t2 − t1.
28

Moreover, if we combine the equations for X(t), X(tn) and X(tn+1) we find that (see
e.g. [Gil09])
Xt = Xtn + λ{Xtn+1 −Xtn
}+ ρ {Wt −Wn − λ (Wn+1 −Wn)} . (4.13)
This means that Xt deviates from a linear interpolation if and only if Wt deviates
from a straight line interpolation.
4.3.2 Equidistant time grids
As a first numerical example we implemented the algorithm using equidistant time
grids. To be more precise, on level l = 1 . . . L we partition the interval [0, T ] using
2l+1 equidistant grid points tn = nT / 2l for n = 0, . . . , 2l. In this case the additional
midpoint Sn+ 12
constructed for the approximation Pl,c actually corresponds to the true
midpoint (tn + tn+1) / 2 of the interval. As for the probabilities in (4.6), (4.10) and
(4.11) we use the process Xt = log(St) and its discretization. In accordance with
(4.13) for λ = 1/2 and ρ = σ we compute
log(Sn+ 1
2
):= Xn+ 1
2:=
1
2
(Xn + Xn+1 − σDn
),
where Dn =(Wn+1 −Wn+ 1
2
)−(Wn+ 1
2−Wn
)is a N (0, hl) variable computed based
on the Brownian increments from the finer path simulation with step size hl+1 = hl / 2.
The definition of Bavg from (4.8) and (4.9) in this case is
log (Bavg) =log (B(ti)) + log (B(ti+1))
2.
Figure 4.1 shows the results. In the top left plot the behaviour of the variance of
both Pl,f and Pl,f − Pl−1,c can be seen. The slope of the latter seems to converge to a
value slightly higher than −32, i.e. Vl = O(h
3/2−εl ) which in the language of Theorem
3.5.1 corresponds to a value of β ≈ 3/2 − ε for some small ε. In the top right plot
we see that E[Pl,f − Pl−1,c
]is approximately of order O(hl) and hence α = 1. The
expected value E[Pl,f
]seems to be biased high for the coarser levels. This bias is
probably due to the fact that the linear approximation of the logarithm of the exercise
boundary is too rough for the coarse levels.
The bottom two plots show the behaviour of the multilevel algorithm for various
levels of desired accuracy ε. The bottom left plot shows the values Nl for l = 0, . . . L.
Recall that the optimal value Nl was to be chosen proportionally to√Vlhl. So for
decreasing Vl and hl the optimal Nl is decreasing for larger l. The bottom right plot
29

shows ε2C where the computational cost C of the multilevel Monte Carlo method is
computed according to
C =L∑l=0
Nl h−1l =
L∑l=0
Nl 2l. (4.14)
In fact the bottom right plot supports the theoretical result from Theorem 3.5.1. For
values α = 1 and β ≈ 3/2− ε the computational cost is proportional to ε−2.
30

0 2 4 6 8 10 12−18
−16
−14
−12
−10
−8
−6
−4
−2
0
l
log
2 v
ariance
Pl
Pl− P
l−1
0 2 4 6 8 10 12−18
−16
−14
−12
−10
−8
−6
−4
−2
0
l
log
2 |m
ean|
Pl
Pl− P
l−1
0 2 4 6 8 10 1210
3
104
105
106
107
108
l
Nl
ε=0.0001
ε=0.0002
ε=0.0005
ε=0.001
ε=0.002
10−4
10−3
10−2
100
101
ε
ε2 C
ost
MLMC
Figure 4.1: American put with exercise boundary B(t) = K−0.8√T − t and equidis-
tant time grids. This exercise boundary is a member of the parametric family whichwe will use later in our optimization scheme.
4.3.3 Time discretization in transformed coordinates
The chosen exercise boundary (as well as the true exercise boundary) has a square
root behaviour at expiry T , see e.g. [KK98] and section 5.1. In order to better account
for this behaviour we now choose a different discretization scheme for the time grids.
31

On level l = 1, . . . , L we set yn =√T(2l − n
)/ 2l for n = 0, . . . , 2l. These are
used to define
tn = t(l)n = T − y2n = T
(1−
(2l − n
)2
(2l)2
)for n = 0, . . . , 2l.
We note that 0 = t(l)0 < . . . < t
(l)
2l= T . The grids are nested, i.e. the finer grids include
all grid points belonging to coarser levels since t(l+1)2n = t
(l)n . The grid refinement is
visualized in Figure 4.2 for the first few levels and T = 1.
0 0.25 0.5 0.75 1
0
1
2
3
4
t
level
non−uniform grid for different levels on [0,1]
Figure 4.2: Grid refinement for the first few levels
The midpoint Sn+ 12
on the interval [t(l)n , t
(l)n+1] used for the approximation Pl,c is
contructed corresponding to the nonuniform grid. It corresponds to the time t(l+1)2n+1 ∈
[t(l)n , t
(l)n+1], i.e. the next refinement step of the interval. We set
λ =t(l+1)2n+1 − t
(l)n
t(l)n+1 − t
(l)n
.
32

Then, again in accordance with (4.13) with ρ = σ, the midpoint is computed via
log(Sn+ 1
2
):= Xn+ 1
2:= Xn + λ
(Xn+1 − Xn
)+ σ
{Wn+ 1
2−Wn − λ (Wn+1 −Wn)
}.
As before, the Brownian increments Wn+ 12−Wn and Wn+1 −Wn are taken from the
calculations on the next finer level. The value Bavg from (4.8) and (4.9) is based on
log (Bavg) = log (B(tn)) + λ {log (B(tn+1))− log (B(tn))} .
Figure 4.3 shows the numerical results. As before, the top left plot shows the be-
haviour of the variance of both Pl,f and Pl,f − Pl−1,c. The slope of the latter seems
to be close to 2, i.e. Vl = O(h2l ). In the language of Theorem 3.5.1 this corresponds
to a value of β ≈ 2 and is a considerable improvement compared to the equidistant
time grid case. In the top right plot we see that E[Pl,f − Pl−1,c
]is approximately of
order O(h3/2l ) and hence α ≈ 3/2, again a considerable improvement compared to the
equidistant case.
The bottom two plots show the behaviour of the multilevel algorithm for various
levels of desired accuracy ε. The bottom left plot shows the values Nl for l = 0, . . . L.
We observe similar behaviour as before with slightly lower values for the Nl, which
means a lower overall cost. The bottom right plot again shows the scaled cost ε2C
for the multilevel Monte Carlo method and a standard Monte Carlo approach, i.e.
C represents the computational cost in both cases. For the multilevel Monte Carlo
method the computational cost C is again computed according to (4.14). For the
standard Monte Carlo approach the computational cost has been estimated as
C =2VL 2L
ε2.
Again, the plot supports the theoretical result from Theorem 3.5.1. For values α ≈3/2 and β ≈ 2 the multilevel computational cost is proportional to ε−2.
33

0 2 4 6 8−22
−20
−18
−16
−14
−12
−10
−8
−6
−4
−2
0
l
log
2 v
ariance
Pl
Pl− P
l−1
0 2 4 6 8−18
−16
−14
−12
−10
−8
−6
−4
−2
0
l
log
2 |m
ean|
Pl
Pl− P
l−1
0 2 4 6 810
3
104
105
106
107
108
l
Nl
ε=0.0001
ε=0.0002
ε=0.0005
ε=0.001
ε=0.002
10−4
10−3
10−2
100
101
ε
ε2 C
ost
MLMC
MC
Figure 4.3: American put with exercise boundary B(t) = K − 0.8√T − t and non-
equidistant time grids. This exercise boundary is a member of the parametric familywhich we will use later in our optimization scheme.
34

Chapter 5
Optimizing exercise strategies
Prius quam incipias, consulto et,ubi consulueris, mature facto opusesBefore you act consider; when youhave considered, tis fully time to act
Sallust
In this section we pick up on the problem formulation presented in Equation (2.8).
Recall that we want to solve the optimization problem
supθ∈Θ
E[e−τ(θ) rPτ(θ)
(Sτ(θ)
)], (5.1)
where the θ ∈ Θ ⊆ Rk parametrize all admissible exercise regions Eθ or equivalently
all admissible exercise boundaries Bθ(t). The translation from an exercise region to a
stopping time τ(θ) is done via (2.6). Note that θ can be vector valued. For the sake
of better readability we cut back the notation in (5.1) and instead write
supθ∈Θ
E[Pτ(θ)
], (5.2)
where from now on we take Pτ to be the discounted payoff (i.e. the discount factor in
(5.1) gets absorbed into the payoff). Moreover, we suppress the argument Sτ of the
payoff as long as this remains unambiguous. In alignment with standard optimization
jargon we refer to E[Pτ(θ)
]as the objective function of the maximization problem
(5.2).
In order for the supremum in (5.2) to be an acceptable approximation of the
true fair value of the original option the parameter forms Eθ for the feasible exercise
strategies need to replicate the true exercise strategy as closely as possible. In the
next section we discuss some properties of the exercise boundary of an American put
option.
35
5.1 Parametric forms for the exercise boundary of
an American put option
The goal of this thesis is to show how the multilevel Monte Carlo method can be used
for pricing American options. As a major test case we restrict ourselves to the case
of an American put option with a single underlying and no dividends.
There is an abundance of literature touching the exact and approximate compu-
tation of the optimal exercise boundary for an American put option, see for example
[LPH00], [CC08], [CJR92], [BAW87]. It would, however, defeat the purpose of this
thesis if we took a parametric form of the exercise boundary which requires too much
a priori information on the actual shape of the exercise boundary. Such information
might not necessarily be available for more complex options with more than one un-
derlying asset for example. Nonetheless, we choose to use some information about
the asymptotic behaviour of the exercise boundary close to expiry T to our bene-
fit. It is obvious that the optimal exercise boundary must reach the strike at expiry.
Moreover, close to expiry, i.e. for T − t � 1, the optimal exercise boundary of an
American put option with strike K behaves like
B∗(t) ∼ K − c√T − t (5.3)
with an appropriate constant c, see e.g. [KK98]). In other words, the exercise bound-
ary displays a square root behaviour at expiry. In order to account for this behaviour
we choose the parametric form
Bθ(t) = K − pθ(√
T − t)
(5.4)
where pθ(x) is a polynomial which satisfies pθ(0) = 0. To be more precise, we floor
the exercise boundary at 0, i.e. we take
Bθ(t) = max(K − pθ
(√T − t
), 0)
Figure 5.1 shows the situation for the polynomial pθ(x) = θ x, i.e. when the exercise
boundary is parameterized with one degree of freedom. For various levels of accuracy
ε we plot the expected discounted payoff of an at-the-money option with parameters
T = 1.0, K = 1.0, S0 = 1.0, r = 0.05 and σ = 0.2 as a function of θ. The expected
discounted payoff was computed using the multilevel Monte Carlo algorithm with the
chosen accuracy. The most accurate computation depicted in the bottom right plot
shows that the expected discounted payoff has a maximum somewhere in the interval
θ ∈ [0.2, 0.3]. An important remark we want to make at this point is that we are
36

dealing with a noisy objective function in the maximization problem (5.2) since it is
computed as a Monte Carlo approximation with a given accuracy. We note that the
choice θ = 0 implies an exercise boundary Bθ(t) = K. Therefore, θ = 0 yields zero
payoff for an exercised put struck at K. For the second extreme case θ → ∞ the
chance of early exercise decreases more and more, and in the limit we deal with the
European option case.
Figure 5.2 shows the situation for the same option parameters and the degree two
polynomial pθ(x) = θ1 x+θ2 x2 for various values of θ = (θ1, θ2) ∈ [−1, 1]2. For each of
the values (θ1, θ2), the expected discounted payoff has been computed with accuracy
ε = 10−4. At this level of accuracy, the noisy behaviour of the objective function is
barely visible. We computed the expected discounted payoff on an equidistant 60×60
grid. On this grid the maximum value of the objective function was 0.0609.
0 0.2 0.4 0.6 0.8 10
0.02
0.04
0.06
0.08
θ
E[P] f or ε = 0.01
0 0.2 0.4 0.6 0.8 10
0.02
0.04
0.06
0.08
θ
E[P] f or ε = 0.001
0 0.2 0.4 0.6 0.8 10
0.02
0.04
0.06
0.08
θ
E[P] f or ε = 0.0005
0 0.2 0.4 0.6 0.8 10
0.02
0.04
0.06
0.08
θ
E[P] f or ε = 0.0001
Figure 5.1: Value of an American put with exercise boundary Bθ(t) = K − θ√T − t
for various levels of accuracy.
37

−1
−0.5
0
0.5
1
−1
−0.5
0
0.5
1
−0.01
0
0.01
0.02
0.03
0.04
0.05
0.06
0.07
θ 2
θ 1
E[P
]
Figure 5.2: Value of an American put with exercise boundary Bθ(t) = K−θ1
√T − t−
θ2 (T − t).
5.2 Stochastic approximation
As mentioned before we only have access to noisy measurements of the objective
function in the optimization problem (5.2). This means that standard deterministic
optimization algorithms are unsuitable for the problem. Such algorithms usually re-
quire exact knowledge of the objective function without noise. Some of them even
work with the exact gradient and maybe the exact Hessian of the objective function.
The presence of noise in our objective function means that our problem falls into
the broad framework of stochastic optimization. Possible algorithms to tackle our
optimization problem include - among others - simulated annealing or genetic algo-
rithms. Simulated annealing was introduced in [KGV83] and is a probabilistic search
algorithm inspired by and mimicking annealing processes from metallurgy. Genetic
algorithms are another class of heuristic search algorithms loosely mimicking processes
from evolution theory, see for example [GHM04] for a brief introduction. We choose
38

to employ a so-called stochastic approximation approach and will explain ingredients
in this section.
Stochastic approximation has been introduced in the seminal paper by Robbins
and Monro [RM51] as a root finding method when only noisy measurements of the
underlying function are available. Kiefer and Wolfowitz in [KW52] and [Wol52] ap-
plied the ideas to a minimization or maximization of a unimodal regression function.
We now present the basic method, loosely following the exposure in [GHM04, chapter
II.6]. Keeping in mind our application, we present the method on the background of
a maximization problem.
We want to maximize the utility function (objective function)
U(θ) := E[Pτ(θ)
]over some feasible set, i.e. for θ ∈ Θ ⊆ Rp. The objective function U(θ) is assumed
to be differentiable and to have a unique maximum at θ∗. We cannot observe U(θ)
directly but only through
y(θ) = U(θ) + η(θ),
where η(θ) is a small noise term. These noise terms η(θ) are assumed to be indepen-
dent and identically distributed.
At every local extremal point of the objective function its gradient must be zero,
i.e. there holds
g(θ∗) :=∂U
∂θ(θ∗) = 0. (5.5)
This is of course only a necessary and not a sufficient condition for a maximum.
Nonetheless, stochastic approximation tries to solve (5.5).
Similar to many deterministic optimization algorithms, stochastic approximation
starts from some initial guess θ0 and works as an iterative scheme of the form
θk+1 = θk + ak gk
(θk
). (5.6)
Here, {ak} is a sequence of positive numbers and the gk
(θk
)approximate the gradient
of the objective function at the current iterate. There are many possible choices
for gk
(θk
). We work with the so-called Finite Difference Stochastic Approximation
(FDSA) and compute the gradient approximations using centered difference stencils
39

of the form
gk
(θk
)=
y(θk+ck ξ1)−y(θk−ck ξ1)
2 ck...
y(θk+ck ξp)−y(θk−ck ξp)2 ck
. (5.7)
In this definition of the gradient estimate ξj ∈ Rp denotes the j−th unit vector. The
sequence {ck} consists of positive numbers which need to be chosen appropriately. We
note that (5.7) requires 2 p function evaluations of y at each iteration step. This can
get prohibitively expensive for large multidimensional problems, i.e. for large p. In
our simple test case we work with exercise boundaries which are parametrized by one
degree of freedom only, and hence this is not a problem for us. If one moved to a larger
parameter space, then (5.7) could be replaced by a certain difference quotient which
only requires two evaluations of the objective function irrespective of the number of
parameters p. This is accomplished by the so-called simultaneous pertubation gradient
approximation, see for example [Spa92].
In our implementation of the gradient estimates (5.7) we use the same Brownian
paths for the computation of all the plus and minus bumps, i.e. for the computation of
all y(θk + ck ξl
)and y
(θk − ck ξl
). This is done to keep the variance of the gradient
estimate as low as possible and to avoid amplification of the inherent noise.
In order to prove convergence of the FDSA, the sequence {ak, ck} must satisfy the
following criteria.
1. ak, ck > 0,
2. ak → 0 and ck → 0 as k →∞,
3.∑∞
k=0 ak =∞
4.∑∞
k=0 a2k / c
2k <∞.
Under these assumptions the FDSA algorithm can be shown to converge to θ∗ in
probability, i.e. θk −→ θ∗ as k →∞ almost surely.
The performance of the FDSA, however, critically depends on the choice of the
{ak, ck}. Unfortunately, there is no general set of parameters which will guarantee
good performance for all possible applications. In [GHM04] the authors mention
common forms for ak and ck. In fact, they suggest
ak =a
(k + 1 + A)αand ck =
c
(k + 1)γ, (5.8)
40
for strictly positive a, c, α, γ and A ≥ 0. We followed this suggestion in our imple-
mentation.
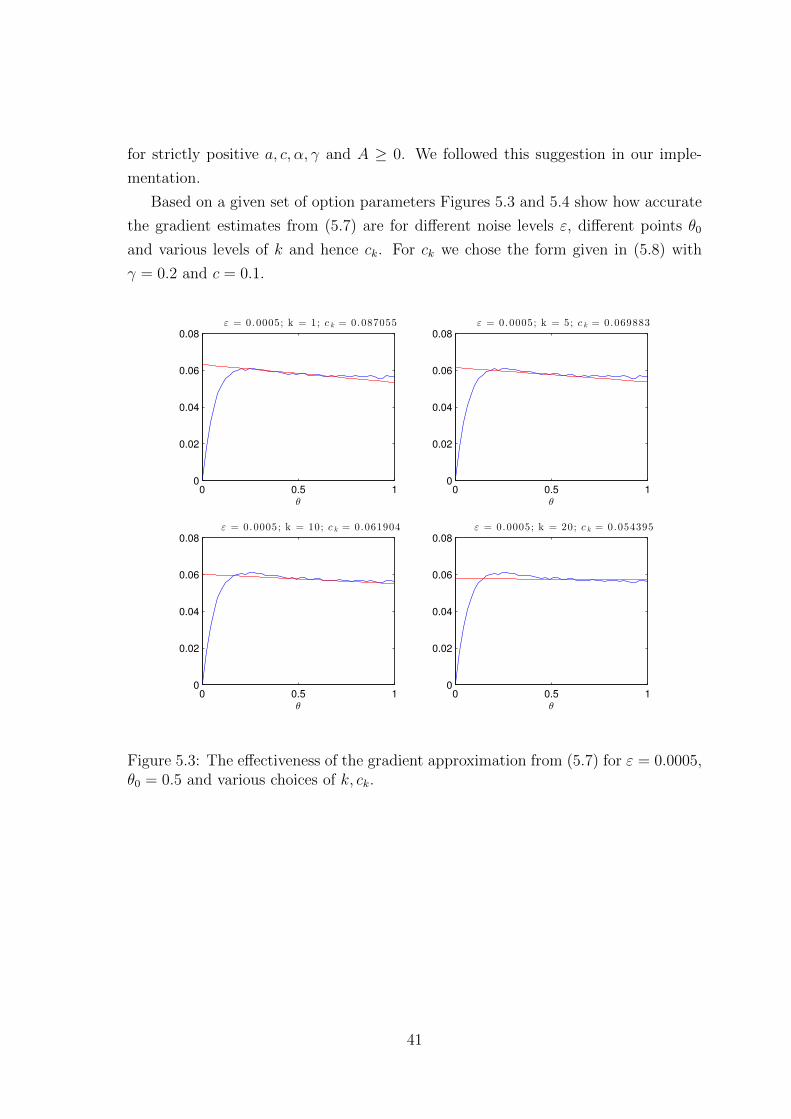
Based on a given set of option parameters Figures 5.3 and 5.4 show how accurate
the gradient estimates from (5.7) are for different noise levels ε, different points θ0
and various levels of k and hence ck. For ck we chose the form given in (5.8) with
γ = 0.2 and c = 0.1.
0 0.5 10
0.02
0.04
0.06
0.08
ε = 0.0005; k = 1; c k = 0.087055
θ
0 0.5 10
0.02
0.04
0.06
0.08
ε = 0.0005; k = 5; c k = 0.069883
θ
0 0.5 10
0.02
0.04
0.06
0.08
ε = 0.0005; k = 10; c k = 0.061904
θ
0 0.5 10
0.02
0.04
0.06
0.08
ε = 0.0005; k = 20; c k = 0.054395
θ
Figure 5.3: The effectiveness of the gradient approximation from (5.7) for ε = 0.0005,θ0 = 0.5 and various choices of k, ck.
41

0 0.15 10
0.02
0.04
0.06
0.08
0.1
ε = 0.001; k = 1; c k = 0.087055
θ
0 0.15 10
0.02
0.04
0.06
0.08
0.1
ε = 0.001; k = 5; c k = 0.069883
θ
0 0.15 10
0.02
0.04
0.06
0.08
0.1
ε = 0.001; k = 10; c k = 0.061904
θ
0 0.15 10
0.02
0.04
0.06
0.08
0.1
ε = 0.001; k = 20; c k = 0.054395
θ
Figure 5.4: The effectiveness of the gradient approximation from (5.7) for ε = 0.001,θ0 = 0.15 and various choices of k, ck.
5.3 The optimization algorithm
We implemented a somewhat heuristic hierarchical optimization strategy based on the
FDSA described in section 5.2. As input it takes a sequence of decreasing tolerances
ε1 > . . . > εM , an initial guess θ0 for θ∗ and a maximal number kmax of iterations to
be conducted.
Start with θ0 and ε = ε1.
1. Compute the expected discounted payoff U(θk) for the current iterate θk as well
as the gradient approximation gk(θk) as described in (5.7). This is done with
the multilevel Monte Carlo algorithm and chosen accuracy ε.
2. If the gradient approximation gk(θk) is small, i.e. if ‖gk(θk)‖ ≤ ε / ck, then move
to the next tolerance level or if we are already at the finest accuracy ε = εM ,
then terminate the algorithm. Otherwise continue with step 3.
42

3. Conduct a line search between θk and θk + ak gk(θk) to find a value
θ ∈ [θk, θk + ak gk(θk)]
for which there is an increase in the objective function.
4. If such a point is found, then advance to θk+1 = θ accordingly. If not, take
θk+1 = θk.
5. If the maximal number of iterations kmax has been reached, then stop. Other-
wise repeat from step 1.
We note that the function evaluations needed to compute the gradient approxi-
mation gk(θk) in step 1 are done based on the same random variables, i.e. they use
the same path information. This is done to achieve a better variance in the gradient
estimate.
The line search in step 3 analyzes the values
θk,j := θk + (1/2)j ak gk(θk)
for j = 0, . . . , Nsearch. If none of these yield an improvement in the objective function,
then we take a second and maybe a third step and look at θk,j for j = Nsearch +
1, . . . , 2Nsearch or j = 2Nsearch + 1, . . . , 3Nsearch. If at that point we did not find a θk,j
with an improved objective function, we move on with θk+1 = θk. Note that although
we set θk+1 = θk the computations of the previous step will not be reproduced exactly,
since the values of ck and ak change. Hence, we do not run into an infinite loop at
this stage.
5.4 Numerical examples
In Figure 5.5 we show the convergence behaviour of the optimization algorithm. The
case presented corresponds to an at-the-money put option with time to expiry T = 1,
risk-free interest rate r = 0.05, volatility coefficient σ = 0.2, strike K = 1.0 and initial
underlying asset price S0 = 1.0.
For the FDSA we chose ck and ak according to (5.8) with a = 5, c = 0.1, A = 1,
α = 0.5 and γ = 0.2. We chose a two-level tolerance (ε1, ε2) = (0.0005, 0.0001) and
an initial guess θ0 = 0.5. For the line search in step 3 of the optimization algorithm
we used Nsearch = 2.
43
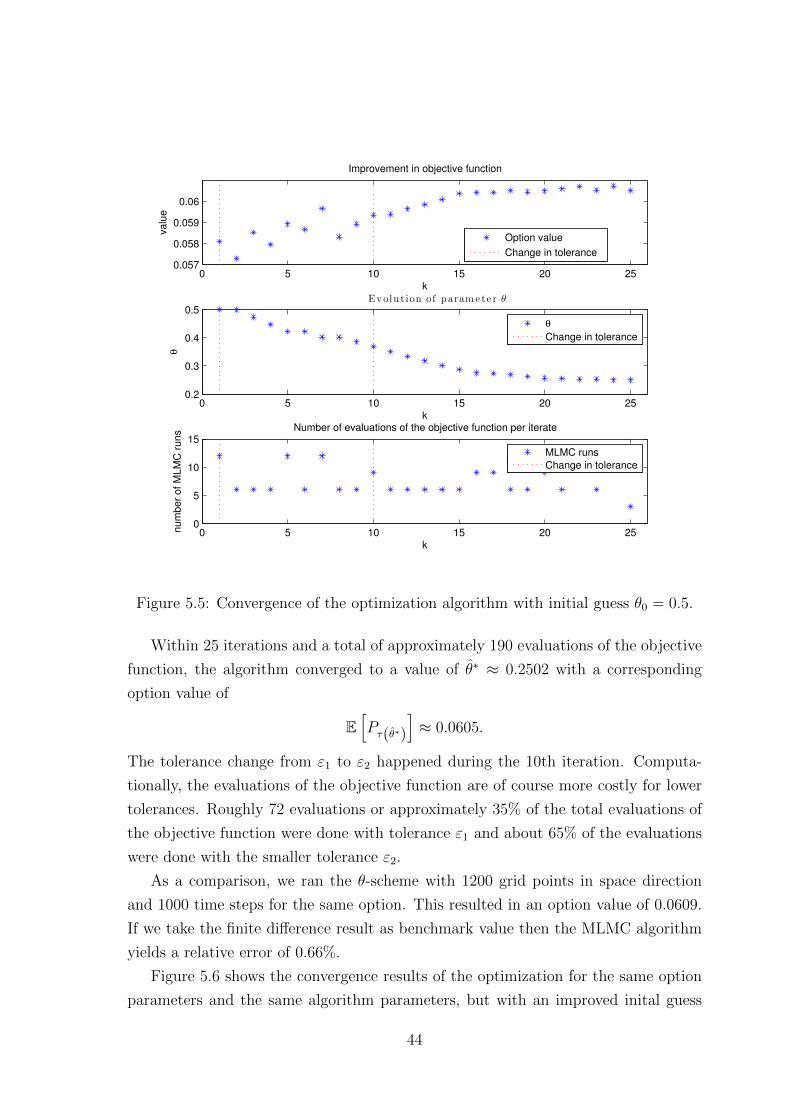
0 5 10 15 20 250.057
0.058
0.059
0.06
k
valu
eImprovement in objective function
0 5 10 15 20 250.2
0.3
0.4
0.5
k
θ
Evolu tion of parame te r θ
θ
Change in tolerance
0 5 10 15 20 250
5
10
15
k
num
ber
of M
LM
C r
uns Number of evaluations of the objective function per iterate
MLMC runs
Change in tolerance
Option value
Change in tolerance
Figure 5.5: Convergence of the optimization algorithm with initial guess θ0 = 0.5.
Within 25 iterations and a total of approximately 190 evaluations of the objective
function, the algorithm converged to a value of θ∗ ≈ 0.2502 with a corresponding
option value of
E[Pτ(θ∗)
]≈ 0.0605.
The tolerance change from ε1 to ε2 happened during the 10th iteration. Computa-
tionally, the evaluations of the objective function are of course more costly for lower
tolerances. Roughly 72 evaluations or approximately 35% of the total evaluations of
the objective function were done with tolerance ε1 and about 65% of the evaluations
were done with the smaller tolerance ε2.
As a comparison, we ran the θ-scheme with 1200 grid points in space direction
and 1000 time steps for the same option. This resulted in an option value of 0.0609.
If we take the finite difference result as benchmark value then the MLMC algorithm
yields a relative error of 0.66%.
Figure 5.6 shows the convergence results of the optimization for the same option
parameters and the same algorithm parameters, but with an improved inital guess
44

θ0 = 0.3. Within three iterations and eighteen evaluations of the objective function
the optimization algorithm finds θ∗ = 0.2586 with the same maximal value as before,
i.e. E[Pτ(θ∗)
]≈ 0.0605. Moreover, only one third of the evaluations were done with
the more expensive fine tolerance level ε2. It is therefore well worth it to conduct an
initial blind search over the whole search space with a few equispaced evaluations of
the objective function to find an educated initial guess θ0.
0 1 2 3 40.0595
0.06
0.0605
0.061
k
valu
e
Improvement in objective function
Option value
Change in tolerance
0 1 2 3 40.24
0.26
0.28
0.3
k
θ
Evolu tion of parame te r θ
θ
Change in tolerance
0 1 2 3 45
6
7
k
num
ber
of M
LM
C r
uns
Number of evaluations of the objective function per iterate
MLMC runs
Change in tolerance
Figure 5.6: Convergence of the optimization algorithm with improved initial guessθ0 = 0.3.
We repeated the tests for various other initial underlying asset prices and option
parameters. Some of the results are shown in the following tables. The parameters
of the optimization algorithm have been adjusted for some of the cases.
MLMC FD rel. Errorσ = 0.2, T = 1, K = 1.0, r = 0.05
S0 = 1.0 0.0605 0.0609 0.66%at the moneyS0 = 1.2 0.0136 0.0137 0.73%
out of the moneyS0 = 0.8 0.1959 0.2000 2.05%
in the money
The following two tables include results from further examples. In addition to
the finite difference and the multilevel Monte Carlo results we quote the values for
45

the same option parameters computed with the Longstaff-Schwartz algorithm as pub-
lished in the original paper [LS01, Table 1]. These values have been computed with
50 exercise dates per year and 100000 Monte Carlo paths.
MLMC FD rel. Error LS valueσ = 0.4, T = 1, K = 0.4, r = 0.06
S0 = 0.4 0.0527 0.0532 0.94% 0.5312at the moneyS0 = 0.42 0.04576 0.0459 0.31% 0.4582
out of the moneyS0 = 0.38 0.06138 0.0615 0.2% 0.6148
in the money
σ = 0.2, T = 1, K = 0.4, r = 0.06S0 = 0.4 0.02286 0.023194 1.4% 0.02314
at the moneyS0 = 0.42 0.01599 0.01621 1.3% 0.01617
out of the moneyS0 = 0.38 0.03173 0.03257 2.6% 0.03250
in the money
Note that in all cases the MLMC approach is biased low. The multilevel approach
in its current form came within a 3% range of the correct value in all test cases.
The original Longstaff-Schwartz algorithm seems to outperform our method with the
parametric form of the exercise boundary with one degree of freedom.
We also ran the algorithm for the parametric exercise boundary
Bθ(t) = K − θ1
√T − t− θ2 (T − t)
which is parametrized by two degrees of freedom. As an example we take the case of
the in-the-money option with S0 = 0.38, K = 0.4, T = 1 and σ = 0.2 for which we
found a slightly improved value of 0.03192 which corresponds to a relative error of
approximately 2%. At the same time the computational cost increased considerably.
The algorithm took a total of 315 evaluations of the objective function, almost 100% of
which were done with the finer tolerance level ε2. Note, that we chose a larger value
Nsearch = 4 to improve convergence. Figure 5.7 shows how the objective function
increased over the course of the optimization and how many function evaluations
were used at each iterate. Starting from the initial guess (θ1, θ2) = (0.1, 0.1) the
middle plot shows how the parameters (θ1, θ2) evolved towards (0.06621, 0.06809).
46

0 5 10 15 20 250.0305
0.031
0.0315
0.032
0.0325
k
valu
e
Improvement in objective function
Option value
Change in tolerance
0.065 0.07 0.075 0.08 0.085 0.09 0.095 0.10.06
0.08
0.1
0.12Evolu tion of parame te rs θ 1 and θ 2
θ1
θ2
θ
0 5 10 15 20 2510
15
20
k
num
ber
of M
LM
C r
uns Number of evaluations of the objective function per iterate
MLMC runs
Change in tolerance
Figure 5.7: Convergence of the optimization algorithm for the 2d parametric exerciseboundary.
47
Chapter 6
Conclusion
It is better to recognise that we arein darkness than to pretend that wecan see the light.
Hedley Bull
In this thesis we have presented a novel numerical method to approximate the
value of American options. Our method makes use of the multilevel Monte Carlo
approach introduced by Giles. In fact, we use the multilevel Monte Carlo method
to compute the value of an American option under a given parametrized exercise
rule and optimize over the chosen parametric family with the help of a stochastic
approximation approach.
We demonstrated the promising potential of the method by applying it to Amer-
ican put options written on single underlyings. For such an option a finite difference
approach is the method of choice and the multilevel Monte Carlo approach is far from
competitive. As usual, the strength of the Monte Carlo method lies in its simplicity
and convergence properties when the model is dependent on multiple stochastic fac-
tors. For models with a large number of stochastic factors the computational cost of
finite difference methods soon becomes prohibitive, a phenomenon sometimes referred
to as the curse of dimensionality. In those cases Monte Carlo methods are the only
feasible numerical means to tackle the problem.
Although we only introduced the method for the single underlying case it can in
principle be generalized to higher dimensional problems and should for example be
able to handle American basket options. One of the main obstacles on this path will
be to find a valid parametric form for the optimal exercise boundary. This parametric
form will in general depend on all stochastic factors. If one considers basket options
written on the weighted average of several underlying assets one can most likely
48
achieve a reasonable approximation with the parametric forms used in this thesis.
The multilevel algorithm has already been applied in the valuation of the European
counterpart of such basket options in [Gil09] and it would be a natural step to move
towards their American relatives.
We believe that our method can be improved considerably through further re-
search on the chosen optimization strategy. The noise pollution of the objective
function calls for some form of a stochastic optimization scheme. For the moment we
chose a standard stochastic approximation scheme. This choice might be suboptimal.
Currently, the convergence properties of the stochastic approximation highly depend
on the chosen parameters.
Another possible improvement might be achieved by further refining the paramet-
ric forms for the exercise boundary. In our numerical examples, the improvement
from moving towards the parametric form with two degrees of freedom were rather
disappointing. There might be better parametric forms altogether.
Inherently, the method produces values which are biased low, since we optimize
over a proper subset of the true feasible parameter space. One might want to combine
our approach with a method known to produce values with a high bias in order to
get some kind of confidence interval for the solution. One possible choice might be
the algorithm given in [Rog02].
49

Appendix A
MATLAB code
In this appendix we present some of the core MATLAB functions used in the imple-
mentation of the multilevel Monte Carlo algorithm for American options. We note
that this selection is not complete. In fact, we implemented a second version of the
functions MLMCAmOp.m and MLMCAmOpLevelL.m which compute option values
for several different inputs based on the same Brownian paths. These were used to
approximate the gradient estimates in (5.7). Also, all minor functions such as the
exercise boundary implementation are not shown here. The code for the θ-scheme was
taken from Dr. Christoph Reisingers finite difference notes and adjusted to handle
American options. We don’t show it here.
Due to space restrictions we show the code with forced line breaks. These are
marked with tripple dots.
A.1 MLMCAmOp.m
function [P, Nl] = ...
MLMCAmOp(eps,MLMCAmOpLevelL,exBoundType,exBoundParams)
T = 1;
r = 0.05;
sig = 0.2;
S0 = 0.8;
NperLoop = 10000;
K = 1.0;
L = -1;
N = 1000;
converged = 0;
50

while ~converged
%
% initial variance estimate
%
L = L+1;
sums = feval(MLMCAmOpLevelL,L,N,NperLoop,...
T,r,sig,S0,K,exBoundType,exBoundParams);
suml(1,L+1) = N;
suml(2,L+1) = sums(1);
suml(3,L+1) = sums(2);
%
% optimal sample sizes
%
Vl = suml(3,:)./suml(1,:) - (suml(2,:)./suml(1,:)).^2;
Nl = ceil( 2 * sqrt(Vl./(2.^(0:L))) ...
* sum(sqrt(Vl.*(2.^(0:L)))) / eps^2);
%
% update sample sums
%
for l=0:L
dNl = Nl(l+1)-suml(1,l+1);
if dNl>0
sums = feval(MLMCAmOpLevelL,l,dNl,NperLoop,...
T,r,sig,S0,K,exBoundType,exBoundParams);
suml(1,l+1) = suml(1,l+1) + dNl;
suml(2,l+1) = suml(2,l+1) + sums(1);
suml(3,l+1) = suml(3,l+1) + sums(2);
end
end
%
% test for convergence
%
range = -1:0;
51

if L>1 & 2^L>=16
con = 2.^range.*suml(2,L+1+range)./suml(1,L+1+range);
converged = (max(abs(con)) < eps/sqrt(2)) ;
end
end
%
% evaluate multi-timestep estimator
%
P = sum( suml(2,1:L+1)./suml(1,1:L+1) );
Nl = suml(1,:);
end
A.2 MLMCAmOpLevelL.m
function sums = MLMCAmOpLevelL(l,N,NperLoop,T,r,...
sig,S0,K,exBoundType,exBoundParams)
% l given level --> M^l time steps between 0 and T
% N number of path samples
% NperLoop number of path samples done in one loop
% T final time
% r risk free interest rate
% sig vol parameter
% S0 starting underlying value
% K strike value
% exBoundType flag which denotes the parametrisation
% type of the exercise boundary
% exBoundParams parameters for the exercise boundary
nf = 2^l;
nc = 2^(l-1);
hf = T/nf;
hc = T/nc;
tf = 0.0;
tc = 0.0;
52

sums(1:4) = 0;
% loop until N paths have been computed in total
for N1 = 1:NperLoop:N
% at each step deal with N2 paths
N2 = min(NperLoop,N-N1+1);
% path variable X_t = log(S_t)
Xf(:,1) = log(S0)*ones(N2,1);
% probability of not having crossed yet
Xf(:,2) = ones(N2,1);
% payoff part 1 --> barrier hit during some interval
Xf(:,3) = zeros(N2,1);
Xc = Xf;
tf = 0.0;
tc = 0.0;
if l==0
for n = 1:nf
hf = T/nf^2 * (2*(nf-n)+1);
dWf = sqrt(hf)*randn(N2,1);
Xleft = Xf(:,1);
Xright = Xleft + (r-sig^2/2)*hf + sig*dWf;
leftBarrier = exerciseBoundary(tf,T,...
K,exBoundType,exBoundParams);
tf = tf + hf;
tfMid = tf - hf/2;
rightBarrier = exerciseBoundary(tf,T,...
K,exBoundType,exBoundParams);
midBarrier = exerciseBoundary(tfMid,T,...
K,exBoundType,exBoundParams);
if (leftBarrier ~=0) && (rightBarrier ~=0)
Prob1 = exp(-2.0 * max(Xleft-log(leftBarrier),0)...
53

.* max(Xright-log(rightBarrier),0) /hf /sig^2);
else
Prob1 = exp(-2.0 * max(exp(Xleft)-leftBarrier,0) ...
.* max(exp(Xright)-rightBarrier,0) ...
/hf /sig^2./(exp(Xleft)).^2);
end
% update payoff
Xf(:,3) = Xf(:,3) + Xf(:,2).*Prob1...
.*max(K-midBarrier,0)*exp(-r*tfMid);
% update crossing probability
Xf(:,2) = Xf(:,2) .* (1.0-Prob1);
% update path variable
Xf(:,1) = Xright;
end
else
for n = 1:nc
dWc = zeros(N2,2);
dt = zeros(1,2);
for m = 1:2
hf = T/nf^2 * ( 2*(nf-2*(n-1)-m)+1);
dt(m) = hf;
dWf = sqrt(hf)*randn(N2,1);
dWc(:,m) = dWf;
Xleft = Xf(:,1);
% advance path variable
Xright = Xleft + (r-sig^2/2)*hf + sig*dWf;
% evaluate barrier on left end point
leftBarrier = exerciseBoundary(tf,T,...
K,exBoundType,exBoundParams);
tf = tf + hf;
tfMid = tf - hf/2;
% evaluate barrier on right end point
rightBarrier = exerciseBoundary(tf,T,...
54

K,exBoundType,exBoundParams);
% evaluate barrier at mid point
midBarrier = exerciseBoundary(tfMid,T,...
K,exBoundType,exBoundParams);
% prob of hitting the barrier
if (leftBarrier ~=0) && (rightBarrier ~=0)
Prob1=exp(-2.0 * max(Xleft-log(leftBarrier),0) ...
.* max(Xright-log(rightBarrier),0) /hf/sig^2);
else
Prob1=exp(-2.0 * max(exp(Xleft)-leftBarrier,0) ...
.* max(exp(Xright)-rightBarrier,0) ...
/hf /sig^2./(exp(Xleft)).^2);
end
% update payoff
Xf(:,3) = Xf(:,3) + Xf(:,2).*Prob1...
.*max(K-midBarrier,0)*exp(-r*(tfMid));
% update crossing probability
Xf(:,2) = Xf(:,2).* (1.0-Prob1);
% update path value
Xf(:,1) = Xright;
end
hc = dt(1) + dt(2);
Xleft = Xc(:,1);
% advance path variable
Xright = Xleft + (r-sig^2/2)*hc ...
+ sig*(dWc(:,1)+dWc(:,2));
lambda = dt(1)/hc;
Xmid = Xleft + lambda*(Xright-Xleft) ...
+ sig*(dWc(:,1) - lambda*(dWc(:,1)+dWc(:,2)));
%evaluate barrier at left end point
leftBarrier = exerciseBoundary(tc,T,...
K,exBoundType,exBoundParams);
55

tc = tc + hc;
tcMid = tc - hc/2;
% evaluate barrier at right end point
rightBarrier = exerciseBoundary(tc,T,...
K,exBoundType,exBoundParams);
% evaluate barrier at mid point
midBarrier2 = exerciseBoundary(tcMid,T,...
K,exBoundType,exBoundParams);
% prob of hitting the barrier
if (leftBarrier ~=0) && (rightBarrier ~=0)
logLeftBarrier = log(leftBarrier);
logRightBarrier = log(rightBarrier);
logMidBarrier1 = logLeftBarrier ...
+ lambda*(logRightBarrier-logLeftBarrier);
Prob11 = exp(-2*max(Xleft-logLeftBarrier,0) ...
.* max(Xmid-logMidBarrier1,0) /dt(1)/sig^2);
Prob12 = exp(-2*max(Xmid-logMidBarrier1,0) ...
.* max(Xright-logRightBarrier,0) /dt(2)/sig^2);
else
midBarrier1 = leftBarrier ...
+ lambda*(rightBarrier-leftBarrier);
Prob11 = exp(-2*max(exp(Xleft)-leftBarrier,0) ...
.* max(exp(Xmid)-midBarrier1,0) ...
/dt(1)/sig^2)./(exp(Xleft)).^2;
Prob12 = exp(-2*max(exp(Xmid)-midBarrier1,0) ...
.* max(exp(Xright)-rightBarrier,0)...
/dt(2)/sig^2./(exp(Xleft)).^2);
end
Prob1 = (1.0-(1.0-Prob11).*(1.0-Prob12));
% update payoff
Xc(:,3) = Xc(:,3) + Xc(:,2).*Prob1...
.*max(K-midBarrier2,0)*exp(-r*tcMid);
% update crossing probability
56

Xc(:,2) = Xc(:,2).* (1-Prob1);
% update path variable
Xc(:,1) = Xright;
end
end
Pf = Xf(:,3) + Xf(:,2)...
.*max(K-exp(Xf(:,1)),0)*exp(-r*T);
if l == 0
Pc = 0;
else
Pc = Xc(:,3) + Xc(:,2).*max(K-exp(Xc(:,1)),0)*exp(-r*T);
end
sums(1) = sums(1) + sum(Pf-Pc);
sums(2) = sums(2) + sum((Pf-Pc).^2);
sums(3) = sums(3) + sum(Pf);
sums(4) = sums(4) + sum(Pf.^2);
clear Xf
clear Xc
clear Pf
clear Pc
end
end
A.3 mlmc AmOp Test.m
function mlmc_AmOp_Test
clear all;
close all;
M=2;
NperLoop=5000;
T=1.0;
r=0.05;
sig=0.2;
57

S0=1.0;
K=1.0;
stitle = ’GBM model; American put strategy’;
N=1000000;
randn(’state’,0);
%
% first, convergence tests
%
L = 0:9;
exBoundType = 3;
exBoundParams = [0.8],
del1 = [];
del2 = [];
var1 = [];
var2 = [];
for l = L
disp(sprintf(’l = %d’,l))
sums = MLMCAmOpLevelL(l,N,NperLoop,T,...
r,sig,S0,K,exBoundType,exBoundParams);
del1 = [del1 sums(3)/N ];
del2 = [del2 sums(1)/N ];
var1 = [var1 sums(4)/N-(sums(3)/N)^2 ];
var2 = [var2 sums(2)/N-(sums(1)/N)^2 ];
end
disp(sprintf(’value = %f’,del1(length(L))))
Eps = [ 0.002 0.001 0.0005 0.0002 0.0001];
maxl = 0;
for i = 1:length(Eps)
eps = Eps(i);
[P, Nl] = MLMCAmOp(eps,@MLMCAmOpLevelL,...
58

exBoundType,exBoundParams);
l = length(Nl)-1;
maxl = max(maxl,l);
mlmc_cost(i) = sum(Nl.*M.^(0:l));
std_cost(i) = (2*var1(l+1)/eps^2)*M.^l;
Nls{i,1} = Nl;
end
maxl = max(maxl,4);
nvert = 2;
figure; pos=get(gcf,’pos’);
pos(3:4)=pos(3:4).*[1.0 0.75*nvert]; set(gcf,’pos’,pos);
set(0,’DefaultAxesColorOrder’,[0 0 0]);
set(0,’DefaultAxesLineStyleOrder’,’-*|--*|:*|-.*’)
subplot(2,2,1)
plot(L,log(var1)/log(M),L(2:end),log(var2(2:end))/log(M))
xlabel(’l’); ylabel(’log_2 variance’); %title(stitle)
legend(’P_l’,’P_l- P_{l-1}’,3)
axis([0 maxl -22 0])
subplot(2,2,2)
plot(L,log(abs(del1))/log(M), ...
L(2:end),log(abs(del2(2:end)))/log(M))
xlabel(’l’); ylabel(’log_2 |mean|’); %title(stitle)
legend(’P_l’,’P_l- P_{l-1}’,3)
axis([0 maxl -18 0])
set(0,’DefaultAxesLineStyleOrder’,...
’--o|--x|--d|--*|--s|:o|:x|:d|:*|:s’);
subplot(2,2,3)
59

semilogy(0:length(Nls{5,1})-1,Nls{5,1}, ...
0:length(Nls{4,1})-1,Nls{4,1}, ...
0:length(Nls{3,1})-1,Nls{3,1}, ...
0:length(Nls{2,1})-1,Nls{2,1}, ...
0:length(Nls{1,1})-1,Nls{1,1});
xlabel(’l’); ylabel(’N_l’); %title(stitle)
legend(’\epsilon=0.0001’,’\epsilon=0.0002’,’\epsilon=0.0005’,...
’\epsilon=0.001’,’\epsilon=0.002’,1)
axis([0 maxl 1e3 1e8])
set(0,’DefaultAxesLineStyleOrder’,’-*|-.*|--*|:*’)
subplot(2,2,4)
loglog(Eps,Eps.^2.*mlmc_cost(:)’,Eps, Eps.^2.*std_cost(:)’)
xlabel(’\epsilon’); ylabel(’\epsilon^2 Cost’); %title(stitle)
legend(’MLMC’,’MC’)
axis([1e-4 1e-2 0.2 10])
60

References
[BAW87] Giovanni Barone-Adesi and Robert E. Whaley. Efficient Analytic Approx-
imations of American Option Values. The Journal of Finance, 17:301–320,
1987.
[BN05] K. Borovkov and A. Novikov. Explicit Bounds for Approximation Rates
for Boundary Crossing Probabilities for the Wiener Process. Journal of
Applied Probability, 42(1), March 2005.
[CC08] Xinfu Chen and John Chadam. Convexity of the exercise boundary of
the american put option on a zero dividend asset. Mathematical Finance,
18(1):185–197, 2008.
[CJR92] Peter Carr, Robert Jarrow, and Myneni Ravi. Alternative Characteriza-
tions of American Put options. Mathematical Finance, 2:87–106, March
1992.
[GHM04] J. E. Gentle, W. K. Hardle, and Y. Mori, editors. Handbook of Computa-
tional Statistics, chapter II.6. Springer, 2004.
[GHM09] Mike Giles, Desmond J Higham, and Xuerong Mao. Analysing Multi-level
Monte Carlo for Options with Non-globally Lipschitz Payoff. Finance and
Stochastics, 13(3):403–413, 2009.
[Gil] M. B. Giles. Improved multilevel Monte Carlo convergence using the Mil-
stein scheme. In Monte Carlo and Quasi-Monte Carlo Methods 2006, pages
343–358. Springer-Verlag.
[Gil08] M. B. Giles. Multilevel Monte Carlo Path Simulation. Operations Research,
56(3):607–617, May 2008.
[Gil09] M. B. Giles. Multilevel Monte Carlo for Basket Options. In Proceedings of
the 2009 Winter Simulateion Conference, number 2, 2009.
61

[Gla04] Paul Glasserman. Monte Carlo Methods in Financial Engineering.
Springer, 2004.
[Huh07] Joonhee Huh. Computation of Multivariate Barrier Crossing Probability ,
and Its Applications in Finance. PhD thesis, University of Waterloo, 2007.
[KGV83] S. Kirkpatrick, C. D. Gelatt, and M. P. Vecchi. Optimization by Simulated
Annealing. Science, 220(4598):671–680, 1983.
[KK98] Rachel A. Kuske and Joseph B. Keller. Optimal exercise boundary for an
American put option. Applied Mathematical Finance, 5(2):107–116, 1998.
[KW52] J. Kiefer and J. Wolfowitz. Stochastic estimation of the maximum of a
regression function. Annals of Mathematical Statistics, 23(3), 1952.
[LPH00] Thomas Little, Vijay Pant, and Chunli Hou. A new integral representa-
tion of the early exercise boundary for American put options. Journal of
Computational Finance, pages 73–96, 2000.
[LS01] Francis A. Longstaff and Eduardo S. Schwartz. Valuing American options
by simulation : A simple least-squares approach. Review of Financial Stud-
ies, 14(1):113–147, 2001.
[RM51] H. Robbins and S. Monro. A Stochastic Approximation Method. The
Annals of Mathematical Statistics, 22(3), 1951.
[Rog02] L. C. G. Rogers. Monte Carlo valuation of American options. Mathematical
Finance, 12:271–286, July 2002.
[Sin10] Euan Sinclair. Option Trading, Pricing and Volatility Strategies and Tech-
niques. Wiley, 2010.
[Spa92] James Spall. Multivariate Stochastic Approximation Using a Simultaneous
Perturbation Gradient Approximation. IEEE Transactions on Automatic
Control, 37(3):332ff, 1992.
[Wol52] J. Wolfowitz. On the stochastic approximation method of Robbins and
Monro. Annals of Mathematical Statistics, 23(3):457–461, 1952.
62