Embed Size (px)
Citation preview

Multilateral Wells in Southeastern Ohio
Targeting the Marcellus and Utica from a Single Vertical Wellbore

Preview
Multilateral well introduction
Junctions: Drilling and construction procedures
Case Study: Granite Wash Formation in the Anadarko Basin
Economic analysis of Utica/Marcellus multilaterals
Conclusions

Multilateral Introduction
Advantages of multilateral wells
Reduction in tangible/intangible costs
Reduced surface and intermediate drilling/casing
Less cementing
Fewer wellheads and gathering lines
Smaller pads
Less man-hours on location
Operational efficiencies

Multilateral Introduction
Advantages of multilateral wells cont’d
Larger reservoir drainage volume
Quicker payout period
Challenges of multilateral wells
Construction and installation of junction
Selective stimulation of individual laterals

Junctions
Wellbore Geometries TAML Classifications
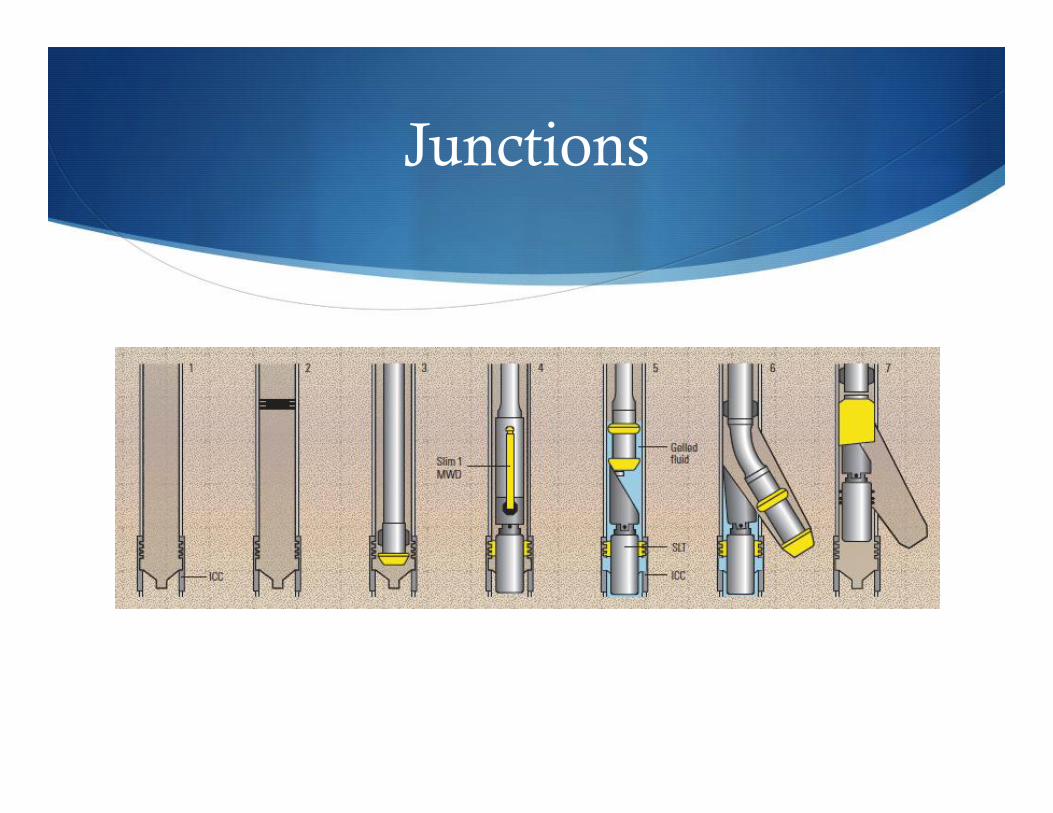
Junctions
Junctions

Junctions

Junctions

2013 Case Study
Stacked multilateral in Anadarko Basin targeting Granite Wash
Temporary TAML 5 junction installed at 12,500’
Each lateral selectively fractured
Results
Double the production of individual horizontal well
$2MM savings compared to 2 individual horizontal wells

2013 Case Study
In 2012 Apache Corporation spent $5MM to $7.5MM per well in the Granite wash
On first attempt at multilateral, operator reduced D&C costs by ~15 to 20%.

Utica/Marcellus Multilateral

Utica/Marcellus Multilateral

Utica/Marcellus Multilateral
EUR
13.9 Bcfe
30-day IP
11.7 MMcfe/d
50% volume reduction

Utica/Marcellus Multilateral
EUR
16.0 Bcfe
30 Day IP
23.0 MMcfe/d
50% volume reduction

Utica/Marcellus Multilateral
3-month exponential decline
Harmonic decline thereafter
EUR
~18.7 Bcfe
30-Day IP
~24.5 MMcfe/d

Economic Analysis
Company Source Formation Development Cost Well Cost/1000'Antero 2015 Co. presentation Marcellus (Dry) $10.6MM $1,325
Rice Energy 2015 Co. presentation Marcellus (Dry) $10.0MM $1,250
Eclipse Resources 2015 Co. presentation Marcellus (Wet) $8.45MM $1,056EQT Corp. Co. website Marcellus (Not Specified) $9.60MM $1,203
Southwestern Energy 2014 Co. presentation Marcellus (Dry) $9.92MM $1,240
Southwestern Energy 2014 Co. presentation Marcellus (Wet) $9.92MM $1,240
Consol Energy 2015 Co. presentation Marcellus (Wet) $8.75MM $1,094
Consol Energy 2016 Co. presentation Marcellus (Dry) $9.29MM $1,161
Marcellus Well Costs
Average Marcellus drilling and completion costs
$9.57 MM

Economic Analysis
Company Source Formation Development Cost Well Cost/1000'Antero 2015 Co. presentation Utica (Dry) $12.1MM $1,513Rice Energy 2015 Co. presentation Utica (Dry) $12.0MM $1,500Eclipse Resources 2015 Co. presentation Utica (Dry) $12.9MM $1,613
Chesapeake Energy 2014 Co. presentation Utica (Not specified) $8.25MM $1,031Southwestern Energy 2014 Co. presentation Utica (Dry) $11.5MM $1,440Consol Energy 2014 Co. presentation Utica (Dry) $11.0MM $1,371
Utica Well Costs
Average Utica drilling and completion costs
$11.3 MM

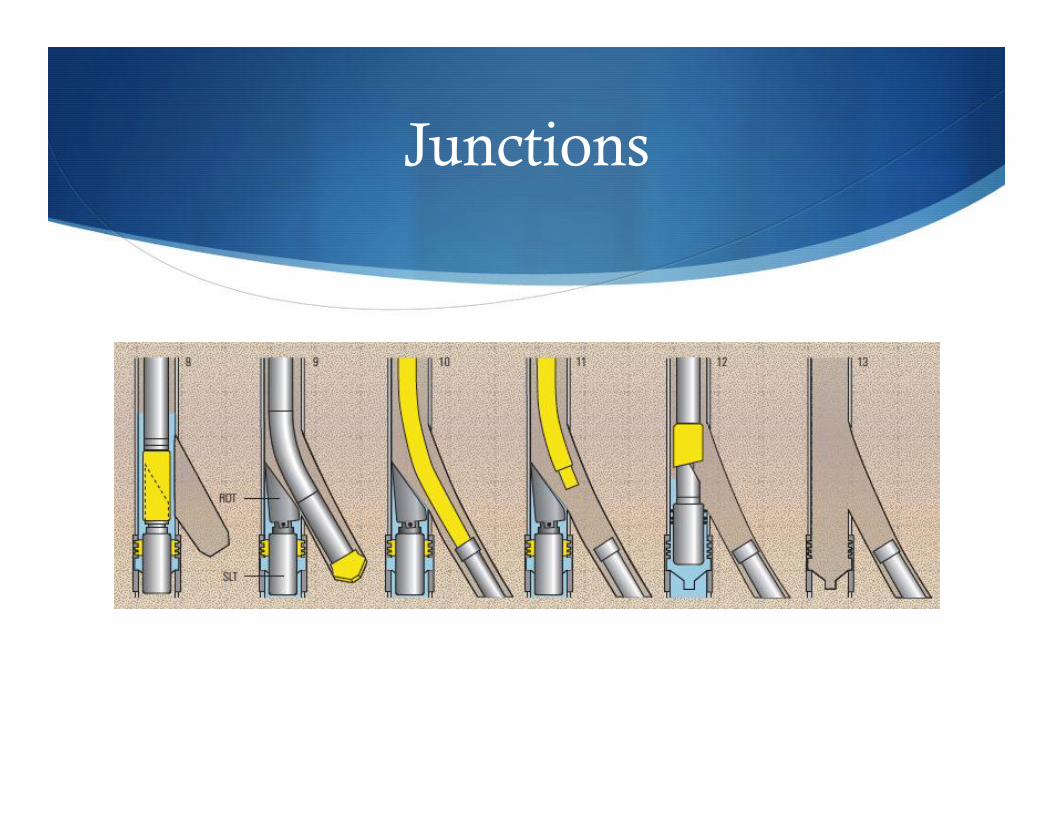
Economic Analysis
Assumptions
Operating costs
Fixed: $60,000/year
Variable: $0.23/mcfe
Wellhead gas price based on 3-year NYMEX strip and 3-year transportation basis strip
NGL separation neglected; Gas price adjusted for BTU content
Cost reduction of 15% for multilateral wells
Economic Analysis

Economic Analysis

Conclusions
Multilateral wells in southeastern Ohio require a 22% reduction in D&C costs for wet Marcellus areas and a 32% reduction for dry Marcellus areas
Multilaterals in PA and WV stand a better chance of being economically viable because the Marcellus is thicker
Economics of 2 laterals into the Utica should be analyzed

Sources
Antero Resources Inc. Investor Presentation: 2014. www.anteroresources.com. Accessed
February 2015
Bosworth, S et. al. Key Issues in Multilateral Technology. Oilfield Review, Winter 1998.
Chesapeake Energy Corporation. Investor Presentation: May 2014. www.chk.com.
Accessed February 2015
Consol Energy Inc. Analyst Day: June 2014. www.consolenergy.com. Accessed February 2015

Sources
Durst, D. G. & Vento, M. Unconventional Shale Play Selective Fracturing Using Multilateral
Technology. Paper SPE 163959 presented at the SPE Middle East Unconventional Gas
Conference and Exhibition. Muscat, Oman. 28-30 January 2013
Eclipse Resources Inc. Investor Presentation: January 2015. www.eclipseresources.com.Accessed January 2015
Economides, M. J., et. al. Petroleum Production Systems: 2nd Edition. Prentice Hall. October 2012

Sources
EQT Corporation. Marcellus and Upper Devonian Decline Curves Data: June 2014. EQT Investor Relations. www.eqt.com. Accessed February 2015.
Greenburg, J. Today’s Technologies Support Operator Goals. North American Unconventional Yearbook 2012. p 145-146. Accessed 20 December 2014. www.hartenergy.com
Husain, T. M., et. al. Economic Comparison of Multi-Lateral Drilling Over Horizontal Drilling for Marcellus Shale Field Development. January 2011. Pennsylvania State University College of Earth and Mineral Sciences. www.ems.psu.edu. Accessed December 2014

Sources
LoCricchio, Ed. Granite Wash Play Overview, Anadarko Basin: Stratigraphic Framework and Controls on Pennsylvanian Granite Wash Production, Anadarko Basin, Texas and Oklahoma. AAPG Data Pages. June 2012. www.searchanddiscovery.com. Accessed February 2015
Ohio DNR Division of Oil and Gas Resources. Oil and Gas Well Locator. www.oilandgas.odnr.gov. Accessed December 2014.
Rice Energy Inc. Investor Presentation: January 2015. www.riceenergy.com. Accessed January 2015

Sources
Southwestern Energy Inc. Investor Presentation: 2014. www.swn.com Accessed February 2015
Utica Shale: The Natural Gas Giant Below the Marcellus. Figure 5a. www.geology.com. Accessed January 2015.