Embed Size (px)
Citation preview

PUBLIC
Inter-American Development Bank
MULTILATERAL INVESTMENT FUND
SPECIAL PURPOSE ANNUAL INFORMATION STATEMENT
December 31, 2018 and 2017
Under the Access to Information Policy, this document is subject to Public Disclosure.

MIF
MULTILATERAL INVESTMENT FUND
SPECIAL PURPOSE ANNUAL INFORMATION STATEMENT
December 31, 2018 and 2017

1
MULTILATERAL INVESTMENT FUND (Administered by the Inter-American Development Bank)
SPECIAL PURPOSE STATEMENTS OF ASSETS, LIABILITIES AND FUND BALANCE (Expressed in thousands of United States dollars) December 31,
2018 2017
ASSETS Cash and investments
Cash $ 901 $ 2,914
Investments 170,483 $ 171,384 227,164 $ 230,078
Promissory notes receivable from Donors 60 1,533 Loans outstanding 27,797 21,909
Allowance for loan losses (2,780) 25,017 (2,191) 19,718
Equity investments outstanding 126,137 125,413
Allowance for equity investment losses (50,455) 75,682 (50,165) 75,248
Accrued interest on loans 304 598
Total assets $ 272,447 $ 327,175
LIABILITIES AND FUND BALANCE
Liabilities
Undisbursed grants and other financings $ 124,618 $ 154,083
Due to affiliates 3,532 5,418
Other liabilities 19,076 1,002
Total liabilities 147,226 160,503
Fund Balance
Contribution quotas authorized and subscribed 1,746,763 1,746,763
Contribution quotas receivable (25,710) (25,710)
Accumulated excess of expenses over income (1,687,361) (1,646,445)
Accumulated translation adjustments 91,529 92,064
Total fund balance 125,221 166,672
Total liabilities and fund balance $ 272,447 $ 327,175
The accompanying notes are an integral part of the special purpose annual information statement.

2
MULTILATERAL INVESTMENT FUND (Administered by the Inter-American Development Bank)
SPECIAL PURPOSE STATEMENTS OF CHANGES IN FUND BALANCE (Expressed in thousands of United States dollars) Year ended December 31, 2018 2017 Income
Investment income $ 4,119 $ 3,110
Loan and equity investment income 3,103 3,528
Other income 40 50
Total income 7,262 6,688
Expenses
Grants and other financings 19,320 30,007 Change in allowance for loan losses 589 (168)
Change in allowance for equity investment losses 11,662 6,801
Administrative expenses 16,173 17,267
Other expenses 434 963
Total expenses 48,178 54,870
Excess of expenses over income (40,916) (48,182)
Accumulated excess of expenses over income, beginning of year (1,646,445) (1,598,263)
Accumulated excess of expenses over income, end of year (1,687,361) (1,646,445)
Accumulated translation adjustments, beginning of year 92,064 91,938
Translation adjustments (535) 126
Accumulated translation adjustments, end of year 91,529 92,064
Contribution quotas subscribed, beginning of year 1,746,763 1,746,763
Contribution quotas subscribed during the year - -
Contribution quotas, end of year 1,746,763 1,746,763 Contribution quotas receivable, beginning of year (25,710) (25,710)
Collection of contribution quotas receivable during the year - -
Contribution quotas receivable, end of year (25,710) (25,710)
Fund balance, end of year $ 125,221 $ 166,672
The accompanying notes are an integral part of the special purpose annual information statement.

3
MULTILATERAL INVESTMENT FUND (Administered by the Inter-American Development Bank)
SPECIAL PURPOSE STATEMENTS OF CASH FLOW (Expressed in thousands of United States dollars) Year ended December 31, 2018 2017 Cash flows from financing activities
Collection of receivable from donors $ 1,473 $ 2,196 MIF III contribution quotas received in advance 18,823 -
Net cash provided by financing activities 20,296 2,196 Cash flows from lending and investing activities
Gross purchases of investments (23,000) (64,324) Gross proceeds from sale or maturity of investments 73,058 123,515 Equity investments return of capital 8,708 13,948 Loan collections 4,478 4,791 Loan disbursements (10,400) (2,974) Equity investment disbursements (20,804) (13,307)
Net cash provided by lending and investing activities 32,040 61,649
Cash flows from operating activities Investment income received 10,742 10,408 Loan and equity investment income 3,052 3,651 Grants and other financings (48,785) (58,034) Administrative expenses (17,930) (17,805) Other losses (821) (34) Other expenses (440) (674)
Net cash used in operating activities (54,182) (62,488) Effect of exchange rate fluctuations on cash (167) (269) Net increase in cash (2,013) 1,088
Cash, beginning of year 2,914 1,826 Cash, end of year $ 901 $ 2,914
Reconciliation of excess of expenses over income to Net cash used in operating activities: Excess of expenses over income $ (40,916) $ (48,182) Net unrealized investment activity 6,623 7,298 Change in allowance for loan and equity investment losses 12,251 6,633 Difference between amounts accrued and amounts paid or collected for:
Loan and equity investment income (51) 123 Grants and other financings (29,465) (28,027) Administrative expenses (1,757) (538) Other losses (861) (84) Other expenses (6) 289
Net cash used in operating activities $ (54,182) $ (62,488) Supplemental disclosure of noncash financing activities: Increase resulting from exchange rate fluctuations:
Promissory notes receivable from Donors $ - $ 95 The accompanying notes are an integral part of the special purpose annual information statement.

4
MULTILATERAL INVESTMENT FUND (Administered by the Inter-American Development Bank)
NOTES TO SPECIAL PURPOSE ANNUAL INFORMATION STATEMENT December 31, 2018 and 2017 (Expressed in thousands of United States dollars)
NOTE A – ORGANIZATION AND OPERATIONS
The Multilateral Investment Fund (MIF) has operated since January 7, 1993 under the Agreement Establishing the MIF (the Agreement). This Agreement has been amended for each of the two replenishments of the fund’s resources, as explained below.
On April 9, 2005, thirty-eight member countries of the Inter-American Development Bank (Bank) signed the Agreement Establishing the Multilateral Investment Fund II (Agreement) and entered into an administration agreement whereby the Inter-American Development (Bank) was designated the Administrator of the Multilateral Investment Fund II (MIF II or Fund).
MIF II, the successor of the former Multilateral Investment Fund (the MIF), was established with the purpose of enabling the continuation of the MIF operations. The Agreement and the MIF II administration agreement (together, Agreements) became effective on March 13, 2007. Under the terms of the Agreement, MIF II was established for a term to expire on December 31, 2015, renewable for a one-time period of up to five years. With Resolution MIF/DE – 10/15 adopted by the Donors Committee on June 24, 2015, MIF II term was extended to December 31, 2020. In 2016, MIF II’s focus was narrowed into the following three thematic areas: (i) Inclusive Cities; (ii) Climate-Smart Agriculture; and (iii) Knowledge Economy. These thematic areas were identified in anticipation of the forthcoming MIF III, whose objective is to serve as an Inter-American Development Bank Group’s innovation laboratory to promote development through the private sector by identifying, supporting, testing and piloting new solutions to development challenges and seeking to create opportunities for the poor and vulnerable populations in the Latin America and the Caribbean (LAC) region. As of December 31, 2018, there are thirty nine member countries (Donors).
The general purpose of the Fund is to support economic growth and poverty reduction in the regional developing member countries of the Bank and the developing member countries of the Caribbean Development Bank (CDB) by encouraging increased private investment and advancing private sector development. To carry out its operations, the Fund provides financing in the form of grants for technical cooperations, loans, guarantees, and equity investments or any combination thereof.
The functions of the Fund are to: promote activities to improve the business environment; enhance the competitiveness in the private sector; stimulate micro and small enterprises and other entrepreneurial activities; advance regional integration efforts; share knowledge that assists in the development of the private sector, particularly of micro and small enterprises; encourage the use and application of technology; advance the application of innovative initiatives; complement the work of the Bank, the Inter-American Investment Corporation (IIC) as well as the work of other multilateral development banks in the region; encourage the implementation of appropriate legal and regulatory reforms; and promote environmentally sound and sustainable economic development, as well as gender equality, in the full range of operations.

5
On April 2, 2017, the Boards of Governors of the Bank and the IIC (BOGs) agreed on a new replenishment for the Fund to continue and enhance its activities beyond its renewed term. The BOGs also approved the form of the Agreement Establishing the Multilateral Investment Fund III (MIF III Agreement) and the Agreement for the Administration of the Multilateral Investment Fund III (MIF III Administration Agreement) (collectively, the MIF III Agreements), both of which are mandated to enter into force on any date when prospective donors representing at least 60% of the total new contributions have deposited their Instruments of Contribution (Effective Date). The MIF III agreements are to remain in force for a period of five years as of the Effective Date and may be renewed for additional periods of up to five years. The Multilateral Investment Fund under the MIF III Agreement and Administration Agreement will continue to be a fund administered by the Bank.
On March 12, 2019, the MIF III Agreement entered into force. The BOGs agreed in 2017 on a replenishment of $302,209 with additional contributions up to $15,000. The additional contributions’ window was open until the effective date of the MIF III Agreements. Total contributions amounted to $311,654.
In October 2018, the MIF adopted a new brand and now refers to itself as IDB Lab. This rebranding did not entail a change in the legal name of the MIF. The MIF is a member of the Inter-American Development Bank Group (the IDB Group), which also includes the IDB and the IIC.
SUB-FUNDS
Included in the Fund’s Annual Information Statement (Statement) are several sub-accounts (referred to as sub-funds) established pursuant to MIF II or a 2013 transfer of resources from a third-party, as described below. The remaining resources of the Fund are maintained in what is referred to as the Main Fund.
Small Enterprise Investment Fund (SEIF)
Within the MIF II a separate sub-fund is maintained, the Small Enterprise Investment Fund (SEIF), to provide loans, guarantees, equity and quasi-equity investments or any combination thereof, directly or through intermediaries, to private sector entities which are creating or expanding services to micro and small enterprises, or which are financing or investing in micro and small enterprises. The Donors Committee approves all financings.
Productivity Fund
In 2009, the People’s Republic of China granted a $25,000 special contribution to the MIF II to be held separately from its regular resources, via the establishment of the Fund for Increasing Productivity and Promoting Inclusive Economic Growth (Productivity Fund). The objective of the Productivity Fund is to scale up successful programs, disseminate and identify international best practices for inclusive private-sector development, build internal skills and capacities needed by the MIF staff to meet the requirements of the Fund and its business plan and structure private-sector development projects that increase productivity and reduce poverty.
Haiti Account
Effective January 2, 2013, a nonprofit organization transferred, assigned and delivered to the Bank, as Administrator of the Fund, certain of its operations, assets and other resources pursuant to a General Assignment and Assumption Agreement signed between the parties and dated December 14, 2012. The net assets transferred amounted to $4,864 and included cash for $7,962, a loan portfolio with an outstanding balance of $2,564 and a grant portfolio with an undisbursed balance of $5,662. In May 2014, there was an additional transfer of cash from the nonprofit organization for the amount of $1,866, increasing the grant portfolio by the same amount. As per the terms of the General Assignment and Assumption Agreement, the Bank, as Administrator of the Fund, assumed the administration of such operations, assets and resources for activities that support economic growth and opportunity in the Republic of Haiti (hereinafter referred to as the Haiti Account) and are in line with the purpose of the Fund. In view of the unprecedented nature of this assignment, and as required by the General Assignment and Assumption Agreement, the Fund presents the net assets transferred separately from its other activities. As such, the loan and the grant portfolios were recorded as Other assets and Other liabilities, respectively, at the effective date of the transfer.
6
The accompanying Supplemental Information in Appendices IV and V presents the Special Purpose Statements of Assets, Liabilities, and Fund Balance by fund/sub-fund and account as of December 31, 2018 and 2017, and the Special Purpose Statements of Changes in Fund Balance by fund and account for the years then ended. As of December 31, 2018 the outstanding loans balance and undisbursed grants balance related to the Haiti Account amounted to $0 and $0.
NOTE B – SUMMARY OF SIGNIFICANT ACCOUNTING POLICIES
Basis of accounting This Statement has been prepared to comply with Article V, Section 2 (b) of the Agreement for the Administration of the MIF II, and with Resolution MIF/DE - 36/14 adopted by the Donors Committee on September 24, 2014 (Resolution), and is not intended to be a presentation in accordance with U.S. generally accepted accounting principles (GAAP). Due to the nature of its operations, the Fund follows a special accounting basis for loans, equity investments and contribution quotas. Under the special basis of accounting, loans and equity investments are recognized in the Statement following a simplified accounting and valuation methodology and loan income is recognized on an accrual basis. Contribution quotas authorized and subscribed are recognized as an increase in the fund balance when paid with cash or promissory notes. Investment income, grants and administrative expenses are recorded on an accrual basis. That is, the effect of transactions and other events is recognized when they occur (and not when cash is received or paid), and is recorded in the accounting records and reported in the Statements in the period to which they relate.
The preparation of the Statement requires the Administrator to make estimates and assumptions that affect the reported amounts of assets and liabilities, the disclosure of contingent assets and liabilities at the date of the Statements, and the reported amounts of income and expenses during the reporting period. Actual results could differ from these estimates. Significant judgments have been made in the valuation of certain financial instruments.
Translation of currencies (Revaluation) The Statement is expressed in United States dollars, which is also the functional and reporting currency of the Fund. While the Fund conducts most of its operations in United States dollars, it also has operations in Euro, Canadian dollar, Japanese yen and certain Latin American currencies. Assets and liabilities in such currencies are translated into United States dollars at market exchange rates prevailing at the date of the Special Purpose Statements of Assets, Liabilities and Fund Balance. Net adjustments resulting from the translation of currencies into United States dollars are charged or credited to Translation adjustments1. Income and expenses in such currencies are translated at either market exchange rates in effect on the dates on which they are recognized or at an average of market exchange rates in effect during each month.
Investments Investment securities are recorded using the trade-date method of accounting. As of December 31, 2018, the Fund holds interests (referred to as shares) in two mutual fund type structures (referred to as investment pools) maintained and managed by the Bank. The Fund’s investments are reported at fair value, with realized and unrealized gains and losses included in Investment income. The Fund holds shares in the investment pools and a daily net asset value (NAV) is calculated by the Bank. Note C discloses the nature of the investment securities held by the investment pools and the Fund’s pro rata interest in the fair value of each investment security class based on the ratio of the shares held by the Fund as compared to the total shares issued by the investment pool. Shares in one of the two investment pools are also held by other funds administered by the Bank.
Loans The Fund makes loans to private and public small enterprises and financial institutions located in the regional developing member countries of the Bank and the developing member countries of the CDB through the SEIF. These loans are intended for institutions that are in the process of developing or establishing services for the benefit of small enterprises, or which are lending to or investing in them. 1 References to captions in the special purpose annual information statement are identified by the name of the caption beginning with a capital letter every time they appear in the notes to the special purpose annual information statement.

7
Loan disbursements, less collections, are recorded as assets (Loans outstanding) in the Special Purpose Statements of Assets, Liabilities and Fund Balance, net of an allowance for loan losses equal to 10 percent of the loans outstanding balance. Loan interest income is recorded as Loan income following the accrual basis of accounting.
Partial or full loan write-offs, in addition to any changed in the aforementioned 10 percent allowance, are recorded in the period during which a loss has been “realized” through trigger events such as either a legal agreement or final bankruptcy settlement, or when the Fund has determined with a reasonable degree of certainty that the relevant amount will not be collected. Recuperations of loans previously written off are credited to the Change in allowance for loan losses when collected.
Equity investments The Fund makes equity investments through the SEIF. These equity investments are designed to increase the resources available for small and micro businesses, stimulate entrepreneurial activities in the economy and help smaller businesses link up with larger enterprises.
The full investment amount is recorded as an asset at cost in Equity investments outstanding in the Special Purpose Statements of Assets, Liabilities and Fund Balance, net of an allowance for impairment losses equal to 40 percent of the equity investment balance. Returns of capital are recorded as a reduction of equity investments and dividends are recorded as equity investment income when paid by the investee. The sale of equity investments is recorded as a reduction of Equity investments in the Special Purpose Statements of Assets, Liabilities and Fund Balance when cash is received. The difference between the recorded cost and sale proceeds is recorded as gains (losses) on sale of equity investments in Loan and equity investment income in the Special Purpose Statements of Changes in Fund Balance.
Partial or full equity investments write-offs, in addition to any changes in the aforementioned 40 percent allowance, are recorded in the period when a loss has been “realized” through trigger events such as either a legal agreement or final bankruptcy settlement, or when the Fund has determined with a reasonable degree of certainty that the relevant amount will not be collected. Recoveries of equity investments previously written off are credited to the Change in allowance for equity investment losses when collected.
Contribution quotas The full amount of subscriptions to contribution quotas is recognized upon receipt of: 1) the Instrument of Acceptance indicating that the Agreement has been ratified, accepted or approved, and 2) the Instrument of Contribution in which the Donor agrees to pay the Fund the contribution set forth in the Agreement. Contribution quotas receivable from Donors are deducted from the Fund balance.
Donors can pay contribution quotas in any freely convertible currency, or in non-negotiable non-interest-bearing promissory notes (or similar securities) denominated in such currency and payable on demand to meet the operational needs of the Fund. The promissory notes are recognized as assets, Promissory notes receivable from Donors, in the Special Purpose Statements of Assets, Liabilities and Fund Balance.
Administrative expenses Administrative expenses include:
i) Direct charges of the office of the Fund, encompassing the following items: a) salaries and benefits of Bank staff assigned to the Fund and devoted to the Fund’s operations; b) employee benefit contributions for both local and international staff assigned to the Fund; c) termination payments in relation to staff assigned to the Fund; d) fees paid to consultants and outside services; e) travel costs; and f) other general and administrative costs.
ii) Cost of services provided to the Fund by other IDB departments and the IIC. Starting in 2018, the Bank and the IIC charge the marginal costs of services provided to the Fund in accordance with an approved framework for the provision of services and a costing methodology for reimbursement of charges. Refer to Note I for further details.

8
Grants and other financings Grants approved by the Donors Committee are expensed at the time of approval by charging the full amount to Grants and other financings expense and recording a corresponding liability in Undisbursed grants and other financings. Other financings are grants that occasionally may result in recoveries. When disbursements are made, the disbursements are recorded as a reduction of Undisbursed grants and other financings. Grants and other financings cancellations are recorded as a reduction of Grants and other financings expense and Undisbursed grants and other financings when approved. Recuperations are recorded as a reduction of Grants and other financings expense when received.
Related party transactions As part of the administration of the resources of the Fund, the Bank pays administrative expenses and may disburse grants and other financings, loans and equity investments on behalf of the Fund. The amount payable related to these activities is reported as Due to affiliates.
Fair value of financial instruments The following methods and assumptions were used by the Fund in measuring the fair value for the following financial instruments:
Cash: The carrying amount reported in the Special Purpose Statements of Assets, Liabilities and Fund Balance for cash approximates fair value.
Investments: Fair value for investments are based on quoted prices in markets that are not active, external pricing services, where available, or prices derived from alternative pricing models, utilizing available observable market inputs discounted cash flows. The fair values of the remaining investments are based on external pricing services.
NOTE C – INVESTMENTS
As part of its overall portfolio management strategy, the Bank invests the Fund’s resources in the same type of securities in which it invests its own funds under its investment authority. Such resources are invested in high quality securities through two investment pools, the USD Mutual Fund and Treasury Bills Mutual Fund (TBF Mutual Fund), managed by the Bank. In addition, certain Fund resources are invested directly in debt securities and bank obligations, including overnight deposits. All of the investment pools’ securities have credit quality equivalent to ratings ranging from AAA/A1+ to AA (short-term securities carry the highest short-term credit rating).
The Fund can contribute or withdraw funds from the investment pools by purchasing or redeeming shares. The number of shares purchased or redeemed each time a trust fund undergoes a transaction is the result of the dollar amount of the contribution or withdrawal and the NAV as calculated on a daily basis. At December 31, 2018 and 2017, the NAV of the USD Mutual Fund was $158,465 and $213,576, respectively, and the NAV of the TBF Mutual Fund was $1,250,841 and $1,150,345, respectively. At December 31, 2018 the Fund is the owner of 114,170,975 shares or 100% of the outstanding interests of the USD Mutual Fund and 11,589,003 shares or 0.96% of the TBF Mutual Fund. At December 31, 2017 the Fund held 157,205,678 shares or 100% of the USD Mutual Fund and 13,351,155 shares or 1.18% of the TBF Mutual Fund.
The table below shows the assets held by the mutual funds and the amounts are presented based on the Fund’s proportionate ownership share of the mutual funds.

9
Investment pools (1): 2018 2017 $ 11,302 $ 22,237
541 628
84,624 93,797 15,046 15,023
- 14,98040,033 50,498
Obligations of the United States Government U.S. government-sponsored enterprises
Obligations of non-U.S. agencies Obligations of non-U.S. sub-sovereigns Obligations of supranationals Bank obligations(2) Corporate securities
18,937 30,001$ 170,483 $ 227,164
(1) Detail of investments by class represents the Fund's proportionate share of the investment pools' assets.
(2) May include bank notes and bonds, certificates of deposit, commercial papers, cash held for investments, and money market deposits.
The Bank limits the Fund’s investment activities to a list of authorized dealers and counterparties. Further, exposures and term limits have been established for these counterparties based on their size and creditworthiness.
All of the Fund’s investments at December 31, 2018 and 2017, were denominated in United States dollars. The average return on investments, including realized and unrealized gains and losses, during 2018 and 2017 was 2.1% and 1.2% respectively.
NOTE D - UNDISBURSED GRANTS AND OTHER FINANCINGS
The following is a summary of changes in Undisbursed grants and other financings for the years ended December 31, 2018 and 2017:
2018 2017 Balance at January 1, $ 154,083 $ 182,110
Approvals 33,346 47,206
Cancellations (14,026) (17,199)
Disbursements (48,785) (58,034)
Balance at December 31, $ 124,618 $ 154,083
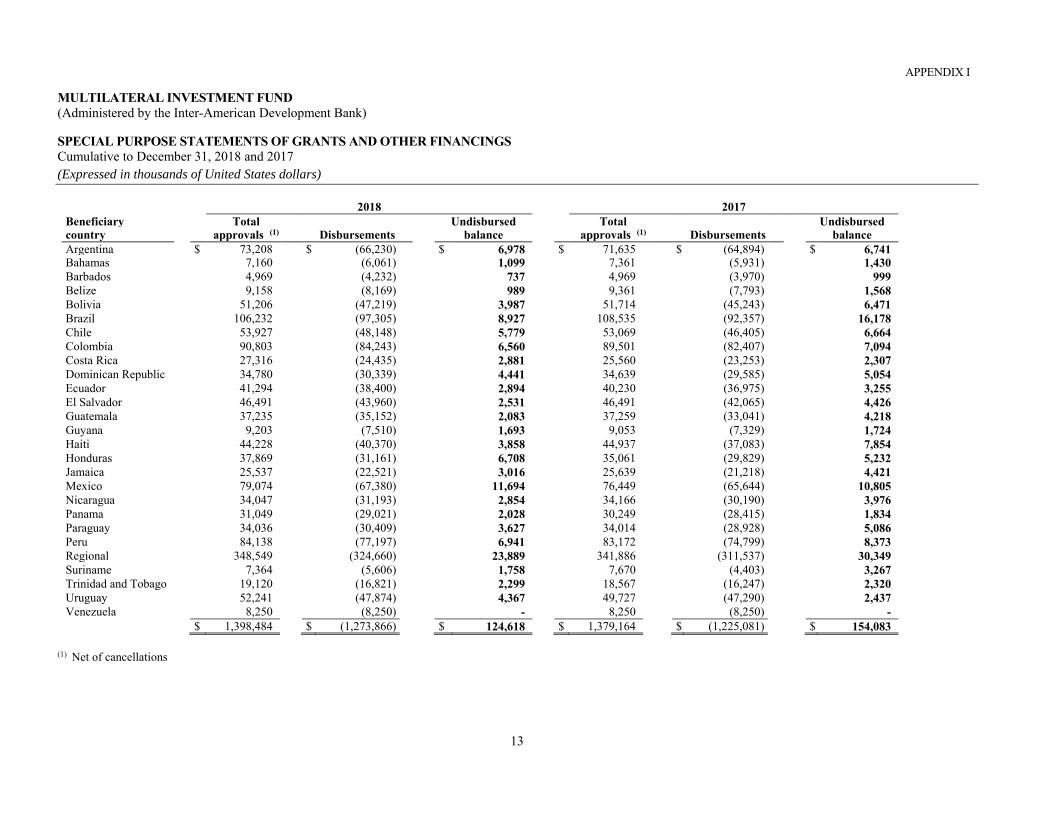
Approvals, net of cancellations, are presented as Grants and other financings in the Special Purpose Statements of Changes in Fund Balance. The Special Purpose Statements of Grants and Other Financings is shown in Appendix I.
NOTE E – LOANS AND EQUITY INVESTMENT OUTSTANDING
The following is a summary of changes in loans and equity investments outstanding and the respective allowances for losses for the years ended December 31, 2018 and 2017. In 2018 and 2017, no loans cancellations were requested. Equity Investments cancellations for $13,080 and $12,145 were recorded in 2018 and 2017, respectively.
As of December 31, 2018 and 2017, Investments comprise the following:

10
Loans outstanding Allowance for loan losses 2018 2017 2018 2017 Balance at January 1, $ 21,909 $ 23,740 Balance at January 1, $ 2,191 $ 2,374
Disbursements 10,400 2,974 Provision Collections (4,478) (4,791) for loan losses 589 (168) Write-offs (15) Loan recuperations - - Revaluation (34) 1 Write-offs - (15)
Balance at December 31, $ 27,797 $ 21,909 Balance at December 31, $ 2,780 $ 2,191
Equity investments outstanding Allowance for equity
investment losses
2018 2017 2018 2017
Balance at January 1, $ 125,413 $ 137,817 Balance at January 1, $ 50,165 $ 55,127 Disbursements 20,804 13,307 Provision for Return of capital (8,708) (13,948) equity investment losses 11,662 6,801 Write-offs (11,372) (11,763) Write-offs (11,372) (11,763)
Balance at December 31, $ 126,137 $ 125,413 Balance at December 31, $ 50,455 $ 50,165
As of December 31, 2018, undisbursed loans and equity investments were $21,770 and $85,545, respectively. Loans and Equity investments by country are shown in the Statements of Loans and Equity Investments in Appendix II.
NOTE F – FAIR VALUE MEASUREMENTS
Fair value measurement is based on a fair value hierarchy that prioritizes the inputs to valuation techniques used to measure fair value. The hierarchy gives the highest priority to unadjusted quoted prices in active markets for identical assets or liabilities (Level 1) and the lowest priority to unobservable inputs (Level 3). The three levels of the fair value hierarchy are as follows:
Level 1 - Unadjusted quoted prices for identical assets or liabilities in active markets; Level 2 - Quoted prices for similar assets or liabilities in active markets; quoted prices for identical or similar
assets or liabilities in markets that are not active; or pricing models for which all significant inputs are observable, either directly or indirectly, for substantially the full term of the asset or liability;
Level 3 - Prices or valuation techniques that require inputs that are both significant to the fair value measurement and unobservable.
The Fund’s investment securities valued on a recurring basis based on quoted market prices in active markets, a valuation technique consistent with the market approach, include Obligations of the United States Government and cash held for investments for a total amount of $11,905 at December 31, 2018 (2017 - $22,237) (see Note C – Investments). Such instruments are classified within Level 1 of the fair value hierarchy.
The remaining investment securities of the Fund are measured at fair value based on quoted prices in markets that are not active, external pricing services, where available, or prices derived from alternative pricing models, utilizing available observable market inputs and discounted cash flows. These methodologies represent valuation techniques consistent with the market and income approaches. As of December 31, 2018 and 2017, these investments are classified within Level 2 of the fair value hierarchy and amount to $158,578 and $204,927 respectively.
The Fund’s policy for transfers between levels is to reflect these transfers effective as of the beginning of the reporting period. There were no transfers between levels during 2018 or 2017.

11
NOTE G - OTHER LIABILITIES
At December 31, 2018, Other liabilities include MIF III donor contribution quotas received of $18,823, which are held by the Fund pending the effectiveness of MIF III.
NOTE H – CONTRIBUTION QUOTAS AND VOTING POWER
Contribution quotas The Donors’ Instrument of Contribution provides for each Donor to pay to the Fund its contribution quota in equal annual installments. Payments may be made in any freely convertible currency determined by the Donors Committee, or in non-negotiable, non-interest-bearing promissory notes (or similar securities) denominated in such currency. The payment of the promissory notes (or similar securities), which is subject to budgetary appropriation in some Donor countries, is due on demand in accordance with criteria and procedures established by the Donors Committee to meet the operational commitments of the Fund.
Voting power Under the Agreement, the Donors Committee shall reach decisions by a three-quarters majority of the total voting power. The total voting power of each Donor shall consist of the sum of its proportional votes and its basic votes. Each Donor shall have one proportional vote for each one hundred thousand United States dollars, or the equivalent in other currencies, it has contributed in cash or notes (or similar securities) under Article II, Section 2 of the Agreement. Each Donor shall also have basic votes consisting of such number of votes as results from the equal distribution among all the Donors of twenty five (25) percent of the aggregate proportional votes of all the Donors.
The Statements of Contribution Quotas and Voting Power are shown in Appendix III.
This space left intentionally blank

12
NOTE I – ADMINISTRATIVE EXPENSES
The Fund is charged expenses as described in Note B. In 2018 and 2017, the Bank and the IIC charged the following amounts to the Fund: 2018 2017 Bank's staff assigned or substantially devoted to the activities of the Fund $ 8,461 $ 13,337
Contributions to IDB Staff Retirement Plan (1) 2,011 -
Consultancies 1,250 1,301
Business travel 749 587
Services provided by IDB (Previously Overhead) (1) 1,453 830
Services provided by IIC (Previously IIC fees) (1) 1,582 875
Firms and publications 215 203
Other administrative expenses 452 134
$ 16,173 $ 17,267 (1)As per document MIF/GA-1-1 (Framework for Service Provision and Reimbursement of Charges of the MIF), approved in 2017, a new framework for the provision of service to the Fund and a costing methodology for reimbursement of charges were implemented as of 2018. As a result, the amounts reported in these categories for 2018 and 2017 are not fully comparable.
NOTE J – OTHER EXPENSES
Other expenses incurred during 2018 and 2017 include the following: 2018 2017 Support activities financed by the Productivity Fund $ 372 $ 680 Support developmental activities related to Haiti - 283 Others 62 -
Total $ 434 $ 963
NOTE K – ALLOCATIONS OF FUNDS
The regular resources of the Fund may be allocated at any time between the Main Fund and the SEIF. During 2018 and 2017, the Fund’s Administrator allocated the resources of the Fund between the Main Fund and the SEIF following a 60% and 40% distribution formula. The allocation of resources among the funds as of December 31, 2018 and 2017 is shown in Appendix IV.
NOTE L – CONCENTRATION OF CREDIT RISK
Credit risk represents the accounting loss that would be recognized at the reporting date if counterparties fail completely to perform as contracted. For concentration of Investments, refer to Note C – Investments and for Loans and Equity Investments, refer to Appendix II. In addition, at December 31, 2018 the majority of the Fund’s deposits were held in fifteen banks amounting to $901 (2017 –sixteen for $2,914). The amount of credit risk shown does not represent expected losses.
NOTE M – SUBSEQUENT EVENTS
The Bank, as Administrator, evaluated subsequent events through April 29, 2019, the date the Statement were available to be issued. As a result of this evaluation, there are no subsequent events that require recognition or disclosure in the Statements as of and for the year ended December 31, 2018 other than the MIF III entering into force as disclosed in Note A.
13
APPENDIX I
MULTILATERAL INVESTMENT FUND (Administered by the Inter-American Development Bank)
SPECIAL PURPOSE STATEMENTS OF GRANTS AND OTHER FINANCINGS Cumulative to December 31, 2018 and 2017 (Expressed in thousands of United States dollars)
2018 2017 Beneficiary Total Undisbursed Total Undisbursed country approvals (1) Disbursements balance approvals (1) Disbursements balance Argentina $ 73,208 $ (66,230) $ 6,978 $ 71,635 $ (64,894) $ 6,741 Bahamas 7,160 (6,061) 1,099 7,361 (5,931) 1,430 Barbados 4,969 (4,232) 737 4,969 (3,970) 999 Belize 9,158 (8,169) 989 9,361 (7,793) 1,568 Bolivia 51,206 (47,219) 3,987 51,714 (45,243) 6,471 Brazil 106,232 (97,305) 8,927 108,535 (92,357) 16,178 Chile 53,927 (48,148) 5,779 53,069 (46,405) 6,664 Colombia 90,803 (84,243) 6,560 89,501 (82,407) 7,094 Costa Rica 27,316 (24,435) 2,881 25,560 (23,253) 2,307 Dominican Republic 34,780 (30,339) 4,441 34,639 (29,585) 5,054 Ecuador 41,294 (38,400) 2,894 40,230 (36,975) 3,255 El Salvador 46,491 (43,960) 2,531 46,491 (42,065) 4,426 Guatemala 37,235 (35,152) 2,083 37,259 (33,041) 4,218 Guyana 9,203 (7,510) 1,693 9,053 (7,329) 1,724 Haiti 44,228 (40,370) 3,858 44,937 (37,083) 7,854 Honduras 37,869 (31,161) 6,708 35,061 (29,829) 5,232 Jamaica 25,537 (22,521) 3,016 25,639 (21,218) 4,421 Mexico 79,074 (67,380) 11,694 76,449 (65,644) 10,805 Nicaragua 34,047 (31,193) 2,854 34,166 (30,190) 3,976 Panama 31,049 (29,021) 2,028 30,249 (28,415) 1,834 Paraguay 34,036 (30,409) 3,627 34,014 (28,928) 5,086 Peru 84,138 (77,197) 6,941 83,172 (74,799) 8,373 Regional 348,549 (324,660) 23,889 341,886 (311,537) 30,349 Suriname 7,364 (5,606) 1,758 7,670 (4,403) 3,267 Trinidad and Tobago 19,120 (16,821) 2,299 18,567 (16,247) 2,320 Uruguay 52,241 (47,874) 4,367 49,727 (47,290) 2,437 Venezuela 8,250 (8,250) - 8,250 (8,250) - $ 1,398,484 $ (1,273,866) $ 124,618 $ 1,379,164 $ (1,225,081) $ 154,083
(1) Net of cancellations

14
APPENDIX II-A
MULTILATERAL INVESTMENT FUND (Administered by the Inter-American Development Bank)
SPECIAL PURPOSE STATEMENTS OF LOANS AND EQUITY INVESTMENTS Cumulative to December 31, 2018 and 2017 (Expressed in thousands of United States dollars)
Loans 2018 2017
Country Approved (1) Undisbursed Collections (2) Revaluation Write-Offs (2) Outstanding Approved (1) Undisbursed Collections (2) Revaluation Write-Offs (2) Outstanding
Argentina $ 9,195 $ 2,000 $ 6,493 $ (654) $ 15 $ 33 $ 7,195 $ - $ 6,493 $ (620) $ 15 $ 67
Barbados 40 - - - 40 - 40 - - - 40 -
Belize 69 - - - 69 - 69 - - - 69 -
Bolivia 12,780 1,000 11,100 - - 680 17,780 6,500 10,980 - - 300
Brazil 3,950 - 3,105 (725) 120 - 6,450 2,500 3,105 (725) 120 -
Chile 400 - 162 - 238 - 400 - 162 - 238 -
Colombia 16,230 2,000 11,080 - - 3,150 11,080 - 11,080 - - -
Costa Rica 14,000 - 14,000 - - - 14,000 - 14,000 - - -
Dominican Republic 1,850 200 1,500 - - 150 1,850 350 1,500 - - -
Ecuador 12,500 - 12,500 - - - 14,400 1,900 12,500 - - -
El Salvador 10,672 - 7,566 (6) - 3,100 9,922 1,000 7,317 (6) - 1,599
Guatemala 1,550 - 1,530 (20) - - 1,550 - 1,530 (20) - -
Guyana 74 - 20 (1) 53 - 74 - 20 (1) 53 -
Haiti 1,000 500 - - - 500 1,000 1,000 - - - -
Honduras 6,474 750 2,654 (445) 61 2,564 6,474 1,600 1,967 (445) 61 2,401
Mexico 17,520 5,020 8,972 - 1,028 2,500 15,520 5,520 8,972 - 1,028 -
Nicaragua 10,651 2,500 6,853 (483) 315 500 10,651 3,000 6,853 (483) 315 -
Panama 5,250 - 5,250 - - - 5,250 - 5,028 - - 222
Paraguay 1,000 - 1,000 - - - 1,000 - 1,000 - - -
Peru 17,392 1,500 11,033 141 - 5,000 15,892 - 11,033 141 - 5,000
Regional 67,472 6,300 50,110 (768) 674 9,620 67,472 6,800 46,910 (768) 674 12,320
Trinidad and Tobago 3,022 - 2,855 (3) 164 - 3,022 - 2,855 (3) 164 -
Uruguay 1,250 - 1,250 - - - 1,250 - 1,250 - - -
$ 214,341 $ 21,770 $ 159,033 $ (2,964) $ 2,777 $ 27,797 $ 212,341 $ 30,170 $ 154,555 $ (2,930) $ 2,777 $ 21,909
(1) Net of cancellations (2) Reflects cumulative recuperations of $3,160 for loans previously written off.

15
APPENDIX II-B
MULTILATERAL INVESTMENT FUND (Administered by the Inter-American Development Bank)
SPECIAL PURPOSE STATEMENTS OF LOANS AND EQUITY INVESTMENTS Cumulative to December 31, 2018 and 2017 (Expressed in thousands of United States dollars)
Equity investments
2018 2017
Country Approved (1) Undisbursed Return of Capital
Write-Offs Outstanding Approved (1) Undisbursed Return of Capital
Write-Offs Outstanding
Argentina $ 15,238 $ 4,286 $ 739 $ 2,905 $ 7,308 $ 11,738 $ 886 $ 739 $ 2,905 $ 7,208 Bolivia 6,012 - 2,844 3,168 - 6,012 - 2,378 3,168 466
Brazil 70,560 - 12,879 28,929 13,725 15,027 70,568 15,269 28,523 7,881 18,895
Chile 16,486 - 3,945 2,362 2,848 7,331 14,486 3,617 2,138 2,848 5,883
Colombia 22,820 - 6,042 4,321 - 12,457 21,360 7,985 959 - 12,416
Costa Rica 1,000 - - 868 132 - 1,000 - 868 132 -
Dominican Republic 1,600 - 950 215 385 50 1,600 950 215 385 50
Ecuador 2,000 - - - - 2,000 2,000 2,000 - - -
El Salvador 3,717 - 2,775 717 - 225 2,717 2,000 717 - -
Haiti 4,000 - 952 - - 3,048 4,000 1,405 - - 2,595
Honduras 10,100 - 4,683 1,789 2,211 1,417 10,100 5,530 1,789 2,211 570
Mexico 67,141 - 5,130 27,794 10,049 24,168 67,406 8,305 26,625 9,199 23,277
Nicaragua 725 - - 600 - 125 725 - 600 - 125
Panama - - - - - - - - - - -
Paraguay - - - - - - - - - - -
Peru 4,150 - - 1,731 2,419 - 9,150 5,000 1,731 2,419 -
Regional 196,684 - 43,903 72,494 31,110 49,177 187,952 41,733 69,624 26,500 50,095
Trinidad and Tobago 2,732 - - 855 1,877 - 2,732 - 855 1,877 -
Uruguay 5,136 - - 1,101 231 3,804 5,136 250 890 163 3,833
Venezuela 587 - - 529 58 - 587 - 529 58 -
$ 430,688 $ 85,545 $ 147,888 $ 71,118 $ 126,137 $ 419,269 $ 94,930 $ 139,180 $ 59,746 $ 125,413
(1) Net of cancellations

16
APPENDIX III
MULTILATERAL INVESTMENT FUND (Administered by the Inter-American Development Bank)
SPECIAL PURPOSE STATEMENTS OF CONTRIBUTION QUOTAS AND VOTING POWER Cumulative to December 31, 2018and 2017 (Expressed in thousands of United States dollars)
Contribution Quotas as of December 31, 2018 Contribution Quotas as of December 31, 2017 Currency of Pledged Received Promissory Contributions Voting Pledged Received Promissory Contributions Voting Donor Members Contributions Contributions in Cash Notes Receivable Power
(1) Contributions in Cash Notes Receivable Power
Argentina U.S. dollar $ 28,331 $ 28,331 $ - $ - 1.83 $ 28,331 $ 28,331 $ - $ - 1.83 Bahamas U.S. dollar 1,100 1,100 - - 0.56 1,100 1,088 13 - 0.56 Barbados U.S. dollar 1,000 1,000 - - 0.56 1,000 1,000 - - 0.56 Belize U.S. dollar 962 932 30 - 0.56 962 932 30 - 0.56 Bolivia U.S. dollar 987 987 - - 0.56 987 987 - - 0.56 Brazil U.S. dollar 28,331 28,331 - - 1.83 28,331 28,123 208 - 1.83 Canada Canadian dollar 40,000 40,000 - - 2.37 40,000 40,000 - - 2.37 Chile U.S. dollar 8,000 8,000 - - 0.88 8,000 8,000 - - 0.88 China U.S. dollar 50,000 50,000 - - 2.84 50,000 50,000 - - 2.84 Colombia U.S. dollar 8,000 8,000 - - 0.88 8,000 8,000 - - 0.88 Costa Rica U.S. dollar 962 962 - - 0.56 962 962 - - 0.56 Dominican Republic U.S. dollar 962 962 - - 0.56 962 962 - - 0.56 Ecuador U.S. dollar 962 962 - - 0.56 962 962 - - 0.56 El Salvador U.S. dollar 962 962 - - 0.56 962 962 - - 0.56 France U.S. dollar 15,000 15,000 - - 1.21 15,000 15,000 - - 1.21 Guatemala U.S. dollar 962 962 - - 0.56 962 962 - - 0.56 Guyana U.S. dollar 950 950 - - 0.56 950 950 - - 0.56 Haiti U.S. dollar 300 300 - - 0.53 300 300 - - 0.53 Honduras U.S. dollar 962 932 30 - 0.56 962 932 30 - 0.56 Italy Euro 32,000 32,000 - - 2.00 32,000 32,000 - - 2.00 Jamaica U.S. dollar 1,000 1,000 - - 0.56 1,000 1,000 - - 0.56 Japan Japanese yen 570,000 570,000 - - 27.02 570,000 570,000 - - 27.02 Korea, Republic of U.S. dollar 60,000 60,000 - - 3.30 60,000 58,751 1,249 - 3.30 Mexico U.S. dollar 28,331 28,331 - - 1.83 28,331 28,331 - - 1.83 Netherlands Euro 21,530 21,530 - - 1.51 21,530 21,530 - - 1.51 Nicaragua U.S. dollar 962 962 - - 0.56 962 962 - - 0.56 Panama U.S. dollar 962 962 - - 0.56 962 962 - - 0.56 Paraguay U.S. dollar 1,450 1,450 - - 0.58 1,450 1,450 - - 0.58 Peru U.S. dollar 4,300 4,300 - - 0.71 4,300 4,300 - - 0.71 Portugal Euro 7,000 7,000 - - 0.84 7,000 7,000 - - 0.84 Spain Euro 120,000 120,000 - - 6.09 120,000 120,000 - - 6.09 Suriname U.S. dollar 700 700 - - 0.54 700 698 3 - 0.54 Sweden U.S. dollar 5,000 5,000 - - 0.74 5,000 5,000 - - 0.74 Switzerland U.S. dollar 7,500 7,500 - - 0.86 7,500 7,500 - - 0.86 Trinidad and Tobago U.S. dollar 1,200 1,200 - - 0.57 1,200 1,200 - - 0.57 United Kingdom U.S. dollar 22,095 22,095 - - 1.54 22,095 22,095 - - 1.54 United States U.S. dollar 650,000 624,290 - 25,710 29.55 650,000 624,290 - 25,710 29.55 Uruguay U.S. dollar 4,000 4,000 - - 0.70 4,000 4,000 - - 0.70 Venezuela U.S. dollar 20,000 20,000 - - 1.44 20,000 20,000 - - 1.44 Historical amounts $ 1,746,763 $ 1,720,993 $ 60 $ 25,710 100 $ 1,746,763 1,719,521 1,533 25,710 100
Translation adjustments - - - -
Total $ 60 $ 25,710 $ 1,533 $ 25,710
(1) Data is rounded; detail may not add to total.

17
APPENDIX IV
MULTILATERAL INVESTMENT FUND (Administered by the Inter-American Development Bank)
SPECIAL PURPOSE STATEMENTS OF ASSETS, LIABILITIES, AND FUND BALANCE BY FUND Cumulative to December 31, 2018 and 2017 (Expressed in thousands of United States dollars)
2018 2017
Small Enterprise
Total Combined
Small Enterprise
Total Combined
Main Investment Main and SEIF Productiv
Haiti Main Investment Main and SEIF Productivity Haiti Fund Fund (SEIF) Funds Fund Account Total Fund Fund (SEIF) Funds Fund Account Total
ASSETS Cash and investments
Cash $ (199,259) (1) $ 200,014 (1) $ 755 $ 88 $ 58 $ 901 $ (187,788) (1) $ 190,362 (1) $ 2,574 $ 194 $ 146 $ 2,914 Investments 161,808 (1) (3,343) (1) 158,465 8,444 3,574 170,483 194,874 (1) 18,702 (1) 213,576 8,583 5,005 227,164
Promissory notes receivable from Donors 2,415 (1) (2,355) (1) 60 - - 60 3,302 (1) (1,769) (1) 1,533 - - 1,533
Loans outstanding - 27,797 27,797 - - 27,797 - 21,909 21,909 - - 21,909
Allowance for loan losses - (2,780) (2,780) - - (2,780) - (2,191) (2,191) - - (2,191)
- 25,017 25,017 - - 25,017 - 19,718 19,718 - - 19,718 Equity investments outstanding - 126,137 126,137 - - 126,137 - 125,413 125,413 - - 125,413
Allowance for equity
investment losses - (50,455) (50,455) - - (50,455) - (50,165) (50,165) - - (50,165)
- 75,682 75,682 - - 75,682 - 75,248 75,248 - - 75,248 Accrued interest on loans - 304 304 - - 304 - 598 598 - - 598
Total assets $ (35,036) $ 295,319 $ 260,283 $ 8,532 $ 3,632 $ 272,447 $ 10,388 $ 302,859 $ 313,247 $ 8,777 $ 5,151 $ 327,175
LIABILITIES AND FUND BALANCE
Liabilities Undisbursed grants and other financings 124,595 - 124,595 - 23 124,618 153,333 - 153,333 - 750 154,083 Due to affiliates (4,598) 8,130 3,532 - - 3,532 (2,197) 7,582 5,385 33 - 5,418Other liabilities 19,076 - 19,076 - - 19,076 136 - 136 - 866 1,002
Total liabilities 139,073 8,130 147,203 - 23 147,226 151,272 7,582 158,854 33 1,616 160,503
Fund Balance Contribution quotas authorized
and subscribed 1,379,943 (1) 366,820 (1) 1,746,763 - - 1,746,763 1,379,943 366,820 1,746,763 - - 1,746,763 Contribution quotas receivable
from Donors (20,310) (1) (5,400) (1) (25,710) - - (25,710) (20,310) (5,400) (25,710) - - (25,710) Accumulated excess of expenses
over income (1,608,512) (1) (90,990) (1) (1,699,502) 8,532 3,609 (1,687,361) (1,575,323) (83,401) (1,658,724) 8,744 3,535 (1,646,445) Accumulated translation adjustments 74,770 (1) 16,759 (1) 91,529 - - 91,529 74,806 17,258 92,064 - - 92,064
Total fund balance (174,109) 287,189 113,080 8,532 3,609 125,221 (140,884) 295,277 154,393 8,744 3,535 166,672
Total liabilities and fund balance $ (35,036) $ 295,319 $ 260,283 $ 8,532 $ 3,632 $ 272,447 $ 10,388 $ 302,859 $ 313,247 $ 8,777 $ 5,151 $ 327,175
(1) The above presentation reflects an allocation of activity, in accordance with the MIF II Administration Agreement, between these two sub-funds based on their use of resources and does not reflect actual assets or liability balances in each sub-fund at the end of the period. For these balances, only the balances shown in the Total Combined Main and SEIF Fund column reflect actual asset or liability balances at the end of the period. While the allocations impacting the Main Fund result in a negative asset or debit liability balances, the Main Fund does not owe nor is it owed, any amounts to or from any other fund or entity. With the establishment of the MIF III Administrative Agreement in March 2019, the amounts allocated to the Main Fund and the SEIF fund will be combined in future periods. The Productivity Fund and the Haiti Account will continue to be presented in future periods.

18
APPENDIX V
MULTILATERAL INVESTMENT FUND (Administered by the Inter-American Development Bank)
SPECIAL PURPOSE STATEMENTS OF CHANGES IN FUND BALANCE BY FUND Cumulative to December 31, 2018 and 2017 (Expressed in thousands of United States dollars)
2018 2017
Small
Total Combined Small
Total Combined Main Investment Main and SEIF Productivity Haiti Main Investment Main and SEIF Productivity Haiti Fund Fund (SEIF) Funds Fund Account Total Fund Fund (SEIF) Funds Fund Account Total
Income Investment income $ 2,333 $ 1,556 $ 3,889 $ 161 $ 69 $ 4,119 $ 1,795 $ 1,196 $ 2,991 $ 76 $ 43 $ 3,110 Loan and equity investment income - 3,103 3,103 - - 3,103 - 3,547 3,547 - (19) 3,528 Other income 28 3 31 2 7 40 (19) (12) (31) (2) 83 50
Total income 2,361 4,662 7,023 163 76 7,262 1,776 4,731 6,507 74 107 6,688 Expenses
Grants and other financings 19,320 - 19,320 - - 19,320 30,007 - 30,007 - - 30,007 Change in allowance for loan losses - 589 589 - - 589 - (168) (168) - - (168) Change in allowance for equity investment losses - 11,662 11,662 - - 11,662 - 6,801 6,801 - - 6,801
19,320 12,251 31,571 - - 31,571 30,007 6,633 36,640 - - 36,640 Administrative expenses 16,173 - 16,173 - - 16,173 17,267 - 17,267 - - 17,267 Other expenses 57 - 57 375 2 434 - - - 680 283 963
Total expenses 35,550 12,251 47,801 375 2 48,178 47,274 6,633 53,907 680 283 54,870 Excess of (expenses over income)
income over expenses (33,189) (7,589) (40,778) (212) 74 (81,694) (45,498) (1,902) (47,400) (606) (176) (95,582) Accumulated excess of expenses over
income beginning of year (1,575,323) (83,401) (1,658,724) 8,744 3,535 (3,305,169) (1,529,825) (81,499) (1,611,324) 9,350 3,711 (3,209,587) Accumulated excess of expenses over
income end of year (1,608,512) (90,990) (1,699,502) 8,532 3,609 (3,386,863) (1,575,323) (83,401) (1,658,724) 8,744 3,535 (3,305,169) Accumulated translation adjustments,
beginning of year 74,806 17,258 92,064 - - 184,128 74,835 17,103 91,938 - - 183,876 Translation adjustments (36) (499) (535) - - (535) (29) 155 126 - - 126
Accumulated translation adjustments, end of year 74,770 16,759 91,529 - - 91,529 74,806 17,258 92,064 - - 92,064
Contribution quotas subscribed,
beginning of year 1,379,943 366,820 1,746,763 - - 1,746,763 1,379,943 366,820 1,746,763 - - 1,746,763 Contribution quotas subscribed during the year - - - - - - - - - - - -
Contribution quotas, end of year 1,379,943 366,820 1,746,763 - - 1,746,763 1,379,943 366,820 1,746,763 - - 1,746,763 Contribution quotas receivable,
beginning of year (20,310) (5,400) (25,710) - - (25,710) (20,310) (5,400) (25,710) - - (25,710) Collection of contribution quotas receivable
during the year - - - - - - - - - - - - Contribution quotas receivable,
end of year (20,310) (5,400) (25,710) - - (25,710) (20,310) (5,400) (25,710) - - (25,710) Fund balance, end of year $ (174,109) $ 287,189 113,080 $ 8,532 $ 3,609 $ (1,574,281) $ (140,884) $ 295,277 $ 154,393 $ 8,744 $ 3,535 $ (1,492,052)