Embed Size (px)
Citation preview

Multiethnic Genome-Wide Association Study of DiabeticRetinopathy Using Liability Threshold Modeling ofDuration of Diabetes and Glycemic ControlSamuela Pollack,1 Robert P. Igo Jr.,2 Richard A. Jensen,3 Mark Christiansen,3 Xiaohui Li,4
Ching-Yu Cheng,5,6 Maggie C.Y. Ng,7,8 Albert V. Smith,9 Elizabeth J. Rossin,10 Ayellet V. Segrè,10
Samaneh Davoudi,10 Gavin S. Tan,5,6 Yii-Der Ida Chen,4 Jane Z. Kuo,4,11 Latchezar M. Dimitrov,7,8
Lynn K. Stanwyck,10 Weihua Meng,12 S. Mohsen Hosseini,13 Minako Imamura,14,15,16 Darryl Nousome,17
Jihye Kim,18 Yang Hai,4 Yucheng Jia,4 Jeeyun Ahn,19 Aaron Leong,20 Kaanan Shah,21 Kyu Hyung Park,22
Xiuqing Guo,4 Eli Ipp,23 Kent D. Taylor,4 Sharon G. Adler,24 John R. Sedor,25,26,27 Barry I. Freedman,28
Family Investigation of Nephropathy and Diabetes-Eye Research Group, DCCT/EDIC ResearchGroup, I-Te Lee,29,30,31 Wayne H.-H. Sheu,29,30,31,32 Michiaki Kubo,33 Atsushi Takahashi,34,35
Samy Hadjadj,36,37,38,39 Michel Marre,40,41,42 David-Alexandre Tregouet,43,44 Roberta Mckean-Cowdin,17,45
Rohit Varma,17,45 Mark I. McCarthy,46,47,48 Leif Groop,49 Emma Ahlqvist,49 Valeriya Lyssenko,49,50
Elisabet Agardh,49 Andrew Morris,51 Alex S.F. Doney,52 Helen M. Colhoun,53 Iiro Toppila,54,55,56
Niina Sandholm,54,55,56 Per-Henrik Groop,54,55,56,57 Shiro Maeda,14,15,16 Craig L. Hanis,18 Alan Penman,58
Ching J. Chen,59 Heather Hancock,59 Paul Mitchell,60 Jamie E. Craig,61 Emily Y. Chew,62
Andrew D. Paterson,63,64,65 Michael A. Grassi,66,67 Colin Palmer,68 Donald W. Bowden,7,8
Brian L. Yaspan,69 David Siscovick,70 Mary Frances Cotch,62 Jie Jin Wang,5,60 Kathryn P. Burdon,71
Tien Y. Wong,5,72 Barbara E.K. Klein,73 Ronald Klein,73 Jerome I. Rotter,4 Sudha K. Iyengar,2
Alkes L. Price,1 and Lucia Sobrin10
Diabetes 2019;68:441–456 | https://doi.org/10.2337/db18-0567
To identify genetic variants associated with diabeticretinopathy (DR), we performed a large multiethnicgenome-wide association study. Discovery includedeight European cohorts (n = 3,246) and seven AfricanAmerican cohorts (n = 2,611). We meta-analyzed acrosscohorts using inverse-variance weighting, with and with-out liability threshold modeling of glycemic control andduration of diabetes. Variants with a P value <1 3 1025
were investigated in replication cohorts that included18,545 European, 16,453 Asian, and 2,710 Hispanic sub-jects. After correction for multiple testing, the C allele ofrs142293996 in an intron of nuclear VCP-like (NVL) wasassociated with DR in European discovery cohorts (P =2.1 3 1029), but did not reach genome-wide significanceafter meta-analysis with replication cohorts. We applied
the Disease Association Protein-Protein Link Evaluator(DAPPLE) to our discovery results to test for evidence ofrisk being spread across underlying molecular path-ways. One protein–protein interaction network built fromgenes in regions associated with proliferative DR wasfound to have significant connectivity (P = 0.0009) andcorroborated with gene set enrichment analyses. Thesefindings suggest that genetic variation inNVL, aswell asvariation within a protein–protein interaction networkthat includes genes implicated in inflammation, mayinfluence risk for DR.
Diabetic retinopathy (DR) is a leading cause of blindness(1). Established risk factors include longer duration of
1Department of Epidemiology, Harvard T.H. Chan School of Public Health, Boston,MA2Department of Population and Quantitative Health Sciences, Case WesternUniversity, Cleveland, OH3Cardiovascular Health Research Unit, Department of Medicine, Epidemiology andHealth Services, University of Washington, Seattle, WA4Institute for Translational Genomics and Population Sciences, LA BioMed and
Department of Pediatrics, Harbor-UCLA Medical Center, Torrance, CA5Duke-NUS Medical School, Singapore6Singapore Eye Research Institute, Singapore National Eye Centre, Singapore7Center for Genomics and Personalized Medicine Research, Wake Forest Schoolof Medicine, Winston-Salem, NC8Department of Biochemistry, Wake Forest School of Medicine, Winston-Salem, NC9Department of Medicine, University of Iceland, Reykjavík, Iceland
Diabetes Volume 68, February 2019 441
COMPLIC
ATIO
NS
Dow
nloaded from http://diabetesjournals.org/diabetes/article-pdf/68/2/441/523790/db180567.pdf by guest on 21 February 2022

diabetes (DoD) and poor glycemic control (2). Geneticfactors are also implicated, with heritability of 52% forproliferative DR (PDR) (3,4). Several candidate gene andgenome-wide association studies (GWAS) have been con-ducted (5–11). Although several polymorphisms have beensuggested to be associated with DR, few have been con-vincingly replicated (10,12–15).
There are several reasons why studies have not yieldedconsistent findings. The genetic effects are likely modest,and identification requires large sample sizes. Previousstudies have not consistently accounted for the strongesttwo covariates, DoD and glycemic control. Liability thresh-old (LT) modeling is one way to incorporate these cova-riates while also increasing statistical power (16). Finally,
10Massachusetts Eye and Ear Department of Ophthalmology, Harvard MedicalSchool, Boston, MA11Medical Affairs, Ophthalmology, Sun Pharmaceutical Industries, Inc., Princeton,NJ12Division of Population Health Sciences, Ninewells Hospital and Medical School,University of Dundee School of Medicine, Scotland, U.K.13Program in Genetics and Genome Biology, The Hospital for Sick Children,Toronto, Ontario, Canada14Laboratory for Endocrinology, Metabolism and Kidney Diseases, RIKEN Centerfor Integrative Medical Sciences, Yokohama, Japan15Department of Advanced Genomic and Laboratory Medicine, Graduate School ofMedicine, University of the Ryukyus, Nishihara, Japan16Division of Clinical Laboratory and Blood Transfusion, University of the RyukyusHospital, Nishihara, Japan17Department of Preventive Medicine, Keck School of Medicine, University ofSouthern California, Los Angeles, CA18Human Genetics Center, School of Public Health, The University of Texas HealthScience Center at Houston, Houston, TX19Department of Ophthalmology, SMG-SNU Boramae Medical Center, SeoulNational University College of Medicine, Seoul, Korea20Endocrine Unit and Diabetes Unit, Division of General Internal Medicine,Massachusetts General Hospital, Boston, MA21Section of Genetic Medicine, University of Chicago, Chicago, IL22Department of Ophthalmology, Seoul National University College of Medicine,Seoul National University Bundang Hospital, Seongnam, Korea23Section of Diabetes and Metabolism, Harbor-UCLA Medical Center, University ofCalifornia, Los Angeles, Los Angeles, CA24Department of Nephrology and Hypertension, Los Angeles Biomedical ResearchInstitute at Harbor-University of California, Torrance, CA25Department of Medicine, Case Western Reserve University, Cleveland, OH26Department of Physiology and Biophysics, Case Western Reserve University,Cleveland, OH27Division of Nephrology, MetroHealth System, Cleveland, OH28Section on Nephrology, Department of Internal Medicine, Wake Forest School ofMedicine, Winston-Salem, NC29Division of Endocrinology and Metabolism, Department of Internal Medicine,Taichung Veterans General Hospital, Taichung, Taiwan30School of Medicine, Chung Shan Medical University, Taichung, Taiwan31School of Medicine, National Yang-Ming University, Taipei, Taiwan32School of Medicine, National Defense Medical Center, Taipei, Taiwan33RIKEN Center for Integrative Medical Sciences, Yokohama, Japan34Laboratory for Statistical Analysis, RIKEN Center for Integrative Medical Scien-ces, Kanagawa, Japan35Department of Genomic Medicine, Research Institute, National Cerebral andCardiovascular Center, Osaka, Japan36CHU de Poitiers, Centre d’Investigation Clinique, Poitiers, France37Université de Poitiers, UFR Médecine Pharmacie, Centre d’Investigation Clinique1402, Poitiers, France38INSERM, Centre d’Investigation Clinique 1402, Poitiers, France39L’Institut du Thorax, INSERM, CNRS, CHU Nantes, Nantes, France40Université Paris Diderot, Sorbonne Paris Cité, Paris, France41Department of Diabetology, Endocrinology and Nutrition, Assistance Publique–Hôpitaux de Paris, Bichat Hospital, DHU FIRE, Paris, France42INSERM U1138, Centre de Recherche des Cordeliers, Paris, France
43Team Genomics & Pathophysiology of Cardiovascular Diseases, UPMC, Sor-bonne Universités, INSERM, UMR_S 1166, Paris, France44Institute of Cardiometabolism and Nutrition, Paris, France45Department of Ophthalmology, USC Roski Eye Institute, Keck School of Medicineof the University of Southern California, Los Angeles, CA46Oxford Centre for Diabetes, Endocrinology and Metabolism, University of Oxford,Churchill Hospital, Oxford, U.K.47Wellcome Centre for Human Genetics, University of Oxford, Oxford, U.K.48NIHR Oxford Biomedical Research Centre, Churchill Hospital, Oxford, U.K.49Department of Clinical Sciences, Faculty of Medicine, Lund University, Malmö,Sweden50Department of Clinical Science, KG Jebsen Center for Diabetes Research,University of Bergen, Bergen, Norway51Usher Institute of Population Health Sciences and Informatics, University ofEdinburgh, Edinburgh, U.K.52Molecular and Clinical Medicine, Ninewells Hospital and Medical School,University of Dundee, Dundee, U.K.53Institute of Genetics and Molecular Medicine, Western General Hospital, Uni-versity of Edinburgh, Edinburgh, U.K.54Folkhälsan Institute of Genetics, Folkhälsan Research Center, Helsinki,Finland55Abdominal Center, Nephrology, University of Helsinki and Helsinki UniversityHospital, Helsinki, Finland56Research Programs Unit, Diabetes and Obesity, University of Helsinki,Helsinki, Finland57Department of Diabetes, Central Clinical School, Monash University, Mel-bourne, Victoria, Australia58Department of Preventive Medicine, John D. Bower School of PopulationHealth, University of Mississippi Medical Center, Jackson, MS59Department of Ophthalmology, University of Mississippi Medical Center,Jackson, MS60Centre for Vision Research, Westmead Institute for Medical Research, TheUniversity of Sydney, Sydney, New South Wales, Australia61Department of Ophthalmology, Flinders University, Bedford Park, SouthAustralia, Australia62Division of Epidemiology and Clinical Applications, National Eye Institute,National Institutes of Health, Bethesda, MD63Institute of Medical Sciences, University of Toronto, Toronto, Ontario,Canada64Program in Genetics & Genome Biology, Hospital for Sick Children,Toronto, Ontario, Canada65Epidemiology and Biostatistics, Dalla Lana School of Public Health,University of Toronto, Toronto, Ontario, Canada66Grassi Retina, Naperville, IL67Department of Ophthalmology and Visual Sciences, University of Illinoisat Chicago, Chicago, IL68Pat MacPherson Centre for Pharmacogenetics and Pharmacogenomics,Ninewells Hospital and Medical School, University of Dundee, Dundee,U.K.69Genentech, Inc., South San Francisco, CA70Institute for Urban Health, New York Academy of Medicine, New York,NY71Menzies Institute for Medical Research, University of Tasmania, Hobart,Tasmania, Australia
442 Genetic Study of Diabetic Retinopathy Diabetes Volume 68, February 2019
Dow
nloaded from http://diabetesjournals.org/diabetes/article-pdf/68/2/441/523790/db180567.pdf by guest on 21 February 2022
previous genetic studies have largely examined individualvariants. Techniques that examine top GWAS findingscollectively for variants that cluster in biological networksbased on known protein–protein interactions have thepotential to identify variants where there is insufficientpower to detect their individual effects.
The purpose of this study was to identify geneticvariants associated with DR by 1) assembling a largesample size through inclusion of multiple ethnicities, 2)incorporating DoD and glycemic control via LT modeling,and 3) collectively examining variants that cluster in bi-ological networks.
RESEARCH DESIGN AND METHODS
All studies conformed to the Declaration of Helsinki tenetsand were Health Insurance Portability and AccountabilityAct compliant. Written informed consent was obtainedfrom all participants. Institutional Review Board/EthicsCommittee approval was obtained by each individualstudy.
Discovery Sample DescriptionThe discovery sample, encompassing 7 African Americanand 8 European cohorts, arose from a consortium of 11 DRstudies for a total of 3,246 Europeans and 2,611 AfricanAmericans (6–8,12,13,17,18). Inclusion criteria for thediscovery stage were 1) type 2 diabetes, and 2) Europeanor African American ethnicity. Type 2 diabetes was definedas a fasting plasma glucose (FPG) $126 mg/dL (7.0mmol/L) or a hemoglobin A1c (HbA1c) $6.5% (48mmol/mol) (19) with onset of the diabetes after 30 yearsof age. Table 1 summarizes the DR phenotyping protocolsand covariates by discovery cohort. Phenotyping protocolshave been previously described (4,20–29), and additionaldetails are in the Supplementary Data.
DR Case-Control DefinitionsThe analysis plan prespecified four DR case-control defi-nitions with varying Early Treatment Diabetic RetinopathyStudy (ETDRS) score thresholds for case and controlsubjects (Table 2) (30). The primary case-control definitioncompared any DR to no DR (ETDRS $14 vs. ETDRS ,14,henceforth referred to as the any DR analysis). Therewere three secondary case-control definitions. The firstcompared patients with PDR to those without PDR
(ETDRS $60 vs. ETDRS ,60, henceforth the PDR anal-ysis). The second compared those with nonproliferativeDR (NPDR) or worse to those without DR (ETDRS$30 vs.ETDRS ,14, henceforth the NPDR analysis). The thirdcompared those with PDR to those without DR(ETDRS $60 vs. ETDRS ,14, henceforth the extremesof DR analysis). The rationale for the four definitions isin the Supplementary Data. Table 1 shows the availablesamples by cohort and ETDRS score thresholds. Supple-mentary Table 1 summarizes the mean values for glycemiccontrol and DoD.
Statistical AnalysesThe genotyping platforms and numbers of single nucleo-tide polymorphisms (SNPs) genotyped are summarized inSupplementary Table 2. Details about quality control,imputation, and data filtering are in the SupplementaryData. Supplementary Fig. 1 provides a flowchart of thediscovery and replication analyses. For the four main case-control definition analyses, we performed each of theanalyses 1) without incorporating DoD and glycemic con-trol using EIGENSOFT (16,31) and 2) with LT modeling ofDoD and glycemic control using LTSCORE (16). LT mod-eling details are in the Supplementary Data. Both theEIGENSOFT and LTSCORE tests were implemented inLTSOFT version 2.0 (see Web Resources in the Supple-mentary Data). For the discovery analyses, we ran principalcomponents (PC) analysis with EIGENSTRAT using onlytyped SNPs and five PCs, separately by ethnicity and case-control definition (32). We computed association analysesfor each of the seven African American and eightEuropean cohorts separately and then meta-analyzedby ethnicity. Meta-analysis was performed using inverse-variance weighting, accounting for both effective samplesize (defined as 4/[1/Ncase + 1/Ncontrol]) and allele frequency(33). We also performed multiethnic (Europeans andAfrican Americans together) meta-analyses for the anyDR and PDR analyses using inverse-variance weighting anda sensitivity analysis of the any DR meta-analyses inAfrican Americans and Europeans (see SupplementaryData). Because we included rare variants in this GWAS,we also tested the robustness of the top associations (P ,5 3 1028) by performing two additional tests: 1) a Fisherexact test on case or control subjects aggregated across allcohorts tested per variant and on each cohort separately,
72Department of Ophthalmology, Yong Loo Lin School of Medicine,National University of Singapore, Singapore73Department of Ophthalmology and Visual Sciences, University ofWisconsin-Madison, Madison, WI
Corresponding author: Lucia Sobrin, [email protected]
Received 23 May 2018 and accepted 12 November 2018
This article contains Supplementary Data online at https://diabetes.diabetesjournals.org/lookup/suppl/doi:10.2337/db18-0567/-/DC1.
A.L.P. and L.S. contributed equally to this work.
S.M.H. is currently affiliated with the Department of Pathology and LaboratoryMedicine, Hospital of the University of Pennsylvania, Philadelphia, PA.
C.J.C. is currently affiliated with the Retina Center, North Mississippi MedicalCenter, Tupelo, MS.
© 2018 by the American Diabetes Association. Readers may use this article aslong as the work is properly cited, the use is educational and not for profit, andthe work is not altered. More information is available at https://www.diabetesjournals.org/content/license.
diabetes.diabetesjournals.org Pollack and Associates 443
Dow
nloaded from http://diabetesjournals.org/diabetes/article-pdf/68/2/441/523790/db180567.pdf by guest on 21 February 2022

Tab
le1—
Studiesinclud
edin
thedisco
very
sample
Study
Pop
ulation
Diabetes
type
Num
ber
ofey
es/num
ber
offields/size
offieldsph
otog
raphe
dDiabetes
duration
Glyce
mic
control
mea
sure
Cas
esu
bjects
(ETD
RS$14
)Con
trol
subjects
(ETD
RS,14
)Cas
esu
bjects
(ETD
RS$60
)Con
trol
subjects
(ETD
RS,60
)Cas
esu
bjects
(ETD
RS$30
)
AAPDR
AA
22/7/30
°Y
HbA1c
274
5625
575
261
AGES*
EUR
22/2/45
°Y
HbA1c
8522
23
304
8
ARIC
AA
21/1/45
°Y
HbA1c
9626
53
358
73
ARIC
EUR
21/1/45
°Y
HbA1c
126
632
675
280
AUST
EUR
2NA‡
YHbA1c
522
435
187
770
346
BMES
EUR
22/5/30
°Y
FPG
124
208
133
137
CHS
AA
21/1/45
°Y
FPG
1935
450
14
CHS
EUR
21/1/45
°Y
FPG
2611
94
141
16
FIND-Eye
*AA
22/2/45
°†Y
HbA1c
330
167
264
233
303
FIND-Eye
EUR
22/2/45
°†Y
HbA1c
158
154
115
197
145
JHS
AA
22/7/30
°Y
HbA1c
9116
012
239
57
MESA
AA
22/2/45
°Y
HbA1c
101
258
1134
860
MESA
EUR
22/2/45
°Y
HbA1c
3820
02
236
12
RISE/RIDE
EUR
22/7/30
°Y
HbA1c
——
8011
7—
WFU
AA
2NA‡
YHbA1c
——
548
211
—
Total
AA
2—
YVaries
911
941
1,09
71,51
476
8
Total
EUR
2—
YVaries
1,07
91,97
039
82,84
864
4
AA,A
frican
American
;AAPDR,A
frican
American
ProliferativeDiabetic
Retinop
athy
Study;
AGES,Age
,Gen
e/Env
ironm
ent,Sus
ceptib
ility
-Rey
kjav
ikStudy
;ARIC,A
theros
cleros
isRiskin
Com
mun
ities
Study;
AUST,
Aus
tralianGen
eticsof
Diabetic
Retinop
athy
Study;
BMES,B
lueMou
ntains
Eye
Study;
CHS,C
ardiova
scular
Hea
lthStudy;
EUR,E
urop
ean;
FIND-Eye
,Fam
ilyStudy
ofNep
hrop
athy
andDiabetes
-Eye
;JH
S,Ja
ckso
nHea
rtStudy;
MESA,Multie
thnicStudy
ofAtheros
cleros
is;NA,no
tav
ailable;RIDE/RISE,Ran
ibizum
abInjectionin
Sub
jectswith
ClinicallySignifica
ntMac
ular
Edem
awith
Cen
terInv
olve
men
tSec
onda
ryto
Diabetes
;WFU
,Wak
eFo
rest
Sch
oolofM
edicineStudy;Y,informationon
diabetes
durationisav
ailable.*Coh
orts
with
outa
cces
sto
rawge
notypeinform
ation.
†Not
allF
IND-Eye
subjectsha
dpho
tograp
hs,b
utallp
artic
ipan
tsha
dha
rmon
izationof
exam
andclinicaldatato
anETD
RSsc
ore.
‡AUSTus
edex
aminationbyan
ophtha
lmolog
istto
asce
rtainDR.Th
eWFU
stud
yus
edaqu
estio
nnaire
toas
certainDR.
444 Genetic Study of Diabetic Retinopathy Diabetes Volume 68, February 2019
Dow
nloaded from http://diabetesjournals.org/diabetes/article-pdf/68/2/441/523790/db180567.pdf by guest on 21 February 2022

and 2) an inverse variance-weighted meta-analysis acrosscohorts using the ln of the odds ratio (OR) as the effectsize (34) without adjusting for covariates.
P Value Thresholds for Genome-Wide SignificanceThe P value thresholds for genome-wide significance werebased on empirically determined thresholds for differentancestral populations that account for the GWAS multipletesting burden, as well as population-specific linkage dis-equilibrium (LD) patterns (35):
1. P , 3.24 3 1028 for SNPs ascertained in Africanancestry populations
2. P , 5.0 3 1028 for SNPs ascertained in Europeanancestry populations
3. P, 3.243 1028 for SNPs ascertained in multiethnicmeta-analyses
We further corrected these thresholds for additionalmultiple testing from examination of four case-controldefinitions, each with and without covariate incorporation,for eight tests total. This yielded the following P valuethresholds for our study:
4. P , 3.75 3 1029 for SNPs ascertained in Africanancestry populations
5. P , 6.25 3 1029 for SNPs ascertained in Europeanancestry populations
6. P, 3.753 1029 for SNPs ascertained in multiethnicmeta-analyses
We note that correction for eight tests is conservativebecause the case-control definitions are not completelyindependent. We did not apply further multiple testingcorrection for the different ancestries analyzed.
Replication Meta-AnalysisEight European, eight Asian, and four Hispanic replicationcohorts provided summary statistics on SNPs with P, 131025 in the discovery analyses (Table 3). Their phenoty-ping/genotyping protocols have been previously de-scribed, and details are in the Supplementary Data(6–8,12,13,17,18). The rationale for including additionalethnicities in the replication phase is that high transethnicgenetic correlations have been documented for type 2
diabetes and other traits/diseases and support the useof multiethnic studies to increase sample size (36). Sup-plementary Table 3 summarizes the replication cohorts’mean values for HbA1c, FPG, and DoD. Replication wasin silico with existing genotyping. LT modeling was notapplied to the replication cohort analyses. The replicationcohorts used standard covariate adjustment in their re-gression models. Replication meta-analysis was alsoperformed using inverse-variance weighting, first individ-ually by each ethnicity (Europeans, Hispanics, and Asians)followed by all cohorts combined. Replicated genome-widesignificance had to meet the aforementioned thresholdsafter meta-analysis of the discovery and replication results.
Protein–Protein Interaction Analysis of Top GWAS LociTo identify significantly enriched protein networks amongthe loci with the highest statistical evidence for associationwith DR, we applied the Disease Association Protein-ProteinLink Evaluator (DAPPLE) to our discovery GWAS (37). It hasbeen shown that top associated loci, despite not beinggenome-wide significant, tend to cluster in biological net-works (37,38). For this reason, we examined the top 1,000loci from the discovery GWAS in the two monoethnicanalyses (European and African American) and for eachof the four case-control definition analyses that incorpo-rated DoD and glycemic control (eight network analyses intotal). Our threshold for significance was therefore P ,0.00625 (0.05 corrected for eight tests). We used thepublically available version of DAPPLE, and the protocolis outlined in the Supplementary Data. This methodologyhas been used successfully with previous GWAS to identifyprotein networks with biological relevance (37–39).
Gene Set Enrichment Analysis of DAPPLE SignificantGenesTo further support the protein–protein interaction resultsfrom the DAPPLE analysis, we applied gene set enrichmentanalysis (GSEA) using Meta-Analysis Gene-Set Enrichment ofvariaNT Associations (MAGENTA) (40) to the set of genessignificantly enriched for protein–protein interactions in theDAPPLE analysis (details in Supplementary Data).
Type 2 Diabetes and Associated Glycemic Traits LociTo understand to what extent genetic determination of DRmight reflect enrichment for type 2 diabetes or glycemic
Table 2—Four case-control subject definitions and the number of samples available for discovery for each definition
Analysis
Control subjects Case subjects
Score n AA n EUR Score n AA n EUR
Any DR (primary analysis) ,14 941 1,970 $14 911 1,079
PDR ,60 1,514 2,848 $60 1,097 398
NPDR ,14 941 1,970 $30 768 644
Extremes of DR ,14 941 1,970 $60 1,097 398
AA, African American; EUR, European; Score, ETDRS score range.
diabetes.diabetesjournals.org Pollack and Associates 445
Dow
nloaded from http://diabetesjournals.org/diabetes/article-pdf/68/2/441/523790/db180567.pdf by guest on 21 February 2022

Tab
le3—
Studiesinclud
edin
thereplic
ationmeta-an
alys
es
Coh
ortby
ance
stry
Ethnicity/nationa
lity
DM
type
Any
DR
analysis
PDR
analysis
NPDR
analysis
Extremes
ofDR
analysis
Cas
esu
bjects
Con
trol
subjects
Cas
esu
bjects
Con
trol
subjects
Cas
esu
bjects
Con
trol
subjects
Cas
esu
bjects
Con
trol
subjects
Asian KSDR
Korea
n2
1,51
657
191
81,16
71,30
057
191
857
1MESA
Chine
se2
2883
——
1783
——
RIKEN
Japan
ese
25,53
25,56
5—
—2,37
15,56
5—
—
SCESI
Chine
se2
7522
8—
——
——
—
SCESII
Chine
se2
2778
——
——
——
SiM
ES
Malay
221
455
7—
——
——
—
SINDI
Indian
231
566
9—
——
——
—
TUDR
Chine
se2
——
——
——
436
559
Europ
ean
DCCT/EDIC
prim
aryco
hort
North
American
1—
—53
598
——
——
DCCT/EDIC
seco
ndaryco
hort,
conv
entio
naltreatmen
tNorth
American
1—
—11
420
9—
——
—
DCCT/EDIC
seco
ndaryco
hort,intens
ive
trea
tmen
tNorth
American
1—
—42
288
——
——
GENESIS/G
ENEDIAB
Fren
ch1
277
999
808
468
277
607
277
468
GoD
ARTS
Sco
ttish
2,50
62,41
257
44,34
51,38
12,41
257
42,41
2GoK
inD
North
American
1—
—13
858
1—
——
—
SUMMIT
Europ
ean
1an
d2
5,42
24,30
2—
——
——
—
WESDR
North
American
1—
—30
929
4—
——
—
Hispan
icGOLD
RHispan
ic2
298
301
7652
321
530
176
301
LALE
SHispan
ic2
552
500
5399
934
150
053
500
MESA
Hispan
ic2
9219
2—
—52
192
——
SCHS
Mex
ican
American
252
824
710
367
240
624
710
324
7
Total
17,382
16,704
3,18
810
,144
6,36
010
,478
2,43
75,05
8
TheSUMMIT
(SUrrog
atemarke
rsforMicro-an
dMac
rova
scular
hard
endpo
ints
forInno
vativ
ediabetes
Tools)
coho
rtis
ameta-an
alysis
ofthreeEurop
eanstud
ies:
theFinn
ishDiabe
ticNep
hrop
athy
(FinnD
iane
)Study,
Sca
niaDiabetes
Reg
istry,
andtheEURODIAB
stud
y.DCCT/EDIC,Diabetes
Con
trol
andCom
plications
Trial/E
pidem
iology
ofDiabetes
Interven
tions
andCom
plications
;DM,diab
etes
mellitus
;GENESIS/G
ENEDIAB,Gen
eticsNep
hrop
athy
andSib
PairStudy/Gén
étique
dela
Nep
hrop
athieDiabétique
;GoD
ARTS
,Gen
eticsof
Diabetes
andAud
itRes
earchTa
ysideStudy;
GoK
inD,Gen
eticsof
Kidne
ysin
Diabe
tes;
GOLD
R,Gen
eticsof
Latin
oDiabetic
Retinop
athy
;KSDR,Korea
nStudyof
Diabetic
Retinop
athy
;LA
LES,Lo
sAng
eles
Latin
oEye
Study;
MESA,Multie
thnicStudyof
Atheros
cleros
is;RIKEN,Rikag
akuKen
kyus
ho-Institu
teof
Phy
sica
land
Che
mical
Res
earch;
SCES,Singa
pore
Chine
seEye
Study;
SCHS,StarrCou
ntyHea
lthStudies;
SiM
ES,Singa
poreMalay
Eye
Study
;SINDI,Singa
poreIndianEye
Study;
TUDR,Ta
iwan
–USDiabetic
Retinop
athy
Study
;WESDR,Wisco
nsin
Epidem
iologicStudyof
Diabetic
Retinop
athy
.
446 Genetic Study of Diabetic Retinopathy Diabetes Volume 68, February 2019
Dow
nloaded from http://diabetesjournals.org/diabetes/article-pdf/68/2/441/523790/db180567.pdf by guest on 21 February 2022

control genes, we computed a correlation between casestatus in the any DR analysis and the sum of the b*risk allele(for quantitative glycemic traits) or logOR*risk allele (for type2 diabetes) of the trait-associated SNPs for each cohort andeach trait (see Supplementary Data for details).
RESULTS
Discovery Meta-analysisSupplementary Fig. 2 shows the PC analysis. We observedlittle inflation in the association statistic distribution(Supplementary Fig. 3), indicating no significant popula-tion stratification as a confounder. Supplementary Fig. 4shows the Manhattan plots for the any DR analyses. Sup-plementary Tables 4–25 show the top 10 SNPs for indepen-dent loci with the lowest P values for each discovery analysis,including the sensitivity analyses (full results are availableon the Type 2 Diabetes Knowledge Portal [http://www.type2diabetesgenetics.org/], both on the downloads pageand fully integrated into the portal modules).
Table 4 shows SNPs that met the traditional nominalthreshold for genome-wide significance of P , 5 3 1028
from the discovery analyses. All of the SNPs in Table 4were either from the PDR or extremes of DR analyses; Fig.1 shows the QQ and Manhattan plots for the PDR andextremes of DR analyses. The results for the associations inTable 4 are shown for each cohort separately in Supple-mentary Table 26. Results for these SNPs after meta-analysis with replication samples both combined andseparated by ethnicity are shown in Table 5 and Supple-mentary Table 27, respectively.
Genome-Wide Significant Finding From the DiscoveryAnalyses in NVL GeneUsing the corrected significance thresholds, only one SNPin the discovery meta-analyses met genome-wide signifi-cance: rs142293996 for the extremes of DR analysis in-corporating DoD and glycemic control in Europeans (P =2.1 3 1029). The association was not significant withoutadjusting for covariates based on a Fisher exact test (Sup-plementary Table 28). This is an intronic variant in thenuclear VCP-like (NVL) gene, which encodes a member ofthe ATPases associated with diverse cellular activities(AAA) superfamily (41). The NVL gene is widely expressedin vivo with highest expression in retina (https://www.proteinatlas.org/ENSG00000143748-NVL/tissue#top).
We tested whether this association was a significantcis-expression quantitative trait locus (eQTL) in theGenotype-Tissue Expression (GTEx) Project release v7 (seeSupplementary Data for eQTL analysis details). This var-iant, rs142293996, lies in the 22nd intron of NVL and is inLD (r2 = 0.62) with variant rs41271487 in the 24th intronof NVL. rs41271487 is a significant eQTL (P = 6.43 1026;effect size 1.27) in the GTEx spinal cord cervical c-1 tissue,targeting calpain 2 (CAPN2), a calcium-activated neutralprotease (Supplementary Fig. 5). Common variants in theintron or regulatory region of CAPN2, 527–576 kb up-stream of the DR association, are associated with
Tab
le4—Variants
with
P<53
1028(trad
itional,
nominalthresho
ldforgeno
me-w
idesig
nificance)
inthe
disco
veryanalyses
Case-control
definition
Pop
ulation/LTmod
elingRSID
CHR
Position
Nearestgene
REF
Case
subjects
Controlsub
jects
NEFF
POR
95%CI
NRAF
NRAF
PDR
AA/no
rs1155238823
167876205GOLIM
4A
1,1050.9823
1,1190.9611
1,4529.42
310
29
3.102.12,
4.53
PDR
AA/yes
rs1155238823
167876205GOLIM
4A
1,1050.9823
1,1190.9611
1,4525.37
310
29
3.102.14,
4.50
PDR
EUR/no
rs1392056452
201949806NDUFB
3T
3090.9725
9750.9959
9073.93
310
28
0.130.06,
0.27
PDR
EUR/yes
rs1779148817
26232732NOS2/LY
RM9
T309
0.9871975
0.9661907
7.263
1029
3.702.40,
5.71
Extrem
esof
DR
AA/no
rs1843407841
4589883AJA
P1
C520
0.999230
0.9784603
3.523
1028
NA
NA
Extrem
esof
DR
EUR/yes
rs1422939961
224448059NVL
C187
0.9947435
0.9874523
2.103
1029
2.381.80,
3.14
Extrem
esof
DR
EUR/yes
rs177069583
73837141PDZRN3
T308
0.8139594
0.7332797
3.043
1028
1.581.35,
1.85
Extrem
esof
DR
EUR/yes
rs801176172
40855125SLC
8A1
T308
0.9838594
0.9445797
4.043
1028
3.782.37,
6.02
AA,A
fricanAmerican;C
HR,chrom
osome;E
UR,E
uropean;LT,liab
ilitythreshold
;NA,notavailab
le;NEFF,effective
samplesize;R
AF,reference
allelefreq
uency;REF,reference
allele;RSID,
rsidentifier.
diabetes.diabetesjournals.org Pollack and Associates 447
Dow
nloaded from http://diabetesjournals.org/diabetes/article-pdf/68/2/441/523790/db180567.pdf by guest on 21 February 2022

variation in serum a-carotene levels (42), a vitamin Aprecursor required for sight, supporting a functionalrole for this gene. Based on the eQTL analysis, in-creased expression of CAPN2 is associated with de-creased risk of DR (Supplementary Fig. 6). CAPN2 isexpressed in the retina (https://www.proteinatlas.org/ENSG00000162909-CAPN2/tissue).
When examined in the replication analyses (which in-cluded a more diverse population), the direction of effect
in the replication cohorts for rs142293996 was the same,but the meta-analysis P value was not genome-wide sig-nificant (P = 4.10 3 1026).
Top Finding From the African American DiscoveryAnalysesIn African Americans, the SNP with the lowest P valuewas rs115523882 from the PDR analysis (P = 5.37 31029). This was short of the 3.75 3 1029 threshold for
Figure 1—Quantile-quantile and Manhattan plots for the PDR and extremes of DR discovery meta-analyses for PDR analysis in AfricanAmerican participants with LT modeling of DoD and glycemic control (A and B), PDR analysis in European participants with LT modeling ofDoD and glycemic control (C and D), extremes of DR analysis in African American participants with LTmodeling of DoD and glycemic control(E and F ), and extremes of DR analysis in European participants with LTmodeling of DoD and glycemic control (G andH). The horizontal line ineach of the Manhattan plots indicates the nominal threshold for genome-wide significance (P = 5 3 1028).
448 Genetic Study of Diabetic Retinopathy Diabetes Volume 68, February 2019
Dow
nloaded from http://diabetesjournals.org/diabetes/article-pdf/68/2/441/523790/db180567.pdf by guest on 21 February 2022

significance in African Americans. We could not reproducethis finding in the replication cohorts. This variant islocated near the GOLIM4 gene, which helps processproteins and mediates protein transport. The SNPrs115523882 specifically changes a motif that is a bind-ing site for Nlx3, a transcription factor in blood, sug-gesting it plays a regulatory role. This variant is mainlypresent in people of African ancestry (minor allelefrequency [MAF] = 0.0393) and not common in otherethnic groups, suggesting we may have had insufficientpower to replicate it.
Of note, there was one SNP, rs184340784, suggestivelyassociated with DR (P = 3.52 3 1028) in the extremes of
DR analysis without covariates in African Americansthat was not present in our replication cohorts (due tolow MAF) and thus could not be replicated. Neitherrs115523882 nor rs184340784 was analyzed for eQTLactivity in GTEx due to their low MAF (MAF , 0.01 inGTEx tissues).
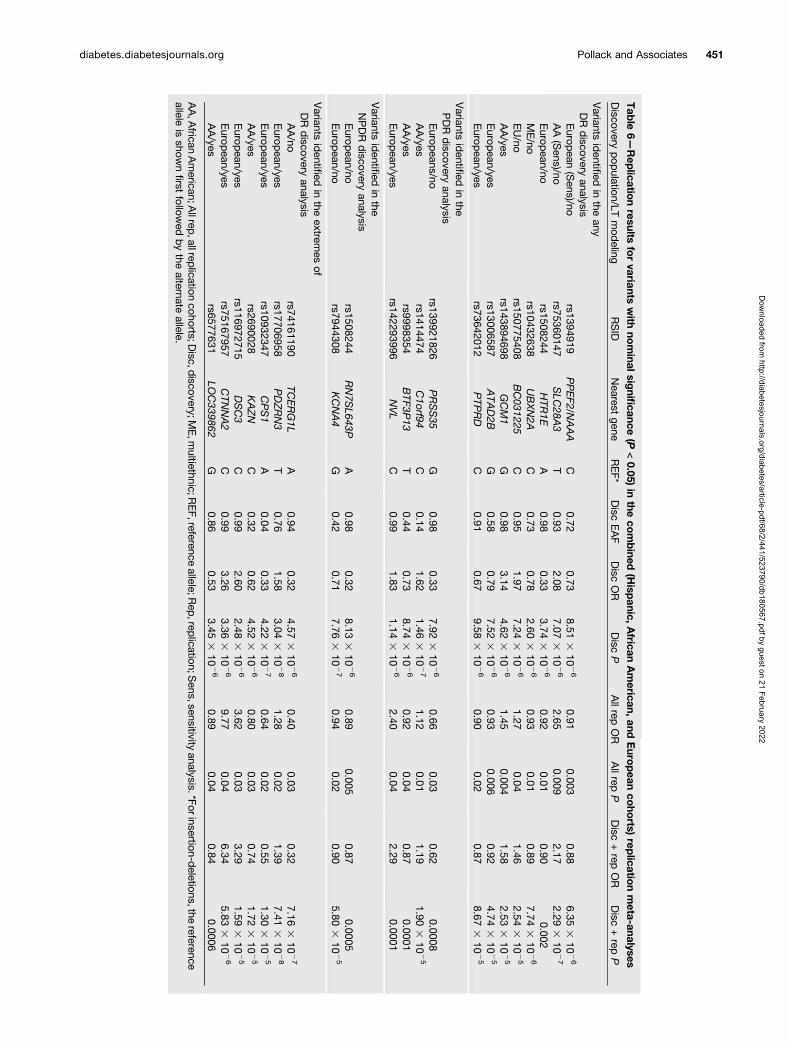
Table 6 and Supplementary Table 29 show the discoveryvariants with P , 1 3 1025 that achieved a nominal P ,0.05 in the complete replication sample or in one of thereplication ethnicities, respectively, and had the samedirection as the discovery samples. None of these variantsachieved genome-wide significance after discovery andreplication meta-analysis, as defined above.
Figure 1—Continued.
diabetes.diabetesjournals.org Pollack and Associates 449
Dow
nloaded from http://diabetesjournals.org/diabetes/article-pdf/68/2/441/523790/db180567.pdf by guest on 21 February 2022
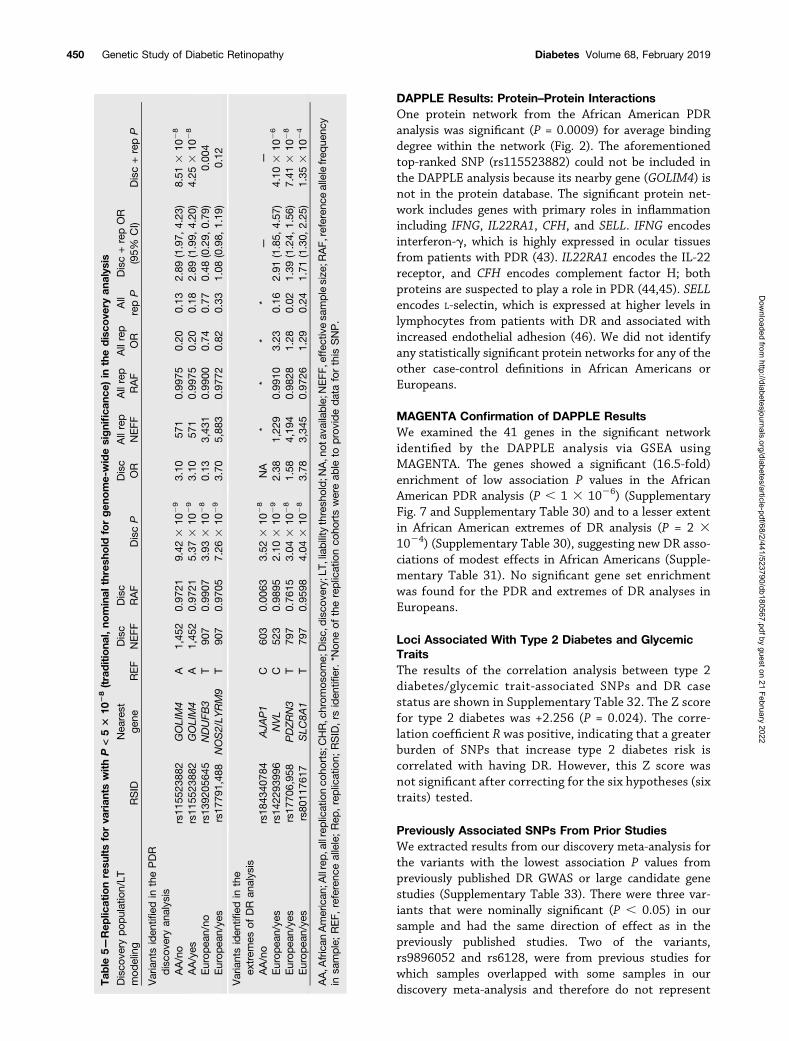
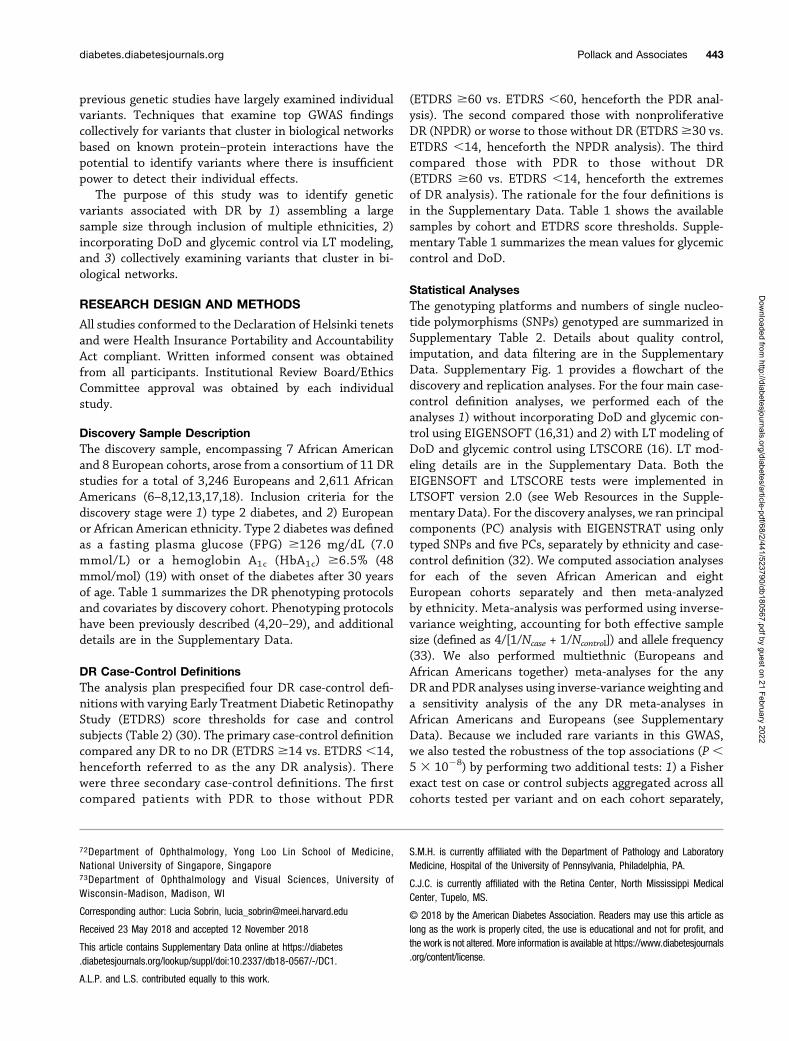
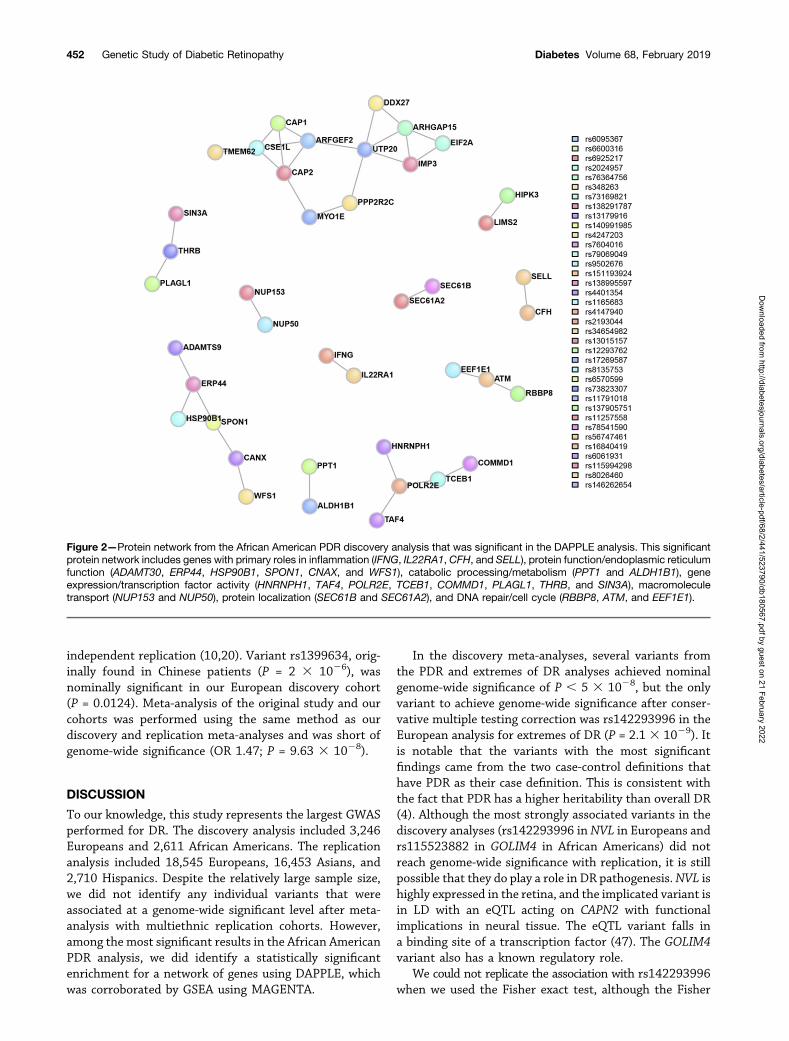
DAPPLE Results: Protein–Protein InteractionsOne protein network from the African American PDRanalysis was significant (P = 0.0009) for average bindingdegree within the network (Fig. 2). The aforementionedtop-ranked SNP (rs115523882) could not be included inthe DAPPLE analysis because its nearby gene (GOLIM4) isnot in the protein database. The significant protein net-work includes genes with primary roles in inflammationincluding IFNG, IL22RA1, CFH, and SELL. IFNG encodesinterferon-g, which is highly expressed in ocular tissuesfrom patients with PDR (43). IL22RA1 encodes the IL-22receptor, and CFH encodes complement factor H; bothproteins are suspected to play a role in PDR (44,45). SELLencodes L-selectin, which is expressed at higher levels inlymphocytes from patients with DR and associated withincreased endothelial adhesion (46). We did not identifyany statistically significant protein networks for any of theother case-control definitions in African Americans orEuropeans.
MAGENTA Confirmation of DAPPLE ResultsWe examined the 41 genes in the significant networkidentified by the DAPPLE analysis via GSEA usingMAGENTA. The genes showed a significant (16.5-fold)enrichment of low association P values in the AfricanAmerican PDR analysis (P , 1 3 1026) (SupplementaryFig. 7 and Supplementary Table 30) and to a lesser extentin African American extremes of DR analysis (P = 2 31024) (Supplementary Table 30), suggesting new DR asso-ciations of modest effects in African Americans (Supple-mentary Table 31). No significant gene set enrichmentwas found for the PDR and extremes of DR analyses inEuropeans.
Loci Associated With Type 2 Diabetes and GlycemicTraitsThe results of the correlation analysis between type 2diabetes/glycemic trait-associated SNPs and DR casestatus are shown in Supplementary Table 32. The Z scorefor type 2 diabetes was +2.256 (P = 0.024). The corre-lation coefficient R was positive, indicating that a greaterburden of SNPs that increase type 2 diabetes risk iscorrelated with having DR. However, this Z score wasnot significant after correcting for the six hypotheses (sixtraits) tested.
Previously Associated SNPs From Prior StudiesWe extracted results from our discovery meta-analysis forthe variants with the lowest association P values frompreviously published DR GWAS or large candidate genestudies (Supplementary Table 33). There were three var-iants that were nominally significant (P , 0.05) in oursample and had the same direction of effect as in thepreviously published studies. Two of the variants,rs9896052 and rs6128, were from previous studies forwhich samples overlapped with some samples in ourdiscovery meta-analysis and therefore do not represent
Tab
le5—
Rep
licationresu
ltsforva
rian
tswithP<53
1028(traditiona
l,no
minal
thresh
old
forgen
ome-widesignifica
nce)
inthedisco
very
analys
is
Disco
very
pop
ulation/LT
mod
eling
RSID
Nea
rest
gene
REF
Disc
NEFF
Disc
RAF
DiscP
Disc
OR
Allrep
NEFF
Allrep
RAF
Allrep
OR
All
repP
Disc+repOR
(95%
CI)
Disc+repP
Variantsiden
tified
inthePDR
disco
very
analys
isAA/no
rs11
5523
882
GOLIM4
A1,45
20.97
219.42
310
29
3.10
571
0.99
750.20
0.13
2.89
(1.97,
4.23
)8.51
310
28
AA/yes
rs11
5523
882
GOLIM4
A1,45
20.97
215.37
310
29
3.10
571
0.99
750.20
0.18
2.89
(1.99,
4.20
)4.25
310
28
Europ
ean/no
rs13
9205
645
NDUFB
3T
907
0.99
073.93
310
28
0.13
3,43
10.99
000.74
0.77
0.48
(0.29,
0.79
)0.00
4Europ
ean/ye
srs17
791,48
8NOS2/LY
RM9
T90
70.97
057.26
310
29
3.70
5,88
30.97
720.82
0.33
1.08
(0.98,
1.19
)0.12
Variantsiden
tified
inthe
extrem
esof
DR
analysis
AA/no
rs18
4340
784
AJA
P1
C60
30.00
633.52
310
28
NA
**
**
——
Europ
ean/ye
srs14
2293
996
NVL
C52
30.98
952.10
310
29
2.38
1,22
90.99
103.23
0.16
2.91
(1.85,
4.57
)4.10
310
26
Europ
ean/ye
srs17
706,95
8PDZRN3
T79
70.76
153.04
310
28
1.58
4,19
40.98
281.28
0.02
1.39
(1.24,
1.56
)7.41
310
28
Europ
ean/ye
srs80
1176
17SLC
8A1
T79
70.95
984.04
310
28
3.78
3,34
50.97
261.29
0.24
1.71
(1.30,
2.25
)1.35
310
24
AA,A
frican
American
;Allrep,a
llreplicationco
horts;CHR,chrom
osom
e;Disc,
disco
very;L
T,liability
thresh
old;N
A,n
otav
ailable;N
EFF
,effec
tivesa
mplesize
;RAF,
referenc
eallelefreq
uenc
yin
sample;
REF,
referenc
eallele;Rep
,replication;
RSID,rs
iden
tifier.*N
oneof
thereplicationco
hortswereab
leto
prov
ideda
taforthis
SNP.
450 Genetic Study of Diabetic Retinopathy Diabetes Volume 68, February 2019
Dow
nloaded from http://diabetesjournals.org/diabetes/article-pdf/68/2/441/523790/db180567.pdf by guest on 21 February 2022
Tab
le6—Rep
licationresults
forvariants
with
nominalsig
nificance
(P<0.05)
inthe
combined
(Hisp
anic,African
American,
andEuro
pean
coho
rts)rep
licationmeta-analyses
Discovery
pop
ulation/LTmod
elingRSID
Nearest
geneREF*
Disc
EAF
Disc
OR
Disc
PAllrep
OR
Allrep
PDisc
+rep
OR
Disc
+rep
P
Variants
identified
inthe
anyDR
discovery
analysisEurop
ean(Sens)/no
rs1394919PPEF2/N
AAA
C0.72
0.738.51
310
26
0.910.003
0.886.35
310
26
AA(Sens)/no
rs75360147SLC
28A3
T0.93
2.087.07
310
26
2.650.009
2.172.29
310
27
Europ
ean/nors1508244
HTR
1EA
0.980.33
3.743
1026
0.920.01
0.900.002
ME/no
rs10432638UBXN2A
C0.73
0.782.60
310
26
0.930.01
0.897.74
310
26
EU/no
rs150775408BC031225
C0.95
1.977.24
310
26
1.270.04
1.462.54
310
25
AA/yes
rs143894698GCM1
G0.98
3.144.62
310
26
1.450.004
1.582.53
310
25
Europ
ean/yesrs13006587
ATA
D2B
G0.58
0.797.52
310
26
0.930.006
0.924.74
310
25
Europ
ean/yesrs73642012
PTP
RD
C0.91
0.679.58
310
26
0.900.02
0.878.67
310
25
Variants
identified
inthe
PDR
discovery
analysisEurop
eans/nors139921826
PRSS35
G0.98
0.337.92
310
26
0.660.03
0.620.0008
AA/yes
rs1414474C1orf94
C0.14
1.621.46
310
27
1.120.01
1.191.90
310
25
AA/yes
rs9998354BTF3P
13T
0.440.73
8.743
1026
0.920.04
0.870.0001
Europ
ean/yesrs142293996
NVL
C0.99
1.831.14
310
26
2.400.04
2.290.0001
Variants
identified
inthe
NPDR
discovery
analysisEurop
ean/nors1508244
RN7S
L643PA
0.980.32
8.133
1026
0.890.005
0.870.0005
Europ
ean/nors7944308
KCNA4
G0.42
0.717.76
310
27
0.940.02
0.905.80
310
25
Variants
identified
inthe
extremes
ofDR
discovery
analysisAA/no
rs74161190TC
ERG1L
A0.94
0.324.57
310
26
0.400.03
0.327.16
310
27
Europ
ean/yesrs17706958
PDZRN3
T0.76
1.583.04
310
28
1.280.02
1.397.41
310
28
Europ
ean/yesrs10932347
CPS1
A0.04
0.334.22
310
27
0.640.02
0.551.30
310
25
AA/yes
rs2690028KAZN
C0.32
0.624.52
310
26
0.800.03
0.741.72
310
25
Europ
ean/yesrs116972715
DSC3
C0.99
2.602.48
310
26
3.620.03
3.291.59
310
25
Europ
ean/yesrs75167957
CTN
NA2
C0.99
3.263.36
310
26
9.770.04
6.345.83
310
26
AA/yes
rs6577631LO
C339862
G0.86
0.533.45
310
26
0.890.04
0.840.0006
AA,A
fricanAmerican;A
llrep,allrep
licationcohorts;D
isc,discovery;M
E,m
ultiethnic;REF,reference
allele;Rep
,replication;S
ens,sensitivityanalysis.*Forinsertion-d
eletions,thereference
alleleis
shownfirst
followed
bythe
alternateallele.
diabetes.diabetesjournals.org Pollack and Associates 451
Dow
nloaded from http://diabetesjournals.org/diabetes/article-pdf/68/2/441/523790/db180567.pdf by guest on 21 February 2022
independent replication (10,20). Variant rs1399634, orig-inally found in Chinese patients (P = 2 3 1026), wasnominally significant in our European discovery cohort(P = 0.0124). Meta-analysis of the original study and ourcohorts was performed using the same method as ourdiscovery and replication meta-analyses and was short ofgenome-wide significance (OR 1.47; P = 9.63 3 1028).
DISCUSSION
To our knowledge, this study represents the largest GWASperformed for DR. The discovery analysis included 3,246Europeans and 2,611 African Americans. The replicationanalysis included 18,545 Europeans, 16,453 Asians, and2,710 Hispanics. Despite the relatively large sample size,we did not identify any individual variants that wereassociated at a genome-wide significant level after meta-analysis with multiethnic replication cohorts. However,among the most significant results in the African AmericanPDR analysis, we did identify a statistically significantenrichment for a network of genes using DAPPLE, whichwas corroborated by GSEA using MAGENTA.
In the discovery meta-analyses, several variants fromthe PDR and extremes of DR analyses achieved nominalgenome-wide significance of P , 5 3 1028, but the onlyvariant to achieve genome-wide significance after conser-vative multiple testing correction was rs142293996 in theEuropean analysis for extremes of DR (P = 2.1 3 1029). Itis notable that the variants with the most significantfindings came from the two case-control definitions thathave PDR as their case definition. This is consistent withthe fact that PDR has a higher heritability than overall DR(4). Although the most strongly associated variants in thediscovery analyses (rs142293996 in NVL in Europeans andrs115523882 in GOLIM4 in African Americans) did notreach genome-wide significance with replication, it is stillpossible that they do play a role in DR pathogenesis.NVL ishighly expressed in the retina, and the implicated variant isin LD with an eQTL acting on CAPN2 with functionalimplications in neural tissue. The eQTL variant falls ina binding site of a transcription factor (47). The GOLIM4variant also has a known regulatory role.
We could not replicate the association with rs142293996when we used the Fisher exact test, although the Fisher
Figure 2—Protein network from the African American PDR discovery analysis that was significant in the DAPPLE analysis. This significantprotein network includes genes with primary roles in inflammation (IFNG, IL22RA1, CFH, and SELL), protein function/endoplasmic reticulumfunction (ADAMT30, ERP44, HSP90B1, SPON1, CNAX, and WFS1), catabolic processing/metabolism (PPT1 and ALDH1B1), geneexpression/transcription factor activity (HNRNPH1, TAF4, POLR2E, TCEB1, COMMD1, PLAGL1, THRB, and SIN3A), macromoleculetransport (NUP153 and NUP50), protein localization (SEC61B and SEC61A2), and DNA repair/cell cycle (RBBP8, ATM, and EEF1E1).
452 Genetic Study of Diabetic Retinopathy Diabetes Volume 68, February 2019
Dow
nloaded from http://diabetesjournals.org/diabetes/article-pdf/68/2/441/523790/db180567.pdf by guest on 21 February 2022

exact test did not allow for covariate incorporation. Thereis potential for inflated false-positive rate when standardassociation methods are applied to rare (e.g., MAF ,1%)variants in imbalanced (e.g., case fraction ,10%) case-control cohorts at modest sample sizes (48). However,most cohorts in this study did not have case frac-tion ,10%. Larger sample sizes will help determine theconfidence in these top associations.
There was one variant suggestively associated in theextremes of DR discovery analysis in African Americans,rs184340784, which was not present in any replicationdata sets. The T allele of this variant has a frequency of0.0023 in African populations and 0 in European, EastAsian, South Asian, and Hispanic populations in the1000 Genomes phase 3 panel. In the discovery analysis,the P = 3.52 3 1028 was shy of the genome-wide signif-icance threshold of 3.75 3 1029 for variants discoveredfrom the African ancestry analyses. This variant is withinan intronic region upstream of adherens junctions–asso-ciated protein 1 (AJAP1), which has its highest expressionin brain frontal cortex but is also expressed in the retina(https://www.proteinatlas.org/ENSG00000196581-AJAP1/tissue).
In the DAPPLE analysis, we did find that the top signalsfor the PDR analyses in African Americans analysis wereenriched for a biologic network. The advantage of DAPPLEis that it can identify a protein pathway that may not beevident solely from the primary individual variant GWAS.The presence of an underlying network among the top locisuggests there are likely true associations within topfindings that have yet to reach genome-wide significancedue to limited power. Multiple pathways including in-flammatory pathways are implicated by this network. Toconfirm biological significance, these results will need to befollowed up with functional in vitro studies.
The DAPPLE results were corroborated by theMAGENTA GSEA in the African American PDR and extremesof DR analyses. This network of genes, however, was notenriched for in Europeans. This could either be due totechnical differences (e.g., the number of African Americancases is approximately threefold larger than the number ofEuropean cases) or due to biological reasons. For example,we found that the allele frequencies of the most significantvariant per gene for 40% of these protein-interacting genesare rare in Europeans (MAF ,0.2%), whereas they arecommon in African Americans (MAF .1%), according tothe Genome Aggregation Database (see Web Resources inthe Supplemental Data).
In the analysis between type 2 diabetes/glycemictrait SNPs and DR case status, only type 2 diabetesvariants were significantly associated with DR prior to,but not after, multiple testing correction. One previousstudy examined aggregate effects of 76 type 2 diabetes–associated variants in Asian patients (49). Participantsin the top tertile of type 2 diabetes risk score were2.56-fold more likely to have DR compared with lowesttertile participants. Our study’s result showed the same
direction of effect as in the prior study, with type 2 dia-betes risk-raising alleles increasing DR risk. The priorstudy did not examine glycemic traits. Our inability todetect a correlation for glycemic traits may be due tothe small amount of glycemic variance captured by thesevariants. In European patients, HbA1c SNPs explain ;5%of HbA1c variance (50).
We were unable to replicate findings from previousstudies (6–8,12,13,17,18). We did have the same directionof effect in our European discovery sample for rs1399634(LRP2), which was initially reported in an Asian popula-tion. However, the meta-analysis was shy of genome-wide significance. The overall lack of replication ofprevious reports’ findings is not surprising, given theheterogeneity in phenotyping, case-control definitions,ethnicities, and analytic approaches, although we did tryto match our case-control definitions to the originalstudies’ definitions.
There are many potential reasons why we were unableto identify replicable, significant associations from ourdiscovery GWAS. First, the genetic risk in DR developmentmay be quite small in proportion to the nongenetic riskfactors. Therefore, even though we assembled the largestsample, it may not be sufficient to detect very modesteffects. There was heterogeneity between the discoveryand replication cohorts that could contribute to inability toreplicate. The discovery cohort included individuals withtype 2 diabetes, whereas the replication cohorts includedindividuals with either type 1 or type 2 diabetes. It is notknown definitively whether genetic variants for DR differbetween type 1 and type 2 diabetes. Clinically, DR phe-notypes are similar in patients with type 1 and type2 diabetes, so we hypothesize that at least some of thegenetic risk is shared. However, we cannot be certain ofthis, and heterogeneity of diabetes type might have con-tributed to lack of replication. The discovery cohortincluded individuals who were of either European orAfrican American descent, whereas the replicationcohorts included individuals of European, Hispanic, orAsian descent. This heterogeneity could also have led tolack of replication. Europeans were represented in boththe discovery and replication phases, but even our Eu-ropean discovery analysis has limited power. Power cal-culations show that our discovery GWAS for the any DRanalysis in Europeans had 100% power to detect a variantwith an MAF of 0.40 with a heterozygous genotypicrelative risk of 1.5 with a P value ,5 3 1028, whereasthe power decreases to 5% for the same variant withgenotypic relative risk of 1.2.
We attempted to harmonize the phenotypes as much aspossible, but there were some limits to complete harmo-nization, particularly for cohorts with limited-field or nophotography. Misclassification of participants because oflimited DR ascertainment could have biased the results tothe null. Although we did use LTSCORE modeling toaccount for DoD, we may have had some misclassificationbias because we did not have a minimum DoD for control
diabetes.diabetesjournals.org Pollack and Associates 453
Dow
nloaded from http://diabetesjournals.org/diabetes/article-pdf/68/2/441/523790/db180567.pdf by guest on 21 February 2022

subjects (i.e., some control subjects could have developedDR with longer DoD), which would also bias our resulttoward the null. We only had one HbA1c measure. Re-peated HbA1c measures would reflect long-term glycemiamore accurately.
In summary, we have executed the largest GWAS of DRto date. There were no genome-wide significant findings,but analysis of protein–protein interaction networks pointto possible candidate pathways for PDR in African Amer-icans. Future studies examining DR genetics would benefitfrom a greater international collaboration encompassinglarger samples that would allow strict case-control defi-nitions that define a minimal DoD without sacrificingpower. Furthermore, these studies should focus case def-initions on the advanced forms of DR—PDR and diabeticmacular edema—and incorporate more refined phenotyp-ing, particularly optical coherence tomography for diabeticmacular edema. Finally, whole-genome sequencing mightreveal a role for very rare variants, particularly for the DRphenotypic extremes.
Acknowledgments. The authors thank the staff at the Icelandic HeartAssociation and the Age, Gene/Environment Susceptibility - Reykjavik Study(AGES) participants who volunteered time and allowed the authors to contributedata to this international project; the staff and participants of the AtherosclerosisRisk in Communities (ARIC) study for important contributions; and all of thepatients recruited in the Genetics of Diabetes and Audit Research Tayside Study(GoDARTS) and other European and African American cohorts. The authorsespecially thank the Health Informatics Centre in the School of Medicine, Universityof Dundee, for help with data access; the staff and participants of the JacksonHeart Study (JHS); and the other investigators, staff, and participants of theMultiethnic Study of Atherosclerosis (MESA) study for valuable contributions(a full list of participating MESA investigators and institutions can be found athttps://www.mesa-nhlbi.org/). A full list of principal Cardiovascular Health Study(CHS) investigators and institutions can be found at CHS-NHLBI.org.Funding. This study has received support from the following organizationsfor this research: Research to Prevent Blindness, Inc., National Eye Institute (EY-16335, EY-22302, EY-11753, and R01-EY-023644 and core grant EY-001792),National Institutes of Health (NIH) (R01-HG-006399), Massachusetts Lions EyeResearch Fund, Alcon Research Institute, American Diabetes Association (1-11-CT-51), and Harvard Catalyst. AGES was supported by the NIH through theIntramural Research Program of the National Institute on Aging (ZIAAG007380)and the National Eye Institute (ZIAEY00401), NIH contract number N01-AG-1-2100, Hjartavernd (the Icelandic Heart Association), the Althingi (IcelandicParliament), and the University of Iceland Research Fund.
The funders had no role in collection, management, analysis, or interpretation ofdata and were not involved in the preparation, writing, or approval of the article orthe decision to submit the article for publication.
ARIC is carried out as a collaborative study supported by National Heart,Lung, and Blood Institute (NHLBI) contracts HHSN268201100005C,HHSN268201100006C, HHSN268201100007C, HHSN268201100008C,HHSN268201100009C, HHSN268201100010C, HHSN268201100011C, andHHSN268201100012C and R01-HL-087641, R01-HL-59367, and R01-HL-086694; National Human Genome Research Institute contract U01-HG-004402; and NIH contract HHSN268200625226C. ARIC has been funded inwhole or in part with federal funds from the National Heart, Lung, and BloodInstitute, NIH, Department of Health and Human Services (contract num-bers HHSN268201700001I, HHSN268201700002I, HHSN268201700003I,HHSN268201700004I, and HHSN268201700005I). Infrastructure was partly
supported by the NIH and NIH Roadmap for Medical Research (grant UL1-RR-025005). Funding support for “Building on GWAS for NHLBI-diseases: the U.S.CHARGE consortium” was provided by the NIH through the American Recovery andReinvestment Act of 2009 (5RC2HL102419). The Australian Genetics of DiabeticRetinopathy Study was supported by the Australian National Health and MedicalResearch Council (NHMRC) (595918), Canberra, Australia, and the OphthalmicResearch Institute of Australia. J.E.C. is supported by a Practitioner Fellowshipfrom the NHMRC. K.P.B. is supported by a Senior Research Fellowship from theNHMRC. The Blue Mountains Eye Study (BMES) was supported by the AustralianNHMRC (project grant identification numbers 974159, 211069, and 302068) andCentre for Clinical Research Excellence in Translational Clinical Research in EyeDiseases (grant 529923). The BMES GWAS and genotyping costs were sup-ported by the Australian NHMRC (project grant identification numbers 512423,475604, and 529912) and the Wellcome Trust (U.K.) as part of the WellcomeTrust Case Control Consortium 2 (WTCCC2) (085475/B/08/Z and 085475/08/Z).The Cardiovascular Health Study was supported by NHLBI contractsHHSN268201200036C, HHSN268200800007C, HHSN268201800001C, N01-HC-55222, N01-HC-85079, N01-HC-85080, N01-HC-85081, N01-HC-85082,N01-HC-85083, N01-HC-85086, and N01-HC-75150 and grants U01-HL-080295 and U01-HL-130114, with additional contribution from the NationalInstitute of Neurological Disorders and Stroke. Additional support was provided byNational Institute on Aging grant R01-AG-023629.The content is solely the responsibility of the authors and does not necessarily
represent the official views of the NIH. Subjects included in the present analysisconsented to the use of their genetic information.This work was supported by Tenovus Scotland (2015 T15/40 to W.M.).
GoDARTS was supported by Chief Scientist Office Scotland and Diabetes UK.The genotyping costs were granted by the Wellcome Trust for WTCCC2 samplesand by the Innovative Medicines Initiative for SUMMIT (SUrrogate markers forMicro- and Macrovascular hard endpoints for Innovative diabetes Tools) samples.The SUMMIT consortium was supported by the European Union’s SeventhFramework Programme (FP7/2007-2013) for the Innovative Medicine Initiativeunder grant agreement IMI/115006 (to the SUMMIT consortium). FinnDianewas supported by grants from the Folkhälsan Research Foundation, the Wilhelmand Else Stockmann Foundation, the Liv och Hälsa Foundation, Helsinki Uni-versity Central Hospital Research Funds (EVO), the Novo Nordisk Foundation(NNF14SA0003), and the Academy of Finland (134379, 275614, and 299200).The JHS is supported by the NHLBI and the National Institute on MinorityHealth and Health Disparities and is conducted in collaboration with JacksonState University (contracts HHSN268201300049C and HHSN268201300050C),Tougaloo College (HHSN268201300048C), and the University of MississippiMedical Center (HHSN268201300046C and HHSN268201300047C).The views expressed in this manuscript are those of the authors and do not
necessarily represent the views of the NHLBI, the NIH, or the U.S. Department ofHealth and Human Services.MESA and the MESA SHARe (SNP Health Association Resource) project are
conducted and supported by the NHLBI in collaboration with MESA investigators.Support for MESA is provided by NHLBI contracts HHSN268201500003I, N01-HC-95159, N01-HC-95160, N01-HC-95161, N01-HC-95162, N01-HC-95163, N01-HC-95164, N01-HC-95165, N01-HC-95166, N01-HC-95167, N01-HC-95168,N01-HC-95169, UL1-TR-000040, UL1-TR-001079, UL1-TR-001881, andDK-063491. Additional funding is provided by the Intramural Research Programof the National Eye Institute (ZIAEY000403). Funding for SHARe genotyping wasprovided by NHLBI contract N02-HL-64278. Genotyping was performed atAffymetrix (Santa Clara, CA) and the Broad Institute of MIT and Harvard(Boston, MA) using the Affymetrix Genome-Wide Human SNP Array 6.0. TheSingapore Epidemiology of Eye Diseases study was supported by the NationalMedical Research Council (NMRC), Singapore (grants 0796/2003, 1176/2008,1149/2008, STaR/0003/2008, 1249/2010, CG/SERI/2010, CIRG/1371/2013, andCIRG/1417/2015), and Biomedical Research Council, Singapore (08/1/35/19/550and 09/1/35/19/616). C.-Y.C. is supported by an award from the NMRC (CSA-SI/0012/2017).
454 Genetic Study of Diabetic Retinopathy Diabetes Volume 68, February 2019
Dow
nloaded from http://diabetesjournals.org/diabetes/article-pdf/68/2/441/523790/db180567.pdf by guest on 21 February 2022

NMRC had no role in the design or conduct of this research.The Starr County Health Studies were supported, in part, by the State of Texas
and NIH grants EY-012386, DK-047487, and DK-073541. The Korean Study ofDiabetic Retinopathy was supported by National Research Foundation of Koreagrants funded by the Korea government (NRF-2017R1A2B2011436 and NRF-2012R1A1A2008943). For the Wake Forest School of Medicine Study (WFU),genotyping services were provided by the Center for Inherited Disease Re-search. The Center for Inherited Disease Research is fully funded througha federal contract from the NIH to Johns Hopkins University, contractHHSC268200782096C. This work was supported by NIH grants R01-DK-087914, R01-DK-066358, R01-DK-053591, DK-070941, and DK-084149,Wake Forest School of Medicine grant M01-RR-07122, and Venture Fund.Work for this manuscript was supported in part by the Genetics of LatinosDiabetic Retinopathy (GOLDR) Study grant EY14684. This study was supported bythe National Eye Institute of the NIH (EY-014684 to Y.-D.I.C. and J.I.R.) and ARRA(American Recovery and Reinvestment Act of 2009) Supplement (EY014684-03S1and EY014684-04S1), National Institute of Diabetes and Digestive and KidneyDiseases (NIDDK) DK-063491 to the Southern California Diabetes EndocrinologyResearch Center, the Eye Birth Defects Foundation Inc., the National ScienceCouncil, Taiwan (NSC 98-2314-B-075A-002-MY3 to W.H.-H.S.), and the TaichungVeterans General Hospital, Taichung, Taiwan (TCVGH-1003001C to W.H.-H.S.).The provision of genotyping data was supported in part by the National Center forAdvancing Translational Sciences, CTSI grant UL1-TR-001881 and NIDDK Di-abetes Research Center grant DK-063491 to the Southern California DiabetesResearch Center. The Family Study of Nephropathy and Diabetes (FIND) study wassupported by grants U01-DK-57292, U01-DK-57329, U01-DK-057300, U01-DK-057298, U01-DK-057249, U01-DK-57295, U01-DK-070657, U01-DK-057303,and U01-DK-57304 and, in part, by the Intramural Research Program of theNIDDK. Support was also received from NHLBI grants U01-HL-065520, U01-HL-041654, and U01-HL-041652. This project has been funded in whole or in partwith federal funds from the National Cancer Institute, NIH, under contract N01-CO-12400 and the Intramural Research Program of the NIH, National Cancer Institute,Center for Cancer Research. This work was also supported by the National Centerfor Research Resources for the General Clinical Research Center grants: CaseWestern Reserve University, M01-RR-000080; Wake Forest University, M01-RR-07122; Los Angeles Medical Center, Harbor-University of California, M01-RR-00425; College of Medicine, University of California, Irvine, M01-RR-00827–29;Health Sciences Center, University of New Mexico, M01-RR-00997; and theFrederic C. Bartter Award, M01-RR-01346. Computing resources were provided,in part, by the Wake Forest School of Medicine Center for Public Health Genomics.
The funders had no role in study design, data collection and analysis, decision topublish, or preparation of the manuscript.
M.I.M. is a Wellcome Senior Investigator supported by Wellcome awards090532, 106130, 098381, and 203141 and a National Institute for HealthResearch Senior Investigator.
The views expressed in this article are those of the authors and not necessarilythose of the National Health Service, National Institute for Health Research, or theDepartment of Health.Duality of Interest. J.Z.K. is employed by Sun Pharmaceutical Industries,Inc. P.-H.G. has received investigator-initiated research grants from Eli Lilly andCompany and Roche, is an advisory board member for AbbVie, AstraZeneca,Boehringer Ingelheim, Cebix, Eli Lilly and Company, Janssen, Medscape, MerckSharp & Dohme, Novartis, Novo Nordisk, and Sanofi, and has received lecture feesfrom AstraZeneca, Boehringer Ingelheim, Eli Lilly, ELO Water, Genzyme, MerckSharp & Dohme, Medscape, Novo Nordisk, and Sanofi. B.L.Y. is a full-timeemployee of Genentech, Inc., and holds stock and stock options in Roche. No otherpotential conflicts of interest relevant to this article were reported.
Sun Pharmaceutical Industries, Inc., is not in any way involved in this study.Author Contributions. S.P., E.J.R., A.V.Se., S.D., L.K.S., A.L.P., and L.S.contributed to the writing of the manuscript. R.P.I., R.A.J., M.C., X.L., C.-Y.C.,M.C.Y.N., A.V.Sm., G.S.T., Y.-D.I.C., J.Z.K., L.M.D., W.M., S.M.H., M.I., D.N., J.K., Y.H.,Y.J., J.A., A.L., K.S., K.H.P., X.G., E.I., K.D.T., S.G.A., J.R.S., B.I.F., I.-T.L., W.H.-H.S.,
M.K., A.T., S.H., M.M., D.-A.T., R.M.-C., R.V., M.I.M., L.G., E.A., V.L., E.A.,A.M., A.S.F.D., H.M.C., I.T., N.S., P.-H.G., S.M., C.L.H., A.P., C.J.C., H.H., P.M., J.E.C.,E.Y.C., A.D.P., M.A.G., C.P., D.W.B., B.L.Y., D.S., M.F.C., J.J.W., K.P.B., T.Y.W.,B.E.K.K., R.K., J.I.R., and S.K.I. reviewed and edited the manuscript. S.P., R.P.I.,R.A.J., C.-Y.C., M.C.Y.N., A.V.Sm., G.S.T., Y.-D.I.C., J.Z.K., W.M., S.M.H., M.I., J.K.,J.A., A.L., K.S., K.H.P., X.G., B.I.F., S.H., M.M., D.-A.T., R.M.-C., I.T., N.S., P.-H.G.,S.M., C.L.H., A.P., C.J.C., H.H., P.M., J.E.C., E.Y.C., A.D.P., M.A.G., C.P., D.W.B.,B.L.Y., D.S., M.F.C., J.J.W., K.P.B., T.Y.W., B.E.K.K., R.K., J.I.R., S.K.I., A.L.P., andL.S. collected and researched data. S.P., R.P.I., R.A.J., M.C., X.L., C.-Y.C.,M.C.Y.N., A.V.Sm., E.J.R., A.V.Se., S.D., G.S.T., Y.-D.I.C, J.Z.K., L.M.D., L.K.S.,W.M., S.M.H., M.I., D.N., J.K., Y.H., Y.J., J.A., A.L., K.S., S.H., M.M., I.T., N.S.,B.L.Y., K.P.B., A.L.P., and L.S. performed the analysis. L.S. is the guarantor of thiswork and, as such, had full access to all of the data in the study and takesresponsibility for the integrity of the data and the accuracy of the data analysis.Prior Presentation. Parts of this study were presented in abstract form atthe 42nd Annual Meeting of the Macula Society, Bonita Springs, FL, 13–16February 2019.
References1. Yau JW, Rogers SL, Kawasaki R, et al.; Meta-Analysis for Eye Disease (META-EYE) Study Group. Global prevalence and major risk factors of diabetic retinopathy.Diabetes Care 2012;35:556–5642. Klein R, Klein BE, Moss SE, Davis MD, DeMets DL. The Wisconsin epide-miologic study of diabetic retinopathy. III. Prevalence and risk of diabetic reti-nopathy when age at diagnosis is 30 or more years. Arch Ophthalmol 1984;102:527–5323. Looker HC, Nelson RG, Chew E, et al. Genome-wide linkage analyses toidentify Loci for diabetic retinopathy. Diabetes 2007;56:1160–11664. Arar NH, Freedman BI, Adler SG, et al.; Family Investigation of Nephropathyand Diabetes Research Group. Heritability of the severity of diabetic retinopathy:the FIND-Eye study. Invest Ophthalmol Vis Sci 2008;49:3839–38455. Sheu WH, Kuo JZ, Lee IT, et al. Genome-wide association study in a Chinesepopulation with diabetic retinopathy. Hum Mol Genet 2013;22:3165–31736. Awata T, Yamashita H, Kurihara S, et al. A genome-wide association studyfor diabetic retinopathy in a Japanese population: potential association with a longintergenic non-coding RNA. PLoS One 2014;9:e1117157. Fu YP, Hallman DM, Gonzalez VH, et al. Identification of diabetic retinopathygenes through a genome-wide association study among Mexican-Americans fromStarr County, Texas. J Ophthalmol 2010;2010:8612918. Grassi MA, Tikhomirov A, Ramalingam S, Below JE, Cox NJ, Nicolae DL.Genome-wide meta-analysis for severe diabetic retinopathy. Hum Mol Genet2011;20:2472–24819. Huang YC, Lin JM, Lin HJ, et al. Genome-wide association study of diabeticretinopathy in a Taiwanese population. Ophthalmology 2011;118:642–64810. Burdon KP, Fogarty RD, Shen W, et al. Genome-wide association study forsight-threatening diabetic retinopathy reveals association with genetic variationnear the GRB2 gene. Diabetologia 2015;58:2288–229711. Shtir C, Aldahmesh MA, Al-Dahmash S, et al. Exome-based case-controlassociation study using extreme phenotype design reveals novel candidateswith protective effect in diabetic retinopathy. Hum Genet 2016;135:193–20012. Hosseini SM, Boright AP, Sun L, et al.; DCCT/EDIC Research Group. Theassociation of previously reported polymorphisms for microvascular complicationsin a meta-analysis of diabetic retinopathy. Hum Genet 2015;134:247–25713. Grassi MA, Tikhomirov A, Ramalingam S, et al. Replication analysis for severediabetic retinopathy. Invest Ophthalmol Vis Sci 2012;53:2377–238114. Peng D, Wang J, Zhang R, et al. Common variants in or near ZNRF1,COLEC12, SCYL1BP1 and API5 are associated with diabetic retinopathy in Chinesepatients with type 2 diabetes. Diabetologia 2015;58:1231–123815. Cheung CY, Hui EY, Lee CH, et al. Impact of genetic loci identified in genome-wide association studies on diabetic retinopathy in Chinese patients with type2 diabetes. Invest Ophthalmol Vis Sci 2016;57:5518–5524
diabetes.diabetesjournals.org Pollack and Associates 455
Dow
nloaded from http://diabetesjournals.org/diabetes/article-pdf/68/2/441/523790/db180567.pdf by guest on 21 February 2022
16. Zaitlen N, Lindström S, Pasaniuc B, et al. Informed conditioning on clinicalcovariates increases power in case-control association studies. PLoS Genet 2012;8:e100303217. Grassi MA, Mazzulla DA, Knudtson MD, et al. Patient self-report of prior lasertreatment reliably indicates presence of severe diabetic retinopathy. Am JOphthalmol 2009;147:501–50418. Meng W, Shah KP, Pollack S, et al.; Wellcome Trust Case Control Consortium2 (WTCCC2); Surrogate Markers for Micro- and Macro-Vascular Hard Endpoints forInnovative Diabetes Tools (SUMMIT) Study Group. A genome-wide associationstudy suggests new evidence for an association of the NADPH Oxidase 4 (NOX4)gene with severe diabetic retinopathy in type 2 diabetes. Acta Ophthalmol 2018;96:e811–e819.19. Expert Committee on the Diagnosis and Classification of Diabetes Mellitus.Report of the expert committee on the diagnosis and classification of diabetesmellitus. Diabetes Care 2003;26(Suppl. 1):S5–S2020. Sobrin L, Green T, Sim X, et al.; Family Investigation of Nephropathy andDiabetes-Eye Research Group; Wellcome Trust Case Control Consortium 2.Candidate gene association study for diabetic retinopathy in persons with type2 diabetes: the Candidate gene Association Resource (CARe). Invest OphthalmolVis Sci 2011;52:7593–760221. Wong TY, Klein R, Islam FM, et al. Diabetic retinopathy in a multi-ethniccohort in the United States. Am J Ophthalmol 2006;141:446–45522. Klein R, Marino EK, Kuller LH, et al. The relation of atherosclerotic car-diovascular disease to retinopathy in people with diabetes in the CardiovascularHealth Study. Br J Ophthalmol 2002;86:84–9023. Klein R, Sharrett AR, Klein BE, et al.; ARIC Group. The association of ath-erosclerosis, vascular risk factors, and retinopathy in adults with diabetes: theAtherosclerosis Risk in Communities Study. Ophthalmology 2002;109:1225–123424. Kaidonis G, Abhary S, Daniell M, et al. Genetic study of diabetic retinopathy:recruitment methodology and analysis of baseline characteristics. Clin ExpOphthalmol 2014;42:486–49325. Mitchell P, Smith W, Wang JJ, Attebo K. Prevalence of diabetic retinopathy in anolder community. The Blue Mountains Eye Study. Ophthalmology 1998;105:406–41126. Gunnlaugsdottir E, Halldorsdottir S, Klein R, et al. Retinopathy in old personswith and without diabetes mellitus: the Age, Gene/Environment Susceptibility–Reykjavik Study (AGES-R). Diabetologia 2012;55:671–68027. Nguyen QD, Brown DM, Marcus DM, et al.; RISE and RIDE Research Group.Ranibizumab for diabetic macular edema: results from 2 phase III randomizedtrials: RISE and RIDE. Ophthalmology 2012;119:789–80128. Penman A, Hoadley S, Wilson JG, Taylor HA, Chen CJ, Sobrin L. P-selectinplasma levels and genetic variant associated with diabetic retinopathy in AfricanAmericans. Am J Ophthalmol 2015;159:1152–1160.e229. Kuo JZ, Guo X, Klein R, et al. Systemic soluble tumor necrosis factor re-ceptors 1 and 2 are associated with severity of diabetic retinopathy in Hispanics.Ophthalmology 2012;119:1041–104630. Early Treatment Diabetic Retinopathy Study Research Group. Grading di-abetic retinopathy from stereoscopic color fundus photographs–an extension ofthe modified Airlie House classification. ETDRS report number 10. Ophthalmology1991;98(Suppl.):786–80631. Armitage P. Tests for linear trends in proportions and frequencies. Biometrics1955;11:375–38632. Price AL, Patterson NJ, Plenge RM, Weinblatt ME, Shadick NA, Reich D.Principal components analysis corrects for stratification in genome-wide asso-ciation studies. Nat Genet 2006;38:904–90933. Zeggini E, Scott LJ, Saxena R, et al.; Wellcome Trust Case Control Con-sortium. Meta-analysis of genome-wide association data and large-scale
replication identifies additional susceptibility loci for type 2 diabetes. Nat Genet2008;40:638–64534. Evangelou E, Ioannidis JP. Meta-analysis methods for genome-wide as-sociation studies and beyond. Nat Rev Genet 2013;14:379–38935. Kanai M, Tanaka T, Okada Y. Empirical estimation of genome-wide sig-nificance thresholds based on the 1000 Genomes Project data set. J Hum Genet2016;61:861–86636. Brown BC, Ye CJ, Price AL, Zaitlen N; Asian Genetic Epidemiology NetworkType 2 Diabetes Consortium. Transethnic genetic-correlation estimates fromsummary statistics. Am J Hum Genet 2016;99:76–8837. Rossin EJ, Lage K, Raychaudhuri S, et al.; International Inflammatory BowelDisease Genetics Constortium. Proteins encoded in genomic regions associatedwith immune-mediated disease physically interact and suggest underlying biology.PLoS Genet 2011;7:e100127338. Lundby A, Rossin EJ, Steffensen AB, et al.; QT Interval International GWASConsortium (QT-IGC). Annotation of loci from genome-wide association studiesusing tissue-specific quantitative interaction proteomics. Nat Methods 2014;11:868–87439. Neale BM, Kou Y, Liu L, et al. Patterns and rates of exonic de novo mutationsin autism spectrum disorders. Nature 2012;485:242–24540. Segrè AV, Wei N, Altshuler D, Florez JC, Altshuler D; DIAGRAM Consortium;MAGIC Investigators. Pathways targeted by antidiabetes drugs are enriched formultiple genes associated with type 2 diabetes risk. Diabetes 2015;64:1470–148341. Her J, Chung IK. The AAA-ATPase NVL2 is a telomerase componentessential for holoenzyme assembly. Biochem Biophys Res Commun 2012;417:1086–109242. D’Adamo CR, Dawson VJ, Ryan KA, et al. The CAPN2/CAPN8 locus onchromosome 1q is associated with variation in serum alpha-carotene concen-trations. J Nutrigenet Nutrigenomics 2016;9:254–26443. Paine SK, Basu A, Mondal LK, et al. Association of vascular endothelialgrowth factor, transforming growth factor beta, and interferon gamma genepolymorphisms with proliferative diabetic retinopathy in patients with type 2 di-abetes. Mol Vis 2012;18:2749–275744. Takeuchi M, Sato T, Tanaka A, et al. Elevated levels of cytokines associatedwith Th2 and Th17 cells in vitreous fluid of proliferative diabetic retinopathypatients. PLoS One 2015;10:e013735845. Wang J, Yang MM, Li YB, Liu GD, Teng Y, Liu XM. Association of CFH and CFBgene polymorphisms with retinopathy in type 2 diabetic patients. Mediators In-flamm 2013;2013:74843546. MacKinnon JR, Knott RM, Forrester JV. Altered L-selectin expression inlymphocytes and increased adhesion to endothelium in patients with diabeticretinopathy. Br J Ophthalmol 2004;88:1137–114147. Ward LD, Kellis M. HaploReg: a resource for exploring chromatin states,conservation, and regulatory motif alterations within sets of genetically linkedvariants. Nucleic Acids Res 2012;40:D930–D93448. Zhou W, Nielsen JB, Fritsche LG, et al. Efficiently controlling for case-controlimbalance and sample relatedness in large-scale genetic association studies. NatGenet 2018;50:1335–134149. Chong YH, Fan Q, Tham YC, et al. Type 2 diabetes genetic variants and risk ofdiabetic retinopathy. Ophthalmology 2017;124:336–34250. Wheeler E, Leong A, Liu CT, et al.; EPIC-CVD Consortium; EPIC-InterActConsortium; Lifelines Cohort Study. Impact of common genetic determinants ofhemoglobin A1c on type 2 diabetes risk and diagnosis in ancestrally diversepopulations: a transethnic genome-wide meta-analysis. PLoS Med 2017;14:e1002383
456 Genetic Study of Diabetic Retinopathy Diabetes Volume 68, February 2019
Dow
nloaded from http://diabetesjournals.org/diabetes/article-pdf/68/2/441/523790/db180567.pdf by guest on 21 February 2022