Embed Size (px)
Citation preview

Philips J. Res. 41,576-603, 1986 R1l46
MULTIDIMENSIONAL DIGITAL SIGNAL PROCESSINGFOR TELEVISION SCAN CONVERSION
by R. S. PRODANPhilips Laboratories, North American Phi/ips Corporation, Briarcliff Manor,
NY 10510
Abstract
The interlaced scanning method utilized in all present television standardscompromises the fidelity of the reproduced image to conserve transmissionbandwidth. The artifacts introduced by interlaced scanning at the sourcecan be substantially reduced by sequential scan conversion at the display.This conversion requires motion adaption for each interpolated pictureelement to preserve full static resolution and prevent displayed interpola-tion errors due to aliasing. The source of interlaced scan display artifactsand their reduction by sequential scan conversion are explained by employ-ing two dimensional digital signal processing theory.PACS numbers: C5260+w, b6140-c and b6430-f.
576 Phlllps Journol of Research Vol.41 No. 6 1986
1. Introduetion
Conventional television systems such as National Television System Com-mittee (NTSC) utilize interlaced scanning to conserve transmission bandwidthwhile increasing the field update rate to reduce large area flicker. For a fixedbandwidth, interlaced scanning attempts to maximize vertical resolution withincreased field rate by scanning alternate line positions in alternate fields.When combined on a still image and integrated over the picture period of twofields, interlaced scanning produces the same information as a sequentiallyscanned image.Since television is a representation of the world around us, the images dis-
played are rarely motionless. Also, the human eye is not able to perfectly inte-grate the two fields of the scanned picture even when motion is absent. Thereproduetion of the resultant image is compromised for these two reasons.The resulting displayed image will exhibit artifacts such as visibility of thescanning lines, line flicker on vertical detail, line crawl, breakup of movingedges, and loss of vertical resolution.Conversion of the interlaced transmission to a sequential display is used to
interpolate the missing information and reduce the artifacts in the displayed

•
Multidimensional digital signal processing for television scan conversion
image. This conversion process is an interpolation technique which must beadapted to the amount of motion in the image to prevent the introduetion ofartifacts in the sequentially scanned display due to interpolation errors.
This paper explains the source of artifacts due to interlaced scanning frommultidimensional sampling theory. Digital filtering solutions for removingdisplay artifacts are given. The requirement for motion adaption is shown.Several adaptive processing algorithms are analysed. Conclusions and recom-mendations for future research are presented.
2. Multidimensional representation of the television signal
A television system is designed to communicate a representation of a timevarying three dimensional scene that has been imaged by a camera. As illus-trated in fig. 1, this process removes the depth dimension conveying informa-tion in only two spatial dimensions and the temporal dimension. The videosignal obtained from this imaging process is a three dimensional rendition ofthe four dimensional (three spatial and one temporal) world around us. It isnecessary to sample the imaged information by scanning thereby mapping itinto a one dimensional signal for transmission and display. In general, anyprocessing of the signal utilizing multiple lines or fields is best understood inthree dimensions.
The video signal is obtained by horizontally scanning an image with a pointaperture or spot producing a raster of vertically displaced scan lines thatrepeats periodically to temporally update the information sampled by the
CAMERA
V(x.y.z.t)
2
3
••
V(x.y.t)vex. mTv. nTt)
SEQUENTIAL: 1. 2. 3 N
INTERLACE : 1. 3. 5•...• N-1. 2. 4. 6 ....• N
Fig. I. Television imaging and scanning.
Philip, Journalof Research Vol. 41 NO.6 1986 577

R. S. Prodan
a)
~~==============~Fig. 2. a) Interlaced scanning of two fields in time, b) spatial interleaving of the two fields.
raster. This is shown in fig. 2 for an interlaced scan over two fields. The scanlines of alternate fields are displaced so as to interleave. A sequential scanwould retrace the same lines of both fields every vertical sweep. The video sig-nal can therefore be represented as a function of horizontal position x, verticalposition y and time tas v(x,y,t). Due to the sampling of the raster in the ver-tical direction repetitively at the field rate, the vertical and temporal dimen-sions are discretized at increments of the vertical and temporal samplingperiods. Thus the signal is continuous only in the horizontal dimension, repre-sented by v(x,mTv,nTt) where Tv and T; are the vertical and temporal samplingperiods, respectively, and m and n are integers.The sampling in two of the three dimensions presents the possibility of alias-
ing as in the one dimensional case. As explained in appendix A, the nature ofthe alias components depends not only on the sampling rate as in the onedimensional case, but also on the geometry of the equidistant samples in eachsignal dimension (the sampling lattice). The sampling lattice in the signalspace determines the positions of the repeat spectra in the Fourier frequencyspace (the reciprocallattice).
3. Multidimensional sampling and aliasing effects
A particular two dimensionally sampled frequency (with positive and nega-tive components) in frequency space is represented by a pair of antipodal vee-
578 Phlllps Journalof Research Vol.41 No. 6 1986

Multidimensional digital signal processing for television scan conversion
II/
I /I 1"
I /II
IIFig. 3. Two dimensional frequency vector and spectral repetitions due to sampling.
tors about the repeat spectra positions of the reciprocallattice. This is shownin fig. 3 for the vector with positive frequency components. The sampling lat-tice for a sequentially scanned image is shown in fig. 4a. The vertical samplesof the raster occur in the same positions for every temporal sample, each fieldresulting in a rectangular sampling lattice. The reciprocal lattice, shown infig.4b, is also rectangular (see appendix B). The box centered about the originrepresents the principal bandwidth region of frequencies where aliasing willnot occur.
III1L.. -I
Iv
1.Tv
•v
•
•
Tv • r---- ----..,1 II 1I 1i I
It
1.Tt
• • • •a) b)
Fig. 4. Sequential scanning; a) sampling lattice, b) reciprocal lattice.
Phillps Journalof Research Vol. 41 No. 6 1986 579

580 Phlllps Journalof Research Vol.41 No. 6 1986
R. S. Prodan
tv fv1 • 0 1 0~ Tv
X X
ft ft
1 1it Ti
X X
• • 0 0 •a) b)
Fig. 5. Sequential scan reciprocallattice showing, a) baseband frequency vectors, b) superpositionof all spectral repetitions of baseband frequency vectors.
For the sequential scan reciprocal lattice of fig. Sa, consider the range ofvertical frequencies with zero temporal frequency along the vertical frequencyaxis (stationary images). The vector representing the maximum (Nyquist) ver-tical frequency of magnitude 1/2 Tv in the reciprocallattice is denoted by an Xin fig. Sa. This baseband vector will repeat about the periodic spectral posi-tions shown as dots in the reciprocallattice illustrated in fig. Sb. All foldbackfrequencies aliasing into the principal bandwidth region as one increases thevertical frequency, will always lie along the vertical frequency axis. Thisimplies that vertical frequencies will never produce a temporal frequency com-ponent for sequential scanning. The identical argument holds true for tem-poral frequencies along the horizontal axis (uniformly illuminated, timevarying raster), denoted by an 0 in fig. 5.The sampling lattice for an interlaced scanning image is shown in fig. 6a. The
vertical samples are offset by one half the vertical sampling period every tem-poral sample. This can be stated as follows. Odd line positions in the raster arescanned on odd numbered fields while even line positions are scanned on evennumbered fields in an alternating fashion. Thus the complete vertical samplingof an image takes two field times. The reciprocal lattice and the principalbandwidth region for this case are shown in fig. 6b (see appendix B).For the interlaced scan reciprocallattice of fig. 7a, consider the range of ver-
tical frequencies with zero temporal frequency along the vertical frequencyaxis. The baseband vector representing the maximum vertical frequency ofmagnitude 1/2 Tv in the reciprocal lattice is again denoted by an X in fig. 7a.This purely vertical frequency will repeat about the periodic spectral positionsin the reciprocallattice, as shown in fig. 7b. Note that a spectral repetition has

Multidimensional digital signal processing for television scan conversion
fv• .1.
Tv
•
,,,,,,,•
•
•v
•
•ft
1Tt
•
• • •a) b)
Fig. 6. Interlaced scanning; a) sampling lattice, b) reciprocal lattice.
coincided with the temporal frequency of magnitude 1/2 Tc; which is the maxi-mum (Nyquist) temporal frequency within the baseband region. Also, themaximum temporal frequency denoted by an 0 will similarly alias into themaximum vertical frequency. The superposition of all the spectral repetitionsof these two frequencies, shown in fig. 7b, illustrates the vertical-temporalaliasing between the two sampling dimensions in interlaced scanning that wasabsent in the sequential scanning case of fig. 5.
In other words, the stationary vertical pattern of 1/2 Tv (= 262.5 cph (cyclesper picture height)) will be indistinguishable from a uniform raster alternatingbetween white and black at the temporal rate of 1/2 T; (= 30 Hz) and viceversa for interlaced scanning. This is illustrated by the example of a ten lineinterlaced scanning raster in fig. 8. The scanning lines produced for these two
fv fv
1 • • ® 1 ® •Tv Tv
• • ® ®
ft ft
1 1
it Tt• • e ®
• • • ® ® •a) b)Fig. 7. Interlaced scan reciprocallattice showing, a) baseband frequency vectors, b) superpositionof all spectral repetitions of baseband frequency vectors showing aliasing.
Phlllps Journalof Research Vol. 41 No. 6 1986 581

R. S. Prodan
l-OODSCANLINES
FIELD 1
a) fv = _1_ • ft = 02Tv
FIELD 2
ODD ISCANLINES
FIELD 1
b)
EI~~~I_~---""- --J
FIELD 2
fv = O. ft = ....L2Tt
Fig. 8. a) Stationary raster of maximum vertical frequency. b) Time varying uniform raster ofmaximum temporal frequency.
situations are identical, all black for the odd field lines and all white for theeven field lines. The 30Hz temporal component perceived when a high verticalfrequency stationary pattern is displayed, produces line flicker. Similarly, amoving contour producing a temporal frequency component will appear tohave a vertical frequency of 262.5 cph along the moving edge which appears asa serated or jagged edge or as missing lines along the top and bottom of amoving object. This is illustrated by the example of a diagonally moving boxon a stationary background in fig. 9. Hence, interlaced scanning producesspatial temporal aliasing where frequencies in one dimension result in cross-talk into the other dimension.Another artifact due to the lack of vertical filtering of the sampled raster is
observable in an interlaced display. This effect has been called 'line crawl' andis observable on an interlaced display when eye movement due to following avertically moving object up or down the screen causes a moving frame ofreference in the field-to-field sampling lattice previously mentioned. An allwhite raster corresponds to zero vertical and temporal frequencies. In onefield, the missing lines of the alternate field are black which corresponds tozero stuffing the missing vertical samples. The zero stuffed positions alter-nate in the next field. This corresponds to a vertical temporal frequency offv = 1/2 Tv cph andft = 1/2 T; Hz. Since this frequency vector lies on the reci-procallattice, it is an alias of the frequency origin Iv = 0 and ft = O.
582 Philip, Journalof Research Vol.41 No. 6 1986

Multidimensional digital signalprocessing for television scan conversion
MOTION
/
a) AT TIME OF FIELD 1
--b) FIELD 1
--
c)TOTAL FRAME
(FIELD 1 & FIELD 2)
/
AT TIME OF FIELD 2
----FIELD 2
Fig. 9. a) Position of moving object at field times. b) Fields of interlaced raster. c) Total frame oftwo interlaced fields.
If the frame of reference for the sampling lattice changes each field by Tvpicture heights, this has the effect of moving the sampling points (which arethe lines) up or down. This will deinterlace the picture clearly showing the zerostuffed lines which now appear stationary in the moving frame of reference.This results in an alternating black and white line structure with frequencyfv = 1/2 Tv, ft = O.The rate of vertical motion would be Tv picture heights perT; seconds. For system M 525 line scanning used in the NTSC standard, anobject moving at this rate would traverse the entire vertical height in
t; fv 525.- = - = - = 8.75 seconds.Tv ft 60
Therefore this effect can be observed on slowly moving objects such as scroll-ing titles or film credits.
Philip, Journalof Research Vol. 41 No. 6 1986 583

R. S. Prodan
4. Interpolation algorithms
The spectral properties of both sequential and interlaced scanning, discussedin the previous section, demonstrate the superior performance of sequentialscanning due to the lack of artifacts introduced by aliasing. The drawback tosequentiál scanningis that the required transmission bandwidth is double thatof interlaced scanning for a constant field rate. An interpolation, or upsam-pling, at the display can achieve a compromise between the conflicting require-ments of lower transmission bandwidth and artifact-free image reproduction.A discussion of several methods of interpolating an interlaced transmission toa sequential display follows. The need for combining two different methodsutilizing a motion-adaptive weighting between interframe and intraframeinterpolation is demonstrated.The conversion from interlace to sequential scanning requires an interpola-
tion by a factor of two. Each field must have alllines of the entire frame for asequential display. The lines missing in the interlaced field are interpolatedusing available lines from the same field and the surrounding adjacent fields.Fig. 10 depicts three methods for this interpolation. Consider field 2 as theinterlaced field to be sequentially displayed with surrounding fields 1 and 3each containing the alternate line positions missing in field 2. The lines to beinterpolated are shown as dashed lines and may be produced by three algo-rithms. The first is a line average where vertically adjacent samples of the twonearest lines within the same field are averaged. The second is a picture aver-age where the samples from the preceding and following fields in the samespatial position as the corresponding point in the interpolated line are aver-aged. The third is field insertion where the corresponding sample in the inter-polated line is obtained by directly inserting the sample of the previous field.
584 Phlllps Journol of Research Vol.41 No. 6 1986
FIELD 1
7r~LINE PICTURE FIELD
AVERAGE AVERAGE INSERTION(MOTION) (STILL) (STILL)
Fig. 10. Interpolation methods for interlace to sequential scan conversion.

Multidimensional digital signal processing for television scan conversion
Each of the three interpolation methods can be realized as a digital finiteimpulse response (FIR) filter with the input sequence consisting of zero samplevalues between pairs of available samples (i.e. lines) 1). Notice that eachmethod acts upon samples in only one dimension, either strictly verticalorstrictly temporal. This implies that the interpolating filters are one dimen-sional and cannot modify the response in the second orthogonal dimension.The analysis of the individual FIR filters representing the interpolation tech-niques that follow will therefore be one dimensional.
5. Digital filter implementationsThe digital finite impulse response filters that realize the interpolation algo-
rithms of fig. 9 are analysed in the following discussion. Consider first lineaveraging. The samples of the missing lines in the interlaced field are producedby a linear interpolation of the vertically adjacent samples of the precedingand following lines. The transmitted lines in the interlaced field remain un-altered. This can be represented by the difference equation
x(n - 1) x(n + 1)y(n) = 2 + x(n) + 2 ' (1)
where the output sequence y(n) is the zero filled and filtered input sequencex(n). If x(n) is zero (i.e. a missing line of the interlace field), the output con-sists of the sum of adjacent samples weighed by one half. If x(n) is a trans-mitted nonzero value, the output is simply the same value due to the adjacentzero samples in the input sequence. The transfer function of the Z trans-formed difference equation is
Y(z) z + Z-1
H(z) = X(z) = 1 + 2
where the Z transform is defined as
(2)
co
W(z) = L w(n) z-n.n=-oo
(3)
The (periodic) frequency reponse is obtained by the substitution z = exp(j OJ nwhere OJ is the radian frequency and T is the sampling period. Let Tv be thesampling period andfv be the frequency variable in the vertical direction. Thisresults in
H(fv) = H[exp(j 21tfv Tv)] = 1 + exp(j 21tfv Tv) + exp(-j 21tfvTv) ,. 2
(4)
Phlllps Journalof Research Vol. 41 No. 6 1986 585
R. S. Prodan
IH(f)12.0
1.8
1.6
1.'1
1.2
1.0
.8
.6
.'1
.2
fv(cph)
Fig. 11. Line averaging vertical frequency response.
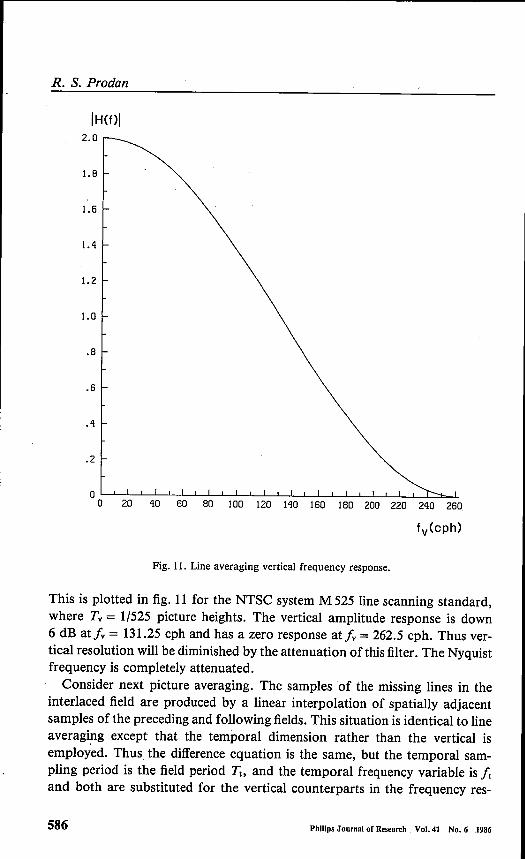
This is plotted in fig. 11 for the NTSC system M 525 line scanning standard,where Tv = 1/525 picture heights. The vertical amplitude response is down6 dB eà f; = 131.25 cph and has a zero response ei ]; = 262.5 cph. Thus ver-tical resolution will be diminished by the attenuation of this filter. The Nyquistfrequency is completely attenuated.
Consider next picture averaging. The samples of the missing lines in theinterlaced field are produced by a linear interpolation of spatially adjacentsamples of the preceding and following fields. This situation is identical to lineaveraging except that the temporal dimension rather than the vertical isemployed. Thus the difference equation is the same, but the temporal sam-pling period is the field period Th and the temporal frequency variable is ftand both are substituted for the vertical counterparts in the frequency res-
586 Phillps Journalof Research Vol.41 No. 6 .1986

Multidimensional digital signal processing for television scan conversion
ponse. The temporal frequency response is given by
HUt) = H[exp(j 2n ft Tt)] = 2 cos" nftTt. (5)
This is plotted in fig. 12 for the NTSC system M 525 line scanning standard,where T; = 1/60 second. The temporal amplitude response is down 6 dB atft = 15 Hz and has a zero response at ft = 30 Hz. This filter will attenuatetemporal frequencies and not affect vertical resolution as does line averaging.
IH(f)12.0
.2
1.8
1.6
1.4
1.2
1.0
.8
.6
.4
Fig. 12. Picture averaging temporal frequency response.
Consider lastly field insertion. The samples of the missing lines in the inter-laced field are produced by directly inserting the corresponding samples of theprevious field. The transmitted lines in the interlace field remain unchanged.This can be represented by the difference equation
y(n) = x(n) + x(n - 1). (6)
Phlllps Journalof Research Vol. 41 No.6 1986 587

R. S. Prodan
The transfer function of the Z transformed difference equation becomes
H(z) = 1+ Z-I. (7)
Thus, the frequency response in.the temporal dimension is
H(/t) = H[exp(j 2nltTt)] = 1 + exp(-j 2n ft Tt)= 2 exp(- j 2n It Tt) cos n ft Tt.
The magnitude of the transfer function yields the amplitude response as
IH(ft) I = 2 cos n ft t;
(8)
(9)
This is plotted in fig. 13 for the NTSC system M 525 line scanning standard.The temporal response is down 6 dB at ft = 20 Hz and has a zero responseidentical to picture averaging atft = 30 Hz. This filter is seen to attenuate tem-
IH(f)12.0
.8
1.8
1.6
1.4
1.2
1.0
.6
.4
.2
Fig. 13. Field insertion temporal frequency response.
588 Phlllps Journalof Research Vol.41 No. 6 1986

Multidimensional digital signal processing for television scan conversion
poral frequencies without affecting vertical frequencies, as does the previouscase of picture averaging.
The two temporal filters, picture averaging and field insertion, have verysimilar frequency responses. The frequency ranges of most interest are thesmall passband near zero and the small stopband near the Nyquist frequencywhere the filters have minimum and maximum attenuation, respectively. Thepurpose of a temporal filter is to preserve stationary vertical details whichhave a zero temporal frequency component and reject the flickering temporalalias component at the maximum (Nyquist) temporal frequency. The broadtransition band in between is of less importance. Hence both temporal filtersare essentially equivalent in the frequency regions of interest. Howeverfieldinsertion requires only one field delay while picture averaging requires twofield delays.
6. Motion adaptive interpolation
The two dimensional aliasing effects due to the interlaced sampling rasteranalysed earlier demonstrated the confusion between high vertical frequenciesand high temporal frequencies (those approaching the Nyquist limit). Theobjective of interpolation is to produce a sequentially scanned raster of doublebandwidth that resolves this confusion. Two.frequencies, one vertical and onetemporal, are observed and a decision must be made as to which is the originalfrequency at the source and which is the alias frequency. Once a decision ismade, the alias frequency must be rejected by the interpolation filter and theproper frequency passed unattenuated.
The interpolation algorithms analysed in the previous section, acted instrictly one dimension only, either verticalor temporal. Thus a combination oftwo of these, one vertical filter and one temporal filter, may be combined to de-velop a strategy for reducing the unwanted alias frequency. This strategyshould decide if the alias frequency is due to motion in the picture where a tem-poral frequency causes a maximum vertical frequency along a moving contour,or if the alias frequency is due to high vertical frequency detail that is stationarywhere line flicker causes a maximum temporal frequency at the frame rate.A motion detector attempts to resolve the ambiguity as to the source of the
true and alias frequency components by providing information about the rela-tive motion of the picture in the vicinity of the sample to be interpolated. Inthis way, each individual sample can be appropriately interpolated withoutundesirable alias components or loss of resolution. However, circumstancesmay arise where motion detection fails to uniquely resolve certain ambiguoussituations. The subject of motion detection for adaptive interpolation isdeferred until the next section.
Phlllps Journni of Research Vol. 41 No. 6 1986 589

R. S. Prodan
In the following analysis, assume a constant parameter k whose value liesbetween zero and one, such that complimentary k and 1 - k proportions ofparallel temporal and vertical filter outputs are summed to produce the inter-polated scanning lines of an interlaced field. It will be shown that by properselection of this parameter, a purely temporal filter and a purely vertical filtermay be combined to reject unwanted alias components and preserve wantedtrue frequency components in the two dimensional vertical/temporal fre-quency domain. A k value of zero selects a temporal interpolation filter. A kvalue of unity selects a vertical interpolation filter. Intermediate values of kproportionally combine both filter outputs.
A linear interpolation filter results from the assumption of a fixed k value.The' transfer function of such a linear filter exhibits two dimensional fre-quency selective characteristics. As illustrated previously in sec. 3, such fre-quency selectivity is required by the more general motion adaptive (nonlinear)interpolator.
Consider first a combination of line averaging for the vertical filter and pic-ture averaging for the temporal filter. The interpolated sample values y inline m and field n are determined by the neighbouring transmitted samplevalues x and the motion parameter k as
[x(m - 1,n) + x(m +=y(m,n) = k x(m,n) + 2 +
[x(m,n - 1)+ x(m,n + l)J(1 - k) x(m,n) + 2 . (10)
If x(m,n) is zero, then y(m,n) is interpolated by the closest samples in theadjacent lines and fields. If x(m,n) is nonzero, corresponding to a transmittedline, then y(m,n) is simply that same line x(m,n).
The transfer function of this two dimensional difference equation is givenby performing a two dimensional Z transform defined as
00
I w(m,n) z;m zi"n, (11)m=-cc n=-oo
where v indicates sampling in the vertical dimension and t indicates samplingin the temporal dimension. The Z transformed difference equation becomes
. k -1Y(Zy,Zt) = X(Zy,Zt) + - (Zy + Zy) X(Zy,Zt)
2
1-k+ -- (zi"1 + z.) X(Zv,Zt).2
(12)
590 Phlllps Journalof Research Vol.41 No. 6 1986

Multidimensional digital signal processing for television scan conversion
The transfer function is given byY(Zv,Zt) . k -1 1 - k -1
H(Zv,Zt) == = 1 + - (Zv + Zv) + -- (z, + z-]. (13)X(Zv,Zt) 2 2
The frequency response ISobtained by evaluating the transfer function on theunit sphere resulting in
H(fv,Jt) = H[exp(j 21tfv Tv), exp(j 21tftTt)]= 2k cos" 1tfv Tv + 2(1 - k) cos" 1tft Tt. (14)
The half amplitude (-6 dB) contour in the two dimensional frequency planecorresponds to the -6 dB frequency point of a one dimensional filter. The setof - 6 dB contours for the above frequency response with several values of themotion parameter k is shown in fig.14 for Tv = 1/525 cph and T, = 1/60 s. It is
fv(cph)
260k=1
240
220 STOPBAND200
180
160 0.2
140 k=O120
100
80
60 PASSBAND40
20
0 0 2 4 6 8 10 12 14 16 18 20 22 24 26 28 30ft(Hz)
Fig. 14. Half amplitude contours of k times line' averaging + (1 - k) times picture averaging forvarious values of the motion parameter k.
Phlllps Journalof Research Vol..41 No. 6 1986 591

R. S. Prodan
apparent for k = 0 that the 262.5 cph maximum vertical frequency, zero tem-poral frequency is passed unattenuated and.the zero vertical frequency, 30 Hzmaximum temporal frequency is completely attenuated. For k = 1, the reverseis true. For intermediate values of k, there is a mixture of passband attenuationand lack of stopband attenuation such that the gain at the frequency origin isconstant and equal to two, as a factor of two interpolating filter must be.
Consider next a combination of line averaging for the vertical filter and fieldinsertion for the temporal filter. The difference equation for this filter com-bination is
[x(m - l,n) + x(m + l,n)]
y(m,n) = k x(m,n) + 2 +
(1 - k) [x(m,n) + x(m,n - 1)]. (15)
If x(m,n) is zero, then y(m,n) is interpolated by the closest samples in theadjacent lines and fields. If x(m,n) is nonzero, corresponding to a transmittedline, then y(m,n) is simply that same line x(m,n). This is similar to the pre-. vious filter except that only one instead of two adjacent fields are involved.
Evaluating the Z transformed transfer function results in
kH(zv,zt) = 1 + '2 (Z~1 + zv) + (1 - k) Z~I. (16)
The frequency response on the unit sphere is
H(fv,ft) = exp(-j 2rcftT;,) [2k cos2rcfvTv + 2(1 - k) cos rcftTr.]. (17)
The half amplitude response is shown in fig. 15. Note the similarity with thepicture averaging/line averaging filter. The difference between the filter com-binations is in the temporal filter. The frequency regions of interest near themaximum vertical, zero temporal frequency and the zero vertical, maximumtemporal frequency have essentially equivalent responses for all values of k.The major difference is that picture averaging requires an extra field delay. Forthe extreme values of k at zero and one, the responses are identical at themaximum vertical, zero temporal and zero vertical, maximum temporal fre-quency points, respectively, for both filter combinations.The interpolation filter characteristics perform the necessary selection of
desired frequency components attenuating the alias components, producing atrue sequential scan spectrum at the output for stationary picture material, butreducing vertical resolution on moving picture material. Televised programsusually contain sequences of images consisting of objects moving within astationary background. Hence only portions of the scene are nonstationary.
592 Phlllps Journal of Research Vol.41 No. 6 .1986

Phlllps Journalof Research Vol. 41 No. 6 1986 593
Multidimensional digital signalprocessing for television scan conversion
fv(cph)
260
2'100.5
220
200 0.4180
160 0.21'10 k=O120
100
80
60 PASS BAND'10
20
k=1
STOPBAND
o ~_L~~~_L_L~~_L~~~~_L~~~~_L~~_L~
o 2 'I 6 8 10 12 I'I 16 18 20 22 2'1 26 28 30
Fig. IS. Half amplitude contours of k times line averaging + (1 - k) times field insertion forvarious values of the motion parameter k.
In this case, the characteristics of the interpolation filter can no longer be con-stant, but should dynamically adapt to the local picture content. Thus a dif-ferent filter characteristic may be chosen for each individual interpolatedsample. The response to such an adaptive filter is no longer linear. However,the adaptive filter can make use of the above linear filter characteristics tooptimize the conflicting interpolation filter requirements of static and movingpicture details on a sample by sample basis.Assume that a suitable (ideal) motion detector provides the parameter k at
each individual sample to be interpolated within an absent scanning line of aninterlaced field. A low value of k (near zero) indicates a stationary pictureelement and a high value (near one) indicates a large change in picture element

R. S. Prodan
content due to motion at a particular sample point to be interpolated on theinterlaced raster. Intermediate values of k indicate smaller change in picturecontent due to motion. This parameter, by combining a purely temporal filter'and a purely vertical filter, can selectively reject the unwanted alias compo- 'nents and preserve the wanted true frequency components independently ateach interpolated pixel in local picture regions that are either stationary orvarying between interlaced fields due to movement. A smooth transition be-tween the extremes of the low-pass characteristics of this filter by continuouslyvarying k allows a smooth switching of the filter response, minimizing anytransient effect between moving and stationary picture elements. Thus theadaptive filter combination performs the necessary selection of frequencycomponents using the motion parameter k. The derivation of this necessaryparameter value is the subject of the following section.
7. Motion detection
The selection of the appropriate interpolation filter is resolved using amotion detector to determine if a sample to be interpolated is associated witha moving or with a stationary picture element. The sample to be interpolatedon a missing line of an interlaced field lies between samples of transmittedlines from the previous and next fields. These samples depicted in fig. 16 are
FIELD 1
Fig. 16. Sample positions in adjacent fields used for motion detection.
spatially aligned with the position of the sample to be interpolated, but aretemporally separated by two field periods (one complete picture). The differ-ence of these two surrounding samples is used to determine if a change in thepicture has occurred. If the difference is zero, the picture element is stationary.If the difference is greater than zero, the picture element is moving and thedifference represents the change in contrast. Thus the frame difference signalcan be used to choose the appropriate vertical-temporal filter characteristic forthe interpolation.
594 Phlllps Journalof Research Vol.41 -No.6 1986

Multidimensional digital signal processing for television scan conversion
It will now be shown that this frame difference signal will be large for tem-poral frequencies due to motion and small for temporal frequencies due toline flicker on stationary images. The frame difference signal is produced by alinear filtering operation whose difference equation is
y(n) = x(n + 1) - x(n - 1), (18)
where field n contains the sample of the line to be interpolated. The frequencyresponse in the temporal dimension is given by
HUt) = H[exp(j 2n ft1l)] = 2j sin 2n ft1l. (19)
The magnitude of this transfer function frequency response is plotted in fig. 17.Notice that for zero temporal frequency corresponding to a stationary picture,the response is zero. The response is also zero at the frame frequency (one half
IH(f)12.0
.2
2 4 6 8 10 12 14 16 18 20 22 24 26 28 30
1.8
1.6
1.'1
1.2
1.0
.8
.6
.'1
Fig. 17. Motion detection temporal frequency response.
Phllips Journal of Research Vol. 41 No. 6 1986 595

R. S. Prodan
the field frequency). This is precisely the temporal frequency alias componentproduced by high vertical frequency detail resulting in line flicker. Therefore,this temporal frequency component will not be detected as motion. The maxi-mum response of the frame difference motion detector occurs at one half theframe frequency. If a picture is temporally changing from frame to frame,then the frequency associated with an alternating m~lJdmumto minimum valuefrom frame to frame is one half the frame frequency, which is the frequencyproducing the maximum response of the frame difference motion detector.
The only situation which is not discernible by the motion detector, occurswhen a moving image produces temporal frequency components at the framefrequency. The output of the motion detector is zero in this case. Such a situa-tion is shown in fig. 18 for 'a vertical bar moving in the horizontal direction.
v
'.
Fig. 18. Motion detection sample positions of a horizontally moving bar in three adjacent fields,The horizontal, vertical, and temporal axes are depicted.
Assume the current field labelled n contains the line to be interpolated. Thesamples within the width of the bar in field n contain the background on whichthe bar is moving in the surrounding fields at times n - 1 and n + 1. Hence,the difference signal will be zero during field n for the samples within the widthof the moving bar and interpolation errors will result, since field insertion orpicture averaging will produce a bar of maximum vertical frequency ratherthan a uniform bar of zero vertical frequency. Hence, this alias frequency ispassed by the interpolation filter since the motion detector assumes a station-ary picture.
The motion detector shown in fig. 19 can be used to evaluate the motionparameter k needed for the filters previously discussed. This parameter isderived from the frame difference signal in the following way. The framedifference signal is calculated and the positive magnitude is taken. The mag-nitude of the difference signal is used in a look-up table which specifies the
596 Phlllps Journalof Research Vol.41 No. 6 1986

Multidimensional digital signal processing for television' scan conversion
kxCn+l) xCn)FIELD DELAY FIELD DELAY
k = f(ly(n)l)
Fig. 19. Motion detector implementation for calculating the motion parameter k,
value of k to be used for the amount of motion detected for each sample to beinterpolated. Possible look-up table functions are shown in fig. 20. A zerodifference signal selects k = 0 for stationary picture elements. As the magni-tude of the difference signal increases, the value of k also increases until satur-
1
o0.1 Iy(n) I/ly(n) I maximum
Fig. 20. Functions of the magnitude frame difference signal for determining the motion detectorparameter k.
Phlllps Journalof Research Vol.41 No. 6 1986 597

598 Phlllps Journalof Research Vol.41 No.6 1986
R. S. Prodan
ating at k = 1 for large differences due to motion. The exact function of themagnitude difference signal to determine k and the saturation point where k isunity, must be determined empirically by subjective evaluation on typical pic-ture material. The functions depicted in fig. 20 are linear below the saturatingvalue of k= 1.The magnitude of the frame difference signal at which the value of k satu-
rates, is fixed by the slope of the linear portion of the characteristic. Thechoice of slope is influenced by two factors. The first factor is the visibility ofresidual artifacts (alias components) along moving edges in the picture. In-tuitively, one would pick a steep slope so as to completely reject any alias com-ponents caused byeven the slightest movement. This would set the motionparameter to unity for very small frame difference signals.. The second factor influencing the slope is the random noise level of thevideo signal. Noise that is independent from frame to frame (e.g. thermalnoise) will produce a frame difference signal that will be indistinguishablefrom the same level signal produced by motion in the picture. Hence in a sta-tionary picture with some background noise, interpolation errors will be madeif the slope of the k factor versus frame difference function is too steep. As thenoise level in the picture increases, the slope of the function must be de-creased. The saturation point where k is unity, then occurs for a larger valueof the magnitude of the frame difference signal. This will allow some inter-polation error for moving edges in the picture. However, the noise will maskthese errors for modest decreases in slope. Allowing interpolation errors tooccur for moving parts of the picture rather than for stationary parts is betterdue to the decreased perception of small details that are moving rather thancompletely stationary details.It is obvious that these two factors, alias components due to small move-
ment or random noise level, impose conflicting requirements on the slope ofthe motion parameter k versus frame difference signal magnitude functions ofthe motion detector. A compromise is made based on subjective evaluationsof representative picture material with various noise levels added. Fig. 20 de-picts two possible curves 11 and h for noise power levels 0-1, and 0-1. respec-tively. In this case, the noise power 0'1, will be less than 0-1a- An adaptivemotion detector could select the appropriate function based on the measure-ment of the average noise power in the video signal.
8. Conclusions
A two dimensional analysis in the sampled vertical and temporal dimen-sions of the television signal has been presented. Cross dimensional aliasingpresent in interlace scanning was shown to produce display artifacts. This type

Multidimensional digital signal processing for television scan conversion
of aliasing is not present in sequential scànning thereby removing these arti-facts.A linear filtering technique in both the vertical and temporal dimensions
was shown to substantially reduce aliasing and remove resulting display arti-facts. This is accomplished by an interpolation filter which upsamples theinterlaced transmission to a sequentially scanned display of twice the trans-mission bandwidth. The two dimensional filters analysed are comprised oftwo separate one dimensional filters acting independentlyon the vertical andtemporal dimensions of the signal.
The filtering requirements for stationary image interpolation was shown tobe different from those for moving image interpolation. The interpolation filtershould be motion adaptive to tailor the vertical-temporal frequency response.It is then possible to minimize the unwanted alias components and retain thedesired frequency components maximizing spatial-temporal resolution with-out interpolation errors that result in artifacts in the sequential display.An adaptive interpolation filter necessitates the use of a motion detector to
decide on the proper filter characteristic for each sample to be interpolated.Since vertically sampled information is periodically sampled itself at the framerate, a frame difference signal can be used to detect motion at each interpola-tion sample position. The strengths and limitations of a frame difference sig-nal based motion detector were presented. The effects of random noise on themotion adaptive filtering process was described. This showed that the motiondetection must itself be adaptive to noise power level.The results presented in this paper demonstrate the source of scanning
related artifacts and proposes some solutions to improve the displayed qualityof conventionally transmitted television signals. Many aspects of these pro-posed techniques are by no means completely solved. The limitations of themotion detection algorithm leads to anomalies that present a challenge forfuture research. Perhaps a more elaborate solution that is not as locallyrestricted but more global in nature is required. This can be heuristically justi-fied in that displayed interpolation errors are obvious to an observer only if asufficiently large area of the display is viewed.
Appendix A. Periodic sampling and reconstruction of multidimensional sig-nals
The concept of periodic sampling of a continuous signal can be extended toa continuous function in N dimensional Euclidean space"). A signal in Ndimensions is represented by a function of Nvariables t i to t« in its domain; Aset of equispaced samples are defined on an N dimensional sampling lattice")formed by taking all integer linear combinations of a set of Nlinearly indepen-
Phlllps Journal of Research Vol. 41 No.6 1986 599

R. S. Prodan
dent column vectors [VI, V2, ••• , VNJ. These vectors span the N dimensionalspace and are known as the basis of the lattice. The sampling matrix V is anNxN matrix whose columns form the basis, that is
V =-[VI V2 ••• VNJ.
Each location on the sampling lattice is given by
t= Vn,
(Al)
(A:2)
where n is a vector with integer components, and t is the N dimensionalcolumn vector of continuous values of the domain of the analog signal xa(t).Thus if xa(t) is sampled on the above lattice, the sequence of samples is givenby
x(n) = xa(V n). (A3)
In one dimension, V is the sampling period T.The N dimensional Fourier transform and inverse transform for the con-
tinuous analog signal xa(t) is defined asco
Xa(w) = J xa(t) exp(- j w't) dt-co
(A4)
I oexa(t) = --N J Xa(w) exp( - j w't) dw.
(21t) -oe(A5)
where to I denotes the transpose of (J) and the integrations areN fold multipleintegrals over the components of their respective column vector dummyvariables.
The N dimensional discrete Fourier transform and inverse transform for the(nonperiodic) discrete sampled signal is defined as
oe
X(;.) = I x(n) exp(-j A' n)n=-c:o
(A6)
I 7t
x(n) = --N J X(;.) exp(j A' n) dÀ,(21t) -7t
(A7)
where the components of the digital frequency A are periodic over an intervalof 21t. This is an extension of the one dimensional scalar definitions 4).
Letting x(n) == xa(Vn) in the continuous transform yieldsI oe
x(n) = xa(Vn) = --N J Xa(w) exp(-j w'Vn) dw. (AB)(21t) -oe
Performing a change of variables by the transformation
A = V' ta (A9)
600 Phlllps Jeumal of Research Vol.41 No. 6 1986

Multidimensional digital signal processing for television scan conversion
with the Jacobian determinant of the transformation as
(AIO)
yields upon substitutionco
1 J 1x(n) = --N -I -I Xa(V,-1 À) exp(j À' n) dl.(2n) V .
-co
(All)
The integral over the entire N dimensional space can be broken up into aninfinite N fold sum of finite integrals each over an appropriate hypercube ofvolume (2n)N. This is done by substituting for each of the N integrals thelimits -n + 2n kt ~ Àt ~ n + 2n kt; i= 1,2, ... ,N. Let R(k) denote the hyper-cube volume in the interval specified by integer vector k. The integral thenbecomes
x(n) = (2~)NI J 1~I Xa(V,-1 À) exptj À' n) dl.k R(k)
Replacing À by À - 2n k removes the dependence of the limits of integrationon k giving
It
x(n) = (2~)N J 1~II Xa(V,-I(À - 2n k» exptj À' n) exp(- j 2n k' n) dl.
-1t k (A13)
(AI2)
The second exponential factor is always equal to 1. Comparing t_hisresult tothe inverse transform of the discrete Fourier transform implies that
X(À) = 1~II Xa(V,-1 (À - 2n k».
k
(AI4)
In terms of the analog frequency (IJ = V,-1 À
X(V' (IJ) = 1~II Xa«(IJ - Uk),k
(AI5)
with the aliasing matrix U determined by
U'V= 2nl, (AI6)
where I is the NxN identity matrix.
PhllIps Journalof Research Vol. 41 No. 6 1986 601

R. S. Prodan
This last result provides the relationship between the spectra of the discretesampled signal x(Vn) and the continuous analog signal xa(t). Since X(À) isperiodic with periodicity 21t in all dimensions, X(V' co) is periodic with perio-dicity determined by the aliasing matrix U. The columns of U form the basisof the reciprocal lattice in N dimensional Fourier space. All integer linearcombinations of the N column vectors of U define the centers of the repeatspectra of the sampled signal. Each repeat spectrum is located at the frequencyUk for each integer valued vector k.An important observation is that the sampling geometry as well as the sam-
pling rate determine the positions of the spectral repetitions. Hence, aliasingcan be avoided and an exact recovery of the analog signal from the sampledsignal is possible. The necessary and sufficient condition for such recovery isthat the spectral repetitions of the ..analog spectrum Xa(w) possess nonover-lapping regions of support in N dimensional Fourier frequency space.
Appendix B. Multidimensional sampling and aliasing geometry in televisionscanning
The method of calculating the frequency domain spectral periodicity of amultidimensional sampled signal derived in appendix A is employed to charac-terize the frequency domain geometry of both sequential and interlaced tele-vision scanning formats. A two dimensional vertical-temporal sampling struc-ture is used to represent the sampling of verticallines repetitively in time everyfield.
The sampling lattice for sequential scanning is shown in fig. 4a. The scanlines of the raster produce vertical samples of the image that occur in the samepositions for every temporal sample each field. This results in a rectangularsampling lattice. Let Tv and 1;be the vertical and temporal sampling periods,respectively. The vertical sampling period is defined by
Tv = _!_ picture heights,N
(BI)
where N is the number of scanning lines in a complete picture. The temporalsampling period is defined by
11;= F seconds, (B2)
where F is the field rate (vertical scanning repetition rate). For the NTSCsystem M 525 line scanning standard, N is 525 lines and F is 60 fields persecond.
602 Phillps Journalof Research Vol.41 No. 6 1986

Multidimensional digital signal processing for television scan conversion
The sampling matrix for the sequential scan sampling lattice of fig. 4a is
V = [ Tv 0 J. (B3)o Tt
The aliasing matrix corresponding to this sampling matrix is therefore
[
1
TvU = 27t V,-1 = 27t 0 (B4)
The reciprocallattice for this aliasing matrix is shown in fig. 4b.The sampling lattice for interlaced scanning is shown in fig. 6a. The scan
lines of the raster produce vertical samples of the image that occur in alternatepositions in alternate temporal samples or fields. The scan lines interleaveuniformly over any adjacent pair of fields to constitute an entire picture. Thisresults in the hexagonal ") sampling lattice shown.
The sampling matrix for the interlaced scan sampling lattice of fig. (ja is'
V=[~ -~J. ~~Tt Tt
The aliasing matrix corresponding to this sampling matrix is therefore
[
2~V ;~]U= 27t •1 1- -2Tt 2Tt
The reciprocallattice for this aliasing matrix is shown in fig. 6b.
(B6)
REFERENCES1) R. W. Schafer and L. R. Rabiner, Proc. IEEE 61, 692 (1983).2) D. P. Peterson and D. Middleton, Inform. ControlS, 279 (1962).3) R. M. Mersereau and T. C. Speake, IEEE Trans. Acoust., Speech, Signal Processing
ASSP-3I, 188 (1983). '4) J. W. Cooley, P. A. W. Lewis and P. D. Welch, IEEE Trans. Audio Electroacoust. AU-IS,
79 (1967).6) R. M. Mersereau, Proc. IEEE 67, 930 (1979).
Phillps Journolof Research Vol. 41 No. 6 1986 603