Embed Size (px)
Citation preview

INT. J. BIOAUTOMATION, 2015, 19(3), 351-376
351
Multidimensional Analytical Study
of Heart Sounds: A Review
Akash Kumar Bhoi
1*, Karma Sonam Sherpa
2, Bidita Khandelwal
3
1Department of Applied Electronics and Instrumentation Engineering
Sikkim Manipal Institute of Technology
Majhitar, India
E-mail: [email protected]
2Department of Electrical and Electronics Engineering
Sikkim Manipal Institute of Technology
Majhitar, India
E-mail: [email protected]
3Department Gen Medicine
Central Referral Hospital and SMIMS, SMU
Gangtok, India E-mail: [email protected] *Corresponding author
Received: April 15, 2015 Accepted: September 23, 2015
Published: September 30, 2015
Abstract: Heart diagnosis by phonocardiography and auscultation is highly dependent on
experience and there is a considerable inter-observer variation. The complex structure of the
Phonocardiogram (PCG) and the variations due to cardiac contractility can generate
additional difficulties for auscultation. This review paper focuses on such critical problem
solving issues with a variant of analysis. However, different methods and techniques are also
described for detection and analysis of PCG signal and it will certainly aid findings in novel
computational tools in biosignal processing.
Keywords: Phonocardiography, Variant Analysis, Multidimensional Analysis.
Introduction Heart sounds and murmurs arise as a consequence of turbulent blood flow and vibrating
cardiovascular structures. Some decades ago, the Phonocardiography (PCG) has been largely
used together with the Electrocardiography as providing important information about the
cardiac diseases. Later, the ultrasound techniques took its place offering a lot of additional
quantitative indices related to the cardiovascular system. Recently the interest to the PCG and
other more sophisticated heart sounds investigations reappears in the field of medicine [88].
The reason is that they are non-invasive, economical and accurate methods for assessing
different heart valve pathologies. Hult et al. [88] suggested that the detection of a third sound
in adults is shown as simple method for systolic heart failure discovery.
The PCG signal discloses information about cardiac function through vibrations caused by the
working heart. In the early days of PCG signal analysis, manual interpretation of waveform
patterns was performed in the time domain. Heart sounds were identified as composite
oscillations related to valve closure and heart murmurs seemed to derive from malfunctioning
valves or from abnormal holes in the septal wall [1]. Heart auscultation, the technique of
listening to heart sounds, is a convenient and economical method for diagnosing
cardiovascular diseases (CVD). Though clinical diagnosis of cardiovascular disease mainly

INT. J. BIOAUTOMATION, 2015, 19(3), 351-376
352
refers to other methods such as electrocardiography (ECG), angiocardiography and so on, the
considerable role of PCG in diagnosis of CVD cannot be underestimated, especially in
computer-aided CVD diagnosis of fusing other vital signals (e.g. ECG) to improve the
diagnostic accuracy [66]. The physiological variability of the mechanical function of the heart
is reflected in the produced acoustic vibrations – the heart sounds. Heart sounds have been
widely used in clinical practice since the introduction of the first stethoscope by Laennec in
1816, and the invention of phonocardiography, the graphic recording of heart sounds, by
Einthoven in 1894. Heart sounds and their clinical utilization in cardiovascular and
cardiopulmonary diseases have been extensively studied for many years [36]. Relations
between morphological features of heart sounds and hemodynamic parameters have been
quantitatively described in both animal models and humans [37, 38].
Heart sounds and murmurs are of relatively low intensity and are band-limited to about
10-1000 Hz, (Fig. 1).
Fig. 1 Relationship between the acoustic range of cardiac sounds and the threshold
of audibility of sound pressure for human ear
(figure redrawn from Leatham [2])
The traditional areas of auscultation (Fig. 2), where the radiated sound intensity from each of
the four heart valves is maximized, are defined as [5]:
Mitral area: The cardiac apex.
Tricuspid area: The fourth and fifth intercostal space along the left sterna border.
Aortic area: The second intercostal space along the right sternal border.
Pulmonic area: The second intercostal space along the left sternal border.
Fig. 2 The traditional auscultatory areas on the chest:
M (refers to the mitral area), T (refers to the tricuspid area),
P (refers to the pulmonic area), and A (refers to the aortic area).

INT. J. BIOAUTOMATION, 2015, 19(3), 351-376
353
Fig. 3 Wiggers diagram, showing pressures and flows in the left side of the heart
over one heart cycle and their relation to electrical (ECG) and mechanical (PCG) activity
The first heart sound (S1) and second heart sound (S2) in Wiggers diagram (Fig. 3) are easily
audible in nature, and the time duration is around 150 ms and 120 ms. It ranges from
20 to 150 Hz. Heart sound (S1) is associated with the closure of the mitral-tricuspid valve, it
occurs during the isovolumetric contraction of the ventricles. Heart sound (S2) is related to
the aorticpulmonary valve at the time of the isovolumetric relaxation of the ventricles.
The third heart sound (S3) and fourth heart sound (S4) are very light sound, i.e., almost
inaudible in nature. S3 and S4 are very low frequency sound. S3 is not originated from the
valve although it happens at the beginning of the diastole and hence, it is known as Proto-
diastolic sound. Bulk of blood flow into the left ventricles causes vibrations in the valve.
Heart sound (S4) is mainly found in the healthy children and not, usually found in adults. It is
called pre-systolic gallop in pathological term when found in adult. The Healthy signals are
the signals which have a clear sound of S1 (‘lup’) and S2 (‘dup’) and almost negligible sound
of S3 and S4. Healthy heart sound contains heart sound segment S1 and S2, which gives
information of functionality of heart sound [3, 4]. The intensity of the first heart sound (S1)
varies with certain conditions. Those who suffer from emphysema, obesity, pericardial
effusion, myocardial disease or mitral regurgitation may have decreased first heart sound
(S1). Increase in intensity of the first sound depends upon the vigour of the ventricular
systole. Thus results in loud sounds in exercise, emotional states and in hyperthyroidism,
anemia, mitral stenosis and hypertension. The conditions giving rise to change in intensity of
the first heart sound (S1) has been discussed by various authors [89-92].
The relationship between ECG and PCG can be figured out from Wingger diagram (Fig. 3)
where, S1 occurs with low frequency vibrations approximately 0.05 second after the onset of
QRS-complex of ECG signal. S2 starts approximately 0.03-0.05 second after the end on
T wave of the ECG. S3 starts at 0.12-0.18 second after the onset of second heart sound (S2)
INT. J. BIOAUTOMATION, 2015, 19(3), 351-376
354
and the fourth heart sound (S4) starts approximately 0.12-0.18 s after the onset of P wave of
ECG signal. S1 and S2 have two major components, M1 and T1, A2 and P2, respectively.
M1 is caused by mitral closure and blood flowing interruption in left atrial and systolic
ventricular and T1 is caused by tricuspid closure. A2 starts before aortic valve closed, and
P2 starts after pulmonary value closure, both are caused by intraventricular pressure dropping
and blood returning in diastole. The delay time between M1 and T1, A2 and P2 are called the
first split and the second split, respectively. The measurement of the first and second split,
lower or higher than 30 ms, will easily make it possible to make discrimination between the
normal or pathological type [68]. It is often followed by echocardiography during the
abnormal auscultatory findings. However, the lack of reliability of ordinary auscultation its
expense and awkwardness of echocardiography make it desirable to develop a more practical,
inexpensive, reliable and non-invasive approach to auscultation, one that could also be
adapted for continuous monitoring [71-75]. Akbari et al. [76] performed Digital Subtraction
Analysis of the heart murmurs signal using a custom computer program called Murmurgram
for the detection and characterization. In essence, this program subtracts the recorded sound
from two adjacent cardiac cycles to produce a difference signal, herein called a
“murmurgram” [76].
Feature extraction is typically a preceding step for a classification or regression task.
Heart sound classification, based on morphological spectral and time–frequency features, has
been previously used for assessing the condition of bioprosthetic heart valves [40-42].
Auscultation, the noninvasive cardiac testing, is used as a primary detection tool for diagnosis
of heart valve disorders since invention of stethoscope in 1816 by Lannec [47]. In Bender,
it is reported that few heart valve diseases are best detected only by means of auscultation
process [48]. Auscultation is the most common and cost-effective technique, continues to
provide an important source of clinical information related to heart valves and also, cannot be
totally replaced by alternative technical methods like echocardiography [49]. In case of
abnormal heart sounds, there could be several other sounds in the PCG signal besides primary
heart sounds. Murmurs are abnormal heart sounds and refer to different pathological
conditions as per location, shape, duration and other associated features [52]. Murmurs are
generally high-frequency, noise like sounds that are produced as a result of turbulent blood
flow. Different features of PCG signals like intensity, frequency content, split information,
time relations etc. are helpful in detecting heart valve diseases, if any and the state of the heart
function [53]. Ian Cather has presented Artificial Neural Network (ANN) as a discriminative
model for classification of five different heart sounds taken from 48 recordings of nine
different subjects using wavelet based feature extraction technique [54]. Ölmez et al. [55]
have given a classification technique that utilizes Daubechies-2 wavelet detail coefficients at
the second decomposition level for classification of seven different heart sounds collected
from 28 subjects using ANN. Reed et al. [56] have described a computer-aided diagnosis
mechanism for five different pathological cases using seven level wavelet decomposition,
based on a Coifman fourth order wavelet kernel and Ari et al. [57] proposed, a binary decision
on heart sound, whether pathological or not, in a Digital Signal Processor based system. Choi
[58] proposed a technique for detection of valvular heart sounds as normal or pathological
using wavelet packet decomposition and support vector machine with fifth order polynomial
kernel function. Information, such as the temporal localization of the heart sounds, the
number of their internal components, their frequency content, and the significance of diastolic
and systolic murmurs, could all be studied directly on the PCG signal. In order to recognize
and classify cardiovascular pathologies, advanced methods and techniques of signal
processing and artificial intelligence need to be used. The advancement of technology has
paved the way for signal processing methods to be implemented and applied in many simple
INT. J. BIOAUTOMATION, 2015, 19(3), 351-376
355
tools useful in everyday life. This is most notable in the medical technology field where
contributions involving the intelligent applications have boosted the quality of diagnosis.
Proposing an objective signal processing method capable to extract relevant information from
biosignals is a great challenge in telemedicine and auto-diagnosis fields [86].
Sa-Ngasoongsong et al. [87] presented the design and testing of a wireless sensor system
developed using a Microchip PICDEM developer kit to acquire and monitor human heart
sounds for phonocardiography applications. This system can serve as a cost-effective option
to the recent developments in wireless phonocardiography sensors that have primarily focused
on Bluetooth technology. This wireless sensor system has been designed and developed in-
house using off-the-shelf components and open source software for remote and mobile
applications. The small form factor (3.75 cm × 5 cm × 1 cm), high throughput (6,000 Hz data
streaming rate) and low cost ($13 per unit for a 1,000 unit batch) of this wireless sensor
system make it particularly attractive for phonocardiography and other sensing applications.
The experimental results of sensor signal analysis using several signal characterization
techniques suggest that this wireless sensor system can capture both fundamental heart sounds
(S1 and S2) and is, also, capable of capturing abnormal heart sounds (S3 and S4) and heart
murmurs without aliasing. The results of a denoising application using Wavelet Transform
show that the undesirable noises of sensor signals in the surrounding environment can be
reduced dramatically. The exercising experiment results also show that this proposed wireless
PCG system can capture heart sounds over different heart conditions simulated by varying
heart rates of six subjects over a range of 60-180 Hz through exercise testing [87]. Shub [50]
compared the cardiac physical examination with echocardiography for evaluating systolic
murmurs and concluded that echocardiography is not required for all patients with systolic
murmurs and should not replace cardiac physical examination; Chizner [51] reviewed the
fundamental principles of the art of cardiac auscultation and emphasized on the proper use of
the stethoscope and the diagnostic and prognostic significance of the myriad heart sounds and
murmurs present in patients with and without symptomatic heart disease, and Debbal et al.
[67] proposed computerized analysis of heart sounds which is concerned with a synthesis
study of the Fast Fourier Transform (FFT), the Short-time Fourier Transform (STFT), the
Wigner distribution (WD) and the Wavelet Transform (WT) in analyzing the
Phonocardiogram signal (PCG). It is shown that these transforms provide enough features of
the PCG signals that will help clinicians to obtain qualitative and quantitative measurements
of the Time-frequency (TF) PCG signal characteristics and consequently aid diagnosis.
Physiological importance of heart sounds
Fetal maturity As during pregnancy all the frequency determining parameters undergo physiological change.
The growing dimensions and increasing contractile strength of the myocardium characteristic
changes of the PCG spectrum are to be expected as a function of the stage of fetal maturity.
In order to verify this assumption, extensive experimental studies have been done. The power
spectra were integrated in order to compare different spectra using only one single parameter.
The determining measure was the frequency within which 80% of the total PCG power is
contained, i.e., where the power spectrum integral reaches 80% of its maximum. Mean values
of the 80% marks for the first and second heart sound are shown in Fig. 4. Each point was
computed from 30-50 fetuses of the same gestational age. Of course, mean values have been
computed only from spectra of fetuses that were known to be developing normally.

INT. J. BIOAUTOMATION, 2015, 19(3), 351-376
356
Fig. 4 Relationship between fetal PCG spectrum and gestational age.
The traces show the mean 80% power marks of the integrated power spectra
for the first and second heart sound dependent on the week of pregnancy.
The standard deviation of the single measuring points typically corresponds to 1.4 weeks.
(figure redrawn from Nagel [16])
The first heart sound reveals a steady shift towards higher frequencies up to about the 34th
week of gestation. Thereafter, the shift reverses its direction. The spectrum of the second heart
sound steadily shifts to lower frequencies. The decrease in frequencies can be explained by
the growth of the heart from physical models, whereas the ascending slope of the first heart
sound's spectrum is primarily caused by the predominance of the increasing contractile
strength of the myocardium during that stage of pregnancy. On the basis of these findings,
spectral analysis of the PCG can be considered a real alternative to better known
measurements such as ultrasonic imaging in the determination of fetal maturity.
When investigating the reliability of this measurement, possible disturbing influences such as
changing cardiovascular conditions (e.g. the heart rate) have to be considered. So far,
however, no negative effects have been found. Indeed, measurements were always done at the
basal heart rate with no labor activity, and in the absence of accelerations and decelerations.
In several cases the spectra did not fit any stage of maturity, showing distinct deviations from
normal values. Further investigations (done partially after birth), confirmed the existence of
heart diseases, predominantly valve malfunctions. This diagnostic capability is the direct
consequence of the fact that each pathological variation of either cardiac function or anatomy
results in a change in the PCG spectrum.
Cardiac contractility variability Variation in the amplitude of the first heart sound is seen in almost every sample of the
Phonocardiogram (PCG). During heart-sound signal processing, Xiao et al. [29] found that
this phenomenon had its own regularity. There are many factors causing this variation, such
as respiration, exercise, psychological activity, drugs, temperature, smoking, disease, etc.
These factors can affect the heart's state of inotropism, chronotropism, and dromotropism,
which will be reflected in the PCG. It has been reported that changes in the amplitude of the
first heart sound are closely correlated with the maximum rate of rise of left ventricular
pressure (a standard measure of cardiac contractility) [23-28].
Descriptive analysis have already being done based on the relationship between the amplitude
of the first heart sound (S1) and the cardiac contractility [23-28], Xiao et al. [29] proposed a
concept of Cardiac Contractility Variability (CCV) and a method of analysis. This study was
carried out to examine the regularity of the amplitude variability of the first heart sound and to
evaluate the practical significance of the CCV. Cardiac contractility variability can easily be

INT. J. BIOAUTOMATION, 2015, 19(3), 351-376
357
studied by means of heart-sound analysis, a safe, non-invasive, and inexpensive technique.
Analyzing the regularity of S1 variability and evaluating CCV may have practical utility and
is worth further study. A study of CCV may be of help in gaining insight into the neurogenic
cardiovascular state of patients in different clinical conditions.
A change in the pattern of CCV may be an indicator of systolic function. Also, it might be an
indicator of lung ventilation function e.g., in a patient with emphysema, the compliance of
lungs and thorax decreases. In turn, the respiratory variation of venous return to the heart is
reduced, and therefore the variation of S1 amplitude in a respiratory cycle becomes less
obvious.
Spectral analysis of prosthetic heart valve sounds Analog techniques for processing prosthetic valve Phonocardiograms (PCG) have met with
limited success in extracting this information, because of their poor spectral resolution and
lack of versatility. Numerical methods of signal processing overcome most of these
limitations, but the need for a computer to implement numerical methods raises the question
of cost-effectiveness in many applications. Numerical analysis of prosthetic valve signals has,
therefore, received very little attention outside the academic and laboratory context.
Cost reductions in computer hardware arising from the use of micro-processors; make it
possible to envisage dedicated clinical instruments for processing prosthetic valve sounds in
view of assessing overall valve performance and detecting component degradation at an early
stage. Basic spectral considerations for the design of such instruments are discussed [15].
From the very beginning of phonocardiography, it has been known that sound-producing
events which give rise to the PCG include oscillations of blood masses, movements of the
heart wall and valves and turbulence in blood flow. Signals recorded from the body surface
are further conditioned by the transmission characteristics of intervening tissues and the
transducer used. Because these structure (both the active sound producing sources and passive
components) differ morphologically. Their vibrational modes of resonance are also different.
Fortunately, most prosthetic valve sounds are much louder and contain higher frequency
components than the other structures of the heart so that extracting them from the PCG is
relatively easy.
In the past, two techniques of spectral analysis (spectroanalysis) have been used for detecting
such changes. One technique, called “octave-band analysis” uses a bank of band-pass filters
and an electronic system that evaluates the relative energy of the signal output by each filter
[6]. The term “octave-band analysis” arises from the fact that the central frequencies of two
successive filters are in a ratio of 1:2. An average curve is then obtained by plotting the
relative amplitude of prosthetic sounds versus frequency over many cardiac cycles. The other
technique named “sound spectrography” was developped by Bell Laboratories for speech
analysis; it was first used in phonocardiography by Geckeler et al. [7] and McKusic et al. [8]
in 1954. Instruments based on this technique provide a three dimensional display of
frequency, amplitude and time for a short segment of PCG recorded on a loop of magnetic
tape to reproduce the PCG with the periodicity required for the analysis. The principle of
analysis is to use a single fixed band-pass filter and to translate the spectrum of the signal in
successive steps. This is achieved through amplitude modulation of the PCG by a sine wave
whose frequency is increased step-wise. The spectrum of the PCG is thus progressively
swept; the amplitude of each frequency band is evaluated and recorded on photographic paper
as dots of variable intensity. A drawback of this instrument was that only a qualitative
evaluation of spectral energy was possible from the gray-scale graph. This was overcome by a
later instrument introduced by Winer (1965) which presents the signal information as

INT. J. BIOAUTOMATION, 2015, 19(3), 351-376
358
frequency-time contours of equal spectral energy. It is this later technique that has been
mostly used in the non-invasive evaluation of prosthetic ball-valve variance, as reported by
Hylen et al. [9] (1969), Aigner et al. [10, 11] (1973-1977), and Kagawa et al. [12] (1977).
An example of the spectrum of an aortic valve sound obtained by this technique is presented
in Fig. 5.
Fig. 5 Contour spectrogram of the PCG of a Harken aortic ball valve:
Aortic opening sounds (AOS), Aortic closing sound (ACS).
(figure redrawn from Durand et al. [15])
Despite the fact that such a representation contains a lot of information on the prosthetic valve
being evaluated; the extraction of quantitative parameters is quite difficult. The spectral
analysis of prosthetic valve sounds done by octave-band analysis and contour spectrography
is mostly qualitative and generates quantitatively the same parameter: the highest harmonic
component of opening (OS) or closing valve sounds (CS). Therefore, the information
contained in the Phonocardiogram of cardiac valve prostheses. In addition, being essentially
analog techniques and the difficulty of implementing filters with near ideal band-pass
frequency response, it suffers from limited frequency resolution. While these techniques were
finding some limited clinical acceptance whereas, the increasing availability of digital
computers in the early '60s promoted the development of numerical methods of signal
analysis. One of the most important events of this decade was the introduction of the FFT
algorithm by Cooley and Tukey [13] in 1965, which, by drastically reducing the computing
time required for spectral evaluation, practically revolutionized signal analysis.
An efficient FFT implementation of the Discrete Fourier Transform (DFT) is crucially
important since the DFT is the basis for most spectrum analysis techniques: a speed
improvement of roughly 100 in the computation of a 1024 sample sequence can result from
the evaluation of the FFT versus the evaluation of spectral components by a straightforward
numerical integration. The Discrete Fourier Transform pair can be represented by:
1
0
, 0, 1, , 1N
nk
N
n
X k x n W k N
(1)
1
0
1, 0, 1, , 1
Nnk
N
n
X n x k W k NN
(2)
where the amplitude and phase information of the harmonic term 2 /j N
nW e is contained in
the complex coefficient X(k).

INT. J. BIOAUTOMATION, 2015, 19(3), 351-376
359
In order to retain some temporal information of the PCG signal, the concept of the short-time
Fourier representation of a signal is quite useful [14]. Mathematically, it can be defined as:
1 2
0
, , for 0,1, , 1 and 2
N j mk
N
m
NX n k W m x n m e k N n
(3)
where W(m) is a real window sequence of duration N centered on the time index n in order to
determine the portion of the input signal that receives emphasis at a particular value of n.
The procedure is illustrated in Fig. 6.
Fig. 6 Schematic illustration of the spectrogram construction of a signal x(n)
(figure redrawn from Durand et al. [15])
The short-time DFT is clearly a function of two variables: for each value of the time index n,
the obtained Fourier representation (index k) of its neighboring values emphasized by the
window sequence used. Thus, by taking successive short-time DFT at each or multiple values
of time index n, it is possible to construct a digital time-dependent frequency representation of
the input signal.
PCG spectral composition The heart represents a rather complex oscillatory system, whose spectral power distribution is
determined by numerous factors, such as the dimensions of the vibrating tissues (muscle and
valves), their properties with respect to elasticity and density, and the physical conditions of
vibrational excitation, especially the spectrum of the excitational function and the tension of
the tissues that is caused by external forces as well as by their own contraction. Additionally,
the spectrum is influenced by the surrounding media, primarily the blood contained in heart
and vessels. Last but not least, the intracardial blood volume itself represents a vibrational
system, whose contribution to the heart sounds appears particularly distinct in the case of
eddy flows caused by cardiac malfunctions, such as valvular stenosis or insufficiency. Due to
the complexity of the heart it is not possible to formulate an analytical description of the

INT. J. BIOAUTOMATION, 2015, 19(3), 351-376
360
vibrations or their spectra. The well-known Laplace model describes the ventricles as
a thin-walled hollow sphere. The tension (s) of the wall depends on the trans-mural filling
pressure (p), the radius (r) of the sphere, and the thickness (h) of the wall, that is the
myocardium:
2
prs
h (4)
For thick-walled structures, the relationship is
33
3
3 3
12
( )
ai i
a i
rp r
rs r
r r
(5)
where ri and ra represent inner and outer radii of the wall, and r lies between these limits.
The tension decreases from the inside towards the outside. In the course of the heart cycle,
both wall tension and intracardial pressure and also the radius of the ventricles are subject to
change. According to the stage of heart action, these three variables exchange the function of
dependent and independent parameters. During diastole there is a passive increase of wall
tension (the preload) caused by the filling pressure, whereas during the systole the contraction
of the myocardium actively increases the wall tension (the after load) and thus produces an
interventricular rise of pressure. During the ejection time, the tension of the myocardial wall
is influenced essentially by the decrease in ventricular radius and the increase in its thickness.
Besides pathologic variations of the PCG power spectrum, characteristic shifts are also to be
expected according to physiological changes of the characteristic parameters that occur
depending on gestational age and fetal maturity [16].
Representation of heart sound signal in time-frequency domains Several signal models can be found in literature for the decomposition of heart sound signal,
such as the chirp models [60, 61], the damped sinusoidal models [62, 63], the modified Prony
models [64], and Leung et al. [65] employed the Gaussian modulation model to decompose
the second heart sound for the diagnosis of pediatric heart diseases. For each patient, the splits
of 20 successive cardiac cycles are measured; their mean and standard deviation are then
calculated and used to characterize the two splitting patterns. It is found that the two simple
statistical quantities can be used to identify the splitting patterns and hence, offer important
diagnostic information.
2 2( ) / 2
1
cos(2 )m
mi mi
Lt t
m mi mi mi
i
h t a e t
(6)
where hm(t) is the heart sound signal of the mth
cycle. Namely, Eq. (6) means that hm(t) is the
sum of Lm atoms. Every atom is characterized by five parameters: tmi is the time delay of the
ith
atom with respect to the start of the mth
cycle; ami is the amplitude; ωmi is the frequency;
σmi is the time width that the atom needs support; βmi is the phase. Therefore, the heart sound
signal of this cycle is represented by the set of atoms {tmi, ami, ωmi, σmi, βmi, 1 ≤ i ≤ Lm}.
The number of atoms, Lm, and the five parameters for each atom can be obtained using short-
time Fourier transform (STFT) analysis, as described in [65].

INT. J. BIOAUTOMATION, 2015, 19(3), 351-376
361
The STFT of the heart sound signal hm(t) is
2, mH t f h t t e d (7)
Biometric identification The performance of traditional biometric identification systems is, as yet, unsatisfactory in
certain applications. For this reason, other physiological or behavioral characteristics have
recently been considered, using new electrical or physical signals linked to a person’s vital
signs. Francesco Beritelli examines the biometric characteristics of PCG signals from cardiac
auscultation. The idea is that PCG signals have specific individual characteristics that can be
taken into consideration as a physiological sign used in a biometric system [31]. The database
used for the biometric identification by Francesco Beritelli, contains heart sounds from people
suffering from various types of cardiac pathology. In order to study the spectral characteristics
of heart sounds and, therefore, their biometric properties, the recordings which are used
contains heart sounds relating to the following pathologies:
1) innocent systolic murmur; 2) mitral regurgitation variations; 3) mitral regurgitation;
4) mitral stenosis; and 5) third heart sound.
Biometric technologies are based on the use of individual characteristics for the recognition or
identification of an individual [30]. They are divided into two areas:
1) Physiological characteristics (unique and unvarying), which include the geometry
of the hand and the palm print, fingerprints, retina, or iris image, and the (geometrical)
features of the face;
2) Behavioral characteristics (unique but varying), which include signature, way
of walking, voice (the latter also belongs to the previous group), and keyboard typing style.
A feature common to all biometric technologies is the capability of human recognition from
biometric data. This consists of a series of basic processes:
i. Acquisition and storage of reference biometric data acquired by means of sensors
(optical, ultrasonic, thermal, etc.);
ii. Acquisition of new biometric data at the start of a recognition process, for
comparison with the reference data;
iii. Determination of the correspondence of the newly acquired data to the stored
reference to determine whether they both could have been generated by the same
person.
In the first phase (enrollment), a sample is acquired, which might be converted to a template,
a model, or left unprocessed. This is accomplished in a controlled environment so as to
guarantee the security of the original and the properties of the biometric print. The second
phase (matching) is activated whenever it is necessary to verify or identify a print.
Authentication or verification is performed by comparing the acquired print with a reference.
Identification is performed by searching in an archive for a compatible template.
They therefore serve to identify a person whose identity is not necessarily known a priori.
The implementation of a biometric solution requires recognition threshold values to be
assigned. Due to various physical and environmental factors, in fact, the result of a biometric
identification process is never completely certain. The definition of the recognition threshold
establishes the boundary between acceptance and rejection of a request. In this way, it is
possible to set the security level on which the False Reject Rate (FRR) depends on (i.e., the
number of times the system does not recognize a sample as coming from the same individual
who produced the reference) and the False Accept Rate (FAR) (i.e., the number of times the
INT. J. BIOAUTOMATION, 2015, 19(3), 351-376
362
system incorrectly matches a sample from one person to a reference from another).
The FRR and FAR are generally considered as indices of the biometric system’s performance.
The segmentation algorithm, which is essential for the subsequent matching phase, generally
segments the sequences analyzed correctly and so is very robust to the degradation typically
occurring in PCG sequences recorded in a real application context. As far as the matching
phase is concerned, first conducted a preliminary study to identify the heart auscultation
region (i.e., one of the four auscultation positions for the stethoscope), which gives the best
degree of separability between classes for intra and interperson distances.
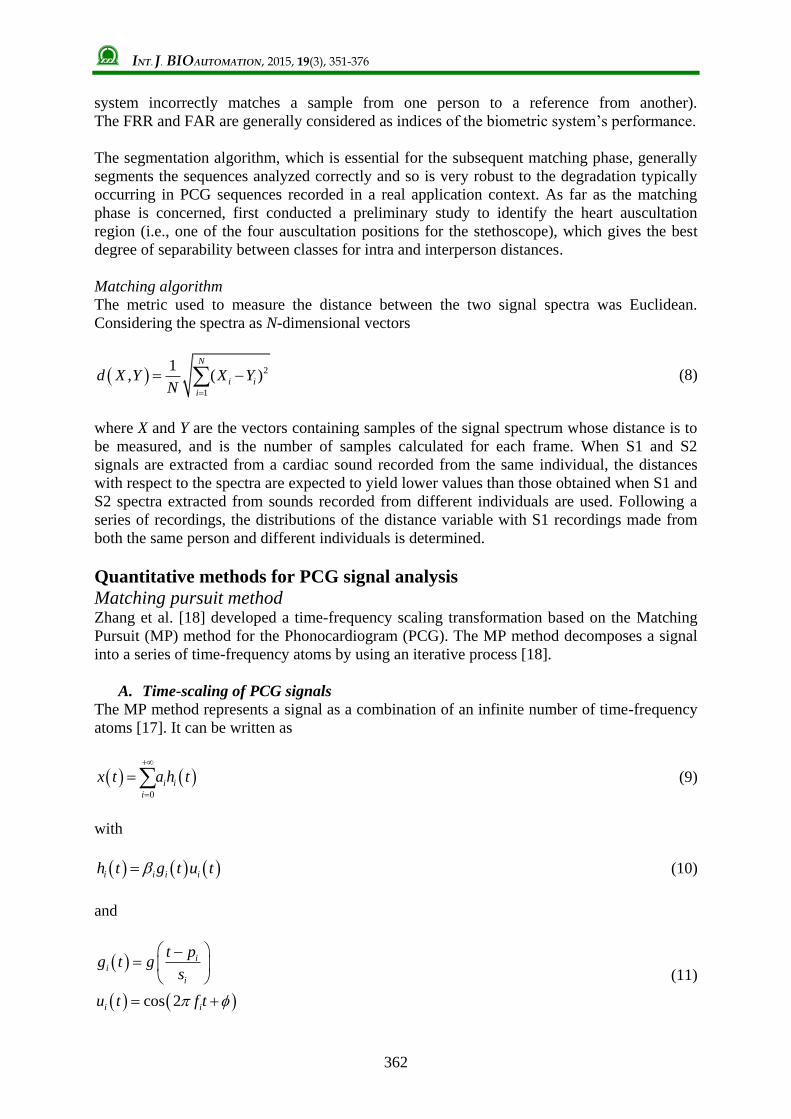
Matching algorithm
The metric used to measure the distance between the two signal spectra was Euclidean.
Considering the spectra as N-dimensional vectors
2
1
1, ( )
N
i i
i
d X Y X YN
(8)
where X and Y are the vectors containing samples of the signal spectrum whose distance is to
be measured, and is the number of samples calculated for each frame. When S1 and S2
signals are extracted from a cardiac sound recorded from the same individual, the distances
with respect to the spectra are expected to yield lower values than those obtained when S1 and
S2 spectra extracted from sounds recorded from different individuals are used. Following a
series of recordings, the distributions of the distance variable with S1 recordings made from
both the same person and different individuals is determined.
Quantitative methods for PCG signal analysis
Matching pursuit method
Zhang et al. [18] developed a time-frequency scaling transformation based on the Matching
Pursuit (MP) method for the Phonocardiogram (PCG). The MP method decomposes a signal
into a series of time-frequency atoms by using an iterative process [18].
A. Time-scaling of PCG signals
The MP method represents a signal as a combination of an infinite number of time-frequency
atoms [17]. It can be written as
0
i i
i
x t a h t
(9)
with
i i i ih t g t u t (10)
and
cos 2
ii
i
i i
t pg t g
s
u t f t
(11)

INT. J. BIOAUTOMATION, 2015, 19(3), 351-376
363
where ai are the expansion coefficients. The parameters (si) (the scale factors) are used to
control the width of the waveform envelope, and (pi) are used to specify their temporal
location. The parameters βi are normalizing factors to keep the norm of hi(t) equal to one.
The purpose of time scaling the PCG is to change the rate of presentation while keeping the
perceptual quality of the original signal. For a uniform change in the time scale, the time t of
the original PCG is mapped into the transformed time scale t through the mapping
t t (12)
Zhang et al. [18] found that the time scale expansion is more useful than time scale
compression. Thus, γ is always larger than one. In the MP method, the temporal properties of
a time-frequency atom are related with the time-position (pi) and the scale (si) which are
modified for time-scaling of the PCG. For an input signal x(t), the reconstructed signal x′(t) by
the MP method for m time-frequency atoms is given by
1
0
cos(2 )m
ii i i
i i
t px t a g f t
s
(13)
For time scaling, the time-position and scale factors are modified to give
, i i i ip p s s (14)
The module, frequency and phase are not changed, so that the time-scaled version is
1
0
cos 2m
ii i i i
i i
t px t a g f t
s
(15)
B. Frequency-scaling of PCG signals
Frequency-scaling by the MP method is performed by scaling the frequency (f) of each
time-frequency atom of the signal by using
f f (16)
where is a scaling constant.
Thus, the frequency-scaled signal can be expressed as
1
0
cos 2m
ii i i i
i i
t px t a g f t
s
(17)
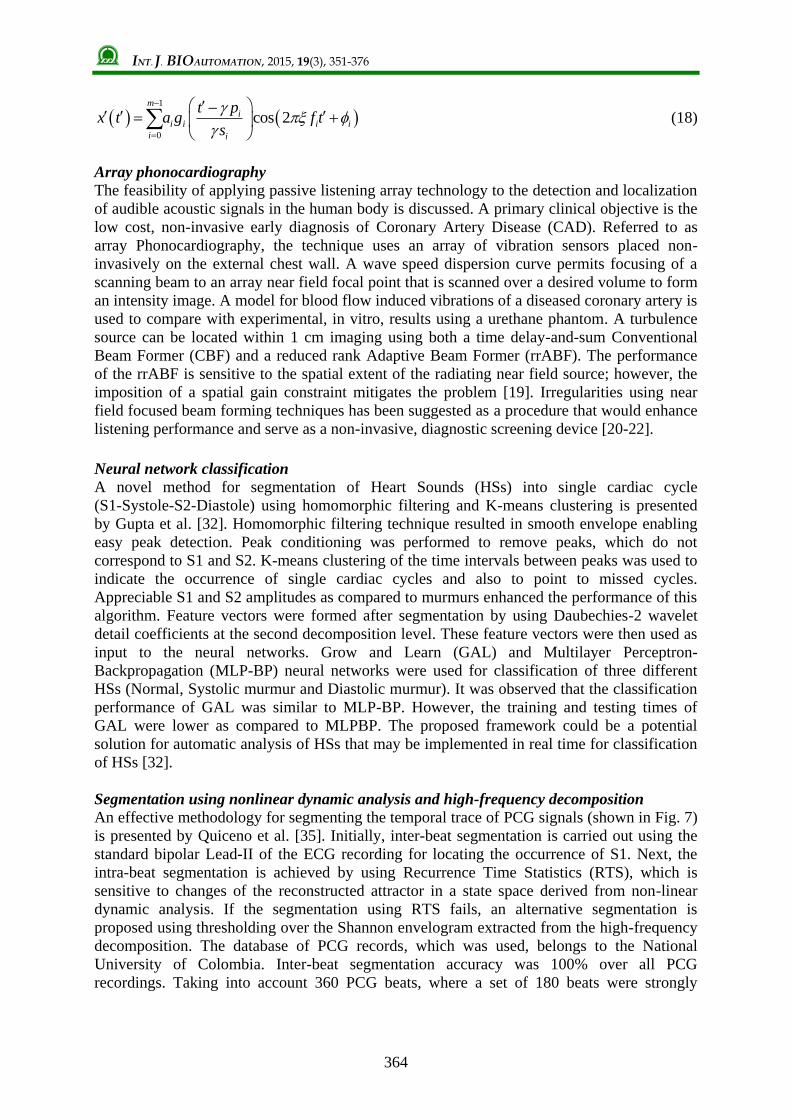
C. Joint time-frequency scaling of PCG signals
Sometimes a joint time-frequency scaling is desired for changing both the time and the
frequency properties of a signal. The transformation is the combination of the time scaling
and the frequency-scaling described above. Thus,
INT. J. BIOAUTOMATION, 2015, 19(3), 351-376
364
1
0
cos 2m
ii i i i
i i
t px t a g f t
s
(18)
Array phonocardiography
The feasibility of applying passive listening array technology to the detection and localization
of audible acoustic signals in the human body is discussed. A primary clinical objective is the
low cost, non-invasive early diagnosis of Coronary Artery Disease (CAD). Referred to as
array Phonocardiography, the technique uses an array of vibration sensors placed non-
invasively on the external chest wall. A wave speed dispersion curve permits focusing of a
scanning beam to an array near field focal point that is scanned over a desired volume to form
an intensity image. A model for blood flow induced vibrations of a diseased coronary artery is
used to compare with experimental, in vitro, results using a urethane phantom. A turbulence
source can be located within 1 cm imaging using both a time delay-and-sum Conventional
Beam Former (CBF) and a reduced rank Adaptive Beam Former (rrABF). The performance
of the rrABF is sensitive to the spatial extent of the radiating near field source; however, the
imposition of a spatial gain constraint mitigates the problem [19]. Irregularities using near
field focused beam forming techniques has been suggested as a procedure that would enhance
listening performance and serve as a non-invasive, diagnostic screening device [20-22].
Neural network classification
A novel method for segmentation of Heart Sounds (HSs) into single cardiac cycle
(S1-Systole-S2-Diastole) using homomorphic filtering and K-means clustering is presented
by Gupta et al. [32]. Homomorphic filtering technique resulted in smooth envelope enabling
easy peak detection. Peak conditioning was performed to remove peaks, which do not
correspond to S1 and S2. K-means clustering of the time intervals between peaks was used to
indicate the occurrence of single cardiac cycles and also to point to missed cycles.
Appreciable S1 and S2 amplitudes as compared to murmurs enhanced the performance of this
algorithm. Feature vectors were formed after segmentation by using Daubechies-2 wavelet
detail coefficients at the second decomposition level. These feature vectors were then used as
input to the neural networks. Grow and Learn (GAL) and Multilayer Perceptron-
Backpropagation (MLP-BP) neural networks were used for classification of three different
HSs (Normal, Systolic murmur and Diastolic murmur). It was observed that the classification
performance of GAL was similar to MLP-BP. However, the training and testing times of
GAL were lower as compared to MLPBP. The proposed framework could be a potential
solution for automatic analysis of HSs that may be implemented in real time for classification
of HSs [32].
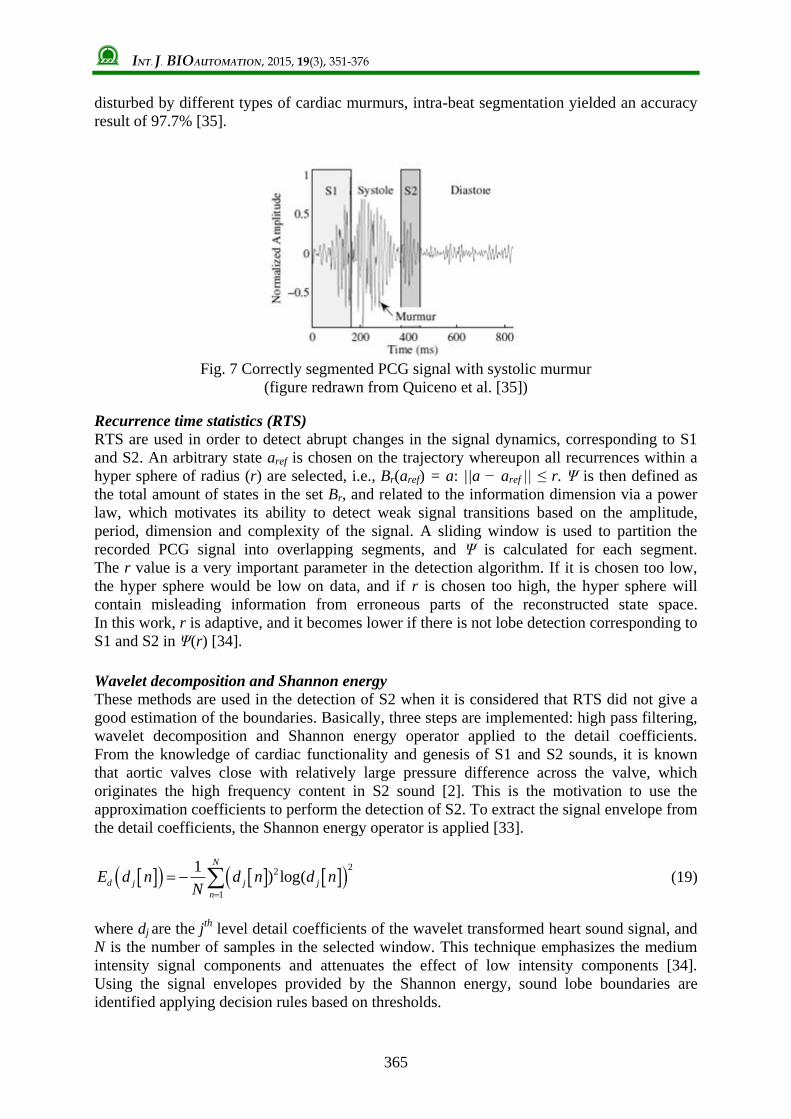
Segmentation using nonlinear dynamic analysis and high-frequency decomposition
An effective methodology for segmenting the temporal trace of PCG signals (shown in Fig. 7)
is presented by Quiceno et al. [35]. Initially, inter-beat segmentation is carried out using the
standard bipolar Lead-II of the ECG recording for locating the occurrence of S1. Next, the
intra-beat segmentation is achieved by using Recurrence Time Statistics (RTS), which is
sensitive to changes of the reconstructed attractor in a state space derived from non-linear
dynamic analysis. If the segmentation using RTS fails, an alternative segmentation is
proposed using thresholding over the Shannon envelogram extracted from the high-frequency
decomposition. The database of PCG records, which was used, belongs to the National
University of Colombia. Inter-beat segmentation accuracy was 100% over all PCG
recordings. Taking into account 360 PCG beats, where a set of 180 beats were strongly
INT. J. BIOAUTOMATION, 2015, 19(3), 351-376
365
disturbed by different types of cardiac murmurs, intra-beat segmentation yielded an accuracy
result of 97.7% [35].
Fig. 7 Correctly segmented PCG signal with systolic murmur
(figure redrawn from Quiceno et al. [35])
Recurrence time statistics (RTS)
RTS are used in order to detect abrupt changes in the signal dynamics, corresponding to S1
and S2. An arbitrary state aref is chosen on the trajectory whereupon all recurrences within a
hyper sphere of radius (r) are selected, i.e., Br(aref) = a: ||a − aref || ≤ r. Ψ is then defined as
the total amount of states in the set Br, and related to the information dimension via a power
law, which motivates its ability to detect weak signal transitions based on the amplitude,
period, dimension and complexity of the signal. A sliding window is used to partition the
recorded PCG signal into overlapping segments, and Ψ is calculated for each segment.
The r value is a very important parameter in the detection algorithm. If it is chosen too low,
the hyper sphere would be low on data, and if r is chosen too high, the hyper sphere will
contain misleading information from erroneous parts of the reconstructed state space.
In this work, r is adaptive, and it becomes lower if there is not lobe detection corresponding to
S1 and S2 in Ψ(r) [34].
Wavelet decomposition and Shannon energy
These methods are used in the detection of S2 when it is considered that RTS did not give a
good estimation of the boundaries. Basically, three steps are implemented: high pass filtering,
wavelet decomposition and Shannon energy operator applied to the detail coefficients.
From the knowledge of cardiac functionality and genesis of S1 and S2 sounds, it is known
that aortic valves close with relatively large pressure difference across the valve, which
originates the high frequency content in S2 sound [2]. This is the motivation to use the
approximation coefficients to perform the detection of S2. To extract the signal envelope from
the detail coefficients, the Shannon energy operator is applied [33].
2
2
1
1) log(
N
d j j j
n
E d n d n d nN
(19)
where dj are the jth
level detail coefficients of the wavelet transformed heart sound signal, and
N is the number of samples in the selected window. This technique emphasizes the medium
intensity signal components and attenuates the effect of low intensity components [34].
Using the signal envelopes provided by the Shannon energy, sound lobe boundaries are
identified applying decision rules based on thresholds.
INT. J. BIOAUTOMATION, 2015, 19(3), 351-376
366
Cluster analysis and classification
Amit et al. [39] describe a computational analysis framework for identifying distinct
morphologies of heart sounds and classifying them into physiological states. The analysis
framework is based on hierarchical clustering, compact data representation in the feature
space of cluster distances and a classification algorithm. Amit et al. [39] applied the proposed
framework on two heart sound datasets, acquired during controlled alternations of the
physiological conditions, and analyzed the morphological changes induced to S1, and the
ability to predict physiological variables from the morphology of S1. On the first dataset of
12 subjects, acquired while modulating the respiratory pressure, the algorithm achieved an
average accuracy of 827% in classifying the level of breathing resistance, and was able to
estimate the instantaneous breathing pressure with an average error of 196%. A strong
correlation of 0.92 was obtained between the estimated and the actual breathing efforts.
On the second dataset of 11 subjects, acquired during pharmacological stress tests, the
average accuracy in classifying the stress stage was 867%. The effects of the chosen raw
signal representation, distance metrics and classification algorithm on the performance were
studied on both real and simulated data. The results suggest that quantitative heart sound
analysis may provide a new non-invasive technique for continuous cardiac monitoring and
improved detection of mechanical dysfunctions caused by cardiovascular and
cardiopulmonary diseases.
The S1 can be represented in three different forms, i.e.,
1. Time-domain representation: Direct characterization of the signal as a time series of
sampled amplitude values.
2. Frequency-domain representation: Spectral characterization of the signal obtained by
applying fast Fourier transforms (FFT).
3. Time-frequency representation: Joint time-frequency characterization of the signal
obtained by applying one of the following transforms:
Short-time Fourier transform (STFT), defined by:
2, i ftS t f s t e d
(20)
S-transform (ST), defined by [43]:
2 2( ) /2 2,
2π
t f i ftfS t f s t e e d
(21)
Wigner-Ville Distribution (WVD), defined by [44];
* 2,2 2
i ftS t f s t s t e d
(22)
Choi-Williams Distribution (CWD), defined by [44];
2 22 ( ) /4 *
2,
4 2 2
i ft tS t f e e s s d d
(23)
INT. J. BIOAUTOMATION, 2015, 19(3), 351-376
367
Hierarchical clustering was applied to S1 signals, using each of the signal representations
described above. The purpose of clustering is to partition a dataset into disjoint subsets
(clusters), such that data elements within the same cluster share some sort of similarity.
Similarity between data elements is measured using a distance metric that is suitable for the
nature of the analyzed data. Two distance metrics were considered in this study:
1. Euclidean distance:
2 2 ( )ST t t t t
t
D s r s r (24)
where st and rt are signals of length n.
2. Cross-correlation:
2 2
1
( ) ( )
t ttST
t t
t t
s ś r ŕD
s ś r ŕ
(25)
where 1
1 n
t
t
ś sn
, 1
1 n
t
t
ŕ rn
.
Clustering was done using an agglomerative hierarchical clustering procedure that initially
partitions a set of n data elements into n clusters, each containing one data element, and then
iteratively merges the two most similar clusters, until the entire dataset forms a single cluster
[45]. The bottom of the created hierarchical tree can next be pruned so that the required
number of clusters N is obtained. Each cut of the data elements are assigned to a single
cluster, creating the output data partitioning to clusters {C1, …, CN}. The algorithm requires a
cluster similarity criterion for choosing the next two clusters to be merged. Authors in [46]
have used Ward’s step-wise optimal criterion, which chooses the clusters such that the
increase in the overall sum-of-squared error after the merge is minimal. The distance between
clusters Ci and Cj is defined by: , / w i j i j i j i jD C C n n n n m m , where ni, and nj are
the sizes of clusters, and mi, and mj are their means.
LMS based least square SVM classifier
Here, a technique to improve the performance of the Least Square Support Vector Machine
(LSSVM) is proposed for classification of normal and abnormal heart sounds using wavelet
based feature set. In the proposed technique, the Lagrange multiplier is modified based on
Least Mean Square (LMS) algorithm, which in turn modifies the weight vector to reduce the
classification error. The basic idea is to enlarge the separating boundary surface, such that the
separability between the clusters is increased. The updated weight vector is used at the time of
testing. The performance of the proposed systems is evaluated on 64 different recordings of
heart sounds comprising of normal and five different pathological cases. It is found that the
proposed technique classifies the heart sounds with higher recognition accuracy than
competing techniques [59].
INT. J. BIOAUTOMATION, 2015, 19(3), 351-376
368
Hilbert transfer
The key features of PCG are extracted based on the slopes of envelop of Hilbert Transfer after
relocating boundaries with energy envelope segmentation [69].
1 x
H x t dt
(26)
Z x x t H x t (27)
where H(x(t)) is the Hilbert transferred signal. The mode of Z(x) is the original envelope.
The overall accuracy of features extraction is found to be 91.95%. 25 significant clinical
features are introduced, and chosen to make two-kind classification by SVM. In the results of
two-kind classification, the overall accuracy is 91.3%, which is better than 85.23% accuracy
in 100 features of Shannon Energy Envelope. The result shows that features including clinical
signification is of signification for enhancing the accurate rate of PCG classification [70].
Wavelet packet entropy
Wavelet transform is a powerful technique in analyzing nonstationary signals such as PCG
signals [77]. The main advantage of wavelet transform is its varying window size that is
narrow for high frequencies and wide for low frequencies. Therefore, wavelet transform is
much more powerful than the other time frequency analysis techniques such as Discrete
Fourier Transform (DFT) and Short-Term Fourier Transform (STFT), not only for providing
useful time and frequency information, but also for its adaptive time and frequency resolution
[78].
A. Wavelet packet transform (WPT)
WPT is an extension of Discrete Wavelet Transform (DWT) whereby all nodes in the tree
structure are allowed to split further at each level of decomposition. With WPT, both the
approximation and detail coefficients are decomposed into approximation and detail
components. In comparison to DWT, WPT decomposes only the approximation coefficients
of the signal (as shown in Fig. 8). Therefore, features can be generated based on
approximation and detail coefficients at different levels to obtain more information.
The WPT of a signal x(t) is defined as follows:
, /22 2 , 0 2 1n j j j s
p n
R
x x t t p dt n (28)
where n is the channel number, j is the number of decomposition level, or scale parameter,
p is the position parameter, ψn(t) is the mother wavelet, and S is the maximum decomposition
level. After decomposing signal x(t) by WPT, 2S sequences can be produced in the S
th level.
The fast decomposition equation for this kind of WPT is
2 , 1 , 2 n j n j
k p
p Z
x h p k x
2 1, 1 ,2n j n j
k p
p Z
x g p k x
(29)

INT. J. BIOAUTOMATION, 2015, 19(3), 351-376
369
where h(i) and g(i) are wavelet quadrature mirror filter coefficients.
Fig. 8 Wavelet packet tree with corresponding high-pass and low-pass filters
(a = approximation coefficients, d = detail coefficients).
The shaded nodes indicate the node not to be produced by DWT.
Three levels of the wavelet packet decomposition with the high-pass and low-pass filters were
illustrated in Fig. 8. This structure can be continued further to decompose the following
approximations and details to reach to a proper level for representing PCG signals of desired
murmurs. From the literature, it can be concluded that levels 6 to 8 were generally chosen for
analyzing PCG signals of different pathological heart sounds [79-83].
B. Entropy
Different types of entropy such as log, norm, Shannon, sure, and threshold can be used to
characterize the heart sounds. However, for this study the entropy introduced by Vitulano and
Casanova [84] for analyzing 1D signals was utilized. They have transformed the
2D mammographic signal into 1D signal through linear transformation and then applied the
entropy on the 1D signal to generate features for differentiating mammograms with different
pathologies. They did not utilize any signal processing technique to analyze the signal prior to
extract entropy features from the signal. In the current study, the PCG signals were first
analyzed with WPT and then entropy features were generated from the wavelet packet
coefficients. Vitulano and Casanova [84] defined the signal “crest” as the part embraced
between lines parallel to the abscissas axis, in which the ordinates are m and M, m is the
absolute minimum and M is the absolute maximum of the signal. Therefore, the signal crest
included all the points x(t) X(t), so that
m x t M (30)
and crest energy is defined as
, ,M
c i
i m
E x i m M
(31)
Signal entropy can be defined based on Ec as
1 , 0, 1cE ES S
E
(32)
INT. J. BIOAUTOMATION, 2015, 19(3), 351-376
370
where E is signal energy, Ec is crest energy, and S is signal entropy. Signal entropy S is
defined based on one-dimensional signals and it has a potential to be applied on the other
dimensional signals such as PCG signals.
Safara et al. [85] employed wavelet packet transform for heart sound analysis, and the entropy
was calculated for deriving feature vectors. Five types of classification were performed to
evaluate the discriminatory power of the generated features. The best results were achieved by
BayesNet with 96.94% accuracy.
Conclusion The PCG signal confirms, and mostly, refines the auscultation data and provides further
information about the acoustic activity concerning the chronology of the pathological signs in
the cardiac cycle, by locating them with respect to the normal heart sounds. Heart murmurs
are the first signs of cardiac valve disorders. Several studies have been conducted in recent
years to automatically differentiate normal heart sounds from heart sounds with murmurs
using various types of audio features. The heart sound categories would be expanded to
include different murmurs. Few methods are discussed for feasible way to enhance the
accurate rate of Phonocardiogram classification. This review also suggests quantitative heart
sound analysis may provide a new non-invasive technique for continuous cardiac monitoring
and improved detection of mechanical dysfunctions caused by cardiovascular and
cardiopulmonary diseases. The first part of this review represents the significance of PCG
signal and the second part demonstrates the different methodology involved for detection,
classification and analysis of PCG signal.
References 1. Goldberger A. L. (1992). Fractal Mechanisms in the Electrophysiology of the Heart,
IEEE Eng Med Biol Mag, 26, 47-52.
2. Leatham A. (1975). Auscultation of the Heart and Phonocardiography, Churchill
Livingstone, New York.
3. Vepa J. (2009). Classification of Heart Murmurs Using Cepstral Features and Support
Vector Machines, In Engineering in Medicine and Biology Society, Annual International
Conference of the IEEE, 2539-2542.
4. Zhang Y-T., G. Chan, X-Y. Zhang, L. Yip (2006). Heart Sounds and Stethoscopes,
In: Wiley Encyclopedia of Biomedical Engineering, Akay M. (Ed.), Wiley-Interscience,
Wiley and Sons, Hoboken, N.J., 1824-1834.
5. Tilkian A. G., M. B. Conover (2001). Understanding Heart Sounds and Murmurs: with an
Introduction to Lung Sounds, Saunders, Philadelphia, 4th Edition.
6. Kingsley B. (1972). Acoustic Evaluation of Prosthetic Cardiac Valve in the Audio
Spectrum, Journal of Audio Engineering Society, 20(9), 750-755.
7. Geckeler G. D., W. Likoff, D. Mason, R. R. Riesz, C. H. Wirth (1954).
Cardiospectrograms: A Preliminary Report, Amer Heart J, 48, 189-196.
8. McKusic V. A., S. A. Talbot, G. N. Weeb (1954). Spectral Phonocardiography: Problems
and Prospects in the Application of the Bell Sound Spectrograph to Phonocardiography,
Bull Johns Hopkins Hosp, 94, 187-198.
9. Hylen J. C., F. E. Kloster, R. H. Herr, A. Starr, H. E. Griswold (1969). Sound
Spectrographic Diagnosis of Ball Variance, Circulation, XXXIX, 849-858.
10. Aigner V. A., G. Muller, E. Knapp, E. Raas (1973). Schallspektrographische
Untersuchungen an Starr-Edwards-Aortenkl appenprotesen, Z Cardiol, 62, 1105-1113.
(in German)
INT. J. BIOAUTOMATION, 2015, 19(3), 351-376
371
11. Aigner V. A. (1977). Kontursonagraphische Analysen von Herzschall-Phgnomenen und
Tbnen verschiedener Klappenprothesen Fortschr, Med, 95, 2162-2166. (in German)
12. Kagawa Y., S. Nitta, S. Naoshi, S. Komei, Y. Shibota, T. Horiuchi, T. Motonao (1977).
Sound Spectroanalytic Diagnosis of Malfunctioning Prosthetic Heart Valve, Tohoku J
Exp Med, 123, 77-89.
13. Cooley J. W., J. W. Tukey (1965). An Algorithm for Machine Calculation of Complex
Fourier Series, Math Computation, 19, 297-301.
14. Rabiner L. R., R. W Schafer (1978). Digital Processing of Speech Signals, Chapter 6,
Prentice-Hall, Englewood Cliffs, N.J., 250-354.
15. Durand L.-G., J. de Guise, R. Guardo (1980). FFT Techniques for the Spectral Analysis
of Prosthetic Heart Valve Sounds, Proc Annu Symp Comput Appl Med Care, 2,
1105-1111.
16. Nagel J. (1986). New Diagnostic and Technical Aspects of Fetal Phonocardiography,
European Journal of Obstetrics & Gynecology and Reproductive Biology, 23(5-6),
295-303.
17. Mallat S. G., Z. Zhang (1993). Matching Pursuits with Time-frequency Dictionaries,
IEEE Trans Signal Processing, 41, 3397-3415.
18. Zhang X., L.-G. Durand, L. Senhadji, H. C. Lee, J.-L. Coatrieux (1998). Time-frequency
Scaling Transformation of the Phonocardiogram Based of the Matching Pursuit Method,
IEEE Transactions on Biomedical Engineering, 45(8), 972-979.
19. Owsley N. L. (2000). Array Phonocardiography, The IEEE 2000 Adaptive Systems for
Signal Processing, Communications, and Control Symposium, AS-SPCC, 31-36.
20. Austin A., A. Hull, N. Owsley, M. Peloquin (1997). Device and Method for Locating
Flow Blockage in a Three-dimensional Object, United States Patent 5,617,869,
Filed: 16 June 1995, Issued: 8.
21. Owsley N. L. (1998). Method and Apparatus for Noninvasive Detection and Analysis of
Turbulent Flow in a Patient's Blood Vessels, United States Patent 5,727,561,
Filed: 23 April 1996, Issued: I7.
22. Qwsley N. L., A. Hull (1998). Beam Formed Near Field Imaging of a Simulated
Coronary Artery Containing a Stenosis, IEEE Trans on Medical Imaging, 37(6), 900-909.
23. Rice M. L., D. J. Doyle (1995). Comparison of Phonocardiographic Monitoring Location,
IEEE 17th Annual Conference Engineering in Medicine and Biology Society, 1, 685-686.
24. Hansen P. B., A. A. Luisada, D. J. Miletich (1989). Phonocardiography as a Monitor of
Cardiac Performance during Anesthesia, Anesth Anulg, 68, 385-387.
25. Durand L. G., Y. E. Langlois, T. Lanthier (1990). Spectral Analysis and Acoustic
Transmission of Mitral and Aortic Valve Closure Sounds in Dogs, Part 4: Effects of
Modulating Cardiac Inotropy, Med Biol Eng Comput, 28, 439-445.
26. Luisada A. A., A. Singhal, F. Portaluppi, C. Strozzi (1985). Noninvasive Index of Cardiac
Contractility during Stress Testing: A Collaborative Study, Clin Cardiol, 8(7), 375-384.
27. Luisada A. A., A. Singhal, V. Knigten (1986). New Index of Cardiac Contractility during
Stress Testing with Treadmill, Acta Curdiol, 41(1), 31-39.
28. Luisada A. A., A. Singhal, F. Portaluppi (1985). Assessment of Left Ventricular Function
by Noninvasive Methods, Adv Curdiol, 32, 111-141.
29. Xiao S., Sh. Cai, G. Liu (2000). Studying the Significance of Cardiac Contractility
Variability Analyzing the Influence of Respiration, Exercise, and Psychological Activity
Using Heart-sound Analysis, IEEE Engineering in Medicine and Biology Magazine,
19(3), 102-105.
30. Jain A. K., A. Ross, S. Prabhakar (2004). An Introduction to Biometric Recognition,
IEEE Trans Circuits Syst Video Technol, Special Issue Image- and Video-based Biomet,
14(1), 4-20.

INT. J. BIOAUTOMATION, 2015, 19(3), 351-376
372
31. Beritelli F., S. Serrano (2007). Biometric Identification Based on Frequency Analysis of
Cardiac Sounds, IEEE Transactions on Information Forensics and Security, 2(3),
596-604.
32. Gupta C. N., R. Palaniappan, S. Swaminathan, S. M. Krishnan (2007). Neural Network
Classification of Homomorphic Segmented Heart Sounds, Applied Soft Computing, 7,
286-297.
33. El-Segaier M., O. Lilja, S. Lukkarinen, L. Srnmo, R. Sepponen, E. Pesonen (2005).
Computer-based Detection and Analysis of Heart Sound and Murmur, Ann Biomed Eng,
33(7), 937-942.
34. Ahlstrom C., O. Liljefeldt, P. Hult, P. Ask (2005). Heart Sound Cancellation from Lung
Sound Recordings Using Recurrence Time Statistics and Nonlinear Prediction, IEEE
Signal Processing Letters, 12(12), 812-815.
35. Quiceno A. F., E. Delgado, M. Vallverd, A. M. Matijasevic, G. Castellanos-Domnguez
(2008). Effective Phonocardiogram Segmentation Using Nonlinear Dynamic Analysis
and High-frequency Decomposition, Computers in Cardiology, 35, 161-164.
36. Tavel M. E. (1978). Clinical Phonocardiography & External Pulse Recording, Third ed.,
Year Book Medical Publishers Inc., Chicago.
37. Sakamoto T. (1965). Hemodynamic Determinants of the Amplitude of the First Heart
Sound, Circ Res, 16, 45-57.
38. Clarke W. B., S. M. Austin, M. S. Pravib, P. M. Griffen, J. T. Dove, J. McCullough,
B. F. Schreiner (1978). Spectral Energy of the First Heart Sound in Acute Myocardial
Ischemia, Circulation, 57, 593-598.
39. Amit G., N. Gavriely, N. Intrator (2009). Cluster Analysis and Classification of Heart
Sounds, Biomedical Signal Processing and Control, 4, 26-36.
40. Durand L. G., M. Blanchard, G. Cloutier, H. N. Sabbah (1990). Comparison of Pattern
Recognition Methods for Computer Assisted Classification of Spectra of Heart Sounds in
Patients with a Porcine Bioprosthetic Valve Implanted in the Mitral Position, IEEE Trans
Biomed Eng, 37(12), 1121-1129.
41. Guo Z., L. G. Durand, H. C. Lee, L. Allard, M. C. Grenier, P. D. Stein (1994). Artificial
Neural Networks in Computer-assisted Classification of Heart Sounds in Patients with
Porcine Bioprosthetic Valves, Med Biol Eng Comput, 32(3), 311-316.
42. Bentley P. M., P. M. Grant, J. T. McDonnell (1998). Time-frequency and Time-scale
Techniques for the Classification of Native and Bioprosthetic Heart Valve Sounds, IEEE
Trans Biomed Eng, 45(1), 125-128.
43. Stockwell R. G., L. Mansinha, R. P. Lowe (1996). Localization of the Complex
Spectrum: The S-transform, IEEE Trans Signal Process, 44(4), 998-1001.
44. Cohen L. (1989). Time-frequency Distributions – A review, Proceedings of the IEEE,
77(7), 941-981.
45. Johnson S. C. (1967). Hierarchical Clustering Schemes, Psychometrika, 2, 241-254.
46. Ward J. H. (1963). Hierarchical Grouping to Optimize an Objective Function, J Am Stat
Assoc, 58(301), 236-244.
47. Hanna I. R., M. E. Silverman (2002). A History of Cardiac Auscultation and Some of its
Contributors, The American Journal of Cardiology, 90, 259-267.
48. Bender J. R. (1992). Yale University School of Medicine Heart Book, New York:
William Morrow and Company, Inc., 167-175.
49. Tavel M. E. (1996). Cardiac Auscultation: A Glorious Past-but does it Have a Future?
Circulation, 93, 1250-1253.
50. Shub C. (2003). Echocardiography or Auscultation? How to Evaluate Systolic Murmurs?
Canadian Family Physician, 49, 163-167.

INT. J. BIOAUTOMATION, 2015, 19(3), 351-376
373
51. Chizner M. A. (2008). Cardiac Auscultation: Rediscovering the Lost Art, Current
Problems in Cardiology, 33, 326-408.
52. Cromwell L., F. J. Weibell, E. A. Pfeiffer (2002). Biomedical Instrumentation and
Measurements, 2nd Ed., PHI Publication, 169-172.
53. Rangayyan R. M. (2002). Biomedical Signal Analysis, IEEE Press, John Wiley & Sons
Inc, 34-38.
54. Cathers I. (1995). Neural Network Assisted Cardiac Auscultation, Artificial Intelligence
in Medicine, 7, 53-66.
55. Ölmez T., Z. Dokur (2003). Classification of Heart Sounds Using an Artificial Neural
Network, Pattern Recognition Letters, 24, 617-629.
56. Reed T. R., N. E. Reed, P. Fritzson (2004). Heart Sound Analysis for Symptom Detection
and Computer-aided Diagnosis, Simulation Modeling Practice and Theory, 12, 129-146.
57. Ari S., G. Saha (2007). On a Robust Algorithm for Heart Sound Segmentation, Journal of
Mechanics in Medicine and Biology, 7(2), 129-150.
58. Choi S. (2008). Detection of Valvular Heart Disorders Using Wavelet Packet
Decomposition and Support Vector Machine, Expert Systems with Application, 35,
1679-1687.
59. Ari S., K. Hembram, G. Saha (2010) Detection of Cardiac Abnormality from PCG Signal
Using LMS Based Least Square SVM Classifier, Expert Systems with Applications, 37,
8019-8026.
60. Xu J., L. Durand, P. Pibarot (2000). Nonlinear Transient Chirp Signal Modeling of the
Aortic and Pulmonary Components of the Second Heart Sound, IEEE Trans Biomed Eng,
47(7), 1328-1335.
61. Xu J., L. Durand, P. Pibarot (2001). Extraction of the Aortic and Pulmonary Components
of the Second Heart Sound Using a Nonlinear Transient Chirp Signal Model, IEEE Trans
Biomed Eng, 48(3), 277-283.
62. Baykal A., Y. Z. Ider, H. Koymen (1995) Distribution of Aortic Mechanical Prosthetic
Valve Closure Sound Model Parameters on the Surface of the Chest, IEEE Trans Biomed
Eng, 42(4), 358-370.
63. Koymen H., B. K. Altay, Y. Z. Ider (1987). A Study of Prosthetic Heart Valve Sounds,
IEEE Trans Biomed Eng, 34(11), 853-863.
64. Sava H. P., J. T. E. McDonnell (1995). Modified Forward-backward Over Determined
Prony’s Method and its Application in Modeling Heart Sounds, IEEE Proceedings –
Vision, Image and Signal Processing, 142(6), 375-380.
65. Leung T. S., P. R. White, W. B. Cook (1998). Analysis of the Second Heart Sound for
Diagnosis of Paediatric Heart Disease, IEEE Proc. – Sci Meas Technol, 145(6), 285-290.
66. Maneejiraprakarn N., P. Panpho, D. Boonthong, P. Thitiwuthikiat, J. Koseeyaporn,
P. Wardkein (2006). Low Cost Non-invasive Instrument for Heart Disease and Peripheral
Vascular Disease Detection, Biomedical Circuits and Systems Conference, IEEE
Biomedical Circuits and Systems Conference, 49-52.
67. Debbal S. M., F. Bereksi-Reguig (2008). Computerized Heart Sounds Analysis,
Computers in Biology and Medicine, 38, 263-280.
68. Debbal S. M., F. Bereksi-Reguig (2007). Automatic Measure of the Split in the Second
Cardiac Sound by Using the Wavelet Transform Technique, Computers in Biology and
Medicine, 37, 269-276.
69. Tu Z., G. Cao, Q. Li, X. Zhang, J. Shi (2010). Improved Methods for Detecting Main
Components of Heart Sounds, Sixth International Conference on Natural Computation, 7,
3585-3588.

INT. J. BIOAUTOMATION, 2015, 19(3), 351-376
374
70. Hu X.-J., G.-T. Cao, H.-H. Zhu, H. Li (2011). Feature Extraction and Choice in PCG
Based on Hilbert Transfer, 4th International Congress on Image and Signal Processing,
IEEE, 4, 2159-2163.
71. Rangayyan R. M., R. J. Lehner (1988). Phonocardiogram Signal Analysis: A Review,
CRC Critical Reviews in Biomedical Engineering, 15(3), 211-236.
72. Durand L. G., M. Blanchard, G. Cloutier, H. N. Sabbah, P. D. Stein (1990). Comparison
of Pattern Recognition Methods for Computer-assisted Classification of Spectra of Heart
Sounds in Patients with a Porcine Bioprosthetic Valve Implanted in the Mitral Position,
IEEE Trans Biomed Eng, 37(12), 1121-1129.
73. Durand L. G., M. Blanchard, H. N. Sabbah, P. D. Stein (1991). Comparison of Spectral
Techniques for Computer Assisted Classification of Spectra of Heart Sounds in Patients
with a Porcine Bioprosthetic Valves, Med Biol Eng Comput, 31(3), 229-236.
74. Durand L. G., P. Pibarot (1995). Digital Signal Processing of the Honocardiogram:
Review of the Most Recent Advancements, Critical Reviews in Biomedical Engineering,
23(3/4), 163-219.
75. Sarbandi R. R., D. D. Doyle, M. Navidbakhsh, K. Hassani, H. Torabiyan (2011). Color
Spectrographic Phonocardiography (CSP) Applied to the Detection and Characterization
of Heart Murmurs: Preliminary Results, BioMedical Engineering OnLine, 10:42,
doi: 10.1186/1475-925X-10-42.
76. Akbari M. A., K. Hassani, J. D. Doyle, M. Navidbakhsh, M. Sangargir, K. Bajelani,
Z. S. Ahmadi (2011). Digital Subtraction Phonocardiography (DSP) Applied to the
Detection and Characterization of Heart Murmurs, BioMedical Engineering OnLine,
10:109, doi: 10.1186/1475-925X-10-109.
77. Ergen B., Y. Tatar, H. O. Gulcur (2011). Time-frequency Analysis of Phonocardiogram
Signals Using Wavelet Transform: A Comparative Study, Computer Methods in
Biomechanics and Biomedical Engineering, 15, 371-381.
78. Chen Y., S. Wang, C.-H. Shen, F. K. Choy (2012). Matrix Decomposition Based Feature
Extraction for Murmur Classification, Medical Engineering & Physics, 34(6), 756-761.
79. Choi S., Y. Shin, H. K. Park (2011). Selection of Wavelet Packet Measures for
Insufficiency Murmur Identification, Expert Systems with Applications, 38(4),
4264-4271.
80. Ahlstrom C., P. Hult, P. Rask (2006). Feature Extraction for Systolic Heart Murmur
Classification, Annals of Biomedical Engineering, 34(11), 1666-1677.
81. Choi S. (2008). Detection of Valvular Heart Disorders Using Wavelet Packet
Decomposition and Support Vector Machine, Expert Systems with Applications, 35(4),
1679-1687.
82. Debbal S. M., F. Bereksi-Reguig (2007). Time-frequency Analysis of the First and the
Second Heartbeat Sounds, Applied Mathematics and Computation, 184(2), 1041-1052.
83. Homaeinezhad M. R., S. A. Atyabi, E. Deneshvar, A. Ghaffari, M. Tahmasebi (2011).
Optimal Delineation of PCG Sounds via False-alarm Bounded Segmentation of a
Wavelet-based Principal Components Analyzed Metric, International Journal for
Numerical Methods in Biomedical Engineering, 27, 1711-1739.
84. Vitulano S., A. Casanova (2008). The Role of Entropy: Mammogram Analysis, Image
Analysis and Recognition, 5112, 863-872.
85. Safara F., S. Doraisamy, A. Azman, A. Jantan, S. Ranga (2012). Wavelet Packet Entropy
for Heart Murmurs Classification, Advances in Bioinformatics, Volume 2012, Article ID
327269.
86. Moukadem A., A. Dieterlen, C. Brandt (2012). Phonocardiogram Signal Processing
Module for Auto-diagnosis and Telemedicine Applications, eHealth and Remote
Monitoring, El Hassani A. H. (Ed.), InTech, doi: 10.5772/48447.
INT. J. BIOAUTOMATION, 2015, 19(3), 351-376
375
87. Sa-Ngasoongsong A., J. Kunthong, V. Sarangan, X. Cai, S. T. S. Bukkapatnam (2012).
A Low-cost, Portable, High-throughput Wireless Sensor System for Phonocardiography
Applications Sensors, 12, 10851-10870, doi: 10.3390/s120810851.
88. Hult P., T. Fjällbrant, B. Wranne, P. Ask (2004). Detection of the Third Heart Sound
Using a Tailored Wavelet Approach, Med Biol Eng Comput, 42(2), 253-258.
89. Wiggers C. J. (1919). Factors Determining the Relative Intensity of the Heart Sounds in
Different Auscultation Areasan Experimental Study, Arch Intern Med, 24(5), 471-488.
90. Dock W. (1933). Mode of Production of the First Heart Sound, Arch Intern Med, 51(5),
737-746.
91. Dean A. L (1916). The Movements of the Mitral Cusps in Relation to the Cardiac Cycle,
Amer J Physiol, 40, 206-217.
92. Wolfenh C. C., A. Margolies (1945). Heart Sounds, In: Diagnosis and Treatment of
Cardiovascular Disease, Stroud W. D. (Ed.), 3rd Ed., Philadelphia, F. A. Davis.
Assist. Prof. Akash Kumar Bhoi, M.Tech
E-mail: [email protected]
Akash Kumar Bhoi has completed his B.Tech. (Biomedical
Engineering) from the TAT, Bhubaneswar and M.Tech. (Biomedical
Instrumentation) from Karunya University, Coimbatore in the year
2009 and 2011 respectively. He is pursuing Ph.D. from Sikkim
Manipal University, India. He is working as an Assistant Professor in
the Department of Applied Electronics and Instrumentation at Sikkim
Manipal Institute of Technology (SMIT), India since 2012. He is a
member of ISEIS and IAENG, an Associate member of UACEE and
Editorial Board member of IJAEEE, IJAEEE, ITSI-TEEE, IJECCE
and IJCTT and a reviewer of IJET, IJCT, IJBSE, IJMI, AJBLS.
His areas of research are biomedical signal processing, medical
image processing, sensor and transducer and medical
instrumentation. He has published papers in national and
international journals and conferences. He has also published 3 book
chapters. He has participated in workshops, seminars and
conferences.

INT. J. BIOAUTOMATION, 2015, 19(3), 351-376
376
Prof. Karma Sonam Sherpa, Ph.D.
E-mail: [email protected]
Karma Sonam Sherpa has completed his B.E. (Electrical
Engineering) from the MREC, Jaipur, and M.Tech. (Power
Electronics and Machine Drives) from IIT, Kharagpur in the year
1996 and 2003 respectively. He has a Ph.D. from Sikkim Manipal
University. He has been serving SMIT, Sikkim for the last sixteen
years. Presently, he is a Professor in the Department of Electrical
and Electronics Engineering and officiating head of the
Department of Electrical and Electronics Engineering and
Department of Applied Electronics and Instrumentation
Engineering. He is a life member of ISTE, IEI and System Society
of India. His areas of interests are electric power distribution
system, power electronics and electrical drives. He has published
papers in national and international journals and conferences.
He has organized workshops, seminars and conferences.
Prof. Dr. Bidita Khandelwal, MD.
E-mail: [email protected]
Dr. Bidita Khandelwal did her MD Medicine in 1998 from Assam
University. She joined Sikkim Manipal Institute of Medical Sciences
in 2000 as an Assistant Professor in Department of Medicine and
since 2009 heads the Department. Since 2015 Dr. Bidita Khandelwal
is a Professor. She is a life member of API, IMA, IACM and RSSDI.
Other posts held are Chairperson of complaint committee on Sexual
Harassment at work place, Chairperson of IEC, Ayurveda Regional
Research Institute, Vice chairman API East Zone, Editorial Board
member of IJEM, a Member of Academic Senate of SMU, a Member
of Sikkim Medical Council, Coordinator post graduate studies and an
External expert for Board of Study. She is a Member of Research
Protocol Evaluation Committee, Publication Evaluation committee,
Institutional Ethics Committee, Hospital Management Committee,
Infection Control Committee, Promotion Committee, State Task
Force, Pharmacovigilance Committee. She has special interest in
diabetes mellitus and has several publications related to it.


![A Novel Grouping Aggregation Algorithm for Online Analytical Processing · Online Analytical Processing (OLAP) is a model of multidimensional data analysis [1]. It is a critical application](https://img.dokumen.tips/doc/110x75/612863cc5697b86e54462b6b/a-novel-grouping-aggregation-algorithm-for-online-analytical-processing-online-analytical.jpg)