Embed Size (px)
Citation preview

Resource
Multicolor Electron Microscopy for Simultaneous
Visualization of Multiple Molecular SpeciesGraphical Abstract
Highlights
d Multicolor EM paints multiple cellular markers by locally
depositing specific Ln3+
d Each Ln3+ visualized by electron energy-loss spectroscopy
and energy-filtered EM
d Elemental maps overlaid on conventional EM give
multicolor EM
d Applicable to immuno, genetically encoded and molecular
probes in cells and tissue
Adams et al., 2016, Cell Chemical Biology 23, 1417–1427November 17, 2016 ª 2016 Elsevier Ltd.http://dx.doi.org/10.1016/j.chembiol.2016.10.006
Authors
Stephen R. Adams, Mason R. Mackey,
Ranjan Ramachandra, ...,
Ben N.G. Giepmans, Mark H. Ellisman,
Roger Y. Tsien
In Brief
Multicolor electron microscopy (EM) is
introduced by Adams et al. for imaging
multiple, specific cellular components by
locally depositing lanthanides and using
electron energy-loss spectroscopy and
energy-filtered EM. Analogous to
multicolor fluorescence this method
offers full spatial resolution of EM.
Please cite this article as: Adams et al., Multicolor Electron Microscopy for Simultaneous Visualization of Multiple Molecular Species, Cell ChemicalBiology (2016), http://dx.doi.org/10.1016/j.chembiol.2016.10.006
Cell Chemical Biology
Resource
Multicolor Electron Microscopy for SimultaneousVisualization of Multiple Molecular SpeciesStephen R. Adams,1,9,* Mason R. Mackey,2 Ranjan Ramachandra,2 Sakina F. Palida Lemieux,1 Paul Steinbach,3
Eric A. Bushong,2 Margaret T. Butko,1,6 Ben N.G. Giepmans,2,7 Mark H. Ellisman,2,4 and Roger Y. Tsien1,3,5,81Department of Pharmacology2National Center for Microscopy and Imaging Research3Howard Hughes Medical Institute4Department of Neurosciences5Department of Chemistry & Biochemistry
University of California, San Diego, La Jolla, CA 92093, USA6Present address: Biodesy Inc, 384 Oyster Point Boulevard Suite #8, South San Francisco, CA 94080, USA7Present address: Department of Cell Biology, University Medical Center Groningen, A. Deusinglaan 1, 9713 AV Groningen, the Netherlands8Deceased August 24, 20169Lead Contact*Correspondence: [email protected]
http://dx.doi.org/10.1016/j.chembiol.2016.10.006
SUMMARY
Electron microscopy (EM) remains the primarymethod for imaging cellular and tissue ultrastructure,althoughsimultaneous localizationofmultiplespecificmolecules continues tobeachallenge for EM.Wepre-sent a method for obtaining multicolor EM views ofmultiple subcellular components. The method usessequential, localized deposition of different lantha-nides by photosensitizers, small-molecule probes, orperoxidases. Detailed view of biological structures iscreated by overlaying conventional electron micro-graphs with pseudocolor lanthanide elemental mapsderived from distinctive electron energy-loss spectraof each lanthanide deposit via energy-filtered trans-mission electron microscopy. This results in multi-color EM images analogous to multicolor fluores-cence but with the benefit of the full spatialresolution of EM.We illustrate the power of this meth-odology by visualizing hippocampal astrocytes toshow that processes from two astrocytes can sharea single synapse. We also show that polyarginine-based cell-penetrating peptides enter the cell viaendocytosis, and that newly synthesized PKMz incultured neurons preferentially localize to the post-synaptic membrane.
INTRODUCTION
Electron microscopy (EM) of biological samples remains the
ultimate method for imaging cellular ultrastructure despite
the recent advances in super-resolution microscopy (Betzig
et al., 2006; Hell, 2007; Huang et al., 2009). Contrast in stan-
dard EM of epoxy-embedded samples is dependent upon
the deposition of heavy metals such as osmium, uranium, or
lead to highlight cellular components including protein, lipid,
Cell Chemical Biol
or nucleic acid using long-established and poorly selective
stains. Selective visualization of specific proteins or macromol-
ecules can be achieved using antibodies conjugated to gold
particles or quantum dots of distinctive size, but poor penetra-
bility of such labels in fixed cells or tissues limits the use of
optimal fixation methods that preserve ultrastructure (Schnell
et al., 2012). This limitation can be avoided by the in situ oxida-
tion of diaminobenzidine (DAB) generating a localized osmio-
philic precipitate by photosensitizing dyes conjugated to anti-
bodies or ligands (Deerinck et al., 1994; Maranto, 1982),
genetically targeted biarsenicals (Gaietta et al., 2002) and
genetically encoded chimeras of miniSOG (Shu et al., 2011).
Peroxidases (such as horseradish peroxidase, HRP) also
generate similar precipitates from DAB on treatment with
hydrogen peroxide (H2O2) and robust genetically encoded ver-
sions have been developed recently (Kuipers et al., 2015; Lam
et al., 2015; Martell et al., 2012). The high penetrability of small
dyes, DAB, and oxygen or H2O2 into optimally fixed cells or
tissues enables specific labeling with preservation of cellular
ultrastructure. The target protein becomes negatively stained
by the surrounding oxidized DAB precipitate, which may not
be readily distinguishable from heavy staining from endoge-
nous cellular structures such as membranes and the postsyn-
aptic density.
In this work, we demonstrate a method (Figure 1A) that can
differentiate the DAB precipitate from the general staining of
endogenous cellular material and permits identification and im-
aging of successively deposited DAB, each at a targeted or
specified protein or cellular target. By precipitating DAB conju-
gated to lanthanide chelates rather than DAB itself, a specific
metal such as Ce3+ is locally deposited. After washing out the
unreacted DAB-chelator-Ln, a further round of deposition of
DAB-chelator bound to another lanthanide ion such as Pr3+ is
carried out by photooxidation of a second photosensitizer tar-
geted to another cellular site or protein, at wavelengths that do
not excite the first fluorophore. Alternatively, peroxidases can
be used to generate the second precipitate. Following con-
ventional postfixation staining with osmium tetroxide and elec-
tron microscopy of sections from embedded samples, the two
ogy 23, 1417–1427, November 17, 2016 ª 2016 Elsevier Ltd. 1417
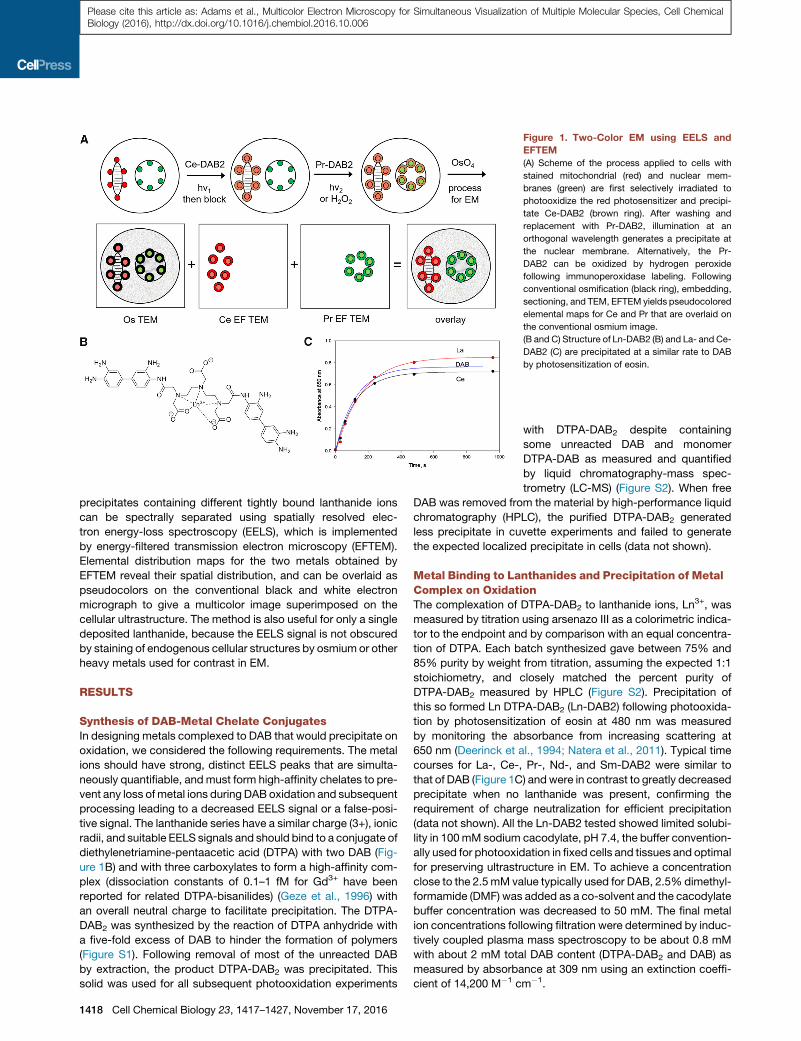
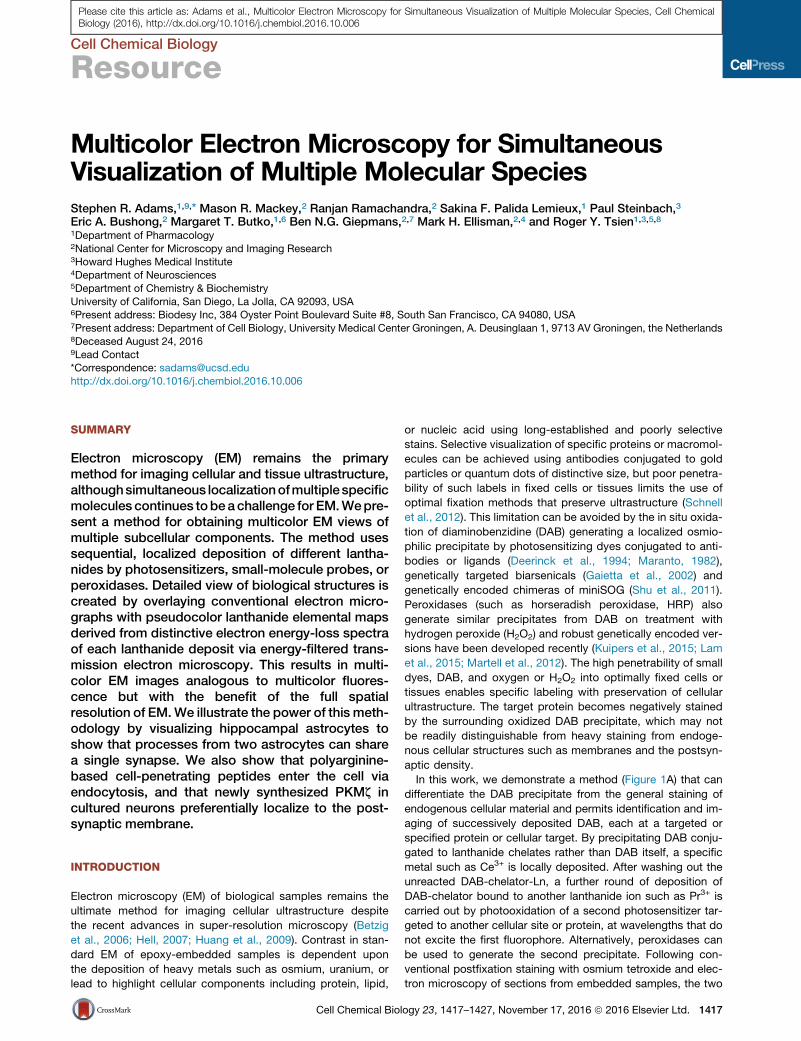
Figure 1. Two-Color EM using EELS and
EFTEM
(A) Scheme of the process applied to cells with
stained mitochondrial (red) and nuclear mem-
branes (green) are first selectively irradiated to
photooxidize the red photosensitizer and precipi-
tate Ce-DAB2 (brown ring). After washing and
replacement with Pr-DAB2, illumination at an
orthogonal wavelength generates a precipitate at
the nuclear membrane. Alternatively, the Pr-
DAB2 can be oxidized by hydrogen peroxide
following immunoperoxidase labeling. Following
conventional osmification (black ring), embedding,
sectioning, and TEM, EFTEM yields pseudocolored
elemental maps for Ce and Pr that are overlaid on
the conventional osmium image.
(B and C) Structure of Ln-DAB2 (B) and La- and Ce-
DAB2 (C) are precipitated at a similar rate to DAB
by photosensitization of eosin.
Please cite this article as: Adams et al., Multicolor Electron Microscopy for Simultaneous Visualization of Multiple Molecular Species, Cell ChemicalBiology (2016), http://dx.doi.org/10.1016/j.chembiol.2016.10.006
precipitates containing different tightly bound lanthanide ions
can be spectrally separated using spatially resolved elec-
tron energy-loss spectroscopy (EELS), which is implemented
by energy-filtered transmission electron microscopy (EFTEM).
Elemental distribution maps for the two metals obtained by
EFTEM reveal their spatial distribution, and can be overlaid as
pseudocolors on the conventional black and white electron
micrograph to give a multicolor image superimposed on the
cellular ultrastructure. The method is also useful for only a single
deposited lanthanide, because the EELS signal is not obscured
by staining of endogenous cellular structures by osmium or other
heavy metals used for contrast in EM.
RESULTS
Synthesis of DAB-Metal Chelate ConjugatesIn designing metals complexed to DAB that would precipitate on
oxidation, we considered the following requirements. The metal
ions should have strong, distinct EELS peaks that are simulta-
neously quantifiable, andmust form high-affinity chelates to pre-
vent any loss ofmetal ions during DAB oxidation and subsequent
processing leading to a decreased EELS signal or a false-posi-
tive signal. The lanthanide series have a similar charge (3+), ionic
radii, and suitable EELS signals and should bind to a conjugate of
diethylenetriamine-pentaacetic acid (DTPA) with two DAB (Fig-
ure 1B) and with three carboxylates to form a high-affinity com-
plex (dissociation constants of 0.1–1 fM for Gd3+ have been
reported for related DTPA-bisanilides) (Geze et al., 1996) with
an overall neutral charge to facilitate precipitation. The DTPA-
DAB2 was synthesized by the reaction of DTPA anhydride with
a five-fold excess of DAB to hinder the formation of polymers
(Figure S1). Following removal of most of the unreacted DAB
by extraction, the product DTPA-DAB2 was precipitated. This
solid was used for all subsequent photooxidation experiments
1418 Cell Chemical Biology 23, 1417–1427, November 17, 2016
with DTPA-DAB2 despite containing
some unreacted DAB and monomer
DTPA-DAB as measured and quantified
by liquid chromatography-mass spec-
trometry (LC-MS) (Figure S2). When free
DAB was removed from the material by high-performance liquid
chromatography (HPLC), the purified DTPA-DAB2 generated
less precipitate in cuvette experiments and failed to generate
the expected localized precipitate in cells (data not shown).
Metal Binding to Lanthanides and Precipitation of MetalComplex on OxidationThe complexation of DTPA-DAB2 to lanthanide ions, Ln3+, was
measured by titration using arsenazo III as a colorimetric indica-
tor to the endpoint and by comparison with an equal concentra-
tion of DTPA. Each batch synthesized gave between 75% and
85% purity by weight from titration, assuming the expected 1:1
stoichiometry, and closely matched the percent purity of
DTPA-DAB2 measured by HPLC (Figure S2). Precipitation of
this so formed Ln DTPA-DAB2 (Ln-DAB2) following photooxida-
tion by photosensitization of eosin at 480 nm was measured
by monitoring the absorbance from increasing scattering at
650 nm (Deerinck et al., 1994; Natera et al., 2011). Typical time
courses for La-, Ce-, Pr-, Nd-, and Sm-DAB2 were similar to
that of DAB (Figure 1C) andwere in contrast to greatly decreased
precipitate when no lanthanide was present, confirming the
requirement of charge neutralization for efficient precipitation
(data not shown). All the Ln-DAB2 tested showed limited solubi-
lity in 100mM sodium cacodylate, pH 7.4, the buffer convention-
ally used for photooxidation in fixed cells and tissues and optimal
for preserving ultrastructure in EM. To achieve a concentration
close to the 2.5mM value typically used for DAB, 2.5%dimethyl-
formamide (DMF) was added as a co-solvent and the cacodylate
buffer concentration was decreased to 50 mM. The final metal
ion concentrations following filtration were determined by induc-
tively coupled plasma mass spectroscopy to be about 0.8 mM
with about 2 mM total DAB content (DTPA-DAB2 and DAB) as
measured by absorbance at 309 nm using an extinction coeffi-
cient of 14,200 M�1 cm�1.
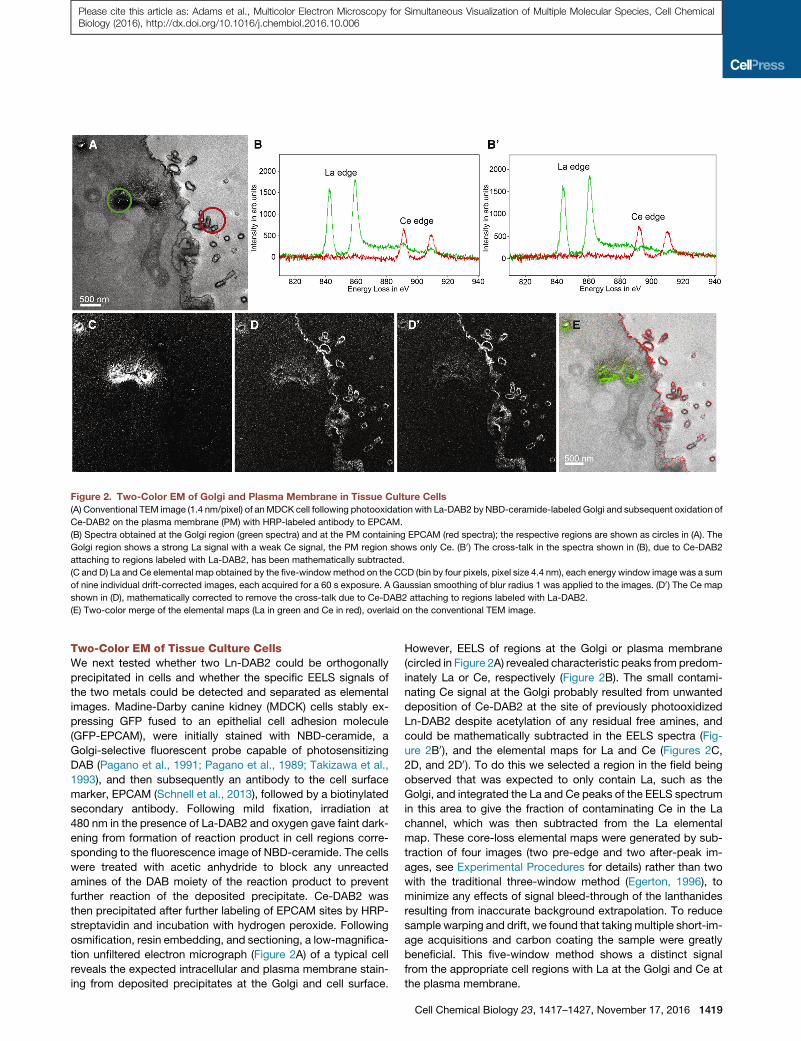
Figure 2. Two-Color EM of Golgi and Plasma Membrane in Tissue Culture Cells
(A) Conventional TEM image (1.4 nm/pixel) of anMDCK cell following photooxidation with La-DAB2 by NBD-ceramide-labeled Golgi and subsequent oxidation of
Ce-DAB2 on the plasma membrane (PM) with HRP-labeled antibody to EPCAM.
(B) Spectra obtained at the Golgi region (green spectra) and at the PM containing EPCAM (red spectra); the respective regions are shown as circles in (A). The
Golgi region shows a strong La signal with a weak Ce signal, the PM region shows only Ce. (B0) The cross-talk in the spectra shown in (B), due to Ce-DAB2
attaching to regions labeled with La-DAB2, has been mathematically subtracted.
(C and D) La and Ce elemental map obtained by the five-windowmethod on the CCD (bin by four pixels, pixel size 4.4 nm), each energy window image was a sum
of nine individual drift-corrected images, each acquired for a 60 s exposure. A Gaussian smoothing of blur radius 1 was applied to the images. (D0) The Ce map
shown in (D), mathematically corrected to remove the cross-talk due to Ce-DAB2 attaching to regions labeled with La-DAB2.
(E) Two-color merge of the elemental maps (La in green and Ce in red), overlaid on the conventional TEM image.
Please cite this article as: Adams et al., Multicolor Electron Microscopy for Simultaneous Visualization of Multiple Molecular Species, Cell ChemicalBiology (2016), http://dx.doi.org/10.1016/j.chembiol.2016.10.006
Two-Color EM of Tissue Culture CellsWe next tested whether two Ln-DAB2 could be orthogonally
precipitated in cells and whether the specific EELS signals of
the two metals could be detected and separated as elemental
images. Madine-Darby canine kidney (MDCK) cells stably ex-
pressing GFP fused to an epithelial cell adhesion molecule
(GFP-EPCAM), were initially stained with NBD-ceramide, a
Golgi-selective fluorescent probe capable of photosensitizing
DAB (Pagano et al., 1991; Pagano et al., 1989; Takizawa et al.,
1993), and then subsequently an antibody to the cell surface
marker, EPCAM (Schnell et al., 2013), followed by a biotinylated
secondary antibody. Following mild fixation, irradiation at
480 nm in the presence of La-DAB2 and oxygen gave faint dark-
ening from formation of reaction product in cell regions corre-
sponding to the fluorescence image of NBD-ceramide. The cells
were treated with acetic anhydride to block any unreacted
amines of the DAB moiety of the reaction product to prevent
further reaction of the deposited precipitate. Ce-DAB2 was
then precipitated after further labeling of EPCAM sites by HRP-
streptavidin and incubation with hydrogen peroxide. Following
osmification, resin embedding, and sectioning, a low-magnifica-
tion unfiltered electron micrograph (Figure 2A) of a typical cell
reveals the expected intracellular and plasma membrane stain-
ing from deposited precipitates at the Golgi and cell surface.
However, EELS of regions at the Golgi or plasma membrane
(circled in Figure 2A) revealed characteristic peaks from predom-
inately La or Ce, respectively (Figure 2B). The small contami-
nating Ce signal at the Golgi probably resulted from unwanted
deposition of Ce-DAB2 at the site of previously photooxidized
Ln-DAB2 despite acetylation of any residual free amines, and
could be mathematically subtracted in the EELS spectra (Fig-
ure 2B0), and the elemental maps for La and Ce (Figures 2C,
2D, and 2D0). To do this we selected a region in the field being
observed that was expected to only contain La, such as the
Golgi, and integrated the La and Ce peaks of the EELS spectrum
in this area to give the fraction of contaminating Ce in the La
channel, which was then subtracted from the La elemental
map. These core-loss elemental maps were generated by sub-
traction of four images (two pre-edge and two after-peak im-
ages, see Experimental Procedures for details) rather than two
with the traditional three-window method (Egerton, 1996), to
minimize any effects of signal bleed-through of the lanthanides
resulting from inaccurate background extrapolation. To reduce
sample warping and drift, we found that takingmultiple short-im-
age acquisitions and carbon coating the sample were greatly
beneficial. This five-window method shows a distinct signal
from the appropriate cell regions with La at the Golgi and Ce at
the plasma membrane.
Cell Chemical Biology 23, 1417–1427, November 17, 2016 1419

Figure 3. Two-Color EM of Hippocampal Astrocytes in Brain Slices
(A) Correlative fluorescent image of adjacent hippocampal astrocytes injected with lucifer yellow or neurobiotin/Alexa 568. The white box is the approximate
region of the EM acquisition, shown in the following panels.
(B) Conventional TEM image (0.56 nm/pixel) showing astrocyte processes containing precipitated Ce- and Pr-DAB2 complexes contacting two spines synapsing
(asterisk) with a bouton (postsynaptic densities indicated with arrows).
(C) EELS spectra obtained at the lower astrocyte (green spectra) photooxidized with Ce-DAB2 and upper astrocyte (red spectra) HRP enzymatically reacted Pr-
DAB2; the respective regions are shown as circles in (B). The upper astrocyte contains predominately Pr, whereas the bottom has Pr and Ce signals. (C0) Thecross-talk in the spectra shown in (C), due to Pr-DAB2 attaching to regions labeled with Ce-DAB2, has been mathematically subtracted.
(D and E) Ce and Pr elemental maps acquired on DE-12 detector (pixel size 0.42 nm; five-window method using a sum of 19 drift-corrected 50 s exposures per
window, smoothed with Gaussian blur radius 3). (E0) Corrected Pr map, removing Pr-DAB from regions with Ce-DAB.
(F) Two-color merge of the spectrally separated elemental maps (green for Ce and red for Pr) overlaid on a conventional image, showing the two different
astrocyte processes contacting the same synapse.
Please cite this article as: Adams et al., Multicolor Electron Microscopy for Simultaneous Visualization of Multiple Molecular Species, Cell ChemicalBiology (2016), http://dx.doi.org/10.1016/j.chembiol.2016.10.006
How should the two energy-filtered lanthanide maps and con-
ventional transmission EM (TEM) be visually combined? We first
tried ‘‘mixing,’’ in Photoshop, the conventional TEM in grayscale
(normal or inverted) with the lanthanide maps in red and green,
respectively. However, the grayscale image tended to drown
out the color images because the black pixels stayed black
regardless of any colors mixed in (Figures S3A–S3E). Next we
tried displaying the conventional TEM in blue, so that a region
with strong La-DAB2 or Ce-DAB2 would appear cyan or
magenta, respectively (Figures S3F and S3G). Unfortunately, re-
gions with conventional TEM only tend to suffer because of the
low psychophysical visibility of the blue channel. Assigning
green to the conventional TEM and blue to the Ce-DAB2 de-
emphasized the latter too much and merely shifted the problem.
Finally, we realized that the conventional TEM image has high
spatial frequencies, resolution, and signal-to-noise, analogous
to the luminance channel in television, whereas the colors should
be displayed as lower-resolution overlays, effectivelymodulating
the alpha channel for transparency versus opacity. Therefore, we
used a custom algorithm to generate pseudocolored overlays of
the La and Ce elemental maps on the monochrome unfiltered
osmium image (conventional EM image) to yield a two-hue
representation of marker distribution with the resolution of an
1420 Cell Chemical Biology 23, 1417–1427, November 17, 2016
electron micrograph (Figures 2E and S3H). An advantage of
this algorithm is that it can be generalized to three or more pseu-
docolor channels.
Hippocampal Astrocyte Cell Tracing in Brain SlicesFollowing this proof of principle, we tested the application of this
method to biological questions that required the ultrastructural
resolution of EM and labeling of two cell markers. Protoplasmic
astrocytes in the mouse hippocampus establish distinct terri-
tories with limited overlap between peripheral processes. These
fine peripheral processes intimately contact and modulate neu-
ronal synapses (Haydon, 2001; Haydon and Carmignoto,
2006). Whether synapses located at domain boundaries are
shared by two astrocytes is unknown because both synaptic
profiles and the fine astrocytic processes near synapses are
generally beyond the resolution limit of light microscopy (Bush-
ong et al., 2004; Bushong et al., 2002; Halassa et al., 2007).
We injected two adjacent astrocytes in fixed hippocampal slices
with either lucifer yellow or a combination of Alexa 568 and neu-
robiotin (Figure 3A). Ce-DAB2 was photooxidized by lucifer
yellow at 470 nm. Acetylimidazole was used to passivate the
Ce-DAB2 precipitate instead of acetic anhydride because of its
greater stability at neutral pH, higher solubility in water, and
Please cite this article as: Adams et al., Multicolor Electron Microscopy for Simultaneous Visualization of Multiple Molecular Species, Cell ChemicalBiology (2016), http://dx.doi.org/10.1016/j.chembiol.2016.10.006
self-buffering at pH 5, which favors reaction with the aromatic
amines of DAB (Oakenfull and Jencks, 1971). Then neurobiotin
was captured with HRP-streptavidin, which in turn was reacted
with Pr-DAB2 and H2O2. After osmification and embedding in
resin, sections were examined by EM for synapses with sur-
rounding densely stained astrocyte processes containing both
Ce and Pr signals by EELS. An example of a perforated synapse
with clearly defined synaptic cleft and pre- and postsynaptic
componentsmarked by synaptic vesicles and postsynaptic den-
sities, respectively, is shown in Figure 3B. EELS of sub-regions of
each of the two astrocytic processes contacting the synapse re-
vealed predominately Ce or Pr signals (Figure 3C). Some signal
from Pr is still present in the Ce astrocyte, perhaps from incom-
plete inactivation of the first Ce-DAB2 precipitate by limited
penetration of the acetylimidazole into the fixed brain slice. The
individual elemental maps (Figures 3D and 3E, and corrected
Pr map, 3E0) and their overlay with an unfiltered EM (Figure 3F)
also indicate that the processes from two astrocytes can share
a single synapse.
Endosomal Uptake of Cell-Penetrating PeptidesWe next explored whether it is feasible to precipitate Ce- and Pr-
DAB by successive irradiation of two spectrally distinct photo-
sensitizers rather than photooxidation followed by HRP-medi-
ated oxidation. We first generated a Ce-DAB2 precipitate by
480 nm irradiation of nuclear targeted miniSOG (Shu et al.,
2011) and then tested the ability of ReAsH-labeled tetracys-
teine-tagged connexin 43 that form gap junctional plaques
(Gaietta et al., 2002) to photooxidize DAB2 when excited at
560 nm. Pr-DAB2 was precipitated as expected at the plasma
membrane but also in the nucleus suggesting that the initial pre-
cipitate itself could act as a photosensitizer of DAB (data not
shown). Ce-DAB2 photooxidized in a cuvette shows a broad
absorbance centered at 500 nm that extends to 600 nm, and
correspondingly in cells we found that after nuclear deposition
of Ce-DAB2 byminiSOG at 480 nm, irradiation at >630 nmwould
not precipitate Pr-DAB2. ReAsH does not absorb at 630 nm, so
we tested the ability of far-red photosensitizers such as the
phthalocyanine dye, IRDye 700DX (Mitsunaga et al., 2011;
Peng et al., 2006), to photooxidize Pr-DAB2.
Cell-penetrating peptides (CPP), including oligomers of
cationic amino acids such as arginine (n = 9–14), have been
extensively used to deliver membrane-impermeant molecules
or particles into the cytoplasm of cells (Copolovici et al., 2014).
CPPs rapidly bind to the plasma membrane and are hypothe-
sized to enter cells via endocytosis (Brock, 2014; Kaplan et al.,
2005; Richard et al., 2003). To determine whether polyarginine
CPPs enter cells via the endocytic pathway, we examined the
localization of an internalized Arg10 peptide compared with
RAB5A, a small GTPase that localizes to endosomal mem-
branes, at a scale too small to resolve using conventional light
microscopy. We incubated HeLa cells expressing RAB5A fused
tominiSOG (Shu et al., 2011) with an Arg10 peptide conjugated to
an IRDye 700DX photosensitizer (Figure S4) that can polymerize
DAB. After the cells were incubated with Arg10-IRDye 700DX
peptide for 2 hr, they were fixed and imaged by light microscopy
(Figure 4).We detected bright intracellular puncta from the endo-
cytosed Arg10-IRDye 700DX peptide (Figure 4C) that partially
co-localized with miniSOG fluorescence (Figures 4B and 4D).
We then irradiated the sample at 480 nm to photooxidize Ce-
DAB2 catalyzed by miniSOG, removed unreacted Ce-DAB2 by
washing, blocked amines with acetylimidazole, and then illumi-
nated it at 680 nm to photooxidize Pr-DAB2 catalyzed by IRDye
700DX. Both endosomes and multivesicular bodies (MVB) were
photooxidized and visible in the unfiltered EM and both contain
precipitated Ce and Pr by EELS (Figures 4E and 4I, respectively).
The elemental maps and overlay with conventional EM image
(Figures 4F–4H) indicate that Ce is concentrated on the endo-
some periphery in accordance with the expected cytoplasmic
localization of RAB5A, whereas Pr is predominately in the
endosome lumen. In this example, we could not correct the Ce
channel for contaminating Pr as EELS spectra with adequate
signal-to-noise could not be obtained solely for endosomal
lumen or the periphery. The corresponding images of MVB (Fig-
ures 4J–4L) also show a similar distribution of Ce and Pr but with
less cytosolic Ce, and several densely Ce-stained luminal vesi-
cles formed by inward budding of the endosomal membrane.
Endosomal localization of RAB5A has been shown to progres-
sively decrease during early endosome maturation to MVB
(Rink et al., 2005) which is in agreement with our results. In addi-
tion, Arg10-IRDye 700DX colocalization with RAB5A in intracel-
lular vesicles confirms that polyarginine-based CPPs enter the
cell via endocytosis.
Tracking Newly Synthesized PKMz in Cultured NeuronsFinally, we used EELS analysis of a single lanthanide-conjugated
DAB to confirm DAB-based labeling that is not readily distin-
guishable from background with conventional TEM, particularly
in regions that are normally electron dense such as the neuronal
postsynaptic density. The kinase PKMz has been implicated in
long-term memory maintenance and is upregulated following
neuronal activity (Shao et al., 2012), but the function and precise
sub-synaptic localization of these new PKMz copies is unclear.
We fused PKMz cDNA to a TimeSTAMP reporter, TS:YSOG3
(Palida et al., 2015), that contains both YFP and miniSOG and al-
lows newly synthesized proteins to be labeled in a drug-depen-
dent manner using the small-molecule BILN-2061. New copies
can be visualized by correlated light and EM in a manner similar
to previous TimeSTAMP reporters incorporating a split YFP and
miniSOG (Butko et al., 2012) (Figure S5). We induced chemical
long-term potentiation by stimulating TS:YSOG3-PKMz-trans-
fected rat neurons in culture with forskolin and rolipram and
then immediately added BILN-2061 for 24 hr to label newly syn-
thesized copies of PKMz. These new copies were visible by YFP
fluorescence and then were illuminated so that miniSOG would
catalyze photooxidation of Ce-DAB2. After osmification, dark-
ening was visible throughout the neuron at low magnification
(Figure 5A) and labeling appeared at postsynaptic membranes
in TEM (Figure 5B), yet it was unclear whether this signal was
derived from DAB deposition or endogenous synaptic electron
density. To confirm that the apparent signal was representative
of newly produced PKMz protein, we used EELS to visualize
Ce at the same synapse. We found that the Ce signal was
enhanced at the postsynaptic membrane (Figures 5C and 5D
at lower magnification, E and F at higher magnification) confirm-
ing that new copies of PKMz preferentially localize to the post-
synaptic membrane, consistent with previous reports for PKMz
localization (Hernandez et al., 2014). Unstimulated neurons that
Cell Chemical Biology 23, 1417–1427, November 17, 2016 1421
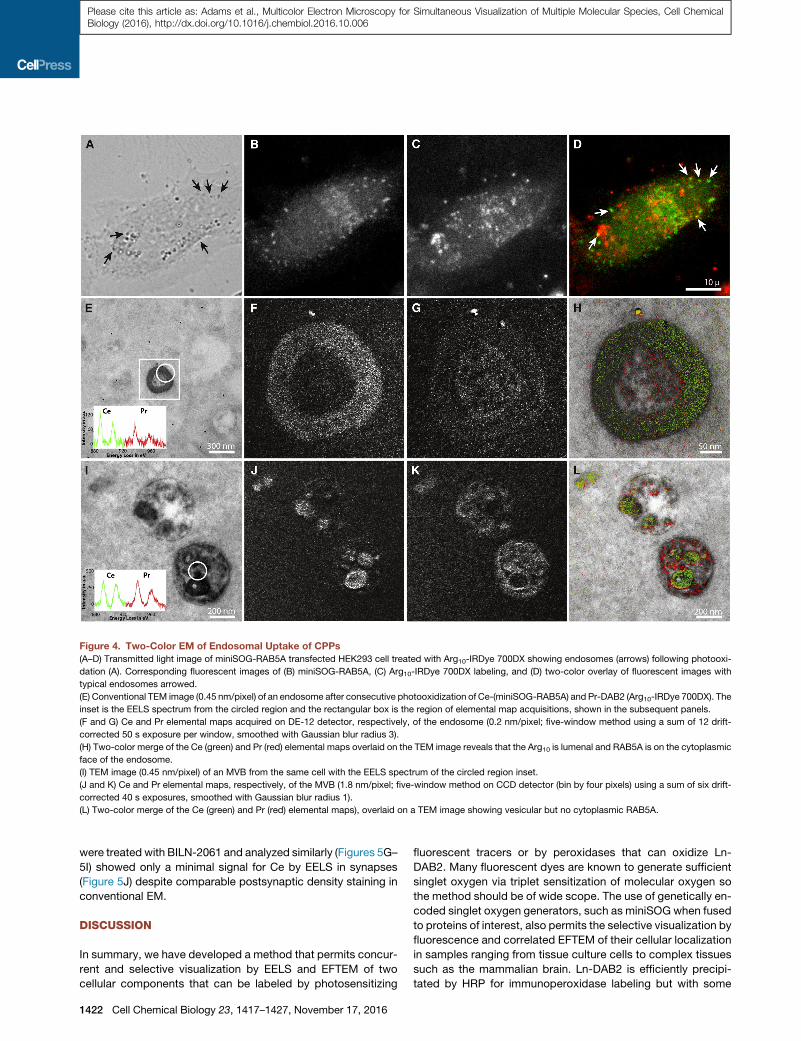
Figure 4. Two-Color EM of Endosomal Uptake of CPPs
(A–D) Transmitted light image of miniSOG-RAB5A transfected HEK293 cell treated with Arg10-IRDye 700DX showing endosomes (arrows) following photooxi-
dation (A). Corresponding fluorescent images of (B) miniSOG-RAB5A, (C) Arg10-IRDye 700DX labeling, and (D) two-color overlay of fluorescent images with
typical endosomes arrowed.
(E) Conventional TEM image (0.45 nm/pixel) of an endosome after consecutive photooxidization of Ce-(miniSOG-RAB5A) and Pr-DAB2 (Arg10-IRDye 700DX). The
inset is the EELS spectrum from the circled region and the rectangular box is the region of elemental map acquisitions, shown in the subsequent panels.
(F and G) Ce and Pr elemental maps acquired on DE-12 detector, respectively, of the endosome (0.2 nm/pixel; five-window method using a sum of 12 drift-
corrected 50 s exposure per window, smoothed with Gaussian blur radius 3).
(H) Two-color merge of the Ce (green) and Pr (red) elemental maps overlaid on the TEM image reveals that the Arg10 is lumenal and RAB5A is on the cytoplasmic
face of the endosome.
(I) TEM image (0.45 nm/pixel) of an MVB from the same cell with the EELS spectrum of the circled region inset.
(J and K) Ce and Pr elemental maps, respectively, of the MVB (1.8 nm/pixel; five-window method on CCD detector (bin by four pixels) using a sum of six drift-
corrected 40 s exposures, smoothed with Gaussian blur radius 1).
(L) Two-color merge of the Ce (green) and Pr (red) elemental maps), overlaid on a TEM image showing vesicular but no cytoplasmic RAB5A.
Please cite this article as: Adams et al., Multicolor Electron Microscopy for Simultaneous Visualization of Multiple Molecular Species, Cell ChemicalBiology (2016), http://dx.doi.org/10.1016/j.chembiol.2016.10.006
were treated with BILN-2061 and analyzed similarly (Figures 5G–
5I) showed only a minimal signal for Ce by EELS in synapses
(Figure 5J) despite comparable postsynaptic density staining in
conventional EM.
DISCUSSION
In summary, we have developed a method that permits concur-
rent and selective visualization by EELS and EFTEM of two
cellular components that can be labeled by photosensitizing
1422 Cell Chemical Biology 23, 1417–1427, November 17, 2016
fluorescent tracers or by peroxidases that can oxidize Ln-
DAB2. Many fluorescent dyes are known to generate sufficient
singlet oxygen via triplet sensitization of molecular oxygen so
the method should be of wide scope. The use of genetically en-
coded singlet oxygen generators, such as miniSOG when fused
to proteins of interest, also permits the selective visualization by
fluorescence and correlated EFTEM of their cellular localization
in samples ranging from tissue culture cells to complex tissues
such as the mammalian brain. Ln-DAB2 is efficiently precipi-
tated by HRP for immunoperoxidase labeling but with some
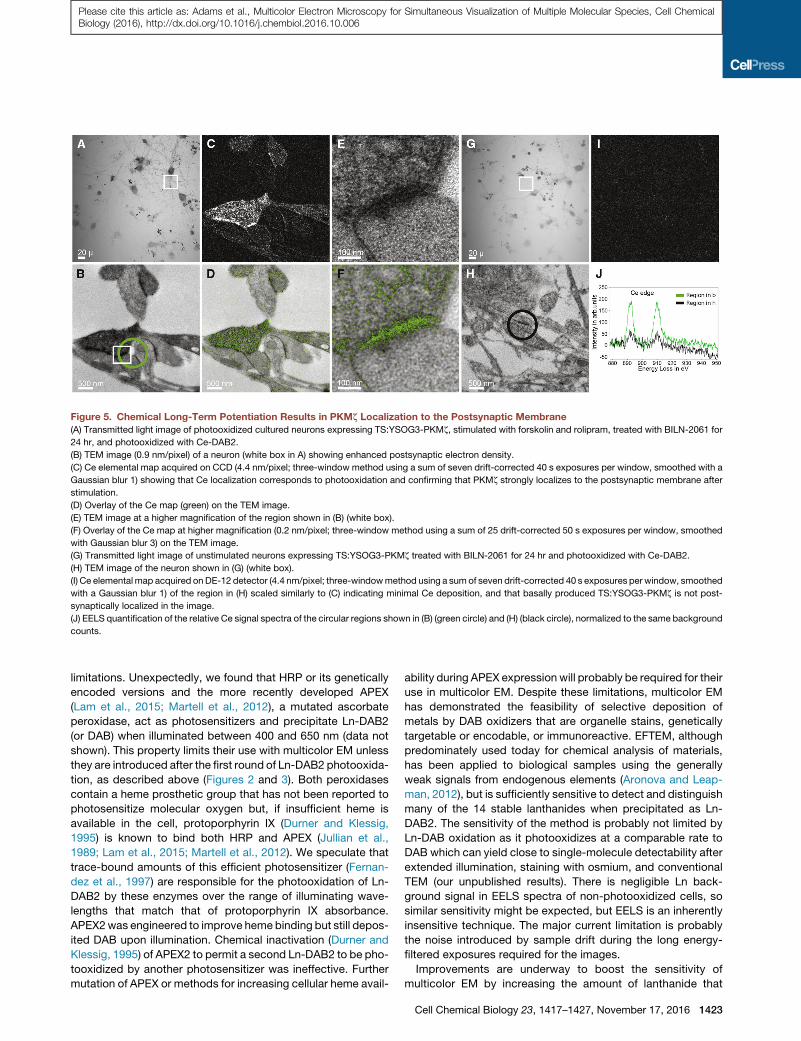
Figure 5. Chemical Long-Term Potentiation Results in PKMz Localization to the Postsynaptic Membrane
(A) Transmitted light image of photooxidized cultured neurons expressing TS:YSOG3-PKMz, stimulated with forskolin and rolipram, treated with BILN-2061 for
24 hr, and photooxidized with Ce-DAB2.
(B) TEM image (0.9 nm/pixel) of a neuron (white box in A) showing enhanced postsynaptic electron density.
(C) Ce elemental map acquired on CCD (4.4 nm/pixel; three-window method using a sum of seven drift-corrected 40 s exposures per window, smoothed with a
Gaussian blur 1) showing that Ce localization corresponds to photooxidation and confirming that PKMz strongly localizes to the postsynaptic membrane after
stimulation.
(D) Overlay of the Ce map (green) on the TEM image.
(E) TEM image at a higher magnification of the region shown in (B) (white box).
(F) Overlay of the Ce map at higher magnification (0.2 nm/pixel; three-window method using a sum of 25 drift-corrected 50 s exposures per window, smoothed
with Gaussian blur 3) on the TEM image.
(G) Transmitted light image of unstimulated neurons expressing TS:YSOG3-PKMz treated with BILN-2061 for 24 hr and photooxidized with Ce-DAB2.
(H) TEM image of the neuron shown in (G) (white box).
(I) Ce elemental map acquired onDE-12 detector (4.4 nm/pixel; three-windowmethod using a sumof seven drift-corrected 40 s exposures per window, smoothed
with a Gaussian blur 1) of the region in (H) scaled similarly to (C) indicating minimal Ce deposition, and that basally produced TS:YSOG3-PKMz is not post-
synaptically localized in the image.
(J) EELS quantification of the relative Ce signal spectra of the circular regions shown in (B) (green circle) and (H) (black circle), normalized to the same background
counts.
Please cite this article as: Adams et al., Multicolor Electron Microscopy for Simultaneous Visualization of Multiple Molecular Species, Cell ChemicalBiology (2016), http://dx.doi.org/10.1016/j.chembiol.2016.10.006
limitations. Unexpectedly, we found that HRP or its genetically
encoded versions and the more recently developed APEX
(Lam et al., 2015; Martell et al., 2012), a mutated ascorbate
peroxidase, act as photosensitizers and precipitate Ln-DAB2
(or DAB) when illuminated between 400 and 650 nm (data not
shown). This property limits their use with multicolor EM unless
they are introduced after the first round of Ln-DAB2 photooxida-
tion, as described above (Figures 2 and 3). Both peroxidases
contain a heme prosthetic group that has not been reported to
photosensitize molecular oxygen but, if insufficient heme is
available in the cell, protoporphyrin IX (Durner and Klessig,
1995) is known to bind both HRP and APEX (Jullian et al.,
1989; Lam et al., 2015; Martell et al., 2012). We speculate that
trace-bound amounts of this efficient photosensitizer (Fernan-
dez et al., 1997) are responsible for the photooxidation of Ln-
DAB2 by these enzymes over the range of illuminating wave-
lengths that match that of protoporphyrin IX absorbance.
APEX2was engineered to improve heme binding but still depos-
ited DAB upon illumination. Chemical inactivation (Durner and
Klessig, 1995) of APEX2 to permit a second Ln-DAB2 to be pho-
tooxidized by another photosensitizer was ineffective. Further
mutation of APEX or methods for increasing cellular heme avail-
ability during APEX expression will probably be required for their
use in multicolor EM. Despite these limitations, multicolor EM
has demonstrated the feasibility of selective deposition of
metals by DAB oxidizers that are organelle stains, genetically
targetable or encodable, or immunoreactive. EFTEM, although
predominately used today for chemical analysis of materials,
has been applied to biological samples using the generally
weak signals from endogenous elements (Aronova and Leap-
man, 2012), but is sufficiently sensitive to detect and distinguish
many of the 14 stable lanthanides when precipitated as Ln-
DAB2. The sensitivity of the method is probably not limited by
Ln-DAB oxidation as it photooxidizes at a comparable rate to
DAB which can yield close to single-molecule detectability after
extended illumination, staining with osmium, and conventional
TEM (our unpublished results). There is negligible Ln back-
ground signal in EELS spectra of non-photooxidized cells, so
similar sensitivity might be expected, but EELS is an inherently
insensitive technique. The major current limitation is probably
the noise introduced by sample drift during the long energy-
filtered exposures required for the images.
Improvements are underway to boost the sensitivity of
multicolor EM by increasing the amount of lanthanide that
Cell Chemical Biology 23, 1417–1427, November 17, 2016 1423

Please cite this article as: Adams et al., Multicolor Electron Microscopy for Simultaneous Visualization of Multiple Molecular Species, Cell ChemicalBiology (2016), http://dx.doi.org/10.1016/j.chembiol.2016.10.006
is deposited during the oxidation of Ln-DAB chelates. Further
development should lead to a greater understanding of the
relationship between structure and metal deposition and will
improve signal-to-noise, decrease acquisition time and sam-
ple damage, and potentially permit greater resolution through
tomography. The use of DAB to precipitate metals limits the
scope of photooxidation because the polymer itself acts as
a photosensitizer of further DAB oxidation up to about
600 nm, and limits the number of different Ln-DABS that
can be successively deposited by spectrally distinct photo-
sensitizers. Acylation of unreacted amino groups in the
Ln-DAB precipitate diminished its undesired reaction with a
subsequent Ln-DAB Efforts are underway to completely
chemically block it and the photosensitizing effects of pre-
cipitated Ln-DAB, and thereby eliminate the present require-
ment for deconvolution that can be problematic when the
elemental signals are all co-localized.
SIGNIFICANCE
Major improvements in multicolor and super-resolution
fluorescence microscopy over the last two decades have
dramatically improved our understanding of cellular micro-
architecture and function. Comparable progress in electron
microscopy has been achieved in throughput and automa-
tion, but methods for marking multiple molecules of interest
have beenmore limited. This work describes a newmethod-
ology for such selective detection or painting by sequential
localized oxidation and precipitation of diaminobenzidine
conjugates of Ln chelates by genetically encoded photosen-
sitizers, small-molecule probes, or peroxidases. Electron
energy-loss spectroscopy of these orthogonally deposited
lanthanide metals and their imaging by energy-filtered
transmission electron microscopy yields elemental maps
that can be displayed on conventional electron micrographs
as color overlays.
EXPERIMENTAL PROCEDURES
Reagents and solvents were from Sigma-Aldrich and cell culture reagents and
probes were obtained from Life Technologies except where noted. All animal
procedures were approved by the Institutional Animal Care and Use Commit-
tee of the University of California, San Diego.
Synthesis of Ln-DAB2
Diethylene-triamine-N,N0,N00-triacetic acid bis(diaminobenzidine)amide, DTPA-
DAB2: DTPA bis-anhydride (3.33 g, 9.33 mmol) suspended in dry DMF
(33 mL) with triethylamine (1.30 mL, 9.33 mmol) under N2 was gently heated
and bath sonicated until dissolved. After cooling to room temperature, the
solution was added dropwise over 30 min with stirring under N2, to DAB
(10 g, 46.65 mmol) and triethylamine (18.66 mmol, 2.60 mL) dissolved in
dry DMF (33 mL). After stirring overnight at room temperature, the reaction
mix was evaporated, dissolved in water (100 mL), and adjusted to pH 8
with 1 N NaOH until the pH stabilized (about 15 min). The mixture was stirred
under N2 for 1 hr, and then unreacted DAB was removed by filtration followed
by extraction with EtOAc (3 3 100 mL). The aqueous layer was partially
evaporated to remove EtOAc and then acidified to pH 5.4 with a concentra-
tion of HCl to give the product as a gray precipitate, which was collected
by filtration and washed with water. Drying over P2O5 in vacuo overnight
gave 2.75 g (38%) of a gray solid that was used without further purification.
LC-MS indicated 70%–80% purity with unreacted DAB as the remainder
(Figure S2).
1424 Cell Chemical Biology 23, 1417–1427, November 17, 2016
Ln-DAB2 Solutions
Ln-DAB2 solutions in cacodylate buffer were prepared immediately before use
at room temperature. To make 10 mL of a 2 mM Ln, Ce, or Pr-DAB2 solution,
15.6 mg (20 mmol) of DTPA-DAB2 was suspended in DMF (0.25 mL) and son-
icated/vortexed to disperse. Water (8.33 mL) was added to give a cloudy so-
lution that cleared on addition of LnCl3 aqueous solution (0.1M of LaCl3$6H2O,
CeCl3$6H2O, or PrCl3$xH2O; the latter stock solution was dissolved in 0.1 M
HCl) with 120 mL of La or Ce solutions or 140 mL of Pr solution, followed by vor-
texing and bath sonication to give clear light-brown solutions. Aqueous NaOH
solution (1 M) was added sequentially in six equal portions (63 10 mL) with vor-
texing after each addition. A precipitate was initially formed during the early
steps of this neutralization but a mostly clear solution was present by the
end. Cacodylate buffer (1.67 mL of 0.3 M sodium cacodylate [pH 7.4]) was
added, mixed, and centrifuged (3000 3 g, 10 min) to remove any precipitate.
Solutions were syringe-filtered (0.22 mm, Millipore) immediately prior to addi-
tion to cells. Metal ion concentrations were measured by inductively coupled
plasma mass spectroscopy (Agilent 7700).
Synthesis of Arg10-IRDye 700DX
Arg10-IRDye 700DX was prepared by reaction of H2N-GGRRRRRRRRRR-
CONH2 (where G and R are L-glycine and L-arginine, respectively; synthesized
by standard Fmoc chemistry with a Protein Technologies Prelude peptide syn-
thesizer), with IRDye 700DX NHS ester (LI-COR Biosciences) in DMSO and
N-methylmorpholine as base. The conjugate was purified by reverse-phase
HPLC and characterized by LC-MS. Found, 575.0 (M + 6H+), 689.6 (M +
5H+), 861.9 (M + 4H+), 1,148.8 (M + 3H+). Deconvolved to 3,343.6, calculated
3,443.5.
Eosin-Sensitized Photooxidation
A solution of DAB or Ln-DAB2 (0.4 mM, diluted from freshly prepared 100 mM
stock solutions in DMF) and eosin (20 mM) in 100 mM 3-(N-morpholino)pro-
panesulfonic acid sodium salt (pH 7.2), or 0.1 M sodium cacodylate (pH 7.4)
in a 3-mL cuvette was irradiated at 480 nm (30 nm band pass) using a solar
simulator (Spectra-Physics 92191-1000 solar simulator with 1,600 W mercury
arc lamp and two Spectra-Physics SP66239-3767 dichroic mirrors to remove
infrared and UV wavelengths). The remaining light was filtered through 10-cm-
square band-pass filters (Chroma Technology) with a deflector mirror set at
45� while bubbling with air. At set time points, the absorbance of the reaction
was measured at 650 nm until the increase was complete.
Cell Culturing, Labeling, and Transfection
MDCK and HEK293 cells were cultured on poly-D-lysine-coated 35-mm
glass-bottom dishes (MatTEK) in DMEM supplemented with 10% fetal
bovine serum. MDCK cells were labeled with 5 mM NBD C6-ceramide in me-
dium containing 10% fetal calf serum for 30 min, washed, and incubated for
30 min in new culture medium, all at 37�C with 5% carbon dioxide, then
washed (5 times) with Hank’s balanced salt solution (HBSS) at 37�C. Cellswere then incubated with mouse monoclonal EPCAM antibody (KS1/4)
(Santa Cruz Biotechnology) at 1:1,000 dilution for 12 min at 37�C in
HBSS, washed with HBSS, incubated for 60 min in secondary antibody-bio-
tinylated goat anti-mouse immunoglobulin G (Jackson Laboratory, 115-065-
003) at 1:250 dilution at 37�C in HBSS and then washed. HEK293 cells
were transfected with a miniSOG-RAB5A plasmid at 60%–80% confluence
using Lipofectamine 2000, which was removed after 8 hr. Cells were treated
48 hr after transfection with 2 mM Arg10-IRDye 700DX (prepared in distilled
water) and added to the culture medium for 2 hr at 37�C, after which time
the medium was removed and cells were rinsed once in HBSS. Primary
mouse cortical neurons were cultured, transfected with TS:YSOG3-PKMz,
and chemically stimulated with 50 mM forskolin and 0.1 mM rolipram for
10 min, then incubated with 1 mM BILN-2061 as described previously
(Palida et al., 2015).
General Procedure for Photooxidation and HRP Reaction
of Ln-DAB2
Labeled cells were fixed and blocked (Shu et al., 2011). Samples were then
transferred either to a Bio-Rad MRC1024 with a Zeiss Axiovert 35M micro-
scope or a Leica SPEmicroscope. MDCK cells stained with NBDC6-ceramide
and transfected HEK293 cells exhibiting peptide uptake were identified either

Please cite this article as: Adams et al., Multicolor Electron Microscopy for Simultaneous Visualization of Multiple Molecular Species, Cell ChemicalBiology (2016), http://dx.doi.org/10.1016/j.chembiol.2016.10.006
by NBD C6-ceramide, miniSOG, or IRDye 700DX fluorescence, respectively,
and imaged by confocal microscopy.
Freshly prepared and filtered La-DAB2 (2 mM) or Ce-DAB2 (2 mM) for the
first photooxidation reaction was added to the dish of cells for 5 min while a
stream of pure oxygen was gently blown continuously over the solution. Cells
were irradiated to excite NBD C6-ceramide depositing La-DAB2 or miniSOG
depositing Ce-DAB2 reaction product both using 450–490 nm excitation (Ex)
and 515 nm emission (Em) long-pass (LP) filters with a 580 nm dichroic
mirror. Reaction product formation was monitored by transmitted light micro-
scopy and illumination was stopped as soon as a light-brown reaction prod-
uct appeared. Acetic anhydride (MDCK cells) was added (20 3 20 mM
freshly prepared) for 1 min each to block precipitated La-DAB2. Alternatively,
MDCK cells were rinsed 3 3 5 min with fresh 100 mM acetylimidazole in
0.15 M NaCl to prevent further polymerization of either La-DAB2 or Ce-
DAB2, then treated with freshly prepared Ce-DAB2 (2 mM) for HRP enzy-
matic reaction, or irradiated to excite IRDye 700DX (Ex 675/67 nm, Em,
736 LP) depositing Pr-DAB2 reaction product. Cells were rinsed 5 3
2 min, postfixed, dehydrated, infiltrated, and embedded as described previ-
ously (Shu et al., 2011).
Hippocampal Astrocyte Filling with Lucifer Yellow and Neurobiotin
Intracellular Astrocyte Filling with Fluorescent Dyes in Fixed Tissue
A mouse (2-month-old BALB/c male) was perfused with Ringers, followed by
4% paraformaldehyde, 0.2% glutaraldehyde in 0.1 M PBS (Bushong et al.,
2002). Coronal slices (100 mm thick) were cut through the hippocampus using
a vibratome. In the CA1 stratum radiatum, one astrocyte was iontophoretically
injected with 5% lucifer yellow-CH in water and an adjacent astrocyte was in-
jected with 2.5% Alexa Fluor 568/2% neurobiotin (Vector, SP-1120) in 200mM
KCl (Bushong et al., 2002). The tissue slices were then postfixed with 4%para-
formaldehyde/0.2% glutaraldehyde in 0.1 M PBS. Confocal volumes were
taken of the filled astrocytes with a Leica SPE inverted confocal microscope,
and the slices were further fixed with 2.0% glutaraldehyde in 0.15 M sodium
cacodylate buffer for 10 min on ice, followed by washing several times with
0.15 M sodium cacodylate buffer (pH 7.4).
Photooxidation of Lucifer Yellow Filled Astrocytes
Tissues were treated for 15 min in blocking buffer (50 mM glycine, 5 mM
KCN, and 5 mM aminotriazole) to reduce nonspecific background reaction
of DAB derivatives, filtered Ce-DAB2 solution was added to a tissue slice at
room temperature and incubated for 10 min before photooxidation. A
stream of pure oxygen was gently blown continuously over the solution.
The lucifer yellow was then excited using a standard fluorescein isothiocy-
anate filter set (Ex 470/40, DM510, Em BA520) with intense light from a
150 W xenon lamp. Illumination was stopped as soon as a light-brown re-
action product appeared within the filled astrocyte (8–10 min), as monitored
by transmitted light.
Blocking of First Ln-DAB2 Product
Following photooxidation, each tissue slice was washed several times with
cold 0.15 M sodium cacodylate buffer (pH 7.4) and then blocked with freshly
prepared 100 mM acetylimidazole in 0.15 M sodium chloride (3 3 5 min).
HRP Labeling and Enzymatic Reaction of Photooxidized Cells
The tissues were incubated with cryoprotectant, then freeze-thawed to per-
meabilize the tissues (Knott et al., 2009). The tissues were washed several
times with 0.15 M sodium cacodylate buffer (pH 7.4), incubated with 1%
BSA in the cacodylate buffer for 30 min followed by overnight incubation
with a Vectorstain Elite ABC staining kit (Vector, PK6100). After rinsing several
times for 1 hr with cold 0.1 M cacodylate buffer (pH 7.4), 20 mL of Pr-DAB2 so-
lution and 5 mL of 30% H2O2 were added to each tissue. After the neurobiotin-
filled astrocyte turned brown, the tissue was washed several times with 0.15M
sodium cacodylate buffer (pH 7.4).
Tissue Processing for TEM
Tissues were fixed with 2% glutaraldehyde in cacodylate buffer for 20 min,
washed several times with cacodylate buffer, postfixed with 0.5% of OsO4
in cacodylate buffer for 30 min, dehydrated in an ethanol series of 0%, 20%,
50%, 70%, 90%, and 100% on ice for 5 min each, 100% ethanol twice for
5 min each at room temperature, 1:1 100% dry ethanol:dry acetone for
5 min, 100% dry acetone for 5 min, 50:50 dry acetone:Durcupan ACM for
30 min, four changes of Durcupan for 1 hr each, and embedded in a 60�Coven for 48 hr.
Section Preparation from Cells and Tissue
Sections (100 nm thick) were cut by an Ultra 45� Diatome diamond knife using
a Leica Ultracut UCT ultramicrotome, and sections were picked up on a 50-
mesh copper grid (Ted Pella, G50). Sections were carbon coated on both sides
by a Cressington 208 carbon coater to prevent charging of the plastic which
can cause drift and thermal damage.
Electron Microscopy
EFTEM was performed with a JEOL JEM-3200EF transmission electron mi-
croscope operating at either 200 or 300 KV, equipped with an in-column
Omega filter and a LaB6 electron source. The samples were pre-irradiated
at a low magnification of 1003 for about 30 min to stabilize the sample and
minimize contamination (Egerton et al., 2004). The elemental maps were
obtained at the M4,5 core-loss edge, the onset of which occurs at 832,
883, and 931 for lanthanum (La), cerium (Ce), and praseodymium (Pr),
respectively (Ahn and Krivanek, 1983). The EFTEM images of the pre-
and post-edges were obtained using a slit of 30 eV width. The electron en-
ergy-loss spectrum was acquired using the Ultrascan 4000 CCD detector
from Gatan. The conventional images and elemental maps were acquired
using both the Ultrascan 4000 detector and the direct detection device
DE-12 from Direct Electron LP. See Supplemental Experimental Proced-
ures for details.
Two-Color Elemental Map Merge and Overlay on TEM
Elemental maps and TEMwere pre-aligned in Photoshop (Adobe) and merged
pixel-by-pixel using the following custom algorithm running in C++.
(Display Pixel)R,G,B = (1 – T)$(PixelTEM)R,G,B + T$(PixelOVR)R,G,B,
where PixelTEM is the 24-bit red-green-blue (RGB) coordinate for the gray scale
TEM image, and PixelOVR is the 24-bit RGB coordinate for the overlay hue at
maximum saturation and brightness. T is a transparency factor, the value of
which determines what percentage of the overlay color coordinate contributes
to the final display pixel. The color coordinate for PixelOVR is calculated in the
HSL (hue, saturation, and lightness) color space. In the following example, the
hue (H) for PixelOVR is determined using two EELS channels:
S1 = I1/(I1 + I2),
S2 = I2/(I1 + I2),
H = (S1$H1) + (S2$H2),
where S is a scale factor and I is the intensity of the signal for each respective
channel, and H1 and H2 are the arbitrary hues selected for each channels (e.g.,
red and green).
The lightness (I) for PixelOVR is calculated as follows:
I = (S1$I1) + (S2$I2).
Finally, the RGB coordinate for PixelOVR is determined using an HSL to RGB
color space conversion algorithm where S is set to maximum. The transpar-
ency factor is calculated as follows:
T = I/255,
The raw EELS data need to be scaled between 0 and 255 (8-bits) and should
be done prior to implementing the algorithm.
SUPPLEMENTAL INFORMATION
Supplemental Information includes Supplemental Experimental Procedures
and five figures and can be found with this article online at http://dx.doi.org/
10.1016/j.chembiol.2016.10.006.
AUTHOR CONTRIBUTIONS
S.A., R.T., and M.E. conceived and designed the experiments, S.A., M.M.,
R.R., S.P., E.B., B.G., M.B., and P.S. performed all experiments and analyzed
data, and S.A., M.M., R.R., and R.T. wrote the manuscript.
Cell Chemical Biology 23, 1417–1427, November 17, 2016 1425
Please cite this article as: Adams et al., Multicolor Electron Microscopy for Simultaneous Visualization of Multiple Molecular Species, Cell ChemicalBiology (2016), http://dx.doi.org/10.1016/j.chembiol.2016.10.006
ACKNOWLEDGMENTS
We thank David Mastronarde (University of Colorado Boulder) and Liang Jin
(Direct Electron) for help with scripting in Serial EM and DE-12 direct detection
device, respectively, and James Bouwer, Thomas Deerinck, and Junru Hu for
advice and technical assistance. This work was supported by UCSDGraduate
Training Programs in Cellular and Molecular Pharmacology (T32 GM007752)
(S.P.) and in Neuroplasticity of Aging (T32 AG000216) (S.P.), NIH GM103412
(M.E.), the W.M. Keck Foundation (M.E.), and NIH GM086197 (R.T.).
Received: June 13, 2016
Revised: August 16, 2016
Accepted: October 12, 2016
Published: November 3, 2016
REFERENCES
Ahn, C.C., and Krivanek, O.L. (1983). EELS Atlas (Gatan).
Aronova, M.A., and Leapman, R.D. (2012). Development of electron energy
loss spectroscopy in the biological sciences. MRS Bull. 37, 53–62.
Betzig, E., Patterson, G.H., Sougrat, R., Lindwasser, O.W., Olenych, S.,
Bonifacino, J.S., Davidson, M.W., Lippincott-Schwartz, J., and Hess, H.F.
(2006). Imaging intracellular fluorescent proteins at nanometer resolution.
Science 313, 1642–1645.
Brock, R. (2014). The uptake of arginine-rich cell-penetrating peptides: putting
the puzzle together. Bioconjug. Chem. 25, 863–868.
Bushong, E.A., Martone, M.E., Jones, Y.Z., and Ellisman, M.H. (2002).
Protoplasmic astrocytes in CA1 stratum radiatum occupy separate anatomical
domains. J. Neurosci. 22, 183–192.
Bushong, E.A., Martone, M.E., and Ellisman, M.H. (2004). Maturation of astro-
cyte morphology and the establishment of astrocyte domains during postnatal
hippocampal development. Int. J. Dev. Neurosci. 22, 73–86.
Butko, M.T., Yang, J., Geng, Y., Kim, H.J., Jeon, N.L., Shu, X., Mackey, M.R.,
Ellisman, M.H., Tsien, R.Y., and Lin, M.Z. (2012). Fluorescent and photo-
oxidizing TimeSTAMP tags track protein fates in light and electron micro-
scopy. Nat. Neurosci. 15, 1742–1751.
Copolovici, D.M., Langel, K., Eriste, E., and Langel, U. (2014). Cell-penetrating
peptides: design, synthesis, and applications. ACS Nano 8, 1972–1994.
Deerinck, T.J., Martone, M.E., Levram, V., Green, D.P.L., Tsien, R.Y., Spector,
D.L., Huang, S., and Ellisman, M.H. (1994). Fluorescence photooxidation with
Eosin - a method of high-resolution immunolocalization and in-situ hybridiza-
tion detection for light and electron-microscopy. J. Cell Biol. 126, 901–910.
Durner, J., and Klessig, D.F. (1995). Inhibition of ascorbate peroxidase by
salicylic acid and 2,6-dichloroisonicotinic acid, two inducers of plant defense
responses. Proc. Natl. Acad. Sci. USA 92, 11312–11316.
Egerton, R.F. (1996). Electron Energy-loss Spectroscopy (Plenum Press).
Egerton, R.F., Li, P., and Malac, M. (2004). Radiation damage in the TEM and
SEM. Micron 35, 399–409.
Fernandez, J.M., Bilgin, M.D., and Grossweiner, L.I. (1997). Singlet oxygen
generation by photodynamic agents. J. Photochem. Photobiol. B Biol. 37,
131–140.
Gaietta, G., Deerinck, T.J., Adams, S.R., Bouwer, J., Tour, O., Laird, D.W.,
Sosinsky, G.E., Tsien, R.Y., and Ellisman, M.H. (2002). Multicolor and electron
microscopic imaging of connexin trafficking. Science 296, 503–507.
Geze, C., Mouro, C., Hindre, F., LePlouzennec, M., Moinet, C., Rolland, R.,
Alderighi, L., Vacca, A., and Simonneaux, G. (1996). Synthesis, characteriza-
tion and relaxivity of functionalized aromatic amide DTPA-lanthanide com-
plexes. Bull. Soc. Chim. Fr. 133, 267–272.
Halassa, M.M., Fellin, T., Takano, H., Dong, J.H., and Haydon, P.G. (2007).
Synaptic islands defined by the territory of a single astrocyte. J. Neurosci.
27, 6473–6477.
Haydon, P.G. (2001). GLIA: listening and talking to the synapse. Nat. Rev.
Neurosci. 2, 185–193.
1426 Cell Chemical Biology 23, 1417–1427, November 17, 2016
Haydon, P.G., and Carmignoto, G. (2006). Astrocyte control of synaptic trans-
mission and neurovascular coupling. Physiol. Rev. 86, 1009–1031.
Hell, S.W. (2007). Far-field optical nanoscopy. Science 316, 1153–1158.
Hernandez, A.I., Oxberry, W.C., Crary, J.F., Mirra, S.S., and Sacktor, T.C.
(2014). Cellular and subcellular localization of PKMz. Philos. Trans. R. Soc.
Lond. B Biol. Sci. 369, 20130140.
Huang, B., Bates, M., and Zhuang, X. (2009). Super-resolution fluorescence
microscopy. Annu. Rev. Biochem. 78, 993–1016.
Jullian, C., Brunet, J.E., Thomas, V., and Jameson, D.M. (1989). Time-resolved
fluorescence studies on protoporphyrin IX-apohorseradish peroxidase. Biochim.
Biophys. Acta 997, 206–210.
Kaplan, I.M., Wadia, J.S., and Dowdy, S.F. (2005). Cationic TAT peptide trans-
duction domain enters cells by macropinocytosis. J. Control. Release 102,
247–253.
Knott, G.W., Holtmaat, A., Trachtenberg, J.T., Svoboda, K., and Welker, E.
(2009). A protocol for preparingGFP-labeled neurons previously imaged in vivo
and in slice preparations for light and electron microscopic analysis. Nat.
Protoc. 4, 1145–1156.
Kuipers, J., van Ham, T.J., Kalicharan, R.D., Veenstra-Algra, A., Sjollema, K.A.,
Dijk, F., Schnell, U., and Giepmans, B.N. (2015). FLIPPER, a combinatorial
probe for correlated live imaging and electron microscopy, allows identifica-
tion and quantitative analysis of various cells and organelles. Cell Tissue
Res. 360, 61–70.
Lam, S.S., Martell, J.D., Kamer, K.J., Deerinck, T.J., Ellisman, M.H., Mootha,
V.K., and Ting, A.Y. (2015). Directed evolution of APEX2 for electron micro-
scopy and proximity labeling. Nat. Methods 12, 51–54.
Maranto, A.R. (1982). Neuronal mapping: a photooxidation reaction makes
Lucifer yellow useful for electron microscopy. Science 217, 953–955.
Martell, J.D., Deerinck, T.J., Sancak, Y., Poulos, T.L., Mootha, V.K., Sosinsky,
G.E., Ellisman, M.H., and Ting, A.Y. (2012). Engineered ascorbate peroxidase
as a genetically encoded reporter for electron microscopy. Nat. Biotechnol.
30, 1143–1148.
Mitsunaga, M., Ogawa, M., Kosaka, N., Rosenblum, L.T., Choyke, P.L., and
Kobayashi, H. (2011). Cancer cell-selective in vivo near infrared photoimmuno-
therapy targeting specific membrane molecules. Nat. Med. 17, 1685–1691.
Natera, J., Massad, W., Amat-Guerri, F., and Garcia, N. (2011). Elementary pro-
cesses in the eosin-sensitized photooxidation of 3,3 ’-diaminobenzidine for
correlative fluorescence and electron microscopy. J. Photochem. Photobiol.
Chem. 220, 25–30.
Oakenfull, D., and Jencks, W. (1971). Reactions of acetylimidazole and acety-
limidazolium ion with nucleophilic reagents - structure-reactivity relationships.
J. Am. Chem. Soc. 93, 178–188.
Pagano, R.E., Sepanski, M.A., andMartin, O.C. (1989). Molecular trapping of a
fluorescent ceramide analogue at theGolgi apparatus of fixed cells: interaction
with endogenous lipids provides a trans-Golgi marker for both light and elec-
tron microscopy. J. Cell Biol. 109, 2067–2079.
Pagano, R.E., Martin, O.C., Kang, H.C., and Haugland, R.P. (1991). A novel
fluorescent ceramide analogue for studying membrane traffic in animal cells:
accumulation at the Golgi apparatus results in altered spectral properties of
the sphingolipid precursor. J. Cell Biol. 113, 1267–1279.
Palida, S.F., Butko, M.T., Ngo, J.T., Mackey, M.R., Gross, L.A., Ellisman, M.H.,
and Tsien, R.Y. (2015). PKMz, but not PKCl, is rapidly synthesized and
degraded at the neuronal synapse. J. Neurosci. 35, 7736–7749.
Peng, X., Draney, D., Volcheck, W., Bashford, G., Lamb, D., Grone, D., Zhang,
Y., Johnson, C., Achilefu, S., Bornhop, D., et al. (2006). Phthalocyanine dye as
an extremely photostable and highly fluorescent near-infrared labeling reagent
- art. no. 60970E. Opt. Mol. Probes Biomed. Appl. 6097, E970.
Richard, J.P., Melikov, K., Vives, E., Ramos, C., Verbeure, B., Gait, M.J.,
Chernomordik, L.V., and Lebleu, B. (2003). Cell-penetrating peptides. A
reevaluation of the mechanism of cellular uptake. J. Biol. Chem. 278, 585–590.
Rink, J., Ghigo, E., Kalaidzidis, Y., and Zerial, M. (2005). Rab conversion
as a mechanism of progression from early to late endosomes. Cell 122,
735–749.

Please cite this article as: Adams et al., Multicolor Electron Microscopy for Simultaneous Visualization of Multiple Molecular Species, Cell ChemicalBiology (2016), http://dx.doi.org/10.1016/j.chembiol.2016.10.006
Schnell, U., Dijk, F., Sjollema, K.A., and Giepmans, B.N. (2012). Immunolabeling
artifacts and the need for live-cell imaging. Nat. Methods 9, 152–158.
Schnell, U., Cirulli, V., and Giepmans, B.N. (2013). EpCAM: structure and func-
tion in health and disease. Biochim. Biophys. Acta 1828, 1989–2001.
Shao, C.Y., Sondhi, R., van de Nes, P.S., and Sacktor, T.C. (2012). PKMz is
necessary and sufficient for synaptic clustering of PSD-95. Hippocampus
22, 1501–1507.
Shu, X.K., Lev-Ram, V., Deerinck, T.J., Qi, Y.C., Ramko, E.B., Davidson, M.W.,
Jin, Y.S., Ellisman, M.H., and Tsien, R.Y. (2011). A genetically encoded tag for
correlated light and electron microscopy of intact cells, tissues, and organ-
isms. PLoS Biol. 9, 10.
Takizawa, P.A., Yucel, J.K., Veit, B., Faulkner, D.J., Deerinck, T., Soto, G.,
Ellisman, M., and Malhotra, V. (1993). Complete vesiculation of Golgi mem-
branes and inhibition of protein transport by a novel sea sponge metabolite,
ilimaquinone. Cell 73, 1079–1090.
Cell Chemical Biology 23, 1417–1427, November 17, 2016 1427
Cell Chemical Biology, Volume 23
Supplemental Information
Multicolor Electron Microscopy for Simultaneous
Visualization of Multiple Molecular Species
Stephen R. Adams, Mason R. Mackey, Ranjan Ramachandra, Sakina F.Palida Lemieux, Paul Steinbach, Eric A. Bushong, Margaret T. Butko, Ben N.G.Giepmans, Mark H. Ellisman, and Roger Y. Tsien

Supplemental Data
NN
NO O
CO2H
O
O
O
OH2N
NH2
NH2
NHN
NN
CO2H
O O
HN
H2N
NH2NH2
CO2H HO2C
H2N
H2N NH2
NH2
NEt3
DMF
H2N
H2N
NH
NH2
O NN
OO
NNH
ONH2
NH2
NH2
OO
OO
Ln3+
LnCl3H2O, DMFpH 7 buffer
DTPA-DAB2
Figure S1 (related to Experimental Procedures): Synthesis of Ln-DAB from the reaction of DTPA anhydride and DAB to form DTPA-DAB2 and subsequent chelation of Ln3+. Only one of the many possible positional isomers of the product is drawn for clarity.
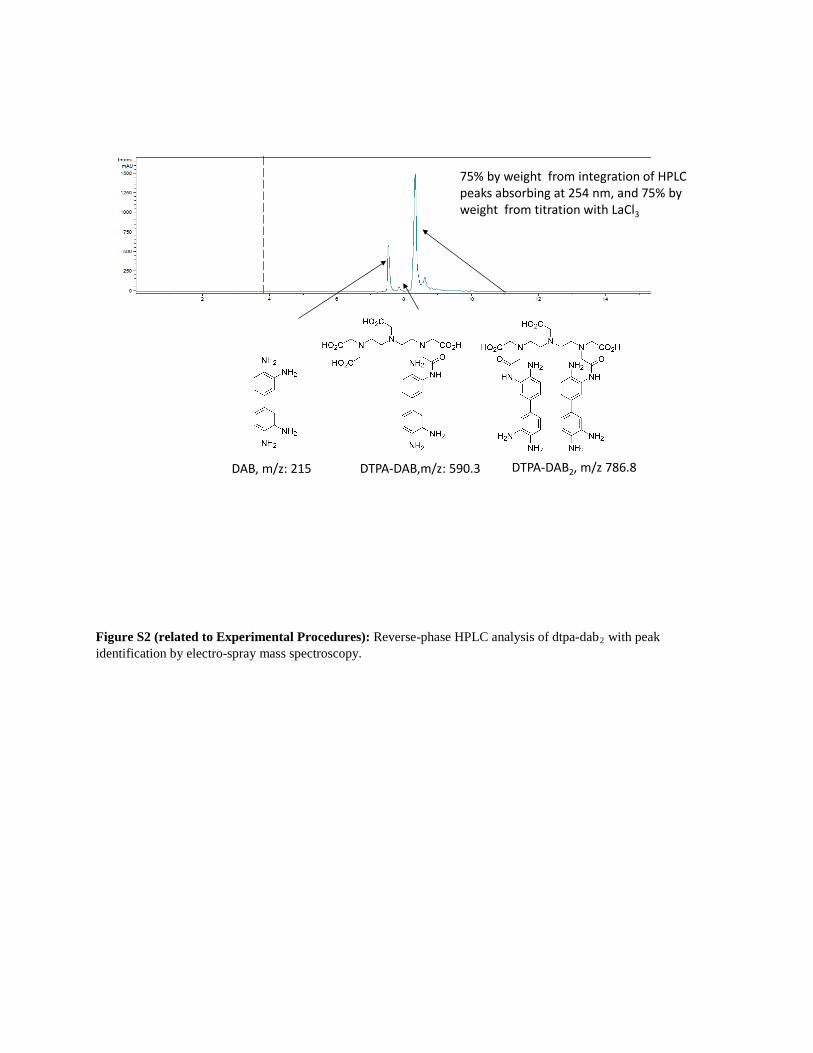
Figure S2 (related to Experimental Procedures): Reverse-phase HPLC analysis of dtpa-dab2 with peak identification by electro-spray mass spectroscopy.
75% by weight from integration of HPLC peaks absorbing at 254 nm, and 75% by weight from titration with LaCl3
DAB, m/z: 215 DTPA-DAB,m/z: 590.3 DTPA-DAB2, m/z 786.8
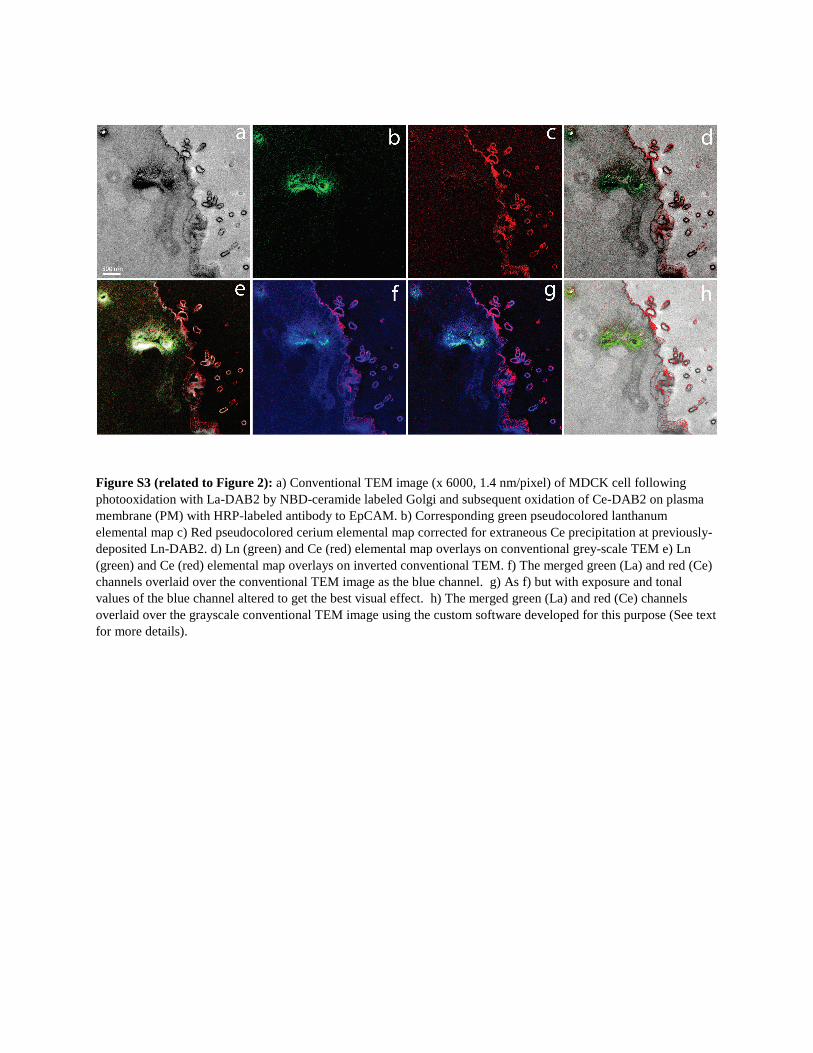
Figure S3 (related to Figure 2): a) Conventional TEM image (x 6000, 1.4 nm/pixel) of MDCK cell following photooxidation with La-DAB2 by NBD-ceramide labeled Golgi and subsequent oxidation of Ce-DAB2 on plasma membrane (PM) with HRP-labeled antibody to EpCAM. b) Corresponding green pseudocolored lanthanum elemental map c) Red pseudocolored cerium elemental map corrected for extraneous Ce precipitation at previously-deposited Ln-DAB2. d) Ln (green) and Ce (red) elemental map overlays on conventional grey-scale TEM e) Ln (green) and Ce (red) elemental map overlays on inverted conventional TEM. f) The merged green (La) and red (Ce) channels overlaid over the conventional TEM image as the blue channel. g) As f) but with exposure and tonal values of the blue channel altered to get the best visual effect. h) The merged green (La) and red (Ce) channels overlaid over the grayscale conventional TEM image using the custom software developed for this purpose (See text for more details).
HN CHC
H
O HN CHC
H
O HN CHC
CH2
O
CH2CH2NHCNH2
NH
HN CHC
CH2
O
CH2CH2NHCNH2
NH
HN CHC
CH2
O
CH2CH2NHCNH2
NH
HN CHC
CH2
O
CH2CH2NHCNH2
NH
HN CHC
CH2
O
CH2CH2NHCNH2
NH
HN CHC
CH2
O
CH2CH2NHCNH2
NH
HN CHC
CH2
O
CH2CH2NHCNH2
NH
HN CHC
CH2
O
CH2CH2NHCNH2
NH
HN CHC
CH2
O
CH2CH2NHCNH2
NH
HN CHC
CH2
NH2
O
CH2CH2NHCNH2
NH
Chemical Formula: C134H226N54O36S6Si32+
Exact Mass: 3443.51Molecular Weight: 3446.21
N
N N
N
N
N NN
Si
O O NH
O
O
OSiN+
OSiN+
HO3S
HO3S
HO3S
SO3H
HO3S
HO3S
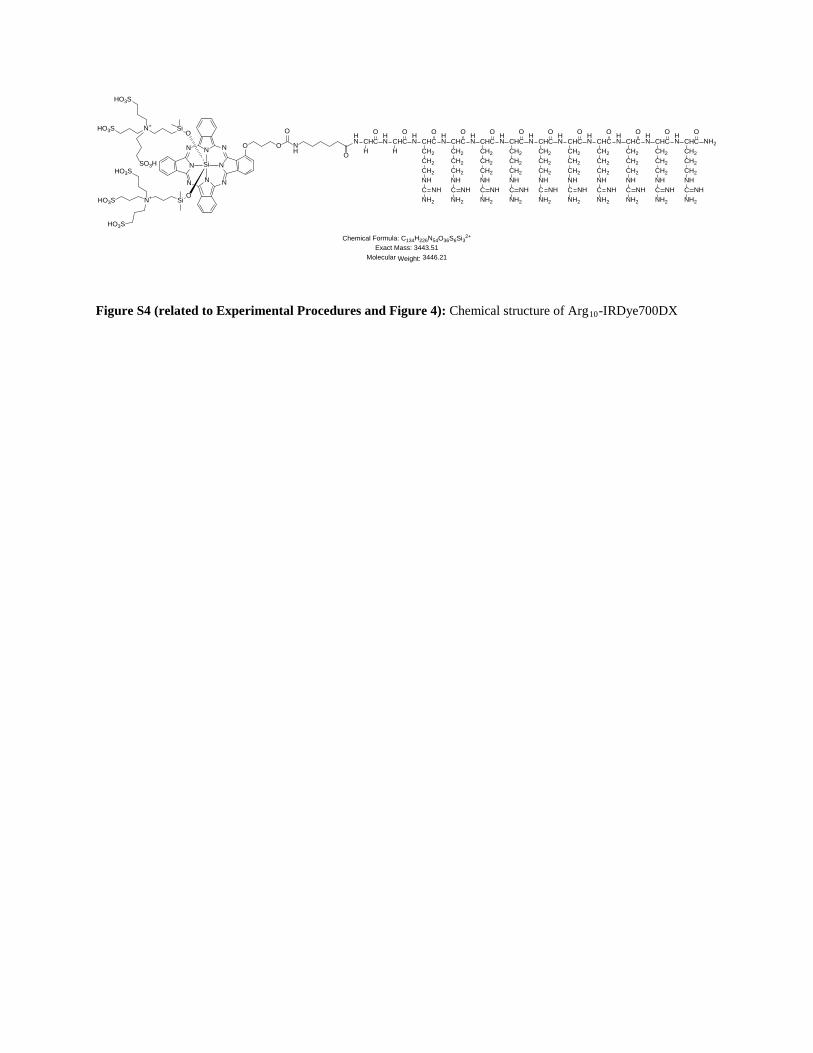
Figure S4 (related to Experimental Procedures and Figure 4): Chemical structure of Arg10-IRDye700DX
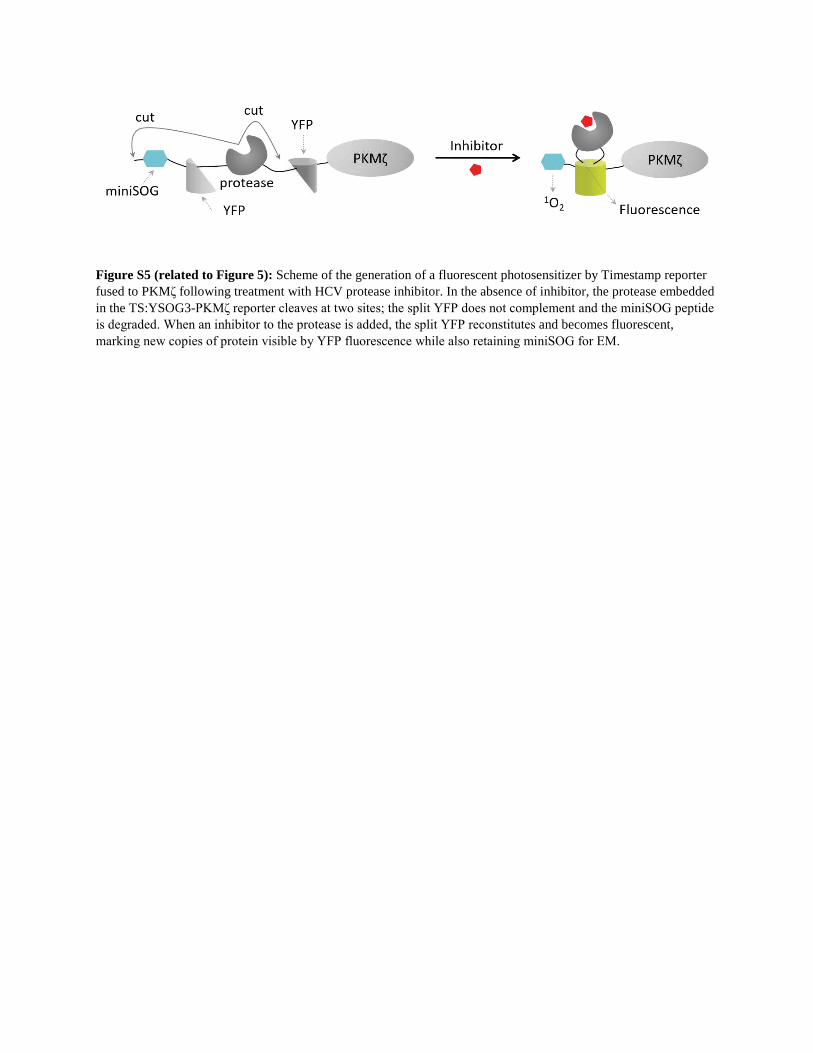
Figure S5 (related to Figure 5): Scheme of the generation of a fluorescent photosensitizer by Timestamp reporter fused to PKMζ following treatment with HCV protease inhibitor. In the absence of inhibitor, the protease embedded in the TS:YSOG3-PKMζ reporter cleaves at two sites; the split YFP does not complement and the miniSOG peptide is degraded. When an inhibitor to the protease is added, the split YFP reconstitutes and becomes fluorescent, marking new copies of protein visible by YFP fluorescence while also retaining miniSOG for EM.
Supplemental Experimental Procedures Energy-filtered transmission electron microscopy (EFTEM) image acquisition Traditionally, the core-loss elemental maps are obtained using the three-window method (Egerton, 1996), two pre-edge images for computation of the background and a post-edge image acquired on the core-loss signal. For the two-color labeling, the two lanthanide metals used are adjacent metals in the periodic table (either La and Ce or Ce and Pr), and there was a spectrum bleed-through of the metal with lower atomic number, showing up as a faded/faint signal in the elemental map of the higher atomic number lanthanide metal. This signal bleed-through was mainly due to the inaccurate background extrapolation in the three-window method. We devised a five-window method that uses four EFTEM images instead of two for interpolating the background. This estimate is a more precise statistical fit of background and therefore, minimizes any effects of signal bleed-through in the elemental maps. The five-window consists of two pre-edge and a post-edge image as before, but in addition has two EFTEM images obtained after the core-loss peak, which we will refer to as after-peak images. The elemental maps were computed using the EFTEM-TomoJ plug-in of ImageJ (Messaoudi, et al., 2013), the background fit was computed using the two pre-edge and the two after-peak image using the power law fit. The electron energy-loss spectrum was acquired using the Ultrascan 4000 CCD detector from Gatan (Pleasanton, CA, USA). The conventional images and elemental maps were acquired using both the Ultrascan 4000 detector and the direct detection device (DDD) DE-12 from Direct Electron LP. (San Diego, CA). The DE-12 detector has a high modulation transfer function (MTF) and provides better spatial resolution (Jin et al., 2008), but is ~1/3 the size of Ultrascan 4000 detector and therefore, has a much smaller field of view. The EFTEM images obtained with the Ultrascan 4000 detector were binned by 4 x 4 pixels to improve the SNR, no binning was applied to images obtained with the DE-12 detector. Also, the EFTEM images obtained with the Ultrascan 4000 detector were dark current subtracted and flatfield corrected, the DE-12 EFTEM images were only dark current subtracted. To get reasonable SNR in core-loss EFTEM images, exposures exceeding several minutes are generally required. As specimen and aperture drift during such long exposures often deteriorates the image quality, an efficient alternative is to obtain series of short exposure images, and use drift correction to subsequently align and merge these individual images to form a single image (Aoyama, et al., 2002; Heil and Kohl, 2010; Ramachandra, et al., 2014; Schaffer, et al., 2004; Terada, et al., 2001). The drift in the images was calculated using the Template Matching plug-in in ImageJ (Tseng, et al., 2011); however, for datasets with very low signal or absence of sharp features this method did not yield satisfactory results. For such datasets, gold nanoparticles dispersed on the samples were used as fiducial markers for alignment using MTrackJ plugin of ImageJ (Meijering, et al., 2012). For calculation of drift vectors, a Gaussian blur of radius 0.7 – 3 pixels were applied to calculate the drift vectors only, and final merged image was obtained from the drift corrected raw images without any Gaussian blur. Initially, the entire series of the EFTEM images were collected at one energy window before proceeding to the next energy window, in a sequential manner. However, this had the disadvantage that if sample shrinkage or warping occurred during the acquisition of a particular energy window, then it subsequently caused the elemental map to have image artifacts in the form of appearance of shadow at certain regions. We devised an alternate methodology, by which we acquire a set of short exposure images successively through all the energy windows and then acquire the next set through all the energy windows and so on. This interlaced acquisition has the advantage over sequential acquisition, that any sample shrinkage/warping and high tension instabilities over time, affected the images through all the energy windows equally. This acquisition routine was automated by writing macro’s in Digital Micrograph (Gatan, Inc) and Serial EM (Mastronarde, 2005) for the control of Ultrascan 4000 and DE-12 detectors respectively. All elemental maps are obtained through the interlaced acquisition routine unless otherwise mentioned explicitly. The Ultrascan 4000 is a scintillator based CCD detector, and EFTEM images acquired from them are susceptible to point blemishes occurring as bright pixels, caused by spurious X-rays hitting the scintillator screen (Anderson, 2008). Most of the point blemishes are single binned pixels (i.e. 4 x 4 pixels), and occasionally can spread to 2 – 4 binned pixels. These are undesirable, as they tend to skew the histogram of the elemental maps. To mitigate the effect of these point blemishes, a simple image processing routine was developed in Digital Micrograph. A region with the highest signal in the pre-edge1 image was selected, the mean (µ) and standard deviation (σ) of signal in this region was measured. The counts on each pixel (i.e., pixel intensity) for all the raw EFTEM images of the dataset was checked to see if its value was greater than µ and if the gradient with its four diagonal pixels was greater than

7σ; if so it was marked as a bright pixel or point blemish and its intensity was changed to the average of its four diagonal pixels. The number of point blemish typically varied from 2 – 10 binned pixels/image and 40 – 150 binned pixels/image (1k x 1k) at 200 KV and 300KV respectively, depending on the sample and acquisition conditions. The effect of X rays on the EFTEM images acquired on the DE-12 detector is negligible and no correction was required for them (Ramachandra, et al., 2014). EFTEM acquisition parameters: For the core-loss EFTEM images of the MDCK cells (NBD ceramide/EpCAM) sample, a series of nine images with a 60 s exposure/image, was acquired by the Ultrascan 4000 detector at 200 KV and a magnification of 8kX (pixel size 4.4 nm) for each energy window. The pre-edge and after-peak images were obtained at energy shifts of 758, 804, 947 and 990 eV. The La and Ce post-edge images were obtained at 850 and 902 eV respectively. The EFTEM images were acquired at a beam dose rate of ~ 9.8 X 10⁻⁵ PA/nm2 and the total beam dose for the acquisition was ~ 2.0 X 10⁶ e-/ nm2. For the core-loss EFTEM images (i.e. pre-edge, post-edge and after-peak images) of the astrocyte sample, a series of 19 images for each energy window with a 50 s exposure/image, was acquired by the DE-12 detector at 300 KV, and at a magnification of 12kX (pixel size 0.42 nm). The pre-edge and after-peak images were obtained at an energy shift of 815, 855, 995 and 1030 eV. The Ce and Pr post-edge images were obtained at 899 and 947 eV respectively. The EFTEM images were acquired at a beam dose rate of ~ 1.9 X 10⁻⁴ PA/nm2 and the total beam dose for the acquisition was ~ 6.9 X 10⁶ e-/ nm2. For the core-loss EFTEM images of the regular endosome sample, a series of 12 images for each energy window with a 50 sec exposure/image, was acquired by the DE-12 detector at 300 KV, and at a magnification of 25kX (pixel size 0.2 nm). The pre-edge and after-peak images were obtained at energy shifts of 815, 860, 985 and 1030 eV. The Ce and Pr post-edge images were obtained at 899 and 947 eV respectively. The energy windows were not acquired through the interlaced acquisition procedure, but rather sequentially. Gold nanoparticles (15 nm) were dispersed on the section to facilitate drift alignment. The EFTEM images were acquired at a beam dose rate of ~ 1.9 X 10⁻³ PA/nm2 and the total beam dose for the acquisition was ~ 4.4 X 10⁷ e-/ nm2. For the core-loss EFTEM images of the multivesicular bodies, a series of five images for each energy window with a 60 sec exposure/image, was acquired by the Ultrascan 4000 detector at 300 KV and at a magnification of 20kX (pixel size 1.8 nm). The pre-edge and after-peak images were obtained at energy shifts of 815, 850, 995 and 1030 eV. The Ce and Pr post-edge images were obtained at 899 and 947 eV respectively. The EFTEM images were acquired at a beam dose rate of ~ 5.4 X 10⁻⁴ PA/nm2 and the total beam dose for the acquisition was ~ 6.0 X 10⁶ e-/ nm2. For the PKMζ localization in cultured neurons (stimulated cell), a series of seven images for each energy window each at 40 s exposure, was acquired by the Ultrascan 4000 detector at 300 KV, and at a magnification of 8kX (unbinned pixel size 4.4 nm). The pre-edge and after-peak images were obtained at energy shifts of 815, 855, 995 and 1040 eV. The Ce post-edge images were obtained 899 eV. A second set of higher resolution EFTEM maps was obtained on the same region and with the same energy windows, at a magnification of 25 kX (unbinned pixel size 0.2 nm) by the DE-12 detector at 200 KV. For this dataset, a series of 25 images for each energy window with a 50 s exposure/image was acquired. The EFTEM images on the Ultrascan 4000 were acquired at a beam dose rate of ~ 1.8 X 10⁻⁴ PA/nm2 and the total beam dose for the acquisition was ~ 1.9 X 10⁶ e-/ nm2. The EFTEM images on the DE-12 were acquired at a beam dose rate of ~ 1.4 X 10⁻³ PA/nm2 and the total beam dose for the acquisition was ~ 6.4 X 10⁷ e-/ nm2. For the PKMζ localization in cultured neurons (unstimulated cell), a series of seven images for each energy window with a 40 s exposure/image was acquired by the Ultrascan 4000 detector at 300 KV, and at a magnification of 8kX (unbinned pixel size 4.4 nm). The pre-edge and after-peak images were obtained at energy shifts of 815, 855, 995 and 1040 eV. The Ce post-edge images were obtained 899 eV. The EFTEM images were acquired at a beam dose rate of ~ 1.8 X 10⁻⁴ PA/nm2 and the total beam dose for the acquisition was ~ 1.9 X 10⁶ e-/ nm2. Correction for spectral contamination in EFTEM: For the astrocyte and MIDK cells dataset, there was a chemical bleed-through due to the higher atomic number lanthanide metal sticking to regions intended to be labeled by the lower atomic number lanthanide metal only. This was probably due to incomplete blocking of the first Ln-DAB. The chemical bleed-through was subtracted out by post-processing the elemental maps by the following procedure. The spectra from the two regions were normalized to approximately the same background counts. The spectra from region 1, contained the elemental edge of the higher atomic number metal only. The spectra from region 2, contained the elemental edge from both the lower atomic

number Ln and the higher atomic number Ln (bleed-through). The relative percentage of the higher atomic number Ln in spectra 2 compared to spectra 1 was calculated by integrating the signal counts for the edge in the two spectra. To ensure that the contribution from only the edge was counted, a small 10 eV background window was positioned, such that the base between the 2 peaks of the edge was at the background subtracted zero. This relative percentage or bleed-through was ~ 25 % and 45 % for the astrocyte and MDCK samples respectively. The bleed-through in spectra 2 was removed by subtracting it from spectra 1 corrected for the relative percentage. It should be noted that the spectra of higher atomic number metal in spectra 2 is a convolution of its edge with the energy-loss near edge structure and extended energy-loss fine structure of the lower atomic number edge, which tends to make the width of the elemental edge broader as compared with spectra 1. Therefore, the corrected spectra may show regions of uneven slope. A similar bleed-through subtraction was applied to the EFTEM elemental maps. For the astrocyte example, the bleed-through subtraction of the elemental maps was fairly uniform. However, for the MDCK cells example, the bleed-through subtraction led to some pixels being over subtracted and having negative values, which were set to zero.

![MuSCAT: a multicolor simultaneous camera for studying ... · arXiv:1509.03154v1 [astro-ph.IM] 10 Sep 2015 MuSCAT: a multicolor simultaneous camera for studying atmospheres of transiting](https://img.dokumen.tips/doc/110x75/6079f925f4895d184472f6aa/muscat-a-multicolor-simultaneous-camera-for-studying-arxiv150903154v1-astro-phim.jpg)