Embed Size (px)
Citation preview
TO DOWNLOAD A COPY OF THIS POSTER, VISIT WWW.WATERS.COM/POSTERS
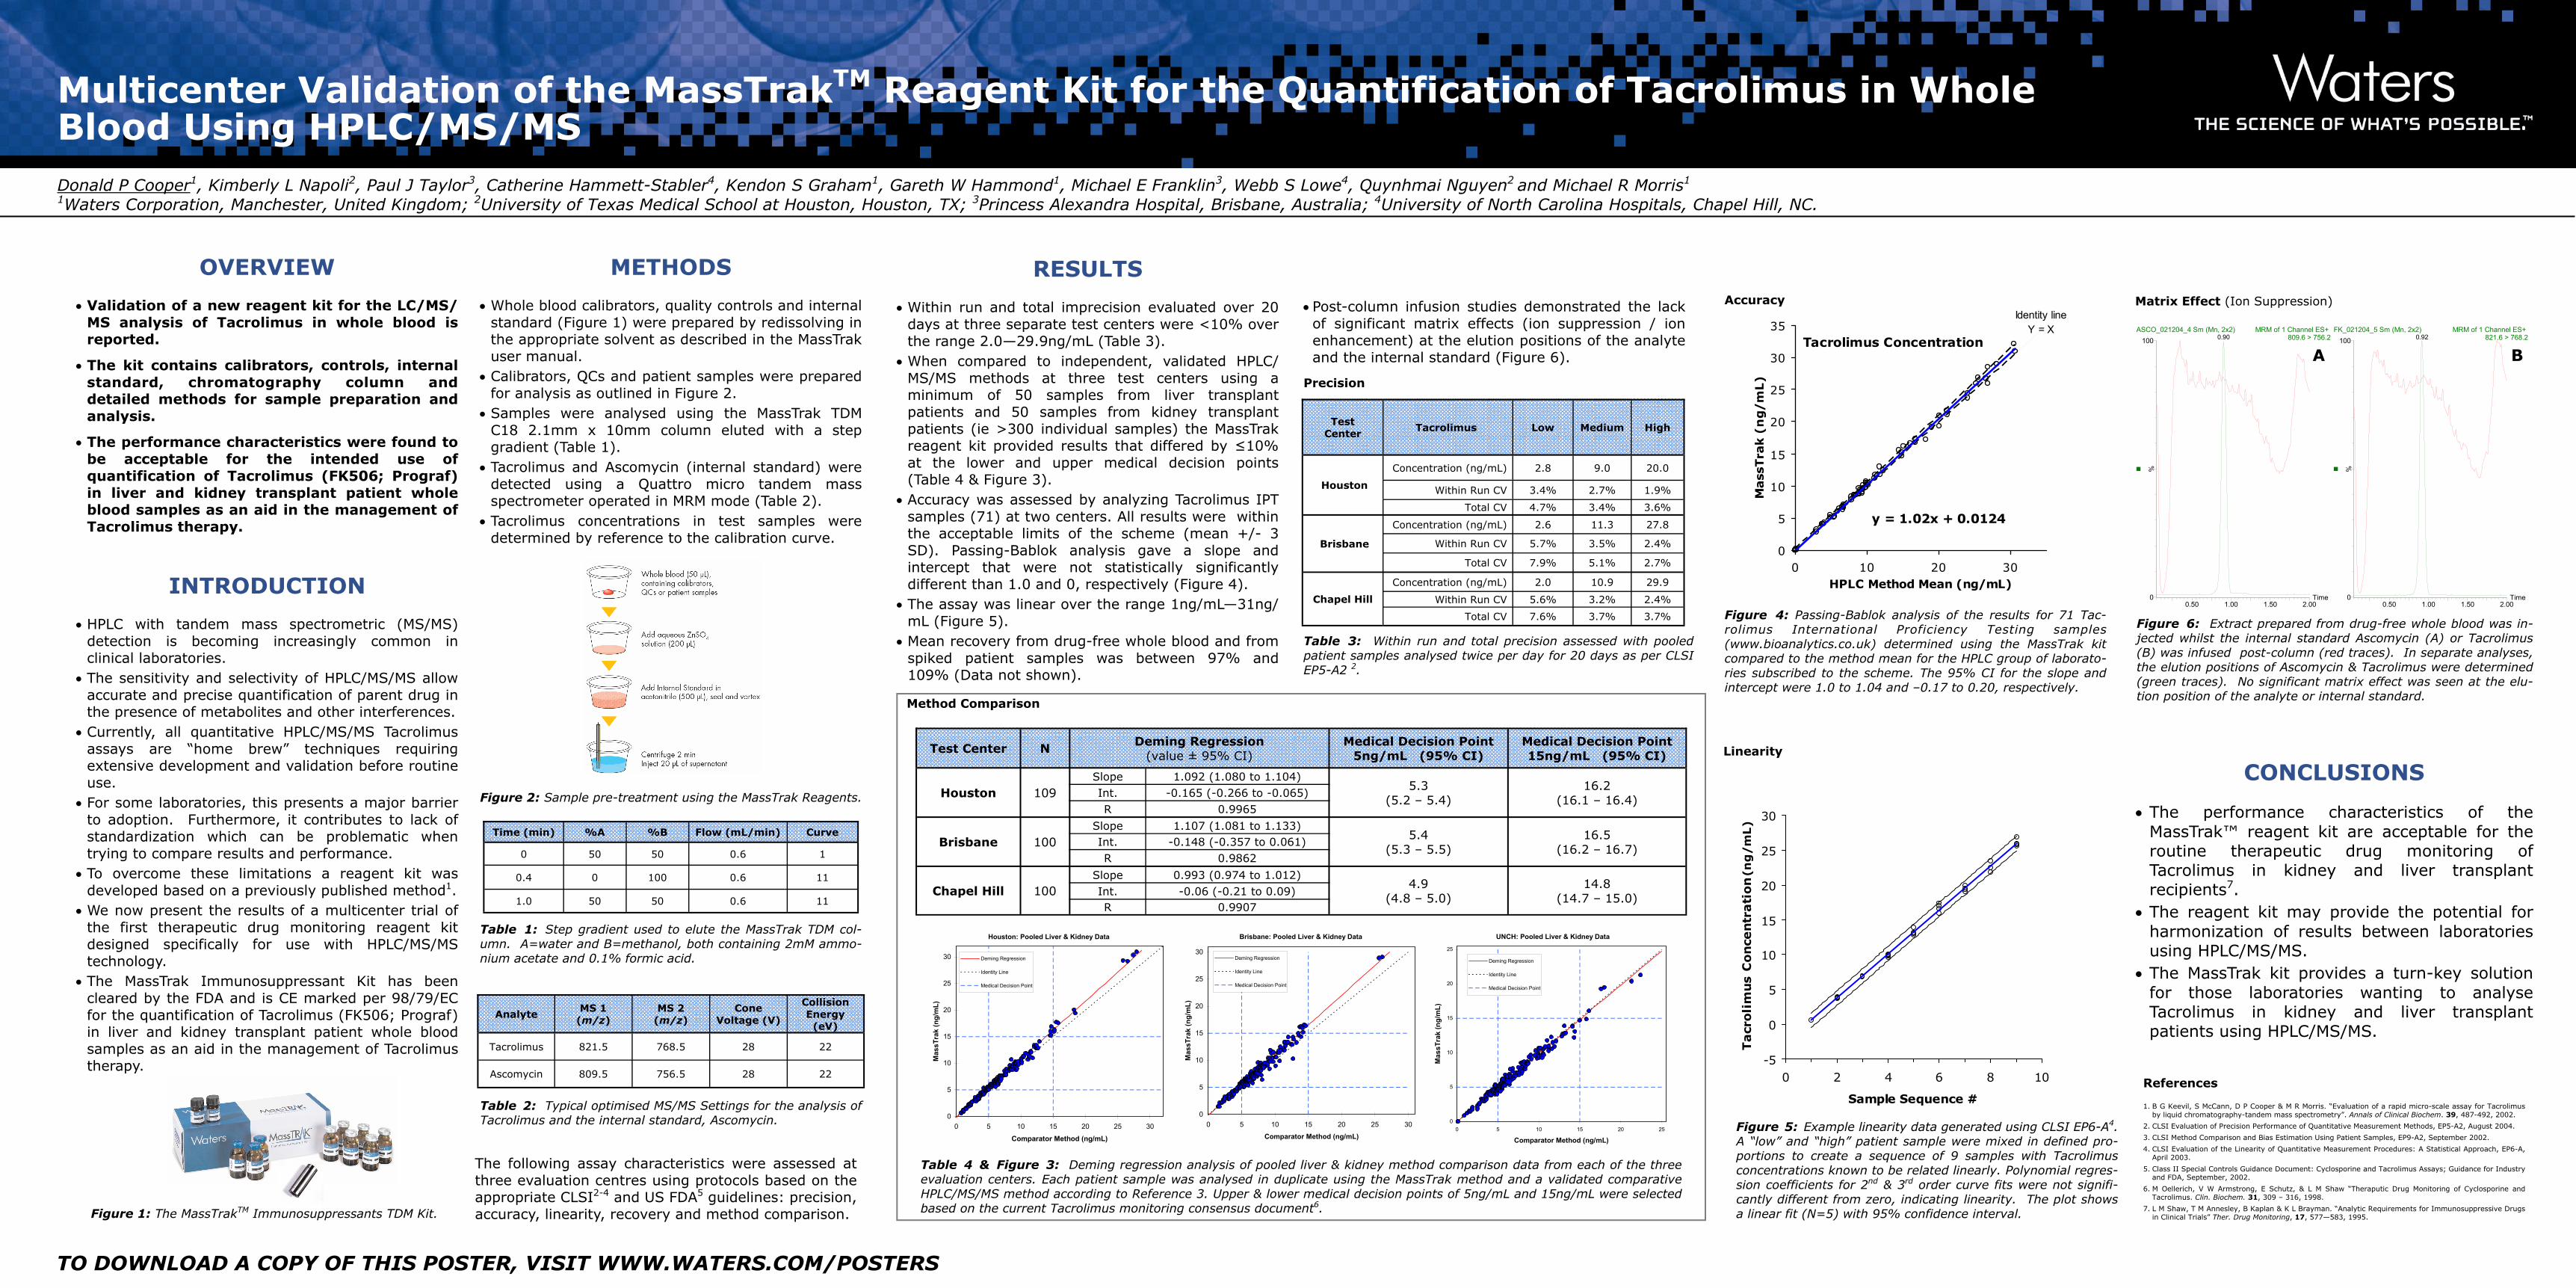
INTRODUCTION
• HPLC with tandem mass spectrometric (MS/MS) detection is becoming increasingly common in clinical laboratories.
• The sensitivity and selectivity of HPLC/MS/MS allow accurate and precise quantification of parent drug in the presence of metabolites and other interferences.
• Currently, all quantitative HPLC/MS/MS Tacrolimus assays are “home brew” techniques requiring extensive development and validation before routine use.
• For some laboratories, this presents a major barrier to adoption. Furthermore, it contributes to lack of standardization which can be problematic when trying to compare results and performance.
• To overcome these limitations a reagent kit was developed based on a previously published method1.
• We now present the results of a multicenter trial of the first therapeutic drug monitoring reagent kit designed specifically for use with HPLC/MS/MS technology.
• The MassTrak Immunosuppressant Kit has been cleared by the FDA and is CE marked per 98/79/EC for the quantification of Tacrolimus (FK506; Prograf) in liver and kidney transplant patient whole blood samples as an aid in the management of Tacrolimus therapy.
Figure 1: The MassTrakTM Immunosuppressants TDM Kit.
Multicenter Validation of the MassTrakTM Reagent Kit for the Quantification of Tacrolimus in Whole Blood Using HPLC/MS/MS Donald P Cooper1, Kimberly L Napoli2, Paul J Taylor3, Catherine Hammett-Stabler4, Kendon S Graham1, Gareth W Hammond1, Michael E Franklin3, Webb S Lowe4, Quynhmai Nguyen2 and Michael R Morris1 1Waters Corporation, Manchester, United Kingdom; 2University of Texas Medical School at Houston, Houston, TX; 3Princess Alexandra Hospital, Brisbane, Australia; 4University of North Carolina Hospitals, Chapel Hill, NC.
OVERVIEW
• Validation of a new reagent kit for the LC/MS/MS analysis of Tacrolimus in whole blood is reported.
• The kit contains calibrators, controls, internal standard, chromatography column and detailed methods for sample preparation and analysis.
• The performance characteristics were found to be acceptable for the intended use of quantification of Tacrolimus (FK506; Prograf) in liver and kidney transplant patient whole blood samples as an aid in the management of Tacrolimus therapy.
Figure 2: Sample pre-treatment using the MassTrak Reagents.
Tacrolimus Concentration
Identity lineY = X
y = 1.02x + 0.0124
0
5
10
15
20
25
30
35
0 10 20 30HPLC Method Mean (ng/mL)
Mass
Tra
k (
ng/m
L)
Figure 4: Passing-Bablok analysis of the results for 71 Tac-rolimus International Proficiency Testing samples (www.bioanalytics.co.uk) determined using the MassTrak kit compared to the method mean for the HPLC group of laborato-ries subscribed to the scheme. The 95% CI for the slope and intercept were 1.0 to 1.04 and –0.17 to 0.20, respectively.
Accuracy
Linearity
RESULTS
• Within run and total imprecision evaluated over 20 days at three separate test centers were <10% over the range 2.0—29.9ng/mL (Table 3).
• When compared to independent, validated HPLC/MS/MS methods at three test centers using a minimum of 50 samples from liver transplant patients and 50 samples from kidney transplant patients (ie >300 individual samples) the MassTrak reagent kit provided results that differed by ≤10% at the lower and upper medical decision points (Table 4 & Figure 3).
• Accuracy was assessed by analyzing Tacrolimus IPT samples (71) at two centers. All results were within the acceptable limits of the scheme (mean +/- 3 SD). Passing-Bablok analysis gave a slope and intercept that were not statistically significantly different than 1.0 and 0, respectively (Figure 4).
• The assay was linear over the range 1ng/mL—31ng/mL (Figure 5).
• Mean recovery from drug-free whole blood and from spiked patient samples was between 97% and 109% (Data not shown).
-5
0
5
10
15
20
25
30
0 2 4 6 8 10
Sample Sequence #
Ta
cro
lim
us C
on
cen
tra
tio
n (n
g/m
L)
Figure 5: Example linearity data generated using CLSI EP6-A4. A “low” and “high” patient sample were mixed in defined pro-portions to create a sequence of 9 samples with Tacrolimus concentrations known to be related linearly. Polynomial regres-sion coefficients for 2nd & 3rd order curve fits were not signifi-cantly different from zero, indicating linearity. The plot shows a linear fit (N=5) with 95% confidence interval.
Table 3: Within run and total precision assessed with pooled patient samples analysed twice per day for 20 days as per CLSI EP5-A2 2.
Precision
Test Center
Tacrolimus Low Medium High
Houston
Concentration (ng/mL) 2.8 9.0 20.0
Within Run CV 3.4% 2.7% 1.9%
Total CV 4.7% 3.4% 3.6%
Brisbane
Concentration (ng/mL) 2.6 11.3 27.8
Within Run CV 5.7% 3.5% 2.4%
Total CV 7.9% 5.1% 2.7%
Chapel Hill
Concentration (ng/mL) 2.0 10.9 29.9
Within Run CV 5.6% 3.2% 2.4%
Total CV 7.6% 3.7% 3.7%
CONCLUSIONS
• The performance characteristics of the MassTrak™ reagent kit are acceptable for the routine therapeutic drug monitoring of Tacrolimus in kidney and liver transplant recipients7.
• The reagent kit may provide the potential for harmonization of results between laboratories using HPLC/MS/MS.
• The MassTrak kit provides a turn-key solution for those laboratories wanting to analyse Tacrolimus in kidney and liver transplant patients using HPLC/MS/MS.
Analyte MS 1
(m/z) MS 2
(m/z) Cone
Voltage (V)
Collision Energy
(eV)
Tacrolimus 821.5 768.5 28 22
Ascomycin 809.5 756.5 28 22
Table 2: Typical optimised MS/MS Settings for the analysis of Tacrolimus and the internal standard, Ascomycin.
Time (min) %A %B Flow (mL/min) Curve
0 50 50 0.6 1
0.4 0 100 0.6 11
1.0 50 50 0.6 11
Table 1: Step gradient used to elute the MassTrak TDM col-umn. A=water and B=methanol, both containing 2mM ammo-nium acetate and 0.1% formic acid.
METHODS
• Whole blood calibrators, quality controls and internal standard (Figure 1) were prepared by redissolving in the appropriate solvent as described in the MassTrak user manual.
• Calibrators, QCs and patient samples were prepared for analysis as outlined in Figure 2.
• Samples were analysed using the MassTrak TDM C18 2.1mm x 10mm column eluted with a step gradient (Table 1).
• Tacrolimus and Ascomycin (internal standard) were detected using a Quattro micro tandem mass spectrometer operated in MRM mode (Table 2).
• Tacrolimus concentrations in test samples were determined by reference to the calibration curve.
The following assay characteristics were assessed at three evaluation centres using protocols based on the appropriate CLSI2-4 and US FDA5 guidelines: precision, accuracy, linearity, recovery and method comparison.
Method Comparison
Table 4 & Figure 3: Deming regression analysis of pooled liver & kidney method comparison data from each of the three evaluation centers. Each patient sample was analysed in duplicate using the MassTrak method and a validated comparative HPLC/MS/MS method according to Reference 3. Upper & lower medical decision points of 5ng/mL and 15ng/mL were selected based on the current Tacrolimus monitoring consensus document6.
Houston: Pooled Liver & Kidney Data
0
5
10
15
20
25
30
0 5 10 15 20 25 30
Comparator Method (ng/mL)
Mas
sTra
k (n
g/m
L)
Deming Regression
Identity Line
Medical Decision Point
Brisbane: Pooled Liver & Kidney Data
0
5
10
15
20
25
30
0 5 10 15 20 25 30
Comparator Method (ng/mL)
Mas
sTra
k (n
g/m
L)
Deming Regression
Identity Line
Medical Decision Point
UNCH: Pooled Liver & Kidney Data
0
5
10
15
20
25
0 5 10 15 20 25
Comparator Method (ng/mL)
Mas
sTra
k (n
g/m
L)
Deming Regression
Identity Line
Medical Decision Point
Test Center N Deming Regression
(value ± 95% CI) Medical Decision Point
5ng/mL (95% CI) Medical Decision Point 15ng/mL (95% CI)
Houston 109 Slope 1.092 (1.080 to 1.104)
5.3 (5.2 – 5.4)
16.2 (16.1 – 16.4)
Int. -0.165 (-0.266 to -0.065) R 0.9965
Brisbane 100 Slope 1.107 (1.081 to 1.133)
5.4 (5.3 – 5.5)
16.5 (16.2 – 16.7)
Int. -0.148 (-0.357 to 0.061) R 0.9862
Chapel Hill 100 Slope 0.993 (0.974 to 1.012)
4.9 (4.8 – 5.0)
14.8 (14.7 – 15.0)
Int. -0.06 (-0.21 to 0.09) R 0.9907
1. B G Keevil, S McCann, D P Cooper & M R Morris. “Evaluation of a rapid micro-scale assay for Tacrolimus by liquid chromatography-tandem mass spectrometry”. Annals of Clinical Biochem. 39, 487-492, 2002.
2. CLSI Evaluation of Precision Performance of Quantitative Measurement Methods, EP5-A2, August 2004.
3. CLSI Method Comparison and Bias Estimation Using Patient Samples, EP9-A2, September 2002.
4. CLSI Evaluation of the Linearity of Quantitative Measurement Procedures: A Statistical Approach, EP6-A, April 2003.
5. Class II Special Controls Guidance Document: Cyclosporine and Tacrolimus Assays; Guidance for Industry and FDA, September, 2002.
6. M Oellerich, V W Armstrong, E Schutz, & L M Shaw “Theraputic Drug Monitoring of Cyclosporine and Tacrolimus. Clin. Biochem. 31, 309 – 316, 1998.
7. L M Shaw, T M Annesley, B Kaplan & K L Brayman. “Analytic Requirements for Immunosuppressive Drugs in Clinical Trials” Ther. Drug Monitoring, 17, 577—583, 1995.
References
Figure 6: Extract prepared from drug-free whole blood was in-jected whilst the internal standard Ascomycin (A) or Tacrolimus (B) was infused post-column (red traces). In separate analyses, the elution positions of Ascomycin & Tacrolimus were determined (green traces). No significant matrix effect was seen at the elu-tion position of the analyte or internal standard.
Time0.50 1.00 1.50 2.00
%
0
100ASCO_021204_4 Sm (Mn, 2x2) MRM of 1 Channel ES+
809.6 > 756.21.46e4
0.90
Time0.50 1.00 1.50 2.00
%
0
100FK_021204_5 Sm (Mn, 2x2) MRM of 1 Channel ES+
821.6 > 768.21.97e4
0.92
A B
Matrix Effect (Ion Suppression)
• Post-column infusion studies demonstrated the lack of significant matrix effects (ion suppression / ion enhancement) at the elution positions of the analyte and the internal standard (Figure 6).