Embed Size (px)
Citation preview
1
Multibreed herd, growth, feed efficiency, ultrasound, carcass,
genetic-genomic research
M. A. Elzo University of Florida
Data Recording System
Genomics Research
Genetics Research
Mating System
The UF Multibreed Herd

2
Data Recording System
Genomics Research
Genetics Research
Mating System
The UF Multibreed Herd
Data Recording: Types of Data
Pedigree: Animal, Sire, Dam, Mgs, Mgd, breed fractions Mating Data: AI & NS sires, AI Dates, NS Dates Phenotypic Data: {Growth, Reproduction, Survival, Feed Intake, Ultrasound, Carcass} {Dates and Traits} Genomic Data: Alleles for all SNP in a chip {3K, 50K, 770K, Complete Sequence}
Data Recording: Database Files
Calves (yearly, accumulated)
Pedigree, Breed Fractions, Survival, Growth, Ultrasound, Feed Efficiency, Carcass, Meat Palatability
Dams (yearly, accumulated)
Pedigree, Breed Fractions, Reproduction, Weights, Condition Scores, ELISA ParaTBC
Sires (yearly, accumulated)
Pedigree, Breed Fractions, Semen Dosages, Sire Usage
Genotypes (accumulated)
Illumina3K, Illumina50K, IlluminaHD, Complete DNA Sequence
Calf File 2011: Pedigree Data Calf File 2011: PreWean Growth Data

3
Calf File 2011: Feed Efficiency Data Calf File 2011: Ultrasound Data
Calf File 2011: Carcass Data Calf File 2011: Meat Palatability Data
Cow File 2011: Ped & Mating Data Cow File 2011: NS & Calving Data
4
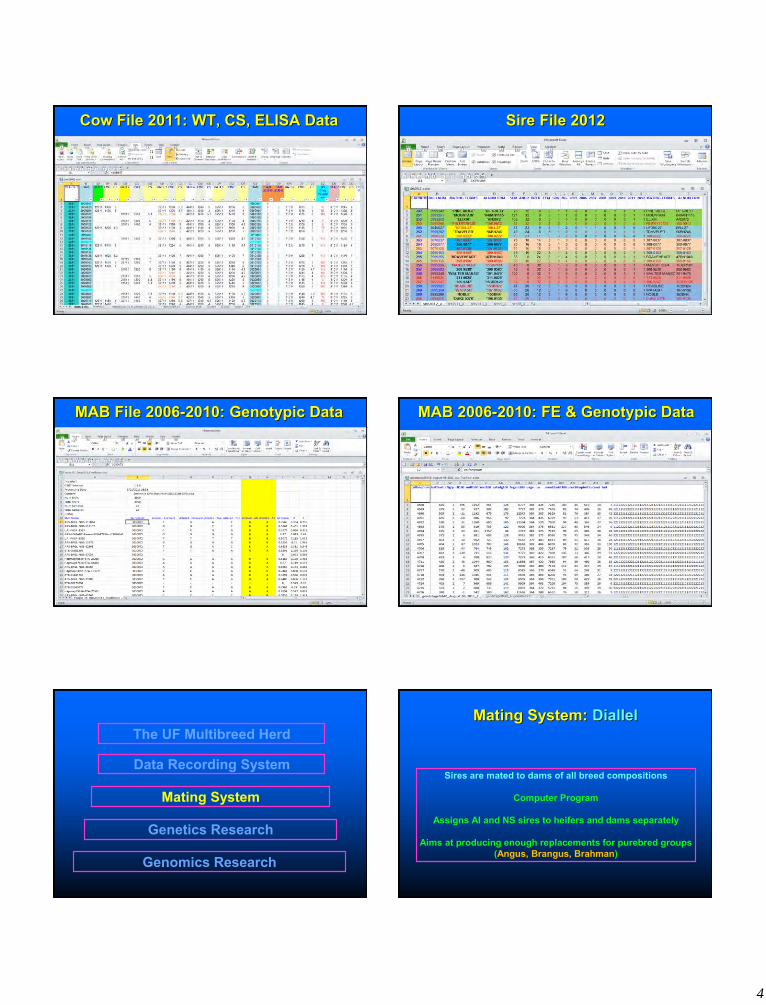
Cow File 2011: WT, CS, ELISA Data Sire File 2012
MAB File 2006-2010: Genotypic Data MAB 2006-2010: FE & Genotypic Data
Data Recording System
Genomics Research
Genetics Research
Mating System
The UF Multibreed Herd Mating System: Diallel
Sires are mated to dams of all breed compositions
Computer Program
Assigns AI and NS sires to heifers and dams separately
Aims at producing enough replacements for purebred groups (Angus, Brangus, Brahman)
5
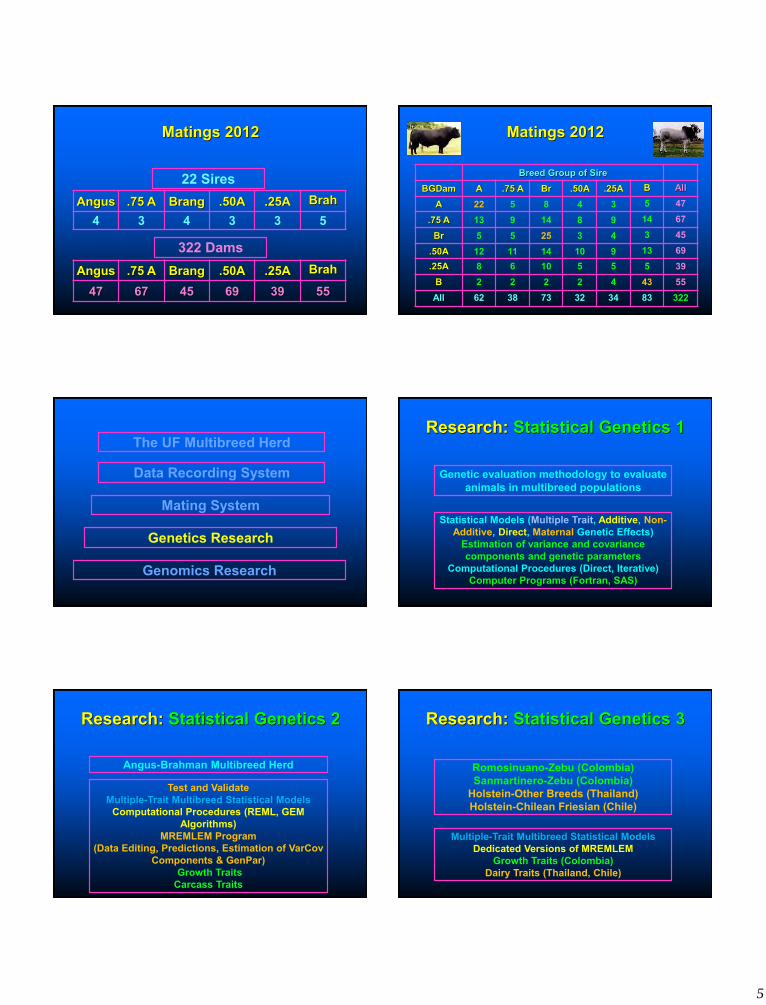
Matings 2012
22 Sires Angus .75 A Brang .50A .25A Brah
4 3 4 3 3 5
322 Dams Angus .75 A Brang .50A .25A Brah
47 67 45 69 39 55
Matings 2012
Breed Group of Sire BGDam A .75 A Br .50A .25A B All
A 22 5 8 4 3 5 47
.75 A 13 9 14 8 9 14 67
Br 5 5 25 3 4 3 45
.50A 12 11 14 10 9 13 69
.25A 8 6 10 5 5 5 39 B 2 2 2 2 4 43 55 All 62 38 73 32 34 83 322
Data Recording System
Genomics Research
Genetics Research
Mating System
The UF Multibreed Herd Research: Statistical Genetics 1
Genetic evaluation methodology to evaluate animals in multibreed populations
Statistical Models (Multiple Trait, Additive, Non-Additive, Direct, Maternal Genetic Effects)
Estimation of variance and covariance components and genetic parameters
Computational Procedures (Direct, Iterative) Computer Programs (Fortran, SAS)
Research: Statistical Genetics 2
Angus-Brahman Multibreed Herd
Test and Validate Multiple-Trait Multibreed Statistical Models
Computational Procedures (REML, GEM Algorithms)
MREMLEM Program (Data Editing, Predictions, Estimation of VarCov
Components & GenPar) Growth Traits Carcass Traits
Research: Statistical Genetics 3
Romosinuano-Zebu (Colombia) Sanmartinero-Zebu (Colombia)
Holstein-Other Breeds (Thailand) Holstein-Chilean Friesian (Chile)
Multiple-Trait Multibreed Statistical Models Dedicated Versions of MREMLEM
Growth Traits (Colombia) Dairy Traits (Thailand, Chile)

6
Research: Feed Efficiency & Postweaning Growth
HATCH & TSTAR Projects
NFREC GrowSafe FE Facility Marianna, FL
24 pens – 16 - 20 calves/pen
Objectives
Effect of breed composition and temperament (chute score, exit velocity) on
RFI, DFI, FCR, PWG
Estimate genetic parameters for RFI, DFI, FCR, PWG

7
Intake: Feed, Water (Real time) Growth: Dates, weights, Hip Ht (2 wk)
Temperament: Chute Score, Exit Vel (2 wk) Ultrasound: UREA, UIMF, UBF
Data Recording at FEF
Calves: Bulls, Heifers, Steers AdjPeriod: 21 d; Trial: 70 d
Pens: 24; Calves/pen: 14 - 16
Data
Brooksville (100 calves) Gainesville (388 calves)
Marianna (93 calves)
3 Herds: Brooksville, Gainesville, Marianna 2 Years: 2006 – 2007 Number Calves: 581
Calves 2006-2007 BKV-GNV-MAR
n = 581 Breed Group of Sire BGDam A .75 A Br .50A .25A B
A 80 7 42 7 8 21 .75 A 18 9 7 9 12 11
Br 16 2 70 2 3 4 .50A 18 17 24 11 16 20 .25A 8 6 6 8 6 5
B 14 0 0 0 0 84

8
Computation of RFI
Daily feed intake =
Avge daily gain +
Metabolic Mid-wt +
Residual feed intake
Definition of RFI groups
High = RFI > 0.9 kg DM/d
Low = RFI < - 0.9 kg DM/d
Med = - 0.9 kg DM/d ≤ RFI ≤ 0.9 kg DM/d
Model for RFI
RFI =
herd-year-pen + age of dam + sex of calf + age calf
+ BFcalf (sex)+ Het calf (sex) + mean chute score + mean exit velocity
+ sire + residual
Sex Bulls similar RFI to Steers
Heifers less efficient (higher RFI) than steers (1.24 ± 0.36 kg DM/d)
Residual Feed Intake
Breed Bulls and Steers: Similar RFI from A to B Heifers: RFI decreased as B % increased
(-1.29 ± 0.28 kg DM/d; more efficient)
Model for FCR, DFI, PWG
FCR, DFI, PWG =
herd-year-pen + age of dam + sex of calf + age calf
+ RFI group + BF calf (rfigrp) + Het calf (rfigrp) + mean chute score + mean exit velocity
+ sire + residual
Breed FCR increased as B % increased (less efficient)
High RFI Group = 1.41 ± 0.52 kg DM*d-1/kg gain*d-1 Med RFI Group = 1.29 ± 0.47 kg DM*d-1/kg gain*d-1
Feed Conversion Ratio
Heterosis FCR increased as Het % increased (less efficient) High RFI Group = 0.92 ± 0.51 kg DM*d-1/kg gain*d-1

9
Breed DFI decreased as B % increased (more efficient)
High RFI Group = -0.97 ± 0.38 kg DM/d Med RFI Group = -0.90 ± 0.33 kg DM/d Low RFI Group = -0.99 ± 0.31 kg DM/d
Daily Feed Intake
Heterosis DFI increased as Het % increased (less efficient)
High RFI Group = 1.01 ± 0.35 kg DM/d Med RFI Group = 1.09 ± 0.32 kg DM/d
Breed PWG decreased as B % increased (A better)
High RFI Group = -18.81 ± 5.98 kg Med RFI Group = -16.18 ± 5.28 kg Low RFI Group = -14.82 ± 4.85 kg
Postweaning Gain (70 d)
Heterosis PWG increased as Het % increased (favorable)
Med RFI Group = 10.59 ± 5.88 kg
Temperament
Mean Chute Score No effect on any trait
Mean Exit Velocity No effect on RFI, FCR, PWG
DFI (-0.29 ± 0.09 kg DM*d-1/m*sec-1) Higher feed intake => lower EV
RFI DFI FCR PWG
RFI 0.19 ± 0.11 0.73 ± 0.13 0.09 ± 0.38 0.58 ± 0.28
DFI 0.89 ± 0.01 0.42 ± 0.13 -0.05 ± 0.31 0.88 ± 0.12
FCR 0.55 ± 0.03 0.37 ± 0.04 0.24 ± 0.11 -0.50 ± 0.23
PWG 0.15 ± 0.04 0.41 ± 0.04 -0.57 ± 0.03 0.40 ± 0.13
Genetic Parameters (REML)
Research: Feed Efficiency & Carcass and Meat Palatability
HATCH & TSTAR Projects
UF FE Facility, NFREC, Marianna, FL Suwannee Farms
UF Meats Lab

10
Objective
Effect of breed composition, RFI, and temperament (chute score, exit velocity) on carcass and meat
palatability traits
Carcass (2006-2007) UF Angus-Brahman Herd
n = 170 Breed Group of Sire BGDam A .75 A Br .50A .25A B
A 17 2 2 2 3 4
.75 A 6 4 8 5 3 4
Br 2 1 18 1 1 2
.50A 5 10 10 6 5 5
.25A 5 3 2 4 1 2
B 0 0 0 0 0 27
Model
HCW, REA, BFAT, MAR, SF, TEND =
year-pen + age calf + RFI group + BF calf (rfigrp) + Het calf
+ mean exit velocity + sire
+ residual
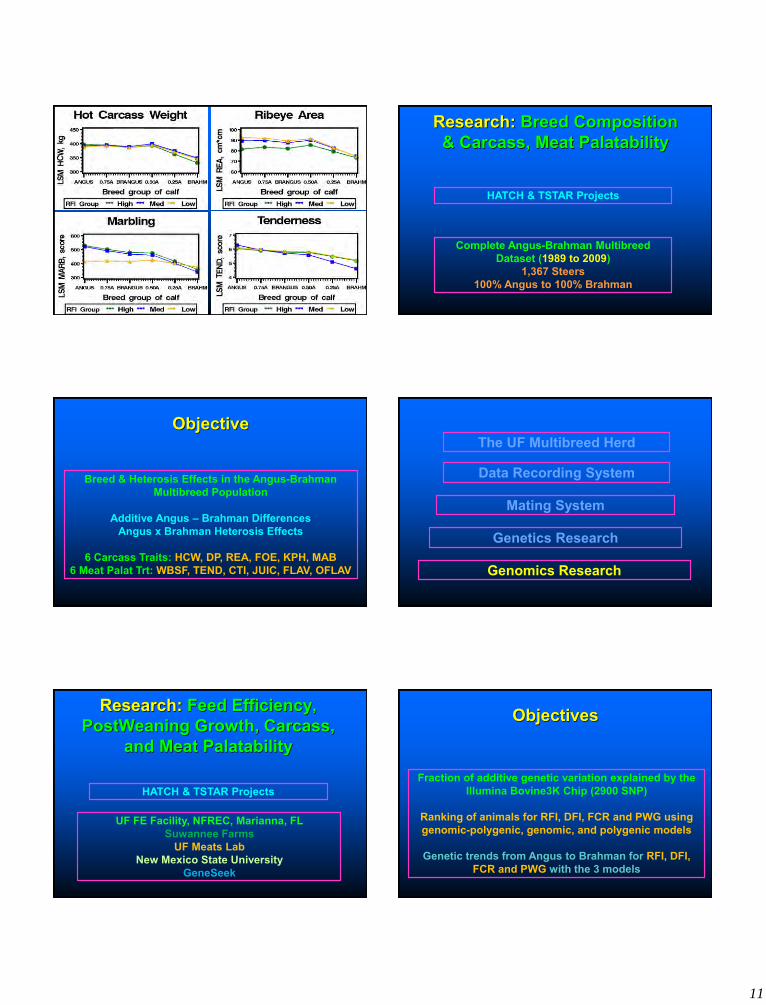
Trait P > F High RFI Medium RFI Low RFI
HCW 0.0006 -65.7 ± 22.1 kg -42.4 ± 23.5 kg -43.3 ± 18.2 kg
REA 0.0001 -8.08 ± 5.0 cm2 -14.6 ± 5.3 cm2 -17.9 ± 4.1 cm2
BFAT 0.0207 -1.08 ± 0.4 cm -0.4 ± 0.4 cm -0.1 ± 0.3 cm
MAR 0.0001 -170.7 ± 44.1 units -182.2 ± 46.7 units -38.7 ± 36.3 units
SF 0.0003 1.3 ± 0.3 kg 0.6 ± 0.3 kg 0.2 ± 0.3 kg
TEND 0.0001 -0.9 ± 0.3 units -1.7 ± 0.3 units -0.9 ± 0.3 units
Regression of Carcass & Meat Quality traits on Brahman Fraction
High RFI smaller REA than Low RFI (-11.0 ± 3.8 cm2)
Carcass Traits by Feed Efficiency Group
High RFI higher MAR than Low RFI (116.0 ± 34.0 units)
Medium RFI higher MAR than Low RFI (108.0 ± 29.9 units)
Less efficient steers (High RFI) had smaller REA than more efficient steers (Low RFI)
In general …
HCW, REA, BFAT, MAR, and TEND decreased as Brahman fraction increased
REA increased as heterozygosity increased
EV had no effect on carcass and meat quality traits
11
Research: Breed Composition & Carcass, Meat Palatability
HATCH & TSTAR Projects
Complete Angus-Brahman Multibreed Dataset (1989 to 2009)
1,367 Steers 100% Angus to 100% Brahman
Objective
Breed & Heterosis Effects in the Angus-Brahman Multibreed Population
Additive Angus – Brahman Differences
Angus x Brahman Heterosis Effects
6 Carcass Traits: HCW, DP, REA, FOE, KPH, MAB 6 Meat Palat Trt: WBSF, TEND, CTI, JUIC, FLAV, OFLAV
Data Recording System
Genomics Research
Genetics Research
Mating System
The UF Multibreed Herd
Research: Feed Efficiency, PostWeaning Growth, Carcass,
and Meat Palatability
HATCH & TSTAR Projects
UF FE Facility, NFREC, Marianna, FL Suwannee Farms
UF Meats Lab New Mexico State University
GeneSeek
Objectives
Fraction of additive genetic variation explained by the Illumina Bovine3K Chip (2900 SNP)
Ranking of animals for RFI, DFI, FCR and PWG using genomic-polygenic, genomic, and polygenic models
Genetic trends from Angus to Brahman for RFI, DFI,
FCR and PWG with the 3 models

12
Genomic-Polygenic Model
RFI, FCR, DFI, PWG =
year-pen + age of dam + sex of calf + age calf
+ BF calf + Het calf + additive animal polygenic
+ additive SNP genomic + residual
Genomic Model
RFI, FCR, DFI, PWG =
year-pen + age of dam + sex of calf + age calf
+ BF calf + Het calf
+ additive SNP genomic + residual
Polygenic Model
RFI, FCR, DFI, PWG =
year-pen + age of dam + sex of calf + age calf
+ BF calf + Het calf + additive animal polygenic
+ residual
Genomic-Polygenic Predictions
Prediction = Breed Solution +
Sum SNP predictions
EBVanimal = Prob (Alleles Brahman) *(Brahman° - Angus°)
+ Polygenic prediction
Sum [(# “Alleles 2” at locus i) * (𝐒𝐍𝐏 i)], i = 1 to 2,899
+ âanimal
+
Genomic Predictions
Prediction = Breed Solution +
Sum SNP predictions
EBVanimal = Prob (Alleles Brahman) *(Brahman° - Angus°)
Sum [(# “Alleles 2” at locus i) * (𝐒𝐍𝐏 i)], i = 1 to 2,899 +
Polygenic Predictions
Prediction = Breed Solution
EBVanimal = Prob (Alleles Brahman) *(Brahman° - Angus°)
+ Polygenic prediction
+ âanimal

13
Number of calves by breed group of sire x breed group of dam combination
Breed group of
dam
Breed group of sire
Angus ¾ A ¼ B Brangus ½ A ½ B ¼ A ¾ B Brahman All
Angus 46 10 18 7 7 17 105
¾ A ¼ B 24 21 31 26 14 16 132
Brangus 4 10 60 9 10 7 100
½ A ½ B 30 27 21 26 22 20 146
¼ A ¾ B 13 17 11 9 11 4 65
Brahman 1 2 1 0 0 68 72
All 118 87 142 77 64 132 620
Additive Genetic and Genomic Variation for RFI, DFI, FCR and PWG
Trait Parameter AGVar PhenVar Heritability AGOVar/AGVar
RFI Mean 0.37 1.79 0.21 0.14
(kg/d) SD 0.15 0.11 0.08 0.11
DFI Mean 0.80 2.42 0.33 0.10
(kg/d) SD 0.24 0.15 0.09 0.08
FCR Mean 1.32 6.50 0.20 0.26
(kfd/kgd) SD 0.56 0.40 0.08 0.17
PWG Mean 89.74 240.97 0.37 0.16
(kg) SD 25.85 15.09 0.10 0.11
Trait
Correlation RFI DFI FCR PWG
GP Model, G Model 0.65 0.62 0.66 0.74
GP Model, P Model 0.98 0.99 0.95 0.99
G Model, P Model 0.52 0.51 0.42 0.65
Rank correlations of animals evaluated for RFI, DFI, FCR, and PWG using genomic-polygenic, genomic,
and polygenic models
Trait
Effect RFI DFI FCR PWG
Genomic-Polygenic -0.0030 -0.0066 -0.0020 -0.0634
P < 0.0311 P < 0.0070 P < 0.4812 P < 0.0274
Genomic -0.0016 -0.0030 -0.0015 -0.0086
P < 0.0001 P < 0. 0001 P < 0.1529 P < 0.2825
Polygenic -0.0015 -0.0040 -0.0007 -0.0664
P < 0.2395 P < 0.1000 P < 0.7772 P < 0.0122
Linear regression coefficients of genomic-polygenic, genomic, and polygenic EBV for
RFI, DFI, FCR, and PWG on Brahman fraction of calf
y = -0.003x + 0.0249
-1.50
-1.00
-0.50
0.00
0.50
1.00
1.50
0 4 8 12 16 20 24 28 32
RFI
, Ge
no
mic
-Po
lyge
nic
EB
V
Brahman Fraction, 32nds
Genomic-Polygenic Linear (Genomic-Polygenic)
y = -0.0016x + 0.0207
-0.30
-0.20
-0.10
0.00
0.10
0.20
0.30
0 4 8 12 16 20 24 28 32
RFI
, Ge
no
mic
EB
V
Brahman Fraction, 32nds
Genomic Linear (Genomic)
y = -0.0015x + 0.0089
-1.50
-1.00
-0.50
0.00
0.50
1.00
1.50
0 4 8 12 16 20 24 28 32
RFI
, Po
lyge
nic
EB
V
Brahman Fraction, 32nds
Polygenic Linear (Polygenic)
RFI and PWG
y = -0.0634x + 1.2375
-30.00
-20.00
-10.00
0.00
10.00
20.00
30.00
0 4 8 12 16 20 24 28 32
PW
G, G
en
om
ic-P
oly
gen
ic E
BV
Brahman Fraction, 32nds
Genomic-Polygenic Linear (Genomic-Polygenic)
y = -0.0086x + 0.446
-8.00
-6.00
-4.00
-2.00
0.00
2.00
4.00
6.00
8.00
0 4 8 12 16 20 24 28 32
PW
G, G
en
om
ic E
BV
Brahman Fraction, 32nds
Genomic Linear (Genomic)
y = -0.0664x + 0.9724
-25.00
-20.00
-15.00
-10.00
-5.00
0.00
5.00
10.00
15.00
20.00
25.00
0 4 8 12 16 20 24 28 32
PW
G, P
oly
gen
ic E
BV
Brahman Fraction, 32nds
Polygenic Linear (Polygenic)
-0.4
-0.3
-0.2
-0.1
0
0.1
0.2
0.3
0.4
0 500 1000 1500 2000 2500
RFI
, aSN
P/aS
D
SNP Number (Illumina3k)
aSNP/aSD
-0.4
-0.3
-0.2
-0.1
0
0.1
0.2
0.3
0.4
0 1 2 3 4 5 6 7 8 9 10 11 12 13 14 15 16 17 18 19 20 21 22 23 24 25 26 27 28 29 30
RFI
, aSN
P/aS
D
Chromosome
aSNP/aSD
RFI and PWG
-0.5
-0.4
-0.3
-0.2
-0.1
0
0.1
0.2
0.3
0.4
0.5
0 500 1000 1500 2000 2500
PW
G, a
SNP/
aSD
SNP Number (Illumina3k)
aSNP/aSD
-0.5
-0.4
-0.3
-0.2
-0.1
0
0.1
0.2
0.3
0.4
0.5
0 1 2 3 4 5 6 7 8 9 10 11 12 13 14 15 16 17 18 19 20 21 22 23 24 25 26 27 28 29 30
PW
G, a
SNP/
aSD
Chromosome
aSNP/aSD
14
Trait
RFI DFI FCR PWG
SDSNP Range N % N % N % N %
-0.4 to -0.5 0 0 0 0 0 0 1 0.03
-0.3 to -0.4 0 0 1 0.03 4 0.14 1 0.03
-0.2 to -0.3 8 0.28 19 0.66 60 2.07 66 2.28
-0.1 to -0.2 187 6.45 244 8.42 393 13.55 371 12.80
0 to -0.1 1204 41.53 1171 40.39 1007 34.74 998 34.43
0 to 0.1 1289 44.46 1169 40.32 1004 34.63 1010 34.84
0.1 to 0.2 202 6.97 277 9.56 379 13.07 376 12.97
0.2 to 0.3 9 0.31 18 0.62 48 1.66 72 2.48
0.3 to 0.4 0 0 0 0 4 0.14 4 0.14
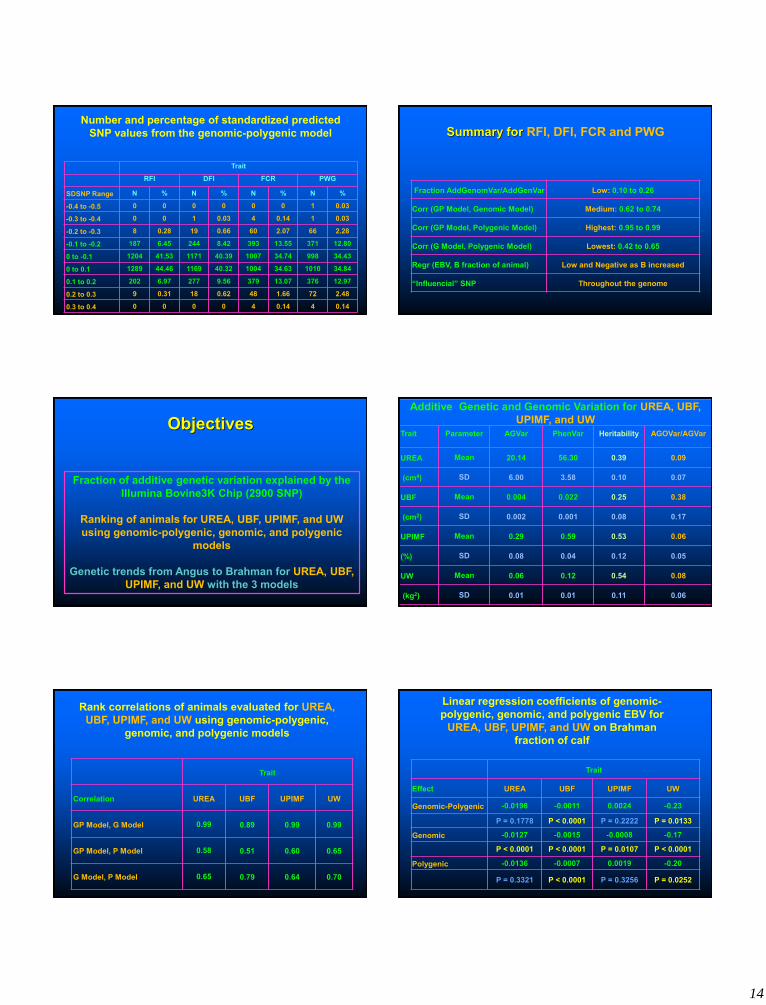
Number and percentage of standardized predicted SNP values from the genomic-polygenic model Summary for RFI, DFI, FCR and PWG
Fraction AddGenomVar/AddGenVar Low: 0.10 to 0.26
Corr (GP Model, Genomic Model) Medium: 0.62 to 0.74
Corr (GP Model, Polygenic Model) Highest: 0.95 to 0.99
Corr (G Model, Polygenic Model) Lowest: 0.42 to 0.65
Regr (EBV, B fraction of animal) Low and Negative as B increased
“Influencial” SNP Throughout the genome
Objectives
Fraction of additive genetic variation explained by the Illumina Bovine3K Chip (2900 SNP)
Ranking of animals for UREA, UBF, UPIMF, and UW using genomic-polygenic, genomic, and polygenic
models
Genetic trends from Angus to Brahman for UREA, UBF, UPIMF, and UW with the 3 models
Additive Genetic and Genomic Variation for UREA, UBF, UPIMF, and UW
Trait Parameter AGVar PhenVar Heritability AGOVar/AGVar
UREA Mean 20.14 56.30 0.39 0.09
(cm4) SD 6.00 3.58 0.10 0.07
UBF Mean 0.004 0.022 0.25 0.38
(cm2) SD 0.002 0.001 0.08 0.17
UPIMF Mean 0.29 0.59 0.53 0.06
(%) SD 0.08 0.04 0.12 0.05
UW Mean 0.06 0.12 0.54 0.08
(kg2) SD 0.01 0.01 0.11 0.06
Trait
Correlation UREA UBF UPIMF UW
GP Model, G Model 0.99 0.89 0.99 0.99
GP Model, P Model 0.58 0.51 0.60 0.65
G Model, P Model 0.65 0.79 0.64 0.70
Rank correlations of animals evaluated for UREA, UBF, UPIMF, and UW using genomic-polygenic,
genomic, and polygenic models
Trait
Effect UREA UBF UPIMF UW
Genomic-Polygenic -0.0198 -0.0011 0.0024 -0.23
P = 0.1778 P < 0.0001 P = 0.2222 P = 0.0133
Genomic -0.0127 -0.0015 -0.0008 -0.17
P < 0.0001 P < 0.0001 P = 0.0107 P < 0.0001
Polygenic -0.0136 -0.0007 0.0019 -0.20
P = 0.3321 P < 0.0001 P = 0.3256 P = 0.0252
Linear regression coefficients of genomic-polygenic, genomic, and polygenic EBV for
UREA, UBF, UPIMF, and UW on Brahman fraction of calf

15
UREA and UPIMF
y = -0.0198x + 0.144-10.00
-8.00
-6.00
-4.00
-2.00
0.00
2.00
4.00
6.00
8.00
10.00
0 4 8 12 16 20 24 28 32
UR
EA, G
en
om
ic-P
oly
gen
ic E
BV
Brahman Fraction, 32nds
Genomic-Polygenic Linear (Genomic-Polygenic)
y = -0.0127x + 0.1714-2.50
-2.00
-1.50
-1.00
-0.50
0.00
0.50
1.00
1.50
2.00
2.50
0 4 8 12 16 20 24 28 32
UR
EA, G
en
om
ic E
BV
Brahman Fraction, 32nds
Genomic Linear (Genomic)
y = -0.0136x + 0.0484-10.00
-8.00
-6.00
-4.00
-2.00
0.00
2.00
4.00
6.00
8.00
10.00
0 4 8 12 16 20 24 28 32
UR
EA, P
oly
gen
ic E
BV
Brahman Fraction, 32nds
Polygenic Linear (Polygenic)
y = 0.0024x - 0.0015-2.50
-2.00
-1.50
-1.00
-0.50
0.00
0.50
1.00
1.50
2.00
2.50
0 4 8 12 16 20 24 28 32
UP
IMF,
Ge
no
mic
-Po
lyge
nic
EB
V
Brahman Fraction, 32nds
Genomic-Polygenic Linear (Genomic-Polygenic)
y = -0.0008x + 0.0067
-0.30
-0.20
-0.10
0.00
0.10
0.20
0.30
0 4 8 12 16 20 24 28 32
UP
IMF,
Ge
no
mic
EB
V
Brahman Fraction, 32nds
Genomic Linear (Genomic)
y = 0.0019x - 0.0018
-2.00
-1.50
-1.00
-0.50
0.00
0.50
1.00
1.50
2.00
0 4 8 12 16 20 24 28 32
UP
IMF,
Po
lyge
nic
EB
V
Brahman Fraction, 32nds
Polygenic Linear (Polygenic)
UREA and UPIMF
-0.4
-0.3
-0.2
-0.1
0
0.1
0.2
0.3
0.4
0 1 2 3 4 5 6 7 8 9 10 11 12 13 14 15 16 17 18 19 20 21 22 23 24 25 26 27 28 29 30
UP
IMF,
aSN
P/aS
D
Chromosome
aSNP/aSD
-0.4
-0.3
-0.2
-0.1
0
0.1
0.2
0.3
0.4
0 500 1000 1500 2000 2500
UP
IMF,
aSN
P/aS
D
SNP Number (Illumina3k)
aSNP/aSD
-0.4
-0.3
-0.2
-0.1
0
0.1
0.2
0.3
0.4
0 500 1000 1500 2000 2500
UR
EA, a
SNP/
aSD
SNP Number (Illumina3k)
aSNP/aSD
-0.4
-0.3
-0.2
-0.1
0
0.1
0.2
0.3
0.4
0 1 2 3 4 5 6 7 8 9 10 11 12 13 14 15 16 17 18 19 20 21 22 23 24 25 26 27 28 29 30
UR
EA, a
SNP/
aSD
Chromosome
aSNP/aSD
Trait
UREA UBF UPIMF UW
SDSNP Range N % N % N % N %
-0.3 to -0.4 2 0.07 11 0.38 0 0 6 0.21
-0.2 to -0.3 14 0.48 78 2.69 15 0.52 65 2.24
-0.1 to -0.2 276 9.52 419 14.45 245 8.45 359 12.38
0 to -0.1 1098 37.88 954 32.91 1217 41.98 1018 35.12
0 to 0.1 1190 41.05 920 31.74 1170 40.36 1006 34.7
0.1 to 0.2 296 10.21 415 14.32 234 8.07 370 12.76
0.2 to 0.3 20 0.69 83 2.86 18 0.62 70 2.41
0.3 to 0.4 3 0.1 17 0.59 0 0 5 0.17
0.4 to 0.5 0 0 2 0.07 0 0 0 0
Number and percentage of standardized predicted SNP values from the genomic-polygenic model Summary for UREA, UBF, UPIMF, and UW
Fraction AddGenomVar/AddGenVar Low: 0.09 to 0.38
Corr (GP Model, Genomic Model) Highest: 0.89 to 0.99
Corr (GP Model, Polygenic Model) Lowest: 0.51 to 0.65
Corr (G Model, Polygenic Model) Medium: 0.64 to 0.79
Regr (EBV, B fraction of animal) Near Zero (Pos or Neg) as B increased
“Influencial” SNP Throughout the genome
Objectives
Fraction of additive genetic variation explained by the Illumina Bovine3K Chip (2900 SNP)
Ranking of animals for HCW, DP, REA, FOE, and MAB
using genomic-polygenic, genomic, and polygenic models
Genetic trends from Angus to Brahman for HCW, DP,
REA, FOE, and MAB with the 3 models
Number of calves by breed group of sire x breed group of dam combination
Breed group of
dam
Breed group of sire
Angus ¾ A ¼ B Brangus ½ A ½ B ¼ A ¾ B Brahman All
Angus 19 3 6 1 2 4 35
¾ A ¼ B 6 2 9 11 4 3 35
Brangus 1 2 22 3 4 2 34
½ A ½ B 8 12 9 7 3 1 40
¼ A ¾ B 6 8 8 1 4 2 29
Brahman 0 2 0 0 0 27 29
All 40 29 54 23 17 39 202

16
Additive Genetic and Genomic Variation for HCW, DP, REA, FOE, and MAB
Trait Parameter AGVar PhenVar Heritability AGOVar/AGVar
HCW Mean 895.88 1232.48 0.72 0.08
(kg)2 SD 270.57 150.59 0.18 0.09
DP Mean 5.03 19.24 0.25 0.47
(%)2 SD 3.89 2.39 0.17 0.26
REA Mean 39.02 71.73 0.53 0.19
(cm)4 SD 18.74 9.17 0.22 0.16
FOE Mean 0.11 0.23 0.44 0.27
(cm)2 SD 0.06 0.03 0.20 0.21
MAB Mean 3580.57 4739.93 0.75 0.23
(unit)2 SD 980.23 572.93 0.16 0.16
Trait
Correlation HCW DP REA FOE MAB
GP Model, G Model 0.85 0.95 0.84 0.84 0.90
GP Model, P Model 0.99 0.94 0.99 0.99 0.99
G Model, P Model 0.84 0.78 0.79 0.78 0.85
Rank correlations of animals evaluated for HCW, DP, REA, FOE, and MAB using genomic-polygenic,
genomic, and polygenic models
Trait
Effect HCW DP REA FOE MAB
Genomic-Polyg 0.1643 0.0050 0.0144 0.0000 0.2714
P < 0.3869 P < 0.5414 P < 0.6643 P < 0.7554 P < 0.4904
Genomic -0.0043 0.0016 0.0098 0.0000 0.2212
P < 0.9226 P < 0.7556 P < 0. 3806 P < 0.2290 P < 0.3326
Polygenic 0.1655 0.0057 0.0046 0.0144 0.0710
P < 0.3742 P < 0.2286 P < 0.8798 P < 0.6643 P < 0.8457
Linear regression coefficients of genomic-polygenic, genomic, and polygenic EBV for HCW, DP, REA, FOE, and MAB on Brahman
fraction of calf
HCW and REA
y = 0.1643x - 5.1677-100
-80
-60
-40
-20
0
20
40
60
80
100
0 4 8 12 16 20 24 28 32
HC
W, G
en
om
ic-P
oly
gen
ic E
BV
Brahman Fraction, 32nds
Genomic-Polygenic Linear (Genomic-Polygenic)
y = -0.0043x - 0.8431-25
-20
-15
-10
-5
0
5
10
15
20
25
0 4 8 12 16 20 24 28 32H
CW
, Ge
no
mic
EB
V
Brahman Fraction, 32nds
Genomic Linear (Genomic)
y = 0.1655x - 4.92-100
-80
-60
-40
-20
0
20
40
60
80
100
0 4 8 12 16 20 24 28 32
HC
W, P
oly
gen
ic E
BV
Brahman Fraction, 32nds
Polygenic Linear (Polygenic)
y = 0.0144x - 0.411
-15
-10
-5
0
5
10
15
0 4 8 12 16 20 24 28 32
REA
, Ge
no
mic
-Po
lyge
nic
EB
V
Brahman Fraction, 32nds
Genomic-Polygenic Linear (Genomic-Polygenic)
y = 0.0098x - 0.4074-5
-4
-3
-2
-1
0
1
2
3
4
5
0 4 8 12 16 20 24 28 32
REA
, Ge
no
mic
EB
V
Brahman Fraction, 32nds
Genomic Linear (Genomic)
y = 0.0046x - 0.1644
-15
-10
-5
0
5
10
15
0 4 8 12 16 20 24 28 32
REA
, Po
lyge
nic
EB
V
Brahman Fraction, 32nds
Polygenic Linear (Polygenic)
HCW and REA
-0.015
-0.01
-0.005
0
0.005
0.01
0.015
0 500 1000 1500 2000 2500
HC
W, a
SNP/
aSD
SNP Number (Illumina3k)
aSNP/aSD
-0.015
-0.01
-0.005
0
0.005
0.01
0.015
0 1 2 3 4 5 6 7 8 9 10 11 12 13 14 15 16 17 18 19 20 21 22 23 24 25 26 27 28 29 30
HC
W, a
SNP/
aSD
Chromosome
aSNP/aSD
-0.6
-0.4
-0.2
0
0.2
0.4
0.6
0 500 1000 1500 2000 2500
REA
, aSN
P/aS
D
SNP Number (Illumina3k)
aSNP/aSD
-0.6
-0.4
-0.2
0
0.2
0.4
0.6
0 1 2 3 4 5 6 7 8 9 10 11 12 13 14 15 16 17 18 19 20 21 22 23 24 25 26 27 28 29 30
REA
, aSN
P/aS
D
Chromosome
aSNP/aSD
Trait
HCW DP REA FOE MAB
SD Range N % N % N % N % N %
-0.4 to -0.5 0 0 0 0 2 0.07 0 0 0 0
-0.3 to -0.4 0 0 2 0.07 23 0.79 0 0 0 0
-0.2 to -0.3 0 0 37 1.28 124 4.28 0 0 0 0
-0.1 to -0.2 0 0 308 10.62 474 16.35 0 0 0 0
0 to -0.1 1437 49.57 1080 37.25 837 28.87 1446 49.88 1504 51.88
0 to 0.1 1462 50.43 1083 37.36 798 27.53 1453 50.12 1395 48.12
0.1 to 0.2 0 0 346 11.94 464 16.01 0 0 0 0
0.2 to 0.3 0 0 42 1.45 143 4.93 0 0 0 0
0.3 to 0.4 0 0 1 0.03 30 1.03 0 0 0 0
0.4 to 0.5 0 0 0 0 4 0.14 0 0 0 0
Number and percentage of standardized predicted SNP values from the genomic-polygenic model

17
Summary for HCW, DP, REA, FOE, and MAB
Fraction AddGenomVar/AddGenVar Low: 0.08 to 0.47
Corr (GP Model, Genomic Model) Medium: 0.84 to 0.90
Corr (GP Model, Polygenic Model) Highest: 0.94 to 0.99
Corr (G Model, Polygenic Model) Lowest: 0.78 to 0.85
Regr (EBV, B fraction of animal) Near Zero (Pos or Neg) as B increased
“Influencial” SNP Throughout the genome
The low fraction of Add Genetic Variation accounted for by the Illumina Bovine3K Chip indicates that this chip should be used in combination with
higher density chips for genomic evaluation
Remarks
If genotypes from the Illumina Bovine3K Chip were available, then a genomic-polygenic model should be used
If imputation from a low density chip (e.g., 3K, 7K) to a higher density chip (e.g., 50K) were used in a multibreed population, animals from various breed
groups would need to be genotyped with the higher density chip
Genomic results here should be taken with caution due to the small number of animals and the large number of predicted SNP effects (even with a low
density chip)
Continue to collect multibreed phenotypic information
Next Steps
Genotype animals in the multibreed population with a combination of Illumina Bovine7K, Bovine50K and BovineHD (770K) Chips
Strengthen genetic links with straightbred and multibreed cattle herds where Brahman is one of the component breeds
Collaborate with researchers working in physiological genomics
Collaborate with researchers at institutions with similar goals and available phenotypes and genotypes
Research Team
University of Florida Animal Sciences
Large Animal Clinical Sciences North Florida Research & Education Center
Beef Research Unit Pine Acres
New Mexico State University University of Georgia
National University of Colombia, ICA, & CORPOICA (Colombia)
Kasetsart University (Thailand) University of Chile (Chile)
Number of Markers 2,900
Samples per BeadChip 32
DNA Requirement 250ng
Assay Infinium HD
Instrument
iScan, HiScanSQ, or BeadArray Reader
http://www.illumina.com/products/bovine_snp50_whole-genome_genotyping_kits.ilmn
Illumina Bovine3k BeadChip
Number of Markers 54,609
Samples per BeadChip 24
DNA Requirement 200ng
Assay GoldgenGate
Instrument iScan or HiScanSQ
http://www.illumina.com/products/bovine_snp50_whole-genome_genotyping_kits.ilmn
Illumina BovineSNP50 v2 BeadChip
18
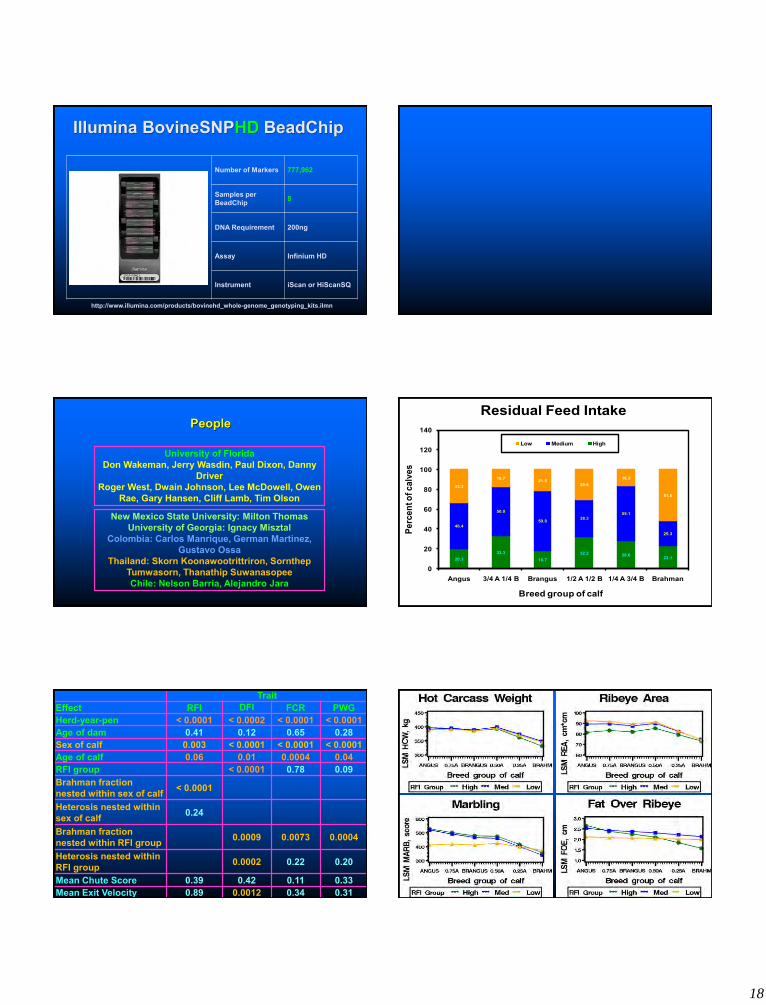
Number of Markers 777,962
Samples per BeadChip 8
DNA Requirement 200ng
Assay Infinium HD
Instrument iScan or HiScanSQ
http://www.illumina.com/products/bovinehd_whole-genome_genotyping_kits.ilmn
Illumina BovineSNPHD BeadChip
People
University of Florida Don Wakeman, Jerry Wasdin, Paul Dixon, Danny
Driver Roger West, Dwain Johnson, Lee McDowell, Owen
Rae, Gary Hansen, Cliff Lamb, Tim Olson
New Mexico State University: Milton Thomas University of Georgia: Ignacy Misztal
Colombia: Carlos Manrique, German Martinez, Gustavo Ossa
Thailand: Skorn Koonawootrittriron, Sornthep Tumwasorn, Thanathip Suwanasopee Chile: Nelson Barria, Alejandro Jara
20.333.3
18.732.2 28.6 23.1
46.4
50.0
59.8 38.355.1
25.3
33.3
16.7 21.529.6
16.3
51.6
0
20
40
60
80
100
120
140
Angus 3/4 A 1/4 B Brangus 1/2 A 1/2 B 1/4 A 3/4 B Brahman
Perc
ent o
f cal
ves
Breed group of calf
Residual Feed Intake
Low Medium High
Trait Effect RFI DFI FCR PWG Herd-year-pen < 0.0001 < 0.0002 < 0.0001 < 0.0001 Age of dam 0.41 0.12 0.65 0.28 Sex of calf 0.003 < 0.0001 < 0.0001 < 0.0001 Age of calf 0.06 0.01 0.0004 0.04 RFI group < 0.0001 0.78 0.09 Brahman fraction nested within sex of calf < 0.0001
Heterosis nested within sex of calf 0.24
Brahman fraction nested within RFI group 0.0009 0.0073 0.0004
Heterosis nested within RFI group 0.0002 0.22 0.20
Mean Chute Score 0.39 0.42 0.11 0.33 Mean Exit Velocity 0.89 0.0012 0.34 0.31
19
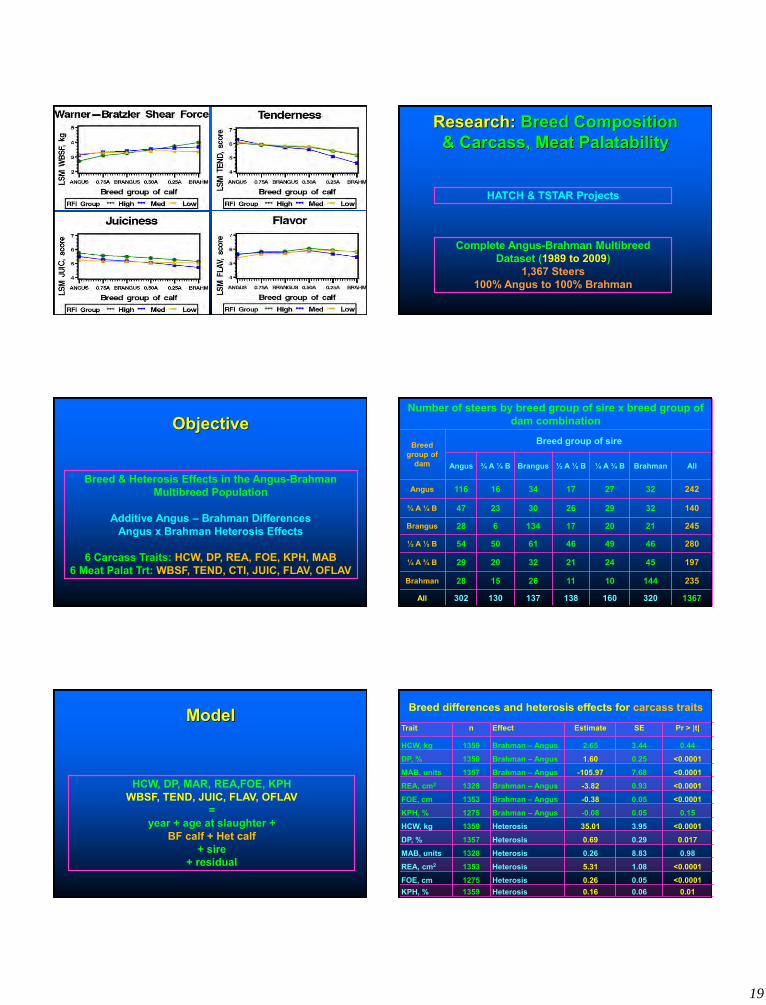
Research: Breed Composition & Carcass, Meat Palatability
HATCH & TSTAR Projects
Complete Angus-Brahman Multibreed Dataset (1989 to 2009)
1,367 Steers 100% Angus to 100% Brahman
Objective
Breed & Heterosis Effects in the Angus-Brahman Multibreed Population
Additive Angus – Brahman Differences
Angus x Brahman Heterosis Effects
6 Carcass Traits: HCW, DP, REA, FOE, KPH, MAB 6 Meat Palat Trt: WBSF, TEND, CTI, JUIC, FLAV, OFLAV
Number of steers by breed group of sire x breed group of dam combination
Breed group of
dam
Breed group of sire
Angus ¾ A ¼ B Brangus ½ A ½ B ¼ A ¾ B Brahman All
Angus 116 16 34 17 27 32 242
¾ A ¼ B 47 23 30 26 29 32 140
Brangus 28 6 134 17 20 21 245
½ A ½ B 54 50 61 46 49 46 280
¼ A ¾ B 29 20 32 21 24 45 197
Brahman 28 15 26 11 10 144 235
All 302 130 137 138 160 320 1367
Model
HCW, DP, MAR, REA,FOE, KPH WBSF, TEND, JUIC, FLAV, OFLAV
= year + age at slaughter +
BF calf + Het calf + sire
+ residual
Breed differences and heterosis effects for carcass traits
Trait n Effect Estimate SE Pr > |t|
HCW, kg 1359 Brahman – Angus 2.65 3.44 0.44 DP, % 1359 Brahman – Angus 1.60 0.25 <0.0001 MAB, units 1357 Brahman – Angus -105.97 7.68 <0.0001 REA, cm2 1328 Brahman – Angus -3.82 0.93 <0.0001 FOE, cm 1353 Brahman – Angus -0.38 0.05 <0.0001 KPH, % 1275 Brahman – Angus -0.08 0.05 0.15 HCW, kg 1359 Heterosis 35.01 3.95 <0.0001 DP, % 1357 Heterosis 0.69 0.29 0.017 MAB, units 1328 Heterosis 0.26 8.83 0.98 REA, cm2 1353 Heterosis 5.31 1.08 <0.0001 FOE, cm 1275 Heterosis 0.26 0.05 <0.0001 KPH, % 1359 Heterosis 0.16 0.06 0.01
20
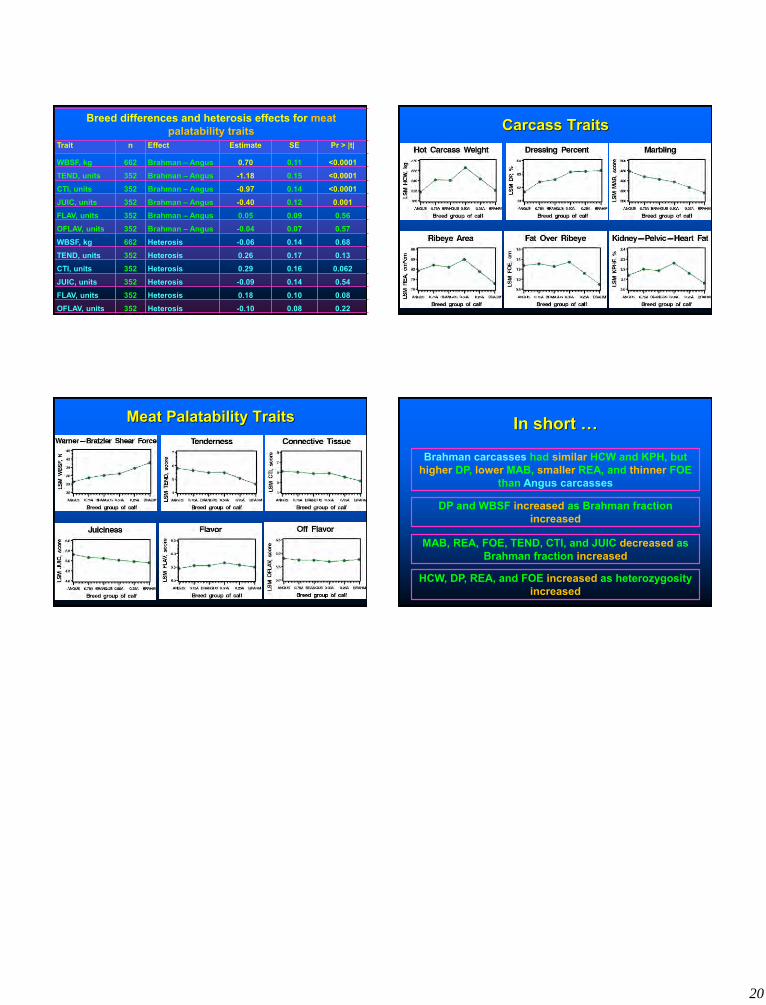
Breed differences and heterosis effects for meat palatability traits
Trait n Effect Estimate SE Pr > |t|
WBSF, kg 662 Brahman – Angus 0.70 0.11 <0.0001 TEND, units 352 Brahman – Angus -1.18 0.15 <0.0001 CTI, units 352 Brahman – Angus -0.97 0.14 <0.0001 JUIC, units 352 Brahman – Angus -0.40 0.12 0.001 FLAV, units 352 Brahman – Angus 0.05 0.09 0.56 OFLAV, units 352 Brahman – Angus -0.04 0.07 0.57 WBSF, kg 662 Heterosis -0.06 0.14 0.68 TEND, units 352 Heterosis 0.26 0.17 0.13 CTI, units 352 Heterosis 0.29 0.16 0.062 JUIC, units 352 Heterosis -0.09 0.14 0.54 FLAV, units 352 Heterosis 0.18 0.10 0.08 OFLAV, units 352 Heterosis -0.10 0.08 0.22
Carcass Traits
Meat Palatability Traits
Brahman carcasses had similar HCW and KPH, but higher DP, lower MAB, smaller REA, and thinner FOE
than Angus carcasses
In short …
DP and WBSF increased as Brahman fraction increased
MAB, REA, FOE, TEND, CTI, and JUIC decreased as Brahman fraction increased
HCW, DP, REA, and FOE increased as heterozygosity increased