Embed Size (px)
Citation preview

MULTI-TRAIT-MULTI-METHOD LEADERSHIP 1
Running head: Multi-trait-multi method leadership
Discriminant Validity of Transformational and Transactional Leadership -
A Multi-trait-multi-method Analysis of and Norms for the German Transformational
Leadership Inventory (TLI)
FINAL
Academic citation: Krüger, C., Rowold, J., Borgmann, L., Staufenbiel, K. & Heinitz, K.
(2011). The discriminant validity of transformational and transactional leadership – A
multitrait-multimethod analysis of and norms for the German Transformational
Leadership Inventory (TLI). Journal of Personnel Psychology, 10 (2), 49-60.

MULTI-TRAIT-MULTI-METHOD LEADERSHIP 2
Abstract
The well known constructs of transformational and transactional leadership are still
facing problems concerning their discriminant validity as substantive correlations have
frequently been observed between them. Nine samples, including 178 supervisors and their
834 followers, completed the German version of the Transformational Leadership Inventory
(TLI). Self ratings and aggregated observer ratings were analyzed using a SEM-based multi-
trait-multi-method approach (MTMM). First, the factorial structure was confirmed for both
rating perspectives and across them. In the MTMM analysis, controlling for the method
effects reduced the correlations between leadership constructs from a high to a small resp.
medium level and the leadership scales can be discriminated. Facilitating the use of the TLI in
practical issues, norms are provided for self and observer ratings.
Keywords: Transformational/transactional leadership, discriminant validity, multi-
trait-multi-method

MULTI-TRAIT-MULTI-METHOD LEADERSHIP 3
Discriminant Validity of Transformational and Transactional Leadership -
A Multi-trait-multi-method Analysis of and Norms for the German Transformational
Leadership Inventory (TLI)
Over the past two decades, research and practice increasingly focused on the
transformational and transactional leadership paradigm (Bass & Bass, 2008; Rowold &
Heinitz, 2007). While transformational leaders motivate their followers by means of a value-
based, inspiring vision of the future, transactional leaders rely on a quid-pro-quo approach to
leadership and exchange tasks and rewards with their respective followers. Despite its broad
scientific acceptance, this clear theoretical differentiation still lacks consistent empirical
support. Transformational and transactional leadership show substantive correlations in a
number of studies (e.g., Bycio, Hackett, & Allen, 1995) as well as in meta-analyses (Judge &
Piccolo, 2004). Therefore, the discriminant validity of these two leadership constructs could
not yet be empirically established.
A similar problem was observed within the construct of transformational leadership.
The Multifactor Leadership Questionnaire (MLQ; Bass, 1985; Bass & Avolio, 2000 for the
latest version MLQ-5X short; Rowold, 2005 for the German version) as well as the
Transformational Leadership Inventory (TLI; Podsakoff, MacKenzie, Moorman, & Fetter,
1990; Heinitz & Rowold, 2007 for the German version) assess several subscales of
transformational leadership (e.g., individual consideration, intellectual stimulation) in order to
further differentiate leaders’ behavior. These subscales were developed through factor
analyses but high intercorrelations remain to question their differentiability (Heinitz &
Rowold, 2007; Lowe, Kroeck, & Sivasubramaniam, 1996).
Analyzing the possible sources of these high intercorrelations, two classes can be
separated: On the one hand, substantive overlap of the constructs might cause the observed
covariance. This intuitive, nearby assumption would unmask the subscales of transformational

MULTI-TRAIT-MULTI-METHOD LEADERSHIP 4
leadership as at least being partially redundant. On the other hand, the shared variance of the
constructs could rely on the shared methods that were typically used to assess them.
Generally, the leaders’ behavior is rated by his or her subordinates within one questionnaire.
This same-source same-method bias could have inflated the observed correlations. The multi-
trait-multi-method (MTMM) approach (Campbell & Fiske, 1959) is the most important
technique for dividing and clarifying the different sources of shared variance.
Consequently, and for the first time, the present study uses the MTMM approach to
explore the discriminant validity of transactional and transformational leadership scales as
well as the discriminant validity of facets within transformational leadership. In order to
exclude same-source bias from the intercorrelations, the leadership constructs were assessed
by multiple rating perspectives. In sum, applying the MTMM approach, the first research goal
of the present study was to contribute to the important issue of discriminant validity of
transformational and transactional leadership, as assessed by the TLI.
Apart from this question of validity, a potential application of the measurement of
transformational leadership is explored in the present study: Assuming substantial differences
between self and follower ratings of leadership behavior, specific norms are needed for the
use of the TLI. Aside from the raters’ perspective, further individual and organizational
variables are considered that might affect leadership ratings. Consequently, the second goal
therefore was to investigate the effects of the rating perspective as well as supervisors’ and
organizations’ characteristics on the average leadership scores. Finally, based on these
findings, specific norms – where necessary – were provided for the TLI, using data from nine
independent samples acquired in Germany.
The Transformational Leadership Inventory (TLI)
One instrument for the assessment of transformational and transactional leadership is
the Transformational Leadership Inventory (TLI), developed by Podsakoff and colleagues

MULTI-TRAIT-MULTI-METHOD LEADERSHIP 5
(Podsakoff et al., 1990). The TLI uses 26 items to assess six subscales of transformational
leadership, i.e., Articulating a Vision, Providing an Appropriate Model, Fostering the
Acceptance of Group Goals, High Performance Expectations, Individualized Support, and
Intellectual Stimulation. In addition, the TLI includes one scale for the assessment of
transactional leadership, Contingent Reward. The TLI has been validated in at least five
empirical studies (Heinitz & Rowold, 2007; MacKenzie, Podsakoff, & Rich, 2004; Podsakoff,
MacKenzie, & Bommer, 1996; Podsakoff et al., 1990; Rowold, Borgmann, & Heinitz, 2009).
These studies support the factorial and criterion-oriented validity and adequate levels of
reliability for both the English and the German version of the instrument.
However, the subscales of transformational leadership are highly intercorrelated, a
problem also known when it comes to other instruments assessing transformational
leadership. For the Multifactor Leadership Questionnaire (MLQ; Bass & Avolio, 2000) strong
intercorrelations between the transformational subscales are reported from Avolio, Bass, and
Jung (1999; mean intercorrelation = .80), Vandenberghe, Stordeur, and D’hoore (2002; .89)
and Lowe et al. (1996; .79 in a meta-analysis). Correlations of a similar strength were
observed between transformational and transactional leadership.
In this study, the TLI was used instead of the MLQ, another well established
questionnaire measuring transformational leadership, for several reasons: First, the MLQ still
holds some measurement problems, particularly concerning its factor structure (e.g., Avolio et
al., 1999; Heinitz, Liepmann, & Felfe, 2005; Yukl, 1999). The TLI, on the other hand, only
considers one transactional scale, Contingent Reward. But it seems to bring along a more
robust structure that was replicated more reliably in different samples and for different rating
perspectives. Second, the TLI (26 items) is shorter than the MLQ (45 items in the MLQ-5X
Short) and hence, it is preferred especially in organizational contexts. Consequently, the

MULTI-TRAIT-MULTI-METHOD LEADERSHIP 6
practical use of the instrument is even supposed to increase as norms are provided within this
paper to support its applicability.
Construct Validity of Transformational Leadership
Concerning theoretical challenges, the high intercorrelations between transformational
and transactional leadership contradict the assumptions of the full range leadership model
which clearly postulates distinct constructs (Avolio, 1999). Hence, the relative large portion
of shared variance can be regarded as a deficit in discriminant validity. This is an important
limitation, as discriminant validity is a cornerstone of construct validity. Furthermore, the
unique effects of the transformational and transactional leadership are hardly separated and
their incremental validities for outcome measures (e. g., subordinates’ satisfaction, extra
effort, performance) cannot be detected reliably. For practical issues, highly overlapping
constructs in a questionnaire imply redundancy and therefore inefficiency. Accordingly, the
structure of the MLQ is still discussed with regard to its debatable parsimony (Den Hartog,
Van Muijen, & Koopman, 1997; Heinitz et al., 2005). In order to overcome these theoretical
and practical limitations, it is necessary to further clarify the inherent factorial structure of
transformational leadership and its relationship to transactional leadership. The present study
tries to meet these challenges by taking the different perspectives of self and other rating into
account using a multi-trait-multi-method (MTMM) design.
Potential Effects on Leadership Ratings
Focusing on the different perspectives brings forward another practical issue. A short
and valid instrument like the TLI can profitably be used by human resource practitioners to
give detailed feedback to supervisors (e.g., for purposes of 360° assessment or training). But
accurate feedback is only possible if norms are available to evaluate the aggregated answers
of the managers themselves and their respective followers. Consistent with intuitive
assumptions, empirical evidence shows that individuals rate themselves more favorable than

MULTI-TRAIT-MULTI-METHOD LEADERSHIP 7
they are rated by others (e.g., Atwater & Yammarino, 1997; Harris & Schaubroeck, 1988).
Thus, at least for the different perspectives, separate norms are assumed to be required for the
TLI.
In addition, some further individual and organizational variables should be inspected
concerning their influence on the average leadership ratings. For example, Eagly and
colleagues (Eagly, Johannesen-Schmidt, & van Engen, 2003) found female leaders exhibiting
significantly more transformational leadership than their male colleagues. These gender-
specific differences showed very small effect sizes. Nevertheless, given the importance of
gender equity, and given the difficulties of women having access to top management positions
(i.e., the ‘glass ceiling’ effect), it seems important to explore potential gender differences in
the TLI-scales.
Another characteristic of leaders is their hierarchical level within the organization
(e.g., top management vs. middle management vs. first-level supervisor). From a theoretical
perspective, it might be argued that managerial functions and experiences may vary with the
hierarchical level of the leader. For example, providing individualized support, one facet of
transformational leadership, should be more frequent at lower levels since the direct
interaction between leader and led is among the key tasks of lower-level managers. In line
with this argumentation, prior empirical research found that at lower levels, transformational
leadership was observed more frequently than at higher levels of the organization (cf. Lowe et
al., 1996).
Organizations can be characterized either as being public or private organizations.
Public organizations are often highly bureaucratic and as a consequence, established and
stable structures, policies and regulations limit the possible influence of transformational
leadership (Antonakis, Avolio, & Sivasubramaniam, 2003; Javidan & Waldman, 2003).

MULTI-TRAIT-MULTI-METHOD LEADERSHIP 8
Thus, in addition to the rating perspective, the effects of supervisors’ gender and the
hierarchical level as well as the effects of the type of organization (public vs. private) on the
TLI scores were investigated. If any of these potential effects could be observed, specific
norms for the respective groups should be generated.
Method
Samples and Procedures
In order to enhance external validity of results, an effort was made to obtain several
samples for the purpose of the present study. For the profit and the non-profit sector, data
from four and five, respectively, independent organizations located in Germany, were
collected. For the profit sector, samples of employees from a railway company (#1), a
company specialized on human resource programs (Sample #2) and from senior physicians of
a university hospital (#3) were drawn. In addition, a newspaper sample (#4, for a more
detailed description see below) was acquired. For the non-profit section, a sample of pastors
from the roman-catholic church was drawn (sample #5). Next, several orchestras with their
conductors (#6) and several members of police departments (Sample #7) participated in the
study. So did employees from governmental agencies involved in local administration and
courts (Sample #8). Additionally, a snowball sample (#9) of non-profit supervisors and their
followers was acquired. Overall, these nine samples represent a wide variety of profit and
non-profit organizations.
For all samples (except for the newspaper sample, #4, and the snowball sample, #9),
the respective organizations were contacted. The goal of the study was communicated to the
participants. Supervisors took part voluntarily and invited their followers to deliver their
ratings. For matching supervisors’ and followers’ data, each respondent had to provide the
name of the supervisor in focus. Data was collected via an online survey. Respondents filled
out the survey during work time and voluntarily. As for the newspaper sample (#4),

MULTI-TRAIT-MULTI-METHOD LEADERSHIP 9
participants were recruited via a newspaper article, which included a link to the survey. Each
participant was asked whether he/she was a member of a profit or non-profit organization.
Respondents who indicated membership in non-profit organizations were excluded since only
profit organizations were part of this study. Each person participating in the survey had the
opportunity to take part in a lottery. The participants of the snowball sample (#9) were
contacted via e-mail and asked to follow a link and to complete the questionnaire. A lottery
was organized here, too. Only supervisors and their followers from non-profit organizations
were included in this study. In the newspaper sample (#4) and the snowball sample (#9), the
participants had the opportunity to invite their followers if they were leaders, or to invite their
supervisor if they took part as a follower. The demographic characteristics of the nine samples
are summarized in Table 1.
[Insert Table 1 about here]
Questionnaire
As mentioned above, the Transformational Leadership Inventory (TLI; Podsakoff et
al., 1990) is a well established instrument for the assessment of six scales of transformational
and one scale of transactional leadership. The six scales of transformational leadership are (1)
Articulating a Vision (AV, 5 items, e.g. “…paints an interesting picture of the future for our
group.”), (2) Providing an Appropriate Model (PAM, 3 items, e.g. “…provides a good model
to follow.”), (3) Fostering the Acceptance of Group Goals (FAG, 4 items, e.g. “…encourages
team members to be ‘team players’.”), (4) High Performance Expectations (HPE, 3 items, e.g.
“…will not settle for second best.”), (5) Individualized Support (IS, 4 items, e.g. “…shows
respect for my personal feelings.”), (6) Intellectual Stimulation (ISN, 3 items, e.g. “…has
stimulated me to think about old problems in new ways.”). As transactional scale Contingent
Reward is measured (CR, 4 items, e.g. “…commends me when I do a better than average
job.”). For the follower rating, the items were preceded by the phrase “The person I describe

MULTI-TRAIT-MULTI-METHOD LEADERSHIP 10
…”; in the self rating of the supervisors, the pronoun “I” was shown above the items. The
items were to be answered on a five-point Likert-type scale ranging from strongly disagree to
strongly agree. In the present study, a German validated version of the TLI (Heinitz &
Rowold, 2007) was utilized. In several empirical studies, this version demonstrated adequate
levels of internal consistency estimates per scales, as well as adequate levels of factorial and
criterion-oriented validity (Heinitz & Rowold, 2007; Rowold et al., 2009).
Preliminary Analyses
For the multi-trait-multi-method analysis 178 self ratings of supervisors and 834
follower ratings of their respective followers were matched. For the followers belonging to
the same supervisor it was checked if the ratings are sufficiently homogeneous as to be
aggregated. The interrater agreement was evaluated using rwg, ICC(1) and ICC(2) (LeBreton
& Senter, 2007). The average rwg ranged for the seven scales from .66 to .77, with five of the
scales above the cut point for high agreement of .70 (M = .73). For teams with three or more
followers, ICC(1) varied between .32 and .49 (M = .41) and ICC(2) between .59 and .75
(M = .67), with indices significantly different from zero for all scales (F = 2.43 - 3.92; all
p < .01). Therefore, followers’ ratings of the same supervisor showed satisfactory levels of
agreement and were aggregated as mean.
The descriptive characteristics for the self ratings and the aggregated follower ratings
are summarized in Table 2. Internal consistencies estimates (Cronbach’s alphas) were higher
for the follower ratings but given the small number of items per scale (i.e., 3 to 5) still
acceptable for the self ratings as well (Cortina, 1993). As expected, medium to high zero-
order intercorrelations were found between the transformational leadership scales as well as
between transactional (CR) and transformational leadership, confirming the above described
problems of discriminant validity.
[Insert Table 2 about here]
MULTI-TRAIT-MULTI-METHOD LEADERSHIP 11
CFA and Invariance Analyses
In the first step of confirmatory factor analyses (CFA) the measurement model is
tested separately for the follower rating and the self rating. In the target model each of the
seven trait factors is linked to its corresponding items. Due to the high number of indicators,
the items were combined into two parcels per scale (Bandalos, 2002; Landis, Beal, & Tesluk,
2000) resulting in 14 measures for the follower rating and 14 measures for the self rating.
MTMM Analysis
The MTMM was conducted as a confirmatory factor analysis (e.g., Marsh, 1989). The
TLI scales were modeled as trait factors, and the two rating perspectives were modeled as
method factors. Each indicator loads on its trait factor (one of seven TLI scales) and on the
respective method factor (self vs. follower rating). Applying a correlated trait correlated
method (CTCM) model, the trait factors are allowed to correlate, as do the method factors.
However, between these two groups of factors no intercorrelations are permitted. The
variance of one error was fixed to 0.1 following the guidelines of Chen and colleagues (Chen,
Bollen, Paxton, Curran, & Kirkby, 2001). This procedure yielded an overidentified model
with 301 degrees of freedom.
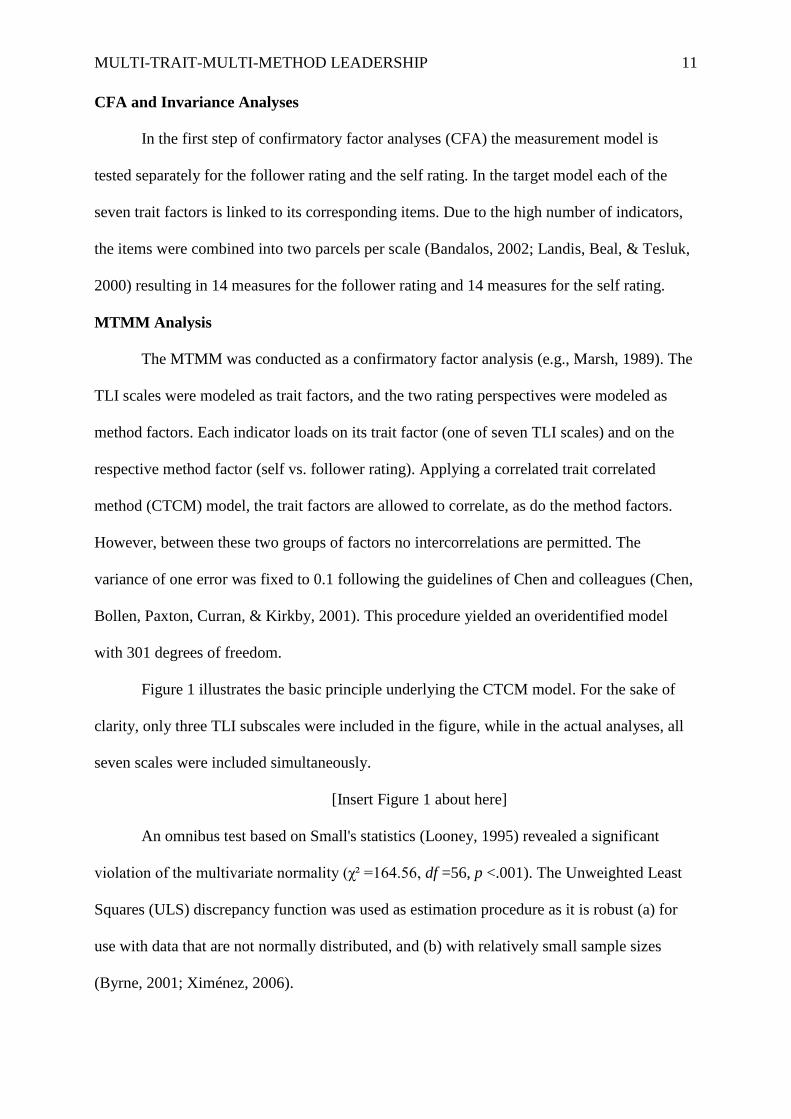
Figure 1 illustrates the basic principle underlying the CTCM model. For the sake of
clarity, only three TLI subscales were included in the figure, while in the actual analyses, all
seven scales were included simultaneously.
[Insert Figure 1 about here]
An omnibus test based on Small's statistics (Looney, 1995) revealed a significant
violation of the multivariate normality (χ² =164.56, df =56, p <.001). The Unweighted Least
Squares (ULS) discrepancy function was used as estimation procedure as it is robust (a) for
use with data that are not normally distributed, and (b) with relatively small sample sizes
(Byrne, 2001; Ximénez, 2006).

MULTI-TRAIT-MULTI-METHOD LEADERSHIP 12
Several fit indices were computed to assess the model fit. In addition to the χ² values,
the goodness-of-fit (GFI) and the adjusted GFI (AGFI) were calculated. For these indices, a
value of .90 as minimum was postulated for appropriate fit (Hu & Bentler, 1995). The
standardized root mean square residual (SRMR) was considered as well, with values below
.08 indicating good fit (Hu & Bentler, 1999).
Apart from the fit indices that are provided in a SEM based MTMM, it allows to
partition the variance of the indicators into trait, method, and error components (cf. Bagozzi,
Youjae, & Phillips, 1991). Squaring the factor loading, their relative portions were calculated.
Development of Norms
For practical use of the TLI, norms are necessary so that the individual scores can be
judged against those of a relevant comparison group. Several variables were identified that
might affect the average score level of transformational and transactional leadership. For the
rating perspective (self vs. follower), the supervisor’s gender, the hierarchical level (lower,
middle, higher), and the type of organization (profit, non-profit) it was checked via variances
of analysis if the respective subgroups show significant differences in the seven TLI scales.
Based on these findings, specific norms (T-values) were developed where significant
differences could be observed.
Results
Factorial Validity and Invariance
Before conducting the MTMM analysis, the factorial validity of the measurement
model was tested separately for the self ratings of supervisors and the ratings of their
followers. As described above, two item parcels per scale were used as indicators. The fit
indices in Table 3 confirm the measurement model for both perspectives.
In the second step, factorial invariance across perspectives was tested. Within the
different forms of factorial invariance, configural invariance is the most basic one (Steenkamp

MULTI-TRAIT-MULTI-METHOD LEADERSHIP 13
& Baumgartner, 1998; Vandenberg & Lance, 2000). It assumes that the indicators measure
the same leadership scale across rating perspectives. Therefore, it postulates that the specified
model has the same non-zero and zero factor loadings for both perspectives. The next form of
factorial invariance is metric invariance, where the factor loadings are required to have the
same loadings across rating perspectives. The multi-group CFA revealed a good model fit in
both steps of the invariance analyses (Table 3), confirming the configural and the metric
invariance. In sum, these results give strong support for the applicability of the MTMM
analysis to the present data.
MTMM Analysis
The MTMM analysis itself was modeled as CTCM and revealed very good fit indices,
GFI = .99, AGFI = .98, SRMR = .05 (Table 3).
[Insert Table 3 about here]
Further analyses of the model gave insight into factor loadings and the various
variance sources. As summarized in Table 4, for each indicator the proportions of variance
that were due to trait, method, and error, were calculated by squaring the factor loadings. As
numerous indicators had high loadings on the method factors, strong method effects could be
observed. Averaged across the indicators, a considerable portion of their variance (45%, see
last row of Table 4) was explained by the method of self vs. follower rating.
[Insert Table 4 about here]
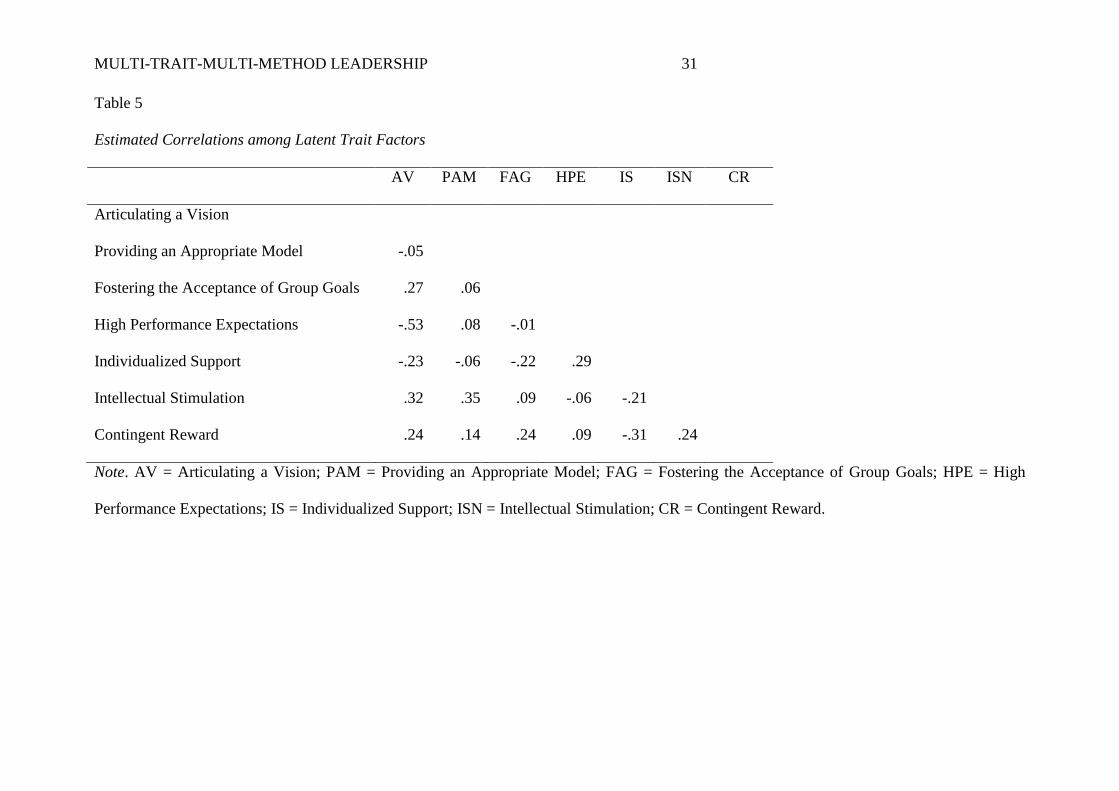
The correlations between the latent trait variables (i.e., leadership constructs) were
used to explore the discriminant validity of the scales (Table 5). As a result of the substantial
method effects, dramatically changes could be observed comparing these latent correlations
with the observed ones (Table 2). The zero-order correlations (mean | r | = .64 for follower
ratings and mean | r | = .37 for self ratings) reached on average a high level (Cohen, Cohen,

MULTI-TRAIT-MULTI-METHOD LEADERSHIP 14
West, & Aiken, 2002), indicating the lack of discriminant validity. However, controlling for
the method factors, the correlations decreased to a small to medium level (mean | r | = .20).
[Insert Table 5 about here]
Development of Norms
First, the descriptive statistics of the seven TLI scales were examined for the total
sample (Table 6). Absolute values for skewness varied among the scales for follower and self
ratings between .10 and .88 and between .17 and .66, respectively. Those for kurtosis ranged
from .32 to .48 and from .02 to .50, respectively. As none of the values indicated a substantial
deviance from a normal distribution (Muthén & Kaplan, 1985), the TLI scales can be
regarded as normally distributed. The internal consistencies (Cronbach’s alphas; Table 6) of
the seven TLI-scales supported the notion that transformational and transactional leadership
can be assessed with acceptable levels of reliability (.68 - .90 for follower ratings and .62 - .83
for self ratings).
[Insert Table 6 about here]
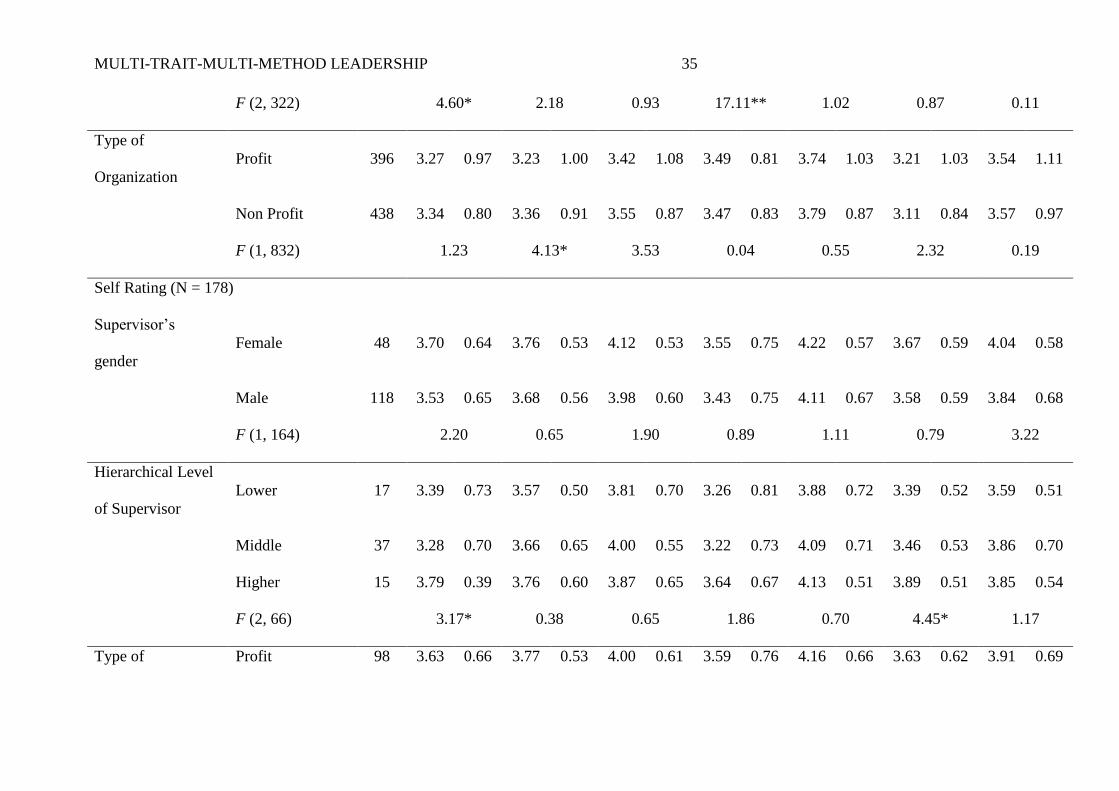
In order to identify those variables that have significant effects on the TLI scales,
group means were compared for rating perspective (follower vs. self rating), supervisors’
gender, the hierarchical level (lower, middle, higher) and type of organization (profit vs. non
profit).
As expected, the average TLI scores were significantly higher for the self rating than
for the follower ratings, except for ‘High Performance expectations’ where no significant
difference could be observed (Table 7). For the individual and organizational variables, only
very few significant differences could be found between the subgroups of gender, hierarchical
level and type of organization (Table 7). Therefore, specific norms were developed for self vs.
follower ratings, but not for any of the other subgroups (see Appendix for the norms in Table
A1).

MULTI-TRAIT-MULTI-METHOD LEADERSHIP 15
[Insert Table 7 about here]
Discussion
The results of the present study should be discussed with two different foci: On the
one hand, focusing on the instrument that was used, the Transformational Leadership
Inventory (TLI), several implications can be described. Furthermore, norms were provided
that enable the application of the German version in practical issues and the interpretation of
individual results. On the other hand, the results can be regarded in terms of their theoretical
implications for the transformational/transaction leadership theory. Limitations of this study
and suggestions for future research agendas are discussed within the two paragraphs.
Implications for Leadership Theory
For the first time in leadership research, scales measuring aspects of the theoretically
discrete constructs of transformational and transactional leadership could be discriminated
empirically. This outcome could be achieved although the subscales of transformational and
transactional leadership showed considerable zero-order correlations in the present sample,
corresponding to previous findings. Utilizing the SEM-based MTMM methodology to
analyze self and follower ratings, substantive method effects could be observed. These
method effects were identified as source of shared variance between the leadership constructs
that has limited their discriminate validity. Controlling for the method effects, the correlations
between the scales decreased considerably, yielding discriminant leadership constructs.
As a first limitation of the study, it should be pointed out that the reduction of
correlations was achieved on the level of the leadership scales. A striking evidence for the
construct validity of transformational and transactional leadership would require at least two
further steps: First, within the two constructs, convergent validity has to be shown for the
respective subscales. However, transactional leadership in the TLI only consists of one scale,
Contingent Reward, the conclusions are strictly speaking limited to this facet. Next, the

MULTI-TRAIT-MULTI-METHOD LEADERSHIP 16
results have to be replicated with other samples and with other instruments. In particular, it
should be explored whether the scales of transformational and transactional leadership of the
MLQ could be separated via MTMM analyses. It has to be examined carefully if the problems
concerning its factorial structure could also be alleviated in this mannger. Furthermore,
replicating the results with other instruments could help to evaluate in how far the present
results might have been influenced by the item-parcel-assignments within the already short
TLI scales.
Before explicating some further aspects for future research topics, some implications
of the results should be described. Controlling for method effects in a MTMM analysis
yielded differentiable leadership constructs. As consequence for the theory of
transformational and transactional leadership, this finding can at last elucidate why the
theoretically discrete constructs remain to show substantial correlations. The presented
procedures and results show why such observed zero-order correlations do not inevitably
menace the discriminant validity of the constructs. Leadership researchers thus can now have
more confidence in the construct validity of the transformational/transactional leadership
theory. As implication for their future research work, it can be recommended to use several
rating perspectives in order to be able to control for method effects. Practitioners frequently
heed this advice already by collecting 360 degree ratings from different perspectives and
comparing these ratings for the individual leaders.
Implementing such a multi-source design in a research context, the present study
yielded discriminant leadership constructs. Future research could build on and extend this
kind of methodological approach in at least three ways: First, other rating perspectives should
be regarded and analyzed in MTMM studies, for example peer ratings and ratings from the
supervisor of the leader in focus. In this way, the unique effects of the different perspectives
could be analyzed. Second, as for the perspectives, the differences between the latent traits

MULTI-TRAIT-MULTI-METHOD LEADERSHIP 17
(Table 4) could be further analyzed – for example, in how far are the different scales
influenced by the different perspectives. Third, the relationships of latent (i.e., multi-source
variance controlled for) transformational and transactional leadership constructs with other
individual or organizational variables can be analyzed. For example, the contribution of these
latent constructs to the prediction of individual outcomes (e.g., affective commitment) and
objective performance data (e.g., branch-level profit) could be investigated: Do these latent
constructs show lower correlations to subjective satisfaction measures as the common source
variance is controlled for? Will latent leadership constructs contribute more or less to the
prediction of objective data if the effects of the specific perspectives are not an issue any
more? Additionally, the incremental validities of the leadership constructs could be specified
more reliably.
Implications for the Transformational Leadership Inventory
Concerning the Transformational Leadership Inventory, its factorial structure was
confirmed again, replicating prior research (e.g., Heinitz & Rowold, 2007). However, the
present study went beyond prior research by providing evidence for its factorial validity for
the two perspectives of self and follower ratings. Also, factorial invariance of these
perspectives was supported for the first time.
In contrast to their invariant structure, self and follower ratings showed significant
differences in average score level. In accordance with previous findings, supervisors evaluate
their own leadership behavior more favorable than do their respective followers. The TLI
scores are thus higher for the self rating than for the follower rating, indicating the demand for
specific norms for the two rating perspectives. The supervisor’s gender had no significant
effect on the TLI scores, nor did the hierarchical level, nor the type of organization (public vs.
private). As this lack of significance might partly be due to the limited sample sizes within

MULTI-TRAIT-MULTI-METHOD LEADERSHIP 18
subgroups, the observed differences are described with respect to their effect sizes and in the
light of previous findings.
Concerning follower ratings, at least slightly higher levels of transformational
leadership were expected for female supervisors, particularly for Individualized Support
(Eagly et al., 2003). Apart from sample size, in this study, female and male leaders did not
show any difference at all in the followers’ ratings of their Individualized Support (M = 3.84
for both groups, Table 7). For the other scales as well, no gender differences reached the level
of a small effect size (Cohen, 1988).
For leaders at lower hierarchical levels, the meta-analysis of Lowe et al. (1996)
revealed higher scores of transformational leadership although the authors expected the
reverse. In the present data, the follower ratings increased with the hierarchical level of the
supervisor for some scales and decreased for others. For Individualized Support, the construct
for which Lowe et al. (1996) found the greatest effect, almost no differences could be
observed (Table 7).
For the impact of the type of organization on the amount of transformational
leadership, it was argued that within public organizations, bureaucratic structures may limit
transformational leadership behavior in comparison to private companies. While Lowe et al.
(1996) found – contrary to the expectations – greater mean scores of transformational
leadership in public organizations, the present data showed hardly any differences.
In sum, the group comparisons of the follower ratings revealed fewer differences than
expected. Future research should clarify which context or sampling factors moderate the
occurrence and magnitude of the differences (for a detailed discussion on possible context
factors and psychological mechanisms see Antonakis et al., 2003; Eagly et al., 2003; Lowe et
al., 1996). For the present paper, the samples themselves and the selection procedure of
leaders and their followers might have played a role.

MULTI-TRAIT-MULTI-METHOD LEADERSHIP 19
For the self ratings of the supervisors, greater differences could be observed between
the subgroups of the supervisor’s gender, hierarchical level, and type of organization. The
differences did not reach a level of significance as the sample sizes were too small. For small
effects (d = .20), an a priori power analysis (Faul, Erdfelder, Lang, & Buchner, 2007) yielded
appropriate sample sizes of N = 620 and 858 for the common levels of power of .80 and .90,
respectively. Given the follower perspective as common way of leadership assessment, the
present results for the self ratings cannot be contrasted with findings of systematic group
comparisons or meta-analyses. Together with the small sample size, they should therefore be
regarded as first step towards detailed analyses of self rated transformational leadership in
future research.
As no reliable group differences could be found, specific norms were developed only
for the two rating perspectives. These norms allow practitioners to use the TLI in
organizational settings and to give individual feedback to supervisors who described their
own behavior and/or who were described by their followers. However, as norms for the
German TLI were developed for the first time, they should be used with caution (see
Appendix for norm tables and instructions for the application of the norms).
References
Antonakis, J., Avolio, B. J., & Sivasubramaniam, N. (2003). Context and leadership: An
examination of the nine-factor full-range leadership theory using the Multifactor
Leadership Questionnaire. Leadership Quarterly, 14, 261-295.
Atwater, L. E. & Yammarino, F. J. (1997). Self-other rating agreement: A review and model.
Research in Personnel and Human Resources Management, 15, 121-174.

MULTI-TRAIT-MULTI-METHOD LEADERSHIP 20
Avolio, B. J. (1999). Full leadership development: Building the vital forces in organizations.
Thousand Oaks: Sage Publications.
Avolio, B. J., Bass, B. M., & Jung, D. I. (1999). Re-examining the components of
transformational and transactional leadership using the Multifactor Leadership
Questionnaire. Journal of Occupational and Organizational Psychology, 72, 441-462.
Bagozzi, R. P., Youjae, Y., & Phillips, L. W. (1991). Assessing Construct Validity in
Organizational Research. Administrative Science Quarterly, 36, 421-458.
Bandalos, D. L. (2002). The effects of item parceling on goodness-of-fit and parameter
estimate bias in structural equation modeling. Structural Equation Modeling: A
Multidisciplinary Journal, 9, 78-102.
Bass, B. M. (1985). Leadership and performance beyond expectations. New York: Free Press.
Bass, B. M. & Avolio, B. J. (2000). MLQ Multifactor Leadership Questionnaire. Redwood
City: Mind Garden.
Bass, B. M. & Bass, R. (2008). Bass's handbook of leadership (4th ed.). New York: The Free
Press.
Bycio, P., Hackett, R. D., & Allen, J. S. (1995). Further assessments of Bass (1985)
conceptualization of transactional and transformational leadership. Journal of Applied
Psychology, 80, 468-478.
Byrne, B. M. (2001). Structural equation modeling with Amos: Basic concepts, applications,
and programming. New York: Lawrence Erlbaum Ass.
MULTI-TRAIT-MULTI-METHOD LEADERSHIP 21
Campbell, D. T. & Fiske, D. W. (1959). Convergent and discriminant validation by the
multitrait-multimethod matrix. Psychological Bulletin, 56, 81-105.
Chen, F., Bollen, K. A., Paxton, P., Curran, P. J., & Kirkby, J. B. (2001). Improper solutions
in structural equation models. Sociological Methods & Research, 29, 468-508.
Cohen, J. (1988). Statistical power analysis for the behavioral sciences. Hillsdale, NY:
Erlbaum.
Cohen, P., Cohen, J., West, S. G., & Aiken, L. S. (2002). Applied multiple
regression/correlation analysis for the behavioral sciences. New Jersey: Lawrence
Erlbaum Associates.
Cortina, J. M. (1993). What is coefficient alpha? An examination of theory and applications.
Journal of Applied Psychology, 78, 98-104.
Den Hartog, D. N., Van Muijen, J. J., & Koopman, P. L. (1997). Transactional versus
transformational leadership: An analysis of the MLQ. Journal of Occupational and
Organizational Psychology, 70, 19-34.
Eagly, A. H., Johannesen-Schmidt, M. C., & van Engen, M. L. (2003). Transformational,
transactional, and laissez-faire leadership styles: A meta-analysis comparing woman
and men. Psychological Bulletin, 129, 569-591.
Faul, F., Erdfelder, E., Lang, A.-G., & Buchner, A. (2007). G*Power 3: A flexible statistical
power analysis program for the social, behavioral, and biomedical sciences. Behavior
Research Methods, 39, 175-191.
Harris, M. M. & Schaubroeck, J. (1988). A meta-analysis of self-supervisor, self-peer, and
peer-supervisor ratings. Personnel Psychology, 41, 43-62.

MULTI-TRAIT-MULTI-METHOD LEADERSHIP 22
Heinitz, K., Liepmann, D., & Felfe, J. (2005). Examining the factor structure of the MLQ:
Recommendation for a reduced set of factors. European Journal of Psychological
Assessment, 21, 182-190.
Heinitz, K. & Rowold, J. (2007). Gütekriterien einer deutschen Adaptation des
Transformational Leadership Inventory (TLI) von Podsakoff. Zeitschrift für Arbeits-
und Organisationspsychologie, 51, 1-15.
Hu, L. T. & Bentler, P. M. (1995). Evaluating model fit. In R. H. Hoyle (Ed.), Structural
equation modeling: Concepts, issues and applications (pp. 76-99). Thousand Oaks:
Sage.
Hu, L. T. & Bentler, P. M. (1999). Cutoff criteria for fit indexes in covariance structure
analysis: Conventional criteria versus new alternatives. Structural Equation Modeling,
6, 1-55.
Javidan, M. & Waldman, D. A. (2003). Exploring charismatic leadership in the public sector:
Measurement and consequences. Public Administration Review, 63, 229-242.
Judge, T. A. & Piccolo, R. F. (2004). Transformational and transactional leadership: A meta-
analytic test of their relative validity. Journal of Applied Psychology, 89, 755-768.
Landis, R. S., Beal, D. J., & Tesluk, P. E. (2000). A comparison of approaches to forming
composite measures in structural equation models. Organizational Research Methods,
3, 186-207.
LeBreton, J. M. & Senter, J. L. (2007). Answers to 20 questions about interrater reliability
and interrater agreement. Organizational Research Methods, 11, 815-852.

MULTI-TRAIT-MULTI-METHOD LEADERSHIP 23
Looney, S. W. (1995). How to use tests for univariate normality to assess multivariate
normality. American Statistician, 49, 64-70.
Lowe, K. B., Kroeck, K. G., & Sivasubramaniam, N. (1996). Effectiveness correlates of
transformational and transactional leadership: A meta-analytic review of the MLQ
literature. Leadership Quarterly, 7, 385-425.
MacKenzie, S. B., Podsakoff, P. M., & Rich, G. A. (2004). Transformational and
transactional leadership and salesperson performance. Journal of the Academy of
Marketing Science, 29, 115-134.
Marsh, H. W. (1989). Confirmatory factor analyses of multitrait-multimethod data: Many
problems and a few solutions. Applied Psychological Measurement, 13, 335-361.
Muthén, B. & Kaplan, D. (1985). A comparison of some methodologies for the factor analysis
of non-normal Likert variables. British Journal of Mathematical and Statistical
Psychology, 38, 171-189.
Podsakoff, P. M., MacKenzie, S. B., & Bommer, W. H. (1996). Transformational leader
behaviors and substitutes for leadership as determinants of employee satisfaction,
commitment, trust, and organizational citizenship behaviors. Journal of Management,
22, 259-298.
Podsakoff, P. M., MacKenzie, S. B., Moorman, R. H., & Fetter, R. (1990). Transformational
leader behaviors and their effects on followers' trust in leader, satisfaction, and
organizational citizenship behaviors. Leadership Quarterly, 1, 107-142.
Rowold, J. (2005). Multifactor Leadership Questionnaire: Psychometric properties of the
German translation by Jens Rowold. Redwood City: Mind Garden.

MULTI-TRAIT-MULTI-METHOD LEADERSHIP 24
Rowold, J., Borgmann, L., & Heinitz, K. (2009). Ethische Führung - Gütekriterien einer
deutschen Adaptation der Ethical Leadership Scale (ELS-D) von Brown et al. (2005).
Zeitschrift für Arbeits- und Organisationspsychologie, 52, 1-13.
Rowold, J. & Heinitz, K. (2007). Transformational and charismatic leadership: Assessing the
convergent, divergent and criterion validity of the MLQ and the CKS. Leadership
Quarterly, 18, 121-133.
Steenkamp, J. E. M. & Baumgartner, H. (1998). Assessing measurement invariance in cross-
national consumer research. Journal of Consumer Research, 25, 78-89.
Vandenberg, R. J. & Lance, C. E. (2000). A review and synthesis of the measurement
invariance literature: Suggestions, practices, and recommendations for organizational
research. Organizational Research Methods, 3, 4-69.
Vandenberghe, C., Stordeur, S., & D'hoore, W. (2002). Transactional and transformational
leadership in nursing: Structural validity and substantive relationships. European
Journal of Psychological Assessment, 18, 16-29.
Ximénez, C. (2006). A monte carlo study of recovery of weak factor loadings in confirmatory
factor analysis. Structural Equation Modeling, 13, 587-614.
Yukl, G. (1999). An evaluation of conceptual weaknesses in transformational and charismatic
leadership theories. Leadership Quarterly, 10, 285-305.

MULTI-TRAIT-MULTI-METHOD LEADERSHIP 25
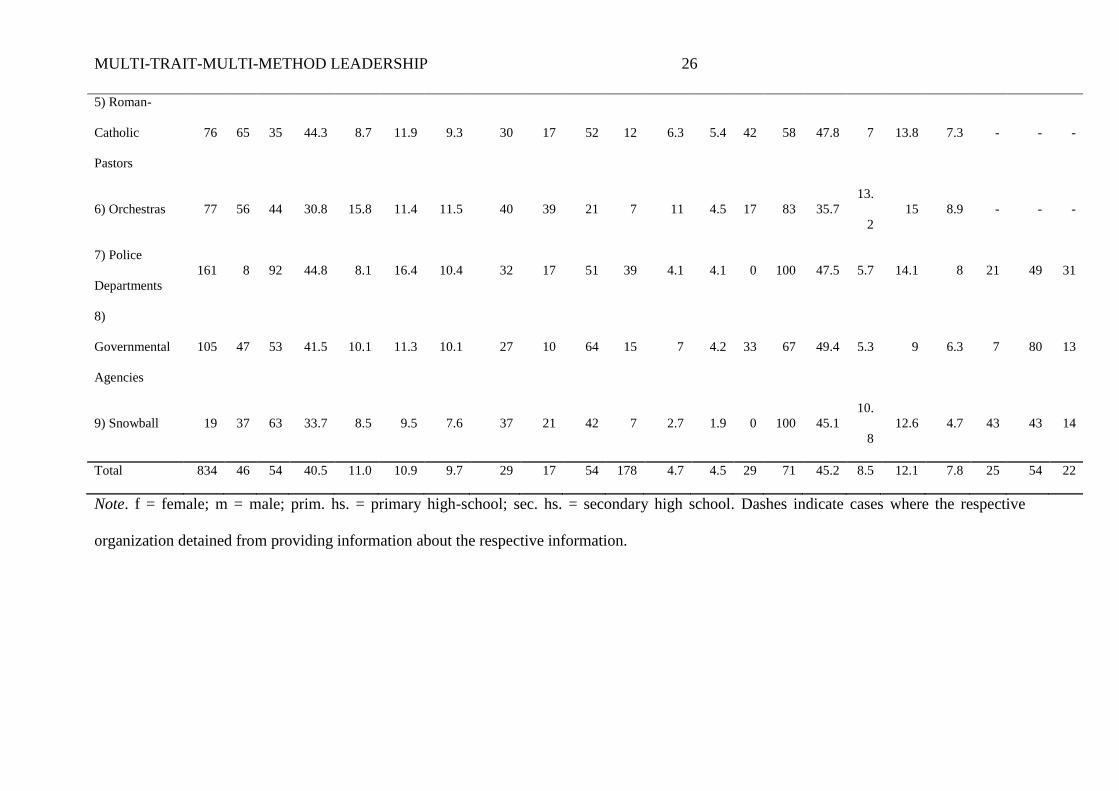
Table 1
Demographic and Organizational Characteristics of Samples
Followers Supervisors
N Sex [%] Age [y] Tenure [y] Education [%] N
followers /
supervisor
Sex [%] Age [y] Tenure [y]
hierachical level
[%]
f m M SD M SD
prim.
hs
sec.
hs
uni M SD f m M SD M SD
low
er
midd
le
hig
her
A) Profit
Samples
1) Railway
Company
37 19 81 44.3 9.5 16.7 10.4 38 19 43 5 7.4 1.7 0 100 45.8 6.8 21 12.9 60 40 0
2) HR
Company
192 66 34 40.7 9.5 6.0 4.7 11 7 82 35 5.5 3.0 66 34 45.5 8.1 10.9 6.1 - - -
3) Senior
Physicians
84 - - - - - - - - - 10 8.4 9.8 - - - - - - - - -
4) Newspaper
Sample
83 67 33 36.2 10.4 8.4 7.8 45 30 25 48 1.7 1.3 29 71 42.4 9.5 10.7 8.3 67 33 0
B) Non-profit
Samples
MULTI-TRAIT-MULTI-METHOD LEADERSHIP 26
5) Roman-
Catholic
Pastors
76 65 35 44.3 8.7 11.9 9.3 30 17 52 12 6.3 5.4 42 58 47.8 7 13.8 7.3 - - -
6) Orchestras 77 56 44 30.8 15.8 11.4 11.5 40 39 21 7 11 4.5 17 83 35.7
13.
2
15 8.9 - - -
7) Police
Departments
161 8 92 44.8 8.1 16.4 10.4 32 17 51 39 4.1 4.1 0 100 47.5 5.7 14.1 8 21 49 31
8)
Governmental
Agencies
105 47 53 41.5 10.1 11.3 10.1 27 10 64 15 7 4.2 33 67 49.4 5.3 9 6.3 7 80 13
9) Snowball 19 37 63 33.7 8.5 9.5 7.6 37 21 42 7 2.7 1.9 0 100 45.1
10.
8
12.6 4.7 43 43 14
Total 834 46 54 40.5 11.0 10.9 9.7 29 17 54 178 4.7 4.5 29 71 45.2 8.5 12.1 7.8 25 54 22
Note. f = female; m = male; prim. hs. = primary high-school; sec. hs. = secondary high school. Dashes indicate cases where the respective
organization detained from providing information about the respective information.

MULTI-TRAIT-MULTI-METHOD LEADERSHIP 27
Table 2
Descriptive Statistics and Correlations for Aggregated Follower Ratings and Self Ratings
Aggregated
follower ratings
Supervisors’
self ratings Correlations
M SD α M SD α AV PAM FAG HPE IS ISN CR
Articulating a Vision 3.36 0.75 .93 3.56 0.66 .83 .57** .52** .55** .15* .64** .33**
Providing an Appropriate Model 3.38 0.73 .83 3.70 0.57 .62 .78** .45** .39** .23** .44** .33**
Fostering the Acceptance of Group Goals 3.56 0.82 .93 4.00 0.60 .79 .86** .76** .37** .19** .44** .39**
High Performance Expectations 3.46 0.63 .70 3.45 0.77 .68 .44** .26** .28** .00 .38** .34**
Individualized Support 3.91 0.72 .92 4.13 0.65 .62 .70** .72** .73** .06 .19** .32**
Intellectual Stimulation 3.23 0.71 .87 3.60 0.60 .67 .79** .71** .69** .32** .54** .37**
Contingent Reward 3.66 0.81 .92 3.89 0.65 .76 .77** .71** .78** .32** .77** .64**
Note. N = 178. Coefficients below the diagonal represent correlations for aggregated follower ratings, those above the diagonal represent
correlations for self ratings; AV = Articulating a Vision; PAM = Providing an Appropriate Model; FAG = Fostering the Acceptance of Group
Goals; HPE = High Performance Expectations; IS = Individualized Support; ISN = Intellectual Stimulation; CR = Contingent Reward; * p < .05,
** p < .01.

MULTI-TRAIT-MULTI-METHOD LEADERSHIP 28
Table 3
Results of Confirmatory Factor Analyses
χ² df GFI AGFI SRMR
Step 1) Measurement Model
Follower Rating - 7 Factors 3.199 56 1.00 1.00 0.02
Self Rating - 7 Factors 9.434 56 0.99 0.98 0.04
Step 2) Invariance Analyses (Follower vs. Self Rating)
Configural Invariance 12.633 112 1.00 0.99 0.02
Metric Invariance 55.238 126 0.99 0.98 0.05
Step 3) MTMM Analyses
CTCM 58.938 301 0.99 0.98 0.05
Note. GFI = Goodness of Fit Index, AGFI = Adjusted Goodness of Fit Index, SRMR = Standardized
Root Mean Square Residual.

MULTI-TRAIT-MULTI-METHOD LEADERSHIP 29
Table 4
Sources of Variances in the CTCM Model for Each Indicator (for Parcel 1 / Parcel 2, Respectively)
Trait Method Error
Follower Rating
Articulating a Vision .15 / .09 .77 / .78 .05 / .08
Providing an Appropriate Model .34 / .05 .58 / .72 .04 / .16
Fostering the Acceptance of Group Goals .13 / .22 .71 / .77 .12 / .01
High Performance Expectations .36 / .28 .07 / .08 .26 / .43
Individualized Support .02 / .02 .67 / .66 .17 / .17
Intellectual Stimulation .25 / .32 .53 / .40 .13 / .17
Contingent Reward .00 / .00 .81 / .71 .12 / .22
Self rating
Articulating a Vision .13 / .19 .58 / .47 .15 / .15
Providing an Appropriate Model .00 / .00 .46 / .24 .20 / .40
Fostering the Acceptance of Group Goals .05 / .09 .43 / .39 .24 / .21
High Performance Expectations .37 / .13 .24 / .15 .25 / .74

MULTI-TRAIT-MULTI-METHOD LEADERSHIP 30
Individualized Support .48 / .59 .06 / .10 .25 / .15
Intellectual Stimulation .00 / .01 .36 / .47 .24 / .33
Contingent Reward .67 / .14 .35 / .16 .10 / .24
Mean .18 .45 .21
MULTI-TRAIT-MULTI-METHOD LEADERSHIP 31
Table 5
Estimated Correlations among Latent Trait Factors
AV PAM FAG HPE IS ISN CR
Articulating a Vision
Providing an Appropriate Model -.05
Fostering the Acceptance of Group Goals .27 .06
High Performance Expectations -.53 .08 -.01
Individualized Support -.23 -.06 -.22 .29
Intellectual Stimulation .32 .35 .09 -.06 -.21
Contingent Reward .24 .14 .24 .09 -.31 .24
Note. AV = Articulating a Vision; PAM = Providing an Appropriate Model; FAG = Fostering the Acceptance of Group Goals; HPE = High
Performance Expectations; IS = Individualized Support; ISN = Intellectual Stimulation; CR = Contingent Reward.

MULTI-TRAIT-MULTI-METHOD LEADERSHIP 32
Table 6
Descriptives for Norm Samples
M SD Skewness Kurtosis
Cronbach’s
Alpha
Follower Ratings (N = 834)
Articulating a Vision 3.30 0.88 -0.38 -0.33 0.89
Providing an Appropriate Model 3.30 0.96 -0.38 -0.38 0.82
Fostering the Acceptance of Group Goals 3.49 0.98 -0.52 -0.32 0.90
High Performance Expectations 3.48 0.82 -0.10 -0.48 0.68
Individualized Support 3.76 0.95 -0.88 0.38 0.89
Intellectual Stimulation 3.16 0.94 -0.19 -0.41 0.85
Contingent Reward 3.55 1.04 -0.53 -0.48 0.89
Self Ratings (N = 178)
Articulating a Vision 3.56 0.66 -0.34 0.05 0.83
Providing an Appropriate Model 3.70 0.57 -0.23 0.23 0.62
Fostering the Acceptance of Group Goals 4.00 0.60 -0.48 -0.02 0.79
High Performance Expectations 3.45 0.77 -0.27 -0.27 0.68

MULTI-TRAIT-MULTI-METHOD LEADERSHIP 33
Individualized Support 4.13 0.65 -0.63 -0.50 0.62
Intellectual Stimulation 3.60 0.60 -0.17 -0.41 0.67
Contingent Reward 3.89 0.65 -0.66 0.26 0.76

MULTI-TRAIT-MULTI-METHOD LEADERSHIP 34
Table 7
Comparisons of Means for Groups, Divided According to Rating Perspective, Supervisor’s Gender, Hierarchical Level and Type of Organization
AV PAM FAG HPE IS ISN CR
N M SD M SD M SD M SD M SD M SD M SD
Rating Perspective Follower Rating 834 3.30 0.88 3.30 0.96 3.49 0.98 3.48 0.82 3.76 0.95 3.16 0.94 3.55 1.04
Self Rating 178 3.56 0.66 3.70 0.57 4.00 0.60 3.45 0.77 4.13 0.65 3.60 0.60 3.89 0.65
F (1, 1010) 13.15** 28.37** 44.89** 0.14 24.18** 36.08** 16.97**
Follower Rating (N = 834)
Supervisor’s
Gender
Female 234 3.23 0.96 3.27 1.03 3.54 1.04 3.46 0.74 3.84 0.98 3.09 0.97 3.65 1.03
Male 503 3.37 0.82 3.38 0.90 3.56 0.89 3.51 0.85 3.84 0.84 3.16 0.88 3.60 0.98
F (1, 735) 4.42* 1.98 0.07 0.62 0.01 0.82 0.36
Hierarchical Level
of Supervisor
Lower 65 3.31 0.74 3.37 0.76 3.70 0.81 3.25 0.68 3.83 0.80 3.24 0.88 3.71 0.91
Middle 157 3.27 0.77 3.41 0.95 3.58 0.86 3.35 0.79 3.97 0.83 3.11 0.86 3.69 0.98
Higher 103 3.55 0.75 3.62 0.86 3.52 0.81 3.86 0.85 3.85 0.81 3.23 0.80 3.65 0.95
MULTI-TRAIT-MULTI-METHOD LEADERSHIP 35
F (2, 322) 4.60* 2.18 0.93 17.11** 1.02 0.87 0.11
Type of
Organization
Profit 396 3.27 0.97 3.23 1.00 3.42 1.08 3.49 0.81 3.74 1.03 3.21 1.03 3.54 1.11
Non Profit 438 3.34 0.80 3.36 0.91 3.55 0.87 3.47 0.83 3.79 0.87 3.11 0.84 3.57 0.97
F (1, 832) 1.23 4.13* 3.53 0.04 0.55 2.32 0.19
Self Rating (N = 178)
Supervisor’s
gender
Female 48 3.70 0.64 3.76 0.53 4.12 0.53 3.55 0.75 4.22 0.57 3.67 0.59 4.04 0.58
Male 118 3.53 0.65 3.68 0.56 3.98 0.60 3.43 0.75 4.11 0.67 3.58 0.59 3.84 0.68
F (1, 164) 2.20 0.65 1.90 0.89 1.11 0.79 3.22
Hierarchical Level
of Supervisor
Lower 17 3.39 0.73 3.57 0.50 3.81 0.70 3.26 0.81 3.88 0.72 3.39 0.52 3.59 0.51
Middle 37 3.28 0.70 3.66 0.65 4.00 0.55 3.22 0.73 4.09 0.71 3.46 0.53 3.86 0.70
Higher 15 3.79 0.39 3.76 0.60 3.87 0.65 3.64 0.67 4.13 0.51 3.89 0.51 3.85 0.54
F (2, 66) 3.17* 0.38 0.65 1.86 0.70 4.45* 1.17
Type of Profit 98 3.63 0.66 3.77 0.53 4.00 0.61 3.59 0.76 4.16 0.66 3.63 0.62 3.91 0.69

MULTI-TRAIT-MULTI-METHOD LEADERSHIP 36
Organization
Non Profit 80 3.47 0.65 3.61 0.60 4.01 0.58 3.28 0.74 4.10 0.64 3.57 0.57 3.86 0.60
F (1, 176) 2.63 3.59 0.01 7.49* 0.37 0.37 0.24
Note. AV = Articulating a Vision; PAM = Providing an Appropriate Model; FAG = Fostering the Acceptance of Group Goals; HPE = High
Performance Expectations; IS = Individualized Support; ISN = Intellectual Stimulation; CR = Contingent Reward; * p < .05, ** p < .01.

MULTI-TRAIT-MULTI-METHOD LEADERSHIP 37
Figure 1. Outline of the principles underlying the CTCM analysis. For the sake of clarity, only three of the seven TLI subscales are included in
this Figure; AV = Articulating a Vision; PAM = Providing an Appropriate Model; FAG = Fostering the Acceptance of Group Goals.

MULTI-TRAIT-MULTI-METHOD LEADERSHIP 38
Appendix A
Norms for the German TLI
For the application of the TLI in practical contexts, norms are provided based on the
aggregated samples described above. To calculate the norms, raw scores of the seven scales
(i.e., means of the items or recoded items where necessary, see Heinitz & Rowold, 2007) were
transformed via their cumulative distribution function to T-scores with a mean of 50 and a
standard deviation of 10. For the TLI raw scores, maxima of .5-intervalls are assigned to T-
scores in Table A1.
To transform an individual raw score into a T-score, one should look for this raw score
or for the next highest score in the first column of Table A1. Thereafter, one should follow
this row to the right and read off the T-scores for the scales and rating perspectives needed.
For example, a raw score of 2.4 in a follower rating for Individualized Support becomes a T-
score of 37 (following the row of 2.5 as the next highest raw score to the IS-column in the left
part of the table), indicating a rather low rating. According to widely-used guidelines, the
range from one standard deviation below average (T = 40) and one standard deviation above
average (T = 60) is called “average”, including per definition 68% of the participants. By
transforming individual raw scores to T-scores, they can be compared to the results of the
norm sample. In this way, the results of supervisors’ self ratings and follower ratings can be
interpreted as low, average or high.
As significant differences of the scores could not be observed for the corresponding
subgroups (Table 7), these norms can be applied to female and male supervisors, leaders from
different hierarchical levels (lower, middle, higher) and different types of organizations (profit
and non-profit). As these differences had been found in other samples, users of the norms
should pay attention to possible group differences. Furthermore, due to the sampling

MULTI-TRAIT-MULTI-METHOD LEADERSHIP 39
procedure, the norms should be used with caution in contexts where leaders and followers do
not participate on a voluntary basis.

MULTI-TRAIT-MULTI-METHOD LEADERSHIP 40
Table A1
Norms (T-values with a mean of 50 and a standard deviation of 10) for the German TLI, Specifically for Rating Perspective (Follower Rating,
and Self Rating)
Follower Rating Self Rating
Raw
Score
AV PAM FAG HPE IS ISN CR AV PAM FAG HPE IS ISN CR
1.0 24 26 25 20 21 27 25
1.5 28 29 30 24 26 30 30
2.0 35 36 35 32 31 38 35 26 20 31 23 21
2.5 40 40 40 36 37 41 40 32 26 25 35 25 29 29
3.0 47 47 45 44 42 48 45 42 38 33 44 33 40 36
3.5 52 51 50 50 47 53 49 48 44 42 48 40 46 44
4.0 58 57 55 56 53 59 54 57 55 50 57 48 57 52
4.5 62 62 60 60 58 63 59 63 61 58 64 56 62 59
5.0 69 68 65 68 63 70 64 72 73 67 70 63 73 67
MULTI-TRAIT-MULTI-METHOD LEADERSHIP 41
Note. AV = Articulating a Vision; PAM = Providing an Appropriate Model; FAG = Fostering the Acceptance of Group Goals; HPE = High
Performance Expectations; IS = Individualized Support; ISN = Intellectual Stimulation; CR = Contingent Reward.